project brief: 2013-40 decision support for water...
TRANSCRIPT

Project Brief: 2013-40
Decision support for water management for integrating aquaculture in small-scale irrigation systems: A case for the Chingale catchment in Malawi

2
AuthorsKam, S.Pa, Cai, Xb, Sood, Ab, Hoanh, C.Tb, Yen, B.Tc, Nagoli, Ja, Chijere, Aa
Author AffiliationaWorldFish, bInternational Water Management Institute, cSoils and Fertilizers Research Institute, Vietnam.
This publication should be cited asKam, S.P., Cai, X., Sood, A., Hoanh, C.T., Yen, B.T., Nagoli, J., Chijere, A.(2013). Decision support for water management for integrating aquaculture in small-scale irrigation systems: a case for the Chingale catchment in Malawi. WorldFish, Penang, Malaysia. Project Brief: 2013-40.
AcknowledgmentsThis publication was written as part of the project “Enhancing adaptive capacity to climate change impacts through well-managed water use for aquaculture integrated with small-scale irrigation in the Chinyanja Triangle in Africa” with the financial support of the Federal Ministry for Economic Cooperation and Development, Germany. The project was coordinated by WorldFish and implemented in partnership with the International Water Management Institute and the University of Osnabrueck, with participation of national institutions including the Malawi Department of Fisheries, Lilongwe University of Agriculture and Natural Sciences, World Vision Mozambique and the Zambia Department of Fisheries.
Decision support for water management for integrating aquaculture in small-scale irrigation systems: A case for the Chingale catchment in Southern Region of Malawi
Project Brief: 2013-40
3
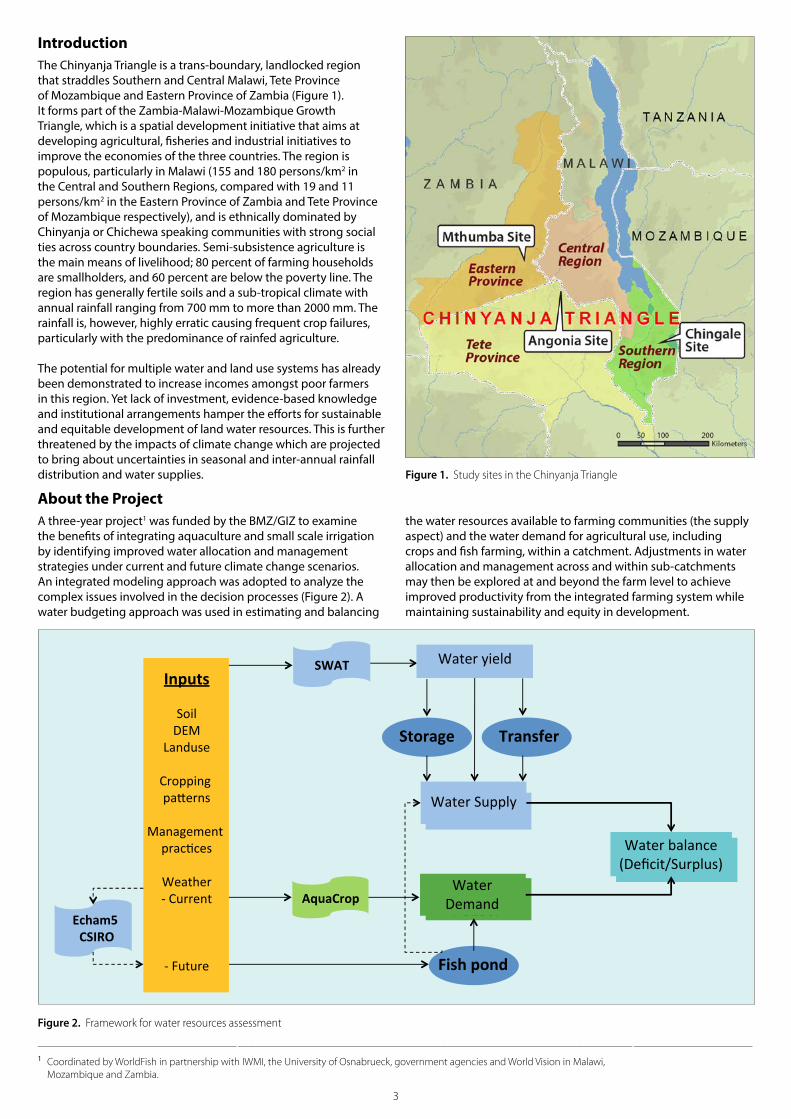
IntroductionThe Chinyanja Triangle is a trans-boundary, landlocked region that straddles Southern and Central Malawi, Tete Province of Mozambique and Eastern Province of Zambia (Figure 1). It forms part of the Zambia-Malawi-Mozambique Growth Triangle, which is a spatial development initiative that aims at developing agricultural, fisheries and industrial initiatives to improve the economies of the three countries. The region is populous, particularly in Malawi (155 and 180 persons/km2 in the Central and Southern Regions, compared with 19 and 11 persons/km2 in the Eastern Province of Zambia and Tete Province of Mozambique respectively), and is ethnically dominated by Chinyanja or Chichewa speaking communities with strong social ties across country boundaries. Semi-subsistence agriculture is the main means of livelihood; 80 percent of farming households are smallholders, and 60 percent are below the poverty line. The region has generally fertile soils and a sub-tropical climate with annual rainfall ranging from 700 mm to more than 2000 mm. The rainfall is, however, highly erratic causing frequent crop failures, particularly with the predominance of rainfed agriculture.
The potential for multiple water and land use systems has already been demonstrated to increase incomes amongst poor farmers in this region. Yet lack of investment, evidence-based knowledge and institutional arrangements hamper the efforts for sustainable and equitable development of land water resources. This is further threatened by the impacts of climate change which are projected to bring about uncertainties in seasonal and inter-annual rainfall distribution and water supplies. Figure 1. Study sites in the Chinyanja Triangle
About the ProjectA three-year project1 was funded by the BMZ/GIZ to examine the benefits of integrating aquaculture and small scale irrigation by identifying improved water allocation and management strategies under current and future climate change scenarios. An integrated modeling approach was adopted to analyze the complex issues involved in the decision processes (Figure 2). A water budgeting approach was used in estimating and balancing
the water resources available to farming communities (the supply aspect) and the water demand for agricultural use, including crops and fish farming, within a catchment. Adjustments in water allocation and management across and within sub-catchments may then be explored at and beyond the farm level to achieve improved productivity from the integrated farming system while maintaining sustainability and equity in development.
Figure 2. Framework for water resources assessment
_________________________________________________________ _________________________________________________________________________________________________________________ __________________________________
1 Coordinated by WorldFish in partnership with IWMI, the University of Osnabrueck, government agencies and World Vision in Malawi, Mozambique and Zambia.

4
The model platform builds on the hydrological model SWAT (Soil Water Assessment Tool) and links to crop productivity model AquaCrop and a fish pond water demand model. Water budgeting of fish ponds and storages are built into the water balance process to enable these management options and to assess the impacts of such options.
SWAT was used to estimate sub-catchment water yields for current and future weather conditions. Future climate data were generated by downscaling the ECHAM5 Global Climate Model (GCM) to regional scale, which was then bias corrected against local weather data. Crop water requirements and crop yields were estimated using the AquaCrop model. Likewise, the fish pond model was developed to simulate water depth regulation, including release of water for supplemental irrigation, and estimate fish yields.
Running these models required a variety of input data. A multi-disciplinary team conducted field surveys at three pilot sites – Chingale in the Southern Region of Malawi, Mthumba in Eastern Zambia and Angonia in Tete Province of Mozambique (Figure 1) - to document the farming systems and socio-economic situation of farming communities and their use and access to water resources, supplemented with GIS mapping of land-cover/land-use patterns.
Field monitoring of weather parameters and stream discharges, fish pond water balance and crop yields was complemented with historical records for model calibration and validation. Consultation sessions were conducted with farmers to elicit their responses regarding farming practices such as selecting crop types, adjusting crop calendars, and conjunctive use of pond water for fish and crops under conditions they identified as good, normal and bad years in terms of water availability for farming. These farmer decision rules were then fed into the model development process as likely management options that affect water demand and availability.
To have the various models work together to address practical questions about water use and management, the platform, together with its individual model components, was packaged in a decision support toolkit called the Catchment Water Allocation Tool, or CaWAT. This toolkit (Figure 3), which is Excel-based, has the following main features:
1. It computes the water balance between supply and demand at the sub-catchment level. Water supply is the result of the sub-catchment’s water yields (estimated by the SWAT) plus amounts of water stored within the sub-catchment and transferred into or out of the sub-catchment (arising from deliberate water management practices). Water demand is summed from water requirements of estimated areas of various crops grown and fish ponds operated within each sub-catchment. 2. It allows for user inputs relating to decisions on water allocation and management at the catchment level (including storing water within and transferring water across sub-catchments) as well as farm-level management of cropping patterns and water-saving farm practices that affect water demand within each sub-catchment. 3. It presents users with an interface for decision making and allows users to view impacts of such decisions on water balance and production outputs.
The above features enable CaWAT to be used for decisionsupport whereby the user can explore specific options of watermanagement and infer from the simulated results the implicationson water resources adequacy for the catchment. The outputs ofCaWAT, indicated in the cyan boxes in Figure 3, can be viewed inthe form of tables, graphs and maps.
Taking river flow measurements Active women participation in farmer consultation sessions

5
Figure 4. Sub-catchment boundaries, rivers and land use of the Chingale catchment in Southern Malawi
CHINGALE CATCHMENT : Land use, 2011
Land use1, Irrigated cropland
Irrigation schemes and clubs
3, Non-Irrigated cropland
4, Scrubland mosaic with crops
5, Dambo
6, Disturbed forest
7, Forest
9, Fish ponds
8, Riverine vegetation
Main road
River
Figure 3. Main user interface window of CaWAT
Case application: the Chingale catchment in southern MalawiOne of the project study sites is a small catchment in Zomba district of the Southern Region of Malawi. The area is locally referred to as Chingale. The target catchment of 260 km2 is drained by the Lisanjala river which originates from the hills of the Malosa Forest Reserve at the catchment’s eastern edge (Figure 4). The Chingale catchment is divided into 20 sub-catchments (SC, and numbered in Figure 4) that are used as the basic hydrological units to assess on-farm management practices as well as upstream-downstream effects of such practices. High resolution satellite images were used to map the land use of the catchment as well as streams, house roofs, storages, and other infrastructure. About two-thirds of the catchment is under agricultural use for cropping and livestock grazing. In 2010-11 an estimated 9,435 households farmed on 13,000 ha of cropland, of which 10 percent are irrigated, forming an irrigation belt running down the central part of the catchment (Figure 4). The most common water withdrawal method employed in Chingale is by abstraction and diversion of river water through canals and locally constructed aqueducts by gravity flow. Irrigation in the dimbas (cultivation in the low-lying depressions called dambos) uses groundwater lifted by pumping from wells dug into the shallow water table. Fish pond culture is increasingly popular in Chingale; 740 ponds were detected in the catchment from high-resolution satellite imagery, with a total surface area of 16 ha (Figure 4).
Field interviews revealed a general perception among farmers that water resources have declined since they were young or since they migrated into the area. The reasons attributed for this decline include increased use of irrigation water and deforestation that has affected water sources and overall availability. There are already 42 river diversions constructed mainly by local communities organized into farmers’ clubs with the support of non-governmental organizations, and a few government-initiated small irrigation schemes based on river damming and diversion. In some areas, conflicts emerge between fish farmers and irrigation farmers over water and also within farmers’ groups over irrigation water. Such conflicts are particularly common during the dry season months from September to December.

6
The catchment receives on average 960 mm of rain annually, ranging from 785 to 1210 mm in dry and wet years. Projections using the downscaled ECHAM5 GCM based on the CRES A2 scenario suggest decrease in annual rainfall in the dry years and amplification of inter-annual variations (Figure 5), particularly in the more distant future (2051-2080). Annual rainfall fluctuations, as well as seasonal shifts of the rainy season, directly affect rainfed farming and catchment water yield that can be used for irrigation. Increased uncertainty in water availability is likely to exacerbate the problems of water allocation and management.
Figure 5. Baseline and projected annual rainfall for Chingale station
The project’s research focused on attempting to answer the following questions in the case of the Chingale catchment:1. Are there, and will there be sufficient water resources within the catchment to support current and future agricultural needs and development? 2. What water management and allocation strategies are appropriate for equitable and sustained use of the water resources given the prevailing pattern of agricultural use?3. What is the potential role of fish ponds in increasing water productivity of farms?
We illustrate here the use of CaWAT to answer the above questions.
River diversion and conveyancing

7
Assessing water availability for the Chingale catchmentA set of scenarios were set up in CaWAT to assess current and future water availability situations. Wet, normal and dry years were identified for current baseline situation (1982-2010), near future (2020-2050) and distant future (2051-2080). The scenario for a normal year (1996-97) within the baseline period is used to show the outputs in this demonstration of the Chingale catchment analysis. Table 1, which summarizes the number of weeks in each month that a sub-catchment faces water deficit, shows that sub-catchments 1-7 in the northern part of the Chingale catchment (Figure 4) generally face water deficit during the dry season. The month of August is when the most number of sub-catchments face water deficit. Comparison with the near-future normal-year scenario (Table 2) suggests that more sub-catchments are likely to face water deficits given projected future climate conditions.
Table 1. Number of water-deficit weeks in a month, by sub-catchment, for a normal year (1996-97) within the baseline period (1982-2010)
Table 2. Number of water-deficit weeks in a month, by sub-catchment, for a normal year (2028-29) within the near future period (2020-2050)
Number of weeks with deficit water in the monthSub- catchment Oct Nov Dec Jan Feb Mar Apr May Jun Jul Aug Sep
1 2 - - - - - - - 3 3 4 42 2 - - - - - - - 3 4 4 43 2 - - - - - - - 3 - - 44 2 - - - - - - - 3 2 4 46 2 - - - - - - - 3 5 4 47 2 - - - - - - - 3 4 4 49 - - - - - - - - - - 2 -
10 - - - - - - - - - - 2 -12 - - - - - - - - - 1 2 -13 - - - - - - - - - -14 - - - - - - - - - - 2 -15 2 - - - - - - - 3 5 4 416 - - - - - - - - - - -18 - - - - - - - - - - 1 -22 - - - - - - - - 2 5 4 124 - - - - - - - - - - - -25 - - - - - - - - - - - -27 - - - - - - - - - - - -28 - - - - - - - - - - - -29 - - - - - - - - - - - -
Number of weeks with deficit water in the monthSub- catchment Oct Nov Dec Jan Feb Mar Apr May Jun Jul Aug Sep
1 - - - - - - - - 3 5 4 42 - - - - - - - - 3 5 4 43 - - - - - - - - 3 4 4 44 - - - - - - - - 3 5 4 46 - - - - - - - - 3 5 4 47 - - - - - - - - 3 5 4 49 - - - - - - - - - - 2 -
10 - - - - - - - - - - 2 -12 - - - - - - - - - - 2 -13 - - - - - - - - - - - -14 - - - - - - - - - - 2 -15 - - - - - - - - 3 5 4 416 - - - - - - - - - - 1 -18 - - - - - - - - - - 1 -22 - - - - - - - - - 5 4 124 - - - - - - - - - 5 4 -25 - - - - - - - - - - 2 -27 - - - - - - - - 1 - 2 128 - - - - - - - - - 2 -29 - - - - - - - - - 3 4 -
The use of CaWAT is further demonstrated here in exploring options for allocating and managing water within the Chingale catchment using the baseline, normal-year scenario. The mapped results for the four weeks of August (Figure 6) show that the sub-catchments in the northern part consistently face water deficits throughout the month, particularly SC6 and SC7 which experience the highest water deficits throughout the dry season. SC6 has the Mdele irrigation scheme that taps water from the Chagwa river and supports three villages. SC15 and SC22 further south, which also face prolonged water deficit, are short and have low water yields, not having the benefit of forest cover in their upper watersheds (Figure 4).

8
Exploring options for transferring water across sub-catchmentsA common practice in the Chingale catchment is diverting river water and transferring water across neighboring sub-catchments. However during the dry season, options for transferring water into the deficit sub-catchments are limited if surrounding sub-catchments are also in deficit. For example it can be seen from Figure 6 that SC7 and SC6 can only receive water from SC9, but the surpluses of SC9 are not sufficient to meet the deficits of its two neighbors for the entire duration of the dry season.
Exploring options for storing water within sub-catchments and its usesThe weekly water balance, graphed in Figure 7, shows healthy surpluses for SC 7 during the rainy season compared with SC6, hence raising the possibility of storing this surplus water within the sub-catchment for use during the dry season. This option was explored using CaWAT, and the results show that providing storage equivalent to 5 ha surface area to a depth of 3 m within SC7 would relieve the deficit in June and 2 weeks in July but not for the entire dry season.
Figure 7. Weekly water balance for sub-catchments 6 and 7 for a normal year (1996-97) within the baseline period (1982-2010)
Figure 6. Weekly water balance (‘000 m3) by sub-catchment for August, for a normal year (1996-97) within the baseline period (1982-2010)
-10 - 0< -10 0 -100 100 -200 >200

9
A simulation done in CaWAT suggests that increasing the area under irrigated maize in SC 9 by 50 ha from the current area of 75 ha and increasing fish pond area by 1 ha would gainfully use this surplus water. Table 3 shows the gains in production of maize and fish, and their corresponding values, arising from the increased use of the stored water.
As illustrated above, use of small storages such as fish ponds and tanks can greatly improve water availability during dry spells, which helps to improve overall productivity from crops and fish. There are however cautions to be noted. Significant amount of water is lost to the storages through evaporation, seepage and percolation. For a small pond of 100 m2 in surface area and 1.6 meter in depth, the observed annual losses amount to 2590 mm, amounting to 173% of its storage capacity. Extensive use of small storages also poses issues for downstream users, which could potentially cause conflicts when the streams run dry. CaWAT is able to estimate the potential of such storages while providing guidance on overall planning of water resources management at catchment level.
Instead, providing the same storage capacity in SC9 would result in ample wet-season storage for transferring water to its surrounding deficit sub-catchments. Figure 8 shows the improved water balance situation for week 34 (compared with the water balance map for the same week in Figure 6) after transferring water from SC9 to SC7 and SC6, and also from SC18 to SC15. Therefore provision for storage should target appropriate sub-catchments that can have adequate water accumulation for use during the dry season. The simulations using CaWAT can help identify such target sub-catchments. Even after transfers to its neigboring sub-catchments, there is still ample surplus remaining in SC9 that would be available for increased water use for food production over the dry season.
Figure 8. Weekly water balance (‘000 m3) for week 34 in August for a normal year (1996-97) within the baseline period (1982-2010), after creating storage in SC9 and transferring water from SC9 to SC7 and SC6, and from SC8 to SC15
-10 - 0
< -10
0 -100
100 -200
>200
Before After
Hybrid maize production, t 163.4 272.7
Local maize production, t 361.6 301.2
Total maize value, mill MWK 57.7 63.1
Fish production, t 8.7 14.1
Fish value, mill MWK 5.2 8.5
Table 3. Maize and fish production volumes and values in SC9, before and after addition of irrigated maize and fish pond areas.
Use of fish pond water for irrigation

10
ConclusionsA similar demonstration as the above was conducted for stakeholders from the three countries of the Chinyanja Triangle, representing relevant government agencies, NGOs, academia and donor agencies. It generated discussions about the implications on water resources management in the Chingale catchment, summarized below.1. Given the current low level of agricultural development, the water resources in the area are generally abundant but distribution in space and time is uneven. Erratic rainfall, along with other low inputs, hampers stable food production to sustain food security given the predominant rainfed subsistence farming system. 2. There is clearly need for a better coordinated water resources management and water infrastructure development to cope with climate variability. However institutional support and organizational arrangements are lacking and investment is scarce. Smart solutions are needed to tackle the lack of investment and human capacity. 3. Transferring water across sub-catchments to address deficits during the dry season is itself not a viable solution. This is presently already evident from accounts of farmers interviewed by the project. The situation will likely worsen under future climate conditions when water availability is expected to worsen, particularly in dry years.
4. Harvesting and storing surplus water during the rainy season within targeted sub-catchments can complement and feasibly augment transfer volumes to neighboring deficit sub-catchments during the dry season. Assessment of the water resources, as conducted by the project, provides a basis for selecting appropriate sub-catchments for implementing storage. Using CaWAT allows exploring of options for the use of the stored water.5. Small storages development is most feasible given the distributed nature of the surface water resources. Distributed storage is also locally-based and can be a start-up for local communities, particularly the women, to take ownership in managing their water resources. It provides flexibility to accommodate multiple uses and support integrated farming of crops, livestock and fish for increasing food security and nutrient intake, and diversifying sources of farm income.6. By providing supplemental water supply to crops during the dry season fish ponds enhance total farm productivity, which contributes to overall crop and fish production and value, for nominal demand imposed on the sub-catchment.
Multiple water sources and storages for multiple uses

11
Looking forwardThe Chingale example shows how simulations carried out using CaWAT can help identify appropriate water management options and strategically target sub-catchments for different user-defined interventions at the catchment and farm levels. There was considerable interest among stakeholders for applying CaWAT as a decision support toolkit to other catchments that face issues of water management for multiple uses including agriculture and aquaculture, under present and future climate conditions. Next steps identified include the following:a. Raising awareness about CaWAT and liaising with existing initiatives within the region that pertain to water resources management;
A gendered recognition of multiple water users and stakeholders
b. Capacity building of a motivated team among local institutions with the requisite diversity of skills and disciplinary knowledge for continued use and adaptation of the toolkit for application in other catchments;c. Refining the toolkit to take account of various other socio-economic, institutional and location-specific bio-physical conditions as well as meeting the requirements of communities and policy makers.
This project brief is a starting point in raising awareness about the development and use of CaWAT as a multi-model decision support toolkit that will be made available in the public domain and can be further developed for wider usage.

This publication should be cited as: Kam, S.P., Cai, X., Sood, A., Hoanh, C.T., Yen, B.T., Nagoli, J., Chijere, A. (2013). Decision support for water management for integrating aquaculture in small-scale irrigation systems: a case for the Chingale catchment in Malawi. WorldFish, Penang, Malaysia. Project Brief: 2013-40.
The CGIAR Research Program on Aquatic Agricultural Systems is a multi-year research initiative launched in July 2011. It is designed to pursue community-based approaches to agricultural research and development that target the poorest and most vulnerable rural households in aquatic agricultural systems. Led by WorldFish, a member of the CGIAR Consortium, the program is partnering with diverse organizations working at local, national and global levels to help achieve impacts at scale. For more information, visit aas.cgiar.org.
The CGIAR Research Program on Climate Change, Agriculture and Food Security (CCAFS) is a strategic partnership of the CGIAR and the EARTH System Science Partnership (ESSP). CCAFS brings together the world’s best researchers in agricultural science, development research, climate science and Earth System science, to identify and address the most important interactions, synergies and tradeoffs between climate change, agriculture and food security. The CGIAR Lead Center of the program is the International Center for Tropical Agriculture (CIAT) in Cali, Columbia. For more information, visit www.ccafs.cgiar.org.
Photo credits: Front and back cover, Xueliang Cai and Kam Suan Pheng Printed on 100% recycled paper.
© 2013. WorldFish. All rights reserved. This publication may be reproduced without the permission of, but with acknowledgement to, WorldFish.
Contact Details:WorldFish, PO Box 500 GPO,10670 Penang, MALAYSIAWeb: www.worldfishcenter.org