progressive fiscal policy for inclusive growthlibrary.fes.de/pdf-files/bueros/pakistan/11045.pdfdr....
TRANSCRIPT

Progressive Fiscal Policy for Inclusive GrowthBy: Dr. Hafiz A Pasha
November 2014
FISCAL POLICY IS ONE OF THE KEY ELEMENTS ON THE WAY TO ACHIEVE A
SOCIALLY JUST, SUSTAINABLE AND DYNAMIC GROWTH MODEL. IT RELATES TO
FUNDAMENTAL QUESTIONS DEFINING THE ROLE OF THE STATE IN PROMOTING
ECONOMIC DEVELOPMENT AND PROVIDING PUBLIC SERVICES TO ITS CITIZENS.
IN ORDER TO ADDRESS THE EXISTING SOCIAL AND ECONOMIC INEQUALITIES IN
PAKISTAN, PROGRESSIVE FISCAL POLICY REFORMS MUST FOCUS ON DIRECT
TAXATION OF LAND, PROPERTY AND INCOME. THE ALLOCATION OF PUBLIC
EXPENDITURE NEEDS TO PRIORITIZE SOCIAL PROTECTION PROGRAMS AS WELL AS
SOCIAL SERVICES LIKE EDUCATION AND HEALTH ON THE ONE HAND AND SET
INCENTIVES FOR ECONOMIC SECTORS WITH HIGH EMPLOYMENT POTENTIALS ON THE
OTHER.
BEYOND THE POLICY CHALLENGES, THIS STUDY ANALYZES THE POLITICAL ECONOMYOF FISCAL POLICY IN THE CURRENT CONTEXT OF PAKISTAN. GIVEN THE
PREVAILING POWER STRUCTURES, IT HIGHLIGHTS A NUMBER OF RECOMMENDATIONS
HOW TO IMPLEMENT A MORE PROGRESSIVE TAXATION POLICY. BASED ON
EXTENSIVE RESEARCH AND DISCUSSIONS, THE AUTHOR ALSO PROPOSES AN
ALTERNATIVE MEDIUM TERM BUDGET STRATEGY, BOTH
ON THE REVENUE AND EXPENDITURE SIDE.

Dr. HAFIZ A PASHA | PROGRESSIVE FISCAL POLICY FOR INCLUSIVE GROWTH
i
ACRONYMS
• ABS Annual Budget Statement
• ACGR Annual Compound Growth
• ADP Annual Development Program
• ADT Avoidance of Double Taxation
• AIT Agricultural Income Tax
• AJ&K Azad Jammu and Kashmir
• AOPs Association of Persons
• APTMA All Pakistan Textile Mills Association
• BISP Benazir Income Support Program
• BOR Board of Revenue
• CAD Current Account Deficit
• CCT Conditional Cash Transfer
• CIT Corporate Income Tax
• CPEC China-Pakistan Economic Corridor
• CPI Consumer Price Index
• CVT Capital Value Tax
• DDP Delivered Duty Paid
• DISCOs Power Distribution Companies
• EAD Economic Affairs Division
• EOBI Employees Old-Age Benefits Institution
• ERRA Earthquake Rehabilitation and Reconstruction Agency
• ESAF Extended Structural Adjustment Facility
• ESCAP Economic and Social Commission for Asia and the Pacific
• ESSI Employees Social Security Institution
• FATA Federally Administrated Tribal Areas
• FBR Federal Board of Revenue
• FCF Federal Consolidated Fund
• FDI Foreign Direct Investment
• FSI Food Security Index
• GARV Gross Annual Rental Value
• G-B Gilgit–Baltistan
• GENCO Government Power Generation Company
• GER Gross Enrolment Rate
• GIC Growth Incidence Curve
• GRP Gross Regional Product
• GST General Sales Tax
• HDI Human Development Index
• HEC Higher Education Commission
• HIES Household Integrated Economic Survey

Dr. HAFIZ A PASHA | PROGRESSIVE FISCAL POLICY FOR INCLUSIVE GROWTH
ii
• HSD High Speed Diesel
• IDPs Internally Displaced Persons
• IMF International Monetary Fund
• IPPs Independent Power Producers
• IPR Institute of Policy Reforms
• IRS Internal Revenue Service
• IT Information Technology
• ITO Income Tax Ordinance
• KESC Karachi Electric Supply Company
• K-PK Khyber Pakhtunkhwa
• LDO Light Diesel Oil
• LFPR Labor Force Participation Rate
• MDGs Millennium Development Goals
• MNA Member National Assembly
• MNCs Multinational Corporations
• MOF Minister of Finance
• MPA Member Provincial Assembly
• MTBS Medium-Term Budget Strategy
• MW Megawatts
• NADRA National Database & Registration Authority
• NATO North Atlantic Treaty Organization
• NER Net Enrolment Rate
• NFC National Finance Commission
• NHA National Highways Authority
• NICL National Insurance Company Ltd.
• NTDC National Transmission and Dispatch Company Limited
• NTN National Tax Number
• OMC Oil Marketing Company
• P & D Planning and Development
• PAEC Pakistan Atomic Energy Commission
• PASSCO Pakistan Agricultural Storage & Services Corporation Ltd
• PBS Pakistan Bureau of Statistics
• PDF Pakistan Development Fund
• PFCs Provincial finance commissions
• PIA Pakistan International Airlines
• PIBs Pakistan Investment Bonds
• PIT Presumptive Income Tax
• PM’s Prime Minister
• PML-N Pakistan Muslim League – Nawaz
• PNRA Pakistan Nuclear Regulatory Authority
• POL Pakistan Oilfields Limited
Dr. HAFIZ A PASHA | PROGRESSIVE FISCAL POLICY FOR INCLUSIVE GROWTH
iii
• PPAF Pakistan Poverty Alleviation Fund
• PPP Pakistan People’s Party
• PPRA Punjab Procurement Regulatory Authority
• PRA Punjab Revenue Authority
• PRAL Pakistan Revenue Automation (Pvt.) Ltd.
• PRSP Poverty Reduction Strategy Paper
• PSDP Public Sector Development Programme
• PSEs Public Sector Enterprises
• PSLM Pakistan Social and Living Standards Measurement Survey
• PSO Pakistan State Oil
• PWP Peoples Works Program
• SBP State Bank of Pakistan
• SECP Securities and Exchange Commission of Pakistan
• SMEs Small and Medium Enterprises
• SPDC Social Policy and Development Centre
• SRB Sindh Revenue Board
• SROs Statutory Regulations and Orders
• SUPARCO Pakistan Space and Upper Atmosphere Research Commission
• TCP Trading Corporation of Pakistan (Pvt.) Ltd
• TDS Tariff Differential Subsidy
• UIPT Urban Immovable Property Tax
• UNDP United Nations Development Programme
• USC Utility Stores Corporation
• VIPs Very Important Persons
• WAPDA Water and Power Development Authority
• WHT Withholding Tax
• WPPF Workers' Profit Participation Fund• WWF Worker’s Welfare Fund

Dr. HAFIZ A PASHA | PROGRESSIVE FISCAL POLICY FOR INCLUSIVE GROWTH
iv
CONTENTS
Page #
CHAPTER 1: INTRODUCTION .....................................................................................................1
1.1. Fundamental Rights in the Constitution............................................1
1.2. Key Elements of Fiscal Policy ..................................................... 4
CHAPTER 2: DEFICITS IN INCLUSIVE GROWTH............................................................................6
2.1. Inequality in Wealth................................................................... 6
2.1.1. Land Distribution .............................................................. 6
2.1.2. Distribution of Property ...................................................... 7
2.1.3. Financial Assets .............................................................. 7
2.2. Inequality in Income .................................................................. 8
2.3. Regional Disparities ................................................................... 9
2.4. Employment Trends .................................................................. 11
2.5. Food Security ......................................................................... 12
2.6. Incidence of Poverty................................................................. 14
2.7. Human Development ................................................................. 15
2.8. Key Elements of Progressive Fiscal Policy ..................................... 18
CHAPTER 3: POLITICAL ECONOMY OF FISCAL POLICY ..............................................................19
3.1. Centralization of Power ............................................................. 19
3.2. Vested Interests / ‘Sacred Cows’ ............................................... 21
3.3. Beneficiaries of Subsidies ..........................................................25
3.4. Choice of Projects / Programs...................................................27
3.5. Role of the Legislature .............................................................28
3.6. Role of the Judiciary................................................................29
CHAPTER 4: THE TAXATION SYSTEM OF PAKISTAN ..................................................................31
4.1. Tax-to-GDP Ratio...................................................................32
4.2. International Comparisons ...........................................................34
4.3. Sectoral Distribution ..................................................................35

Dr. HAFIZ A PASHA | PROGRESSIVE FISCAL POLICY FOR INCLUSIVE GROWTH
v
4.4. Incidence of Taxes ..................................................................36
4.5. Tax Expenditure ......................................................................38
4.6 Tax Evasion........................................................................... 41
CHAPTER 5: PROGRESSIVE TAX POLICY .................................................................................42
5.1. Federal Income Tax .................................................................42
5.1.1. Elimination of Tax Expenditures ..........................................42
5.1.2. Move from Scheduler to Comprehensive Income Taxation .........43
5.1.3. Development of Capital Gains Tax......................................43
5.1.4. Rationalization of Tax Rates and Schedules ..........................44
5.1.5. Reduction in Regressive Withholding Taxes ...........................44
5.1.6. Measures to Reduce Tax Evasion ......................................45
5.2. Provincial Direct Taxes..............................................................46
5.2.1. Agricultural Income Tax ....................................................46
5.2.2. Urban Immoveable Property Tax ........................................47
5.3. Indirect Taxes.........................................................................48
5.3.1. Customs Duties ..............................................................48
5.3.2. General Sales Tax .........................................................50
5.3.3. Provincial Sales Tax on Services .......................................52
5.3.4. The Petroleum Levy........................................................52
CHAPTER 6: MANAGING CURRENT EXPENDITURE.....................................................................55
6.1. Trends in Current Expenditure.....................................................55
6.2. Cost of Debt Servicing .............................................................56
6.3. Security-Related Expenditures .....................................................58
6.4. Expenditure on Social Services ...................................................60
6.5 Subsidies...............................................................................62
6.6. Grants ..................................................................................63
6.7. Costs of Administration..............................................................65

Dr. HAFIZ A PASHA | PROGRESSIVE FISCAL POLICY FOR INCLUSIVE GROWTH
vi
CHAPTER 7: MANAGING DEVELOPMENT SPENDING...................................................................68
7.1. Size of PSDP / ADPs.............................................................68
7.2. Sectoral Distribution ..................................................................69
7.2.1. Federal ........................................................................69
7.2.2. Provincial .....................................................................72
7.3. Portfolio of Projects..................................................................74
7.4. Other Development Expenditure ................................................... 81
CHAPTER 8: SOCIAL PROTECTION PROGRAMS.........................................................................82
8.1. Evaluation Criteria ....................................................................82
8.2. The Social Protection Programs...................................................83
8.3. Evaluation of Programs ............................................................. 91
8.4 Proposals...............................................................................92
CHAPTER 9: MEDIUM-TERM BUDGET STRATEGY .....................................................................94
9.1. The Government’s MTBS...........................................................94
9.2. The Alternative MTBS...............................................................96
ANNEXURE 1 .................................................................................................................. 100
BIBLIOGRAPHY .................................................................................................................. 103
Dr. HAFIZ A PASHA | PROGRESSIVE FISCAL POLICY FOR INCLUSIVE GROWTH
vii
LIST OF BOXES, CHARTS AND TABLES,
Page #
Box 4.1: Sectoral Incidence of Taxes ..........................................................35
Box 8.1: Employees Old Age Benefits Institution.............................................88
Box 8.2: Worker’s Welfare Fund.................................................................89
Box 8.3: Benazir Income Support Program ....................................................89
Chart 1.1: Components of Fiscal Policy ........................................................... 5
Chart 3.1: Types of Benefits Pre-empted by Various Groups in Pakistan ...............23
Chart 2: Evaluation Programs ....................................................................93
Table 2.1: Ownership of Agricultural Land, 2010 ............................................... 6
Table 2.2: Distribution of Property Income by Quintile, 2011-12 ............................ 7
Table 2.3: Gini Coefficient of Income Distribution ............................................... 8
Table 2.4: Annual Growth Rate of Real Household Income by Quintiles,
2001-02 to 2011-12.................................................................... 9
Table 2.5: GRP, population and per capita GRP by Province, 2012-13 ................. 9
Table 2.6: Growth Rate of GRP by Province, 1999-200 to 2012-13 ................... 10
Table 2.7: Labor Force Participation Rate and Unemployment Rate by
Gender and Youth, 2001-02 to 2012-13 ........................................ 12
Table 2.8: The Food Security Index .............................................................. 13
Table 2.9: Incidence of Poverty Urban and Rural ............................................. 14
Table 2.10: HDI of Pakistan ......................................................................... 15
Table 2.11 Regional Disparities in Social and Economic Indicators - 2012-13 ......... 16
Table 2.12 Indicators of Gender Inequality - 2012-13........................................ 17
Table 3.1: Share of Different Levels of Government ..........................................20
Table 4.1: Tax-to-GDP ratio of Pakistan, 2000/01–2012/13 ..............................32
Table 4.2: Share of Revenues from Different Taxes ..........................................33
Table 4.3: Comparison of the tax-to-GDP ratio and the taxation
Structure in selected countries........................................................34
Dr. HAFIZ A PASHA | PROGRESSIVE FISCAL POLICY FOR INCLUSIVE GROWTH
viii
Table 4.4: National Sectoral Tax Incidence, 2011-12 .........................................36
Table 4.5: Incidence of Taxes in Pakistan, 2007-08 ........................................37
Table 4.6: Estimate of Tax Expenditure According to World Bank and Pakistan
Economic Survey 2011-12 – Summary.............................................38
Table 4.7: Estimated Federal and Provincial Tax Expenditures..............................39
Table 4.8: Estimated Tax Expenditure in Income Tax.........................................40
Table 5.1: Tax Expenditure on Import Duty SROs by Industry, 2013-14 ................49
Table 5.2: Tax Expenditure on SROs in Import Sales Tax, 2013-14 .................... 51
Table 5.3: Revenue Impact of Progressive Taxation Proposals..............................54
Table 6.1: Trends in Current Expenditure, 2008-09 to 2013-14..........................55
Table 6.2: Cost of Debt Servicing, 2008-09 to 2013-14 ..................................57
Table 6.3: National Security-Related Expenditure by the Federal and Provincial
Governments...............................................................................58
Table 6.4: Public Expenditure on Social Services - 2008-09 to 2012-13 .............60
Table 6.5: Expenditure Priorities within Education - 2012-13............................... 61
Table 6.6: Expenditure Priorities within Health - 2012-13................................... 61
Table 6.7: Breakup of Subsidies by Federal Government ....................................62
Table 6.8: Grants by Federal Government- 2012-13 to - 2013-14 .....................64
Table 6.9: Costs of Civil Administration of the Federal Government.......................65
Table 7.1: Level and Distribution of Development Spending .................................68
Table 7.2: Cutbacks in the PSDPs................................................................69
Table 7.3: Sectoral Distribution of the PSDP of the Federal Government ................70
Table 7.4: Sectoral Priorities in Provincial ADPs - 2014-15................................73
Table 7.5: Throw forward of Federal on-going Projects and Cost of New Projects ...76
Table 7.6: New Mega Projects .....................................................................80
Table 7.7: Breakup of Other Development Expenditure by the Federal Government ... 81
Table 8.1: Outlays on Different Social Protection Programs in Pakistan ..................85
Table 9.1: Medium-Term Budgetary Strategy of the GOP ...................................94
Table 9.2: Alternative Medium-Term Budget Strategy - 2014-15 to - 2015-16 ......96
Table 9.3: Projected Level of Public Debt .......................................................99

Dr. HAFIZ A PASHA | PROGRESSIVE FISCAL POLICY FOR INCLUSIVE GROWTH
ix
FOREWORD
The “Economy of Tomorrow” and the importance of Fiscal Policy
In 2013, the “Economy of Tomorrow” (EoT) project was established by the FES Pakistanoffice. In times of an instable economic environment both domestically as well asinternationally, FES set up a platform for debating economic policy challenges. The aim ofthis new working line is not only to analyze the past performance and to properlyunderstand the current situation, but also to develop proposals for achieving a moreinclusive economic growth model. In the context of the predominant neoclassical paradigm,the project started on the conviction that an alternative narrative is needed in order toform new alliances including a wide range of different stakeholders. Beyond the importantacademic basis and the relevant policy debates, the “EoT” project also seeks to connecteconomic thinking to a broader normative vision which is lacking in common perceptionsabout the economy: the “Good Society” with full capabilities for all.
After creating the basic understanding of economic policy challenges for Pakistan in the“EoT country study” in early 2014, we decided to focus on a number of core policyareas for developing a progressive reform agenda. A crucial factor for economic policymaking is the relationship between the state and its different entities and the privatesectors, as well as the way in which the workers, and more broadly, consumers andcitizens of a country are dealt with. Fiscal Policy can be a key instrument to address theexisting social and economic inequalities if taxation and allocation of public expenses followthe right priorities. This study wants to contribute to a healthy public debate about settingthe right priorities and about finding a consensus on the way towards a more socially just,sustainable and green dynamic growth model for Pakistan.
Philipp KauppertResident DirectorFES PakistanIslamabad, November 2014

Dr. HAFIZ A PASHA | PROGRESSIVE FISCAL POLICY FOR INCLUSIVE GROWTH
1
Chapter 1:
INTRODUCTION
Progressive fiscal policy is based on the fundamental premise that the objective is to
achieve inclusive growth. This is growth which is not accompanied by increasing inequality
and benefits all segments of the population.
1.1 Fundamental Rights in the Constitution
The Constitution of the Islamic Republic of Pakistan, inclusive of all amendments, explicitlyhighlights the fundamental rights of citizens in Articles 1 to 45, as follows:
Article
9 Security of Person
No person shall be deprived of life or liberty saves in accordance with thelaw.
11 Slavery, forced labour, etc. prohibited
(3) No child below the age of fourteen shall be engaged in any factory or
mine or any other hazardous employment.
15 Freedom of Movement
Every citizen shall have the right to remain in, and, subject to any
reasonable restriction imposed by law in the public interest, enter and move
freely throughout Pakistan and to reside and settle in any part thereof.
18 Freedom of Trade, business or profession
19A Right to Information
Every citizen shall have the right to have access to information in allmatters of public importance subject to regulations and restrictions imposedby law.
23 Provision as to Property
Every citizen will have the right to acquire, hold and dispose of property inany part of Pakistan, subject to the Constitution and any reasonable

Dr. HAFIZ A PASHA | PROGRESSIVE FISCAL POLICY FOR INCLUSIVE GROWTH
2
restrictions imposed by law in the public interest.
*of significance from the viewpoint of inclusive growth.
Article
24 Protection of Property Rights
25 Equality of Citizens
(1) All citizens are equal before law and are entitled to equalprotection of law.
(2) There shall be no discrimination on the basis of sex.
(3) Nothing in this article shall prevent the State from making anyspecial protection for the protection of women and children.
25A Right to education
The State shall provide free and compulsory education to all children of theage of five to sixteen years in such manner as may be determined by law.
27 Safeguard against discrimination in services*
(1) No citizen otherwise qualified for appointment in the service ofPakistan shall be discriminated against in respect of any suchappointment on the ground only of race, religion, caste sex,residence or place of birth.
Adherence to the above articles will clearly result in inclusive growth. Progressive fiscalpolicy must be consistent with these articles.
32 Promotion of local Government institutions.
The State shall encourage local Government institutions composed of elected
representatives of the areas concerned and in such institutions special representation
will be given to peasants, workers and women.
33 Parochial and other similar prejudices to be discouraged.
The State shall discourage parochial, racial, tribal, sectarian and provincial prejudices
among the citizens.

Dr. HAFIZ A PASHA | PROGRESSIVE FISCAL POLICY FOR INCLUSIVE GROWTH
3
34 Full participation of women in national life.
Steps shall be taken to ensure full participation of women in all spheres of national
life.
35 Protection of family, etc.
The State shall protect the marriage, the family, the mother and the child.
34 Protection of minorities.
The State shall safeguard the legitimate rights and interests of minorities, including
their due representation in the Federal and Provincial services.
37 Promotion of social justice and eradication of social evils.
The State shall:
(a) promote, with special care, the educational and economic interests of backward
classes or areas;
(b) remove illiteracy and provide free and compulsory secondary education within
minimum possible period;
(c) make technical and professional education generally available and higher
education equally accessible to all on the basis of merit;
(d) ensure inexpensive and expeditious justice;
(e) make provision for securing just and humane conditions of work, ensuring that
children and women are not employed in vocations unsuited to their age or
sex, and for maternity benefits for women in employment;
(f)enable the people of different areas, through education, training, agricultural and
industrial development and other methods, to participate fully in all forms of
national activities, including employment in the service of Pakistan;
38 Promotion of social and economic well-being of the people.
The State shall:
(a) secure the well-being of the people, irrespective of sex, caste, creed or race,
by raising their standard of living, by preventing the concentration of wealth and

Dr. HAFIZ A PASHA | PROGRESSIVE FISCAL POLICY FOR INCLUSIVE GROWTH
4
means of production and distribution in the hands of a few to the detriment of
general interest and by ensuring equitable adjustment of rights between
employers and employees, and landlords and tenants;
(b) provide for all citizens, within the available resources of the country, facilities for
work and adequate livelihood with reasonable rest and leisure;
(c) provide for all persons employed in the service of Pakistan or otherwise, social
security by compulsory social insurance or other means;
(d) provide basic necessities of life, such as food, clothing. housing, education and
medical relief, for all such citizens, irrespective of sex, caste, creed or race, as
are permanently or temporarily unable to earn their livelihood on account of
infirmity, sickness or unemployment;
(e) reduce disparity in the income and earnings of individuals, including persons in
the various classes of the service of Pakistan; 41[] 41
(f)eliminate riba as early as possible
(g) the shares of the Provinces in all federal services, including autonomous bodies
and corporations established by, or under the control of, the Federal
Government, shall be secured and any omission in the allocation of the shares
of the Provinces in the past shall be rectified.
1.2. Key Elements of Fiscal Policy
As highlighted in Chart 1.1, Fiscal Policy includes both Federal and Provincial Governments.Local Governments will also fall in the domain of fiscal policy once they are constitutedafter elections.
The areas of fiscal policy include, first, mobilization of resources, both tax and non-tax.Second, allocations of both current and development expenditure are an important part offiscal policy. Third, transfers from the Federal to the Provincial Governments are decidedupon by the National Finance Commission (NFC), a statutory body. Fourth, how theresulting deficit is to be financed also falls within the ambit of fiscal policy.

Dr. HAFIZ A PASHA | PROGRESSIVE FISCAL POLICY FOR INCLUSIVE GROWTH
5
Char
t 1.1
Com
pone
nts
of F
isca
l Pol
icy

Dr. HAFIZ A PASHA | PROGRESSIVE FISCAL POLICY FOR INCLUSIVE GROWTH
6
Chapter 2:
DEFICITS IN INCLUSIVE GROWTH
The failure or success of past fiscal policy can be judged by determining the existingdeficits in inclusive growth. This will also highlight the magnitude of challenge forprogressive fiscal policy, once it is adopted.
2.1. Inequality in Wealth
The primary manifestation of inequality is in the ownership of agricultural land, property andfinancial assets.
2.1.1. Land Distribution
Feudalism still exists in Pakistan. Large landlords account for a significant part of theownership of the available agricultural land, as shown in Table 2.1.
Table 2.1
Ownership of Agricultural Land, 2010
Farm Size
(Areas)
Percentage of
Farms
Percentage of
Farm Area
Under 1.0 15.2 1.0
1.0 to 2.5 28.3 6.9
2.5 to 5.0 21.2 11.4
5.0 to 7.5 13.7 12.3
7.5 to 12.5 11.1 16.5
12.5 to 25.0 6.8 17.7
25.0 to 50.0 2.5 12.7
50.0 to 100.0 0.8 7.8
100.0 to 150.0 0.2 2.6
150.0 and above 0.2 11.6
TOTAL 100.0 100.0
Source: Agricultural Census, 2010

Dr. HAFIZ A PASHA | PROGRESSIVE FISCAL POLICY FOR INCLUSIVE GROWTH
7
The distribution of agricultural land is highly unequal. Small farmers, with less than 5acres, constitute as much as 65 percent of the farming population, but own only 19percent of the farm area. At the upper end, there are about 26,000 farmers only (0.4percent of the total) who own as much as 14 percent of the land.
The Gini coefficient of agricultural land distribution in Pakistan is very high at about 0.60.it is larger than in other South Asian countries. Also, it has shown little tendency todecline over time.
Large landlords have preferential access to irrigation water. They are mostly the owners oftractors, tube wells and other agricultural equipment. They also wield enormous politicalpower. The majority of MNAs/MPAs are large landowners, especially in the provinces ofPunjab and Sindh.
2.1.2. Distribution of Property
The Household Integrated Economic Survey (HIES) gives data for different quintiles onincome (rental or imputed) from property. The distribution is given in Table 2.2.
Table 2.2Distribution of Property Income by Quintile, 2011-12
QuintilePercentage ofTotal Income
Percentage ofProperty Income
1 11.2 6.6
2 14.2 10.2
3 16.8 13.1
4 20.7 18.3
5 37.0 51.8
TOTAL 100.0 100.0
Source: HIES
As expected, income from property is more unevenly distributed than total income. The top20 percent of population accounts for almost 52 percent of property income.
2.1.3. Financial Assets
Wealth in the form of financial assets is also characterized by a very skewed distribution.In the banking system, the top 1 percent of depositors account for 80 percent of thedeposits according to the SBP. Similarly, banks extend 77 percent of the credit to the top1 percent of borrowers.

Dr. HAFIZ A PASHA | PROGRESSIVE FISCAL POLICY FOR INCLUSIVE GROWTH
8
Turning to the ownership of shares/securities, it is estimated that there are less than onemillion shareholders of publicly quoted companies. The market capitalization of $70 billionis part of the wealth of these one million individuals. Ownership of individual companies ishighly concentrated. Family ownership of companies is still the dominant form of corporateownership in the country.
2.2. Inequality in Income
Pakistan is characterized by moderate levels of inequality in income. But this is notnecessarily a reflection of the ground reality. It is due to massive underreporting ofincome. The HIES, from which Gini coefficients of income distribution are derived, capturesonly half the total household income in the country. Much of the underreporting is in theupper most quintile, because of fear of detection of tax evasion.
The reported Gini coefficients are presented in Table 2.3. They reveal little change inincome inequality in the country.
Rural inequality is somewhat lower than urban inequality. The former has decline somewhatwhile the latter has increased marginally since 2001-02.
Table 2.3
Gini Coefficient of Income Distribution
Gini Coefficient 2001-02 2004-05 2010-11
Rural 0.34 0.35 0.37
Urban 0.44 0.43 0.41
TOTAL 0.41 0.41 0.41
Source: SPDC (2012)
However, the Gini Coefficient is generally considered as a not sensitive indicator ofchanges in income distribution. A better and more direct indicator of the extent of inclusivegrowth is the Growth Incidence Curve (GIC). The GIC for urban, rural and total incomeis given in Chart I. Estimates of real household income growth rate in different quintilesbetween 2001-02 and 2011-12 are presented in Table 2.4.
Dr. HAFIZ A PASHA | PROGRESSIVE FISCAL POLICY FOR INCLUSIVE GROWTH
9
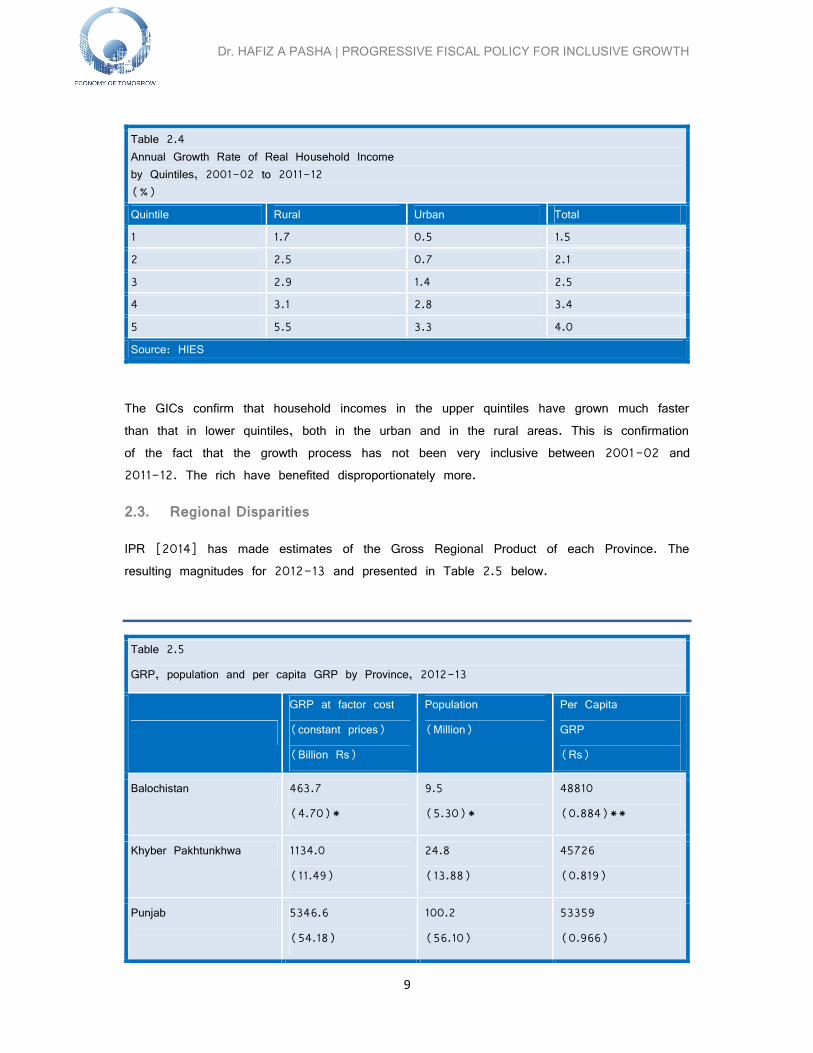
Table 2.4Annual Growth Rate of Real Household Incomeby Quintiles, 2001-02 to 2011-12(%)
Quintile Rural Urban Total
1 1.7 0.5 1.5
2 2.5 0.7 2.1
3 2.9 1.4 2.5
4 3.1 2.8 3.4
5 5.5 3.3 4.0
Source: HIES
The GICs confirm that household incomes in the upper quintiles have grown much fasterthan that in lower quintiles, both in the urban and in the rural areas. This is confirmationof the fact that the growth process has not been very inclusive between 2001-02 and2011-12. The rich have benefited disproportionately more.
2.3. Regional Disparities
IPR [2014] has made estimates of the Gross Regional Product of each Province. Theresulting magnitudes for 2012-13 and presented in Table 2.5 below.
Table 2.5
GRP, population and per capita GRP by Province, 2012-13
GRP at factor cost
(constant prices)
(Billion Rs)
Population
(Million)
Per Capita
GRP
(Rs)
Balochistan 463.7
(4.70)*
9.5
(5.30)*
48810
(0.884)**
Khyber Pakhtunkhwa 1134.0
(11.49)
24.8
(13.88)
45726
(0.819)
Punjab 5346.6
(54.18)
100.2
(56.10)
53359
(0.966)

Dr. HAFIZ A PASHA | PROGRESSIVE FISCAL POLICY FOR INCLUSIVE GROWTH
10
Sindh 2923.4
(29.63)
44.1
(24.69)
66290
(1.200)
Pakistan 9867.7 184.3 55250
*Share | **Ratio to national average
Source: IPR (2014)
The ranking of the four Provinces is Sindh, followed by Punjab, Balochistan and K-PK.The last Province does better in terms of Gross Regional Income, due to the relativelylarge inflow of home remittances on a per capita basis.
Is the present position of the Provinces a consequence of increasing or decreasing regionalincome equality? The answer is given in Table 2.6.
Table 2.6Growth Rate of GRP by Province1999-2000 to 2012-13ACGR (%)
1999-2000to2007-08
2007-08to2012-13
1999-2000to2012-13
Balochistan 3.1 1.9 2.6
Khyber Pakhtunkhwa 5.5 5.1 5.3
Punjab 4.8 3.4 4.2
Sindh 6.2 2.1 4.6
Pakistan 5.2 2.9 3.9
Source: IPR (2014)
For the period, 1990-2000 to 2012-13, the results are very counter-intuitive. Terrorismhas affected K-PK the most, yet it has the highest growth rate. Why? The servicessector of the province, mostly the informal economy, has done well. Growth rates oftransport and communications at 5.8 percent, wholesale and retail trade at 5 percent,ownership of dwellings at 6.5 percent and social and community services at 7 percent, areall relatively high. They reflect the impact of NATO supply movement, illicit trade withAfghanistan and inflow of remittances.
The province which has really fallen behind is Balochistan, with a GRP growth rate of only2.6 percent. The insurgency in the province is one of the main factors, although the 2010

Dr. HAFIZ A PASHA | PROGRESSIVE FISCAL POLICY FOR INCLUSIVE GROWTH
11
NFC Award gave a very favorable award to the Province. It appears that in Balochistanthere has been little increase in real per capita income over the thirteen year period.
The province of Sindh showed exceptional dynamism in the Musharraf period, with growthin excess of 6 percent. This was due primarily to the buoyancy of the industrial sector inthese years. Since 2007-08 however, the economy of Sindh has been plagued by seriouslaw and order problems (including target killings) and the growth rate has plummeted toonly 2 percent.
Punjab has shown less deviation from the national growth rate, being the largest regionaleconomy. In the first period it showed less growth, but has caught up in the secondperiod.
Overall, there is evidence that regional inequality increased in the Musharraf period, aperiod of relatively fast growth. In the last five years, there has been some improvementin regional inequality.
2.4. Employment Trends
Given the favorable age distribution (‘the demographic dividend’) the labor force ofPakistan has been expanding at over 3 percent per annum. From 2001-02 to 2007-08,a period of relatively high economic growth, the overall Labor Force Participation Rate(LFPR) declined, because of higher enrolment of youth in the education system. Theunemployment rate fell significantly from over 8 percent to almost 5 percent.
The significant development is the big increase in LFPR of females. A positiveinterpretation is that the social barriers, employment of women, especially the education,are gradually breaking down. However, an alternative explanation, especially for the latterperiod, is that high inflation and rise in the cost of living are forcing women to seekemployment, even in residual jobs, to supplement family incomes.
Between 2007-08 and 2012-13, conditions in the labor market have visibly deteriorated.Unemployment rates of youth and females are approaching double-digits. Bulk of the jobs,outside agriculture, has been found in the informal sector, where ‘decent work’ is generallynot available. The incidence of underemployment has also increased.
During 2013-14, it is estimated that 1.8 million persons entered the labor force. 1.2million found some kind of a job. 600,000 new workers are unemployed. Consequently,the overall unemployment rate has increased from 6.2 percent to 7 percent.

Dr. HAFIZ A PASHA | PROGRESSIVE FISCAL POLICY FOR INCLUSIVE GROWTH
12
Table 2.7
Labor Force Participation Rate and Unemployment Rate by
Gender and Youth, 2001-02 to 2012-13
(%)
2001-02 2007-08 2012-13
Total
LFPR* 43.3 45.2 45.7
Unemployment Rate 8.3 5.2 6.2
Male
LFPR* 70.3 69.5 68.9
Unemployment Rate 6.7 4.3 5.4
Female
LFPR* 14.4 19.6 21.5
Unemployment Rate 16.5 8.5 9.0
Youth (15-29 years)
LFPR* 37-54 37-54 36.58
Unemployment Rate 6-16 3-8 6-11
*Above ten years
Source: Labor Force Survey, PBS.
2.5. Food Security
A modicum of food security is essential to prevent the increase in malnutrition and poverty.
This is one area in which Pakistan has done poorly since 1999-2000.
According to the FAO, the definition of food security is as follows:
‘Food security exists when all people, at all times, have physical and economic
access to sufficient, safe and nutritious food to meet their dietary needs and
food preferences for an active and healthy life’.

Dr. HAFIZ A PASHA | PROGRESSIVE FISCAL POLICY FOR INCLUSIVE GROWTH
13
A Food Security Index (FSI) constructed for this study reveals that the Index has been
consistently declining, as shown in Table 2.8. All four components of FSI are falling. The
most significant decline is in the affordability index, as food prices have generally risen
faster than the overall Consumer Price Index (CPI). Also, what is not so well known is
that food production per capita has fallen by almost 15 percent since 1999-2000. This is
a reflection of the policy neglect of agriculture, especially in the Musharraf period, along
with the impact of draughts and floods.
Table 2.8The Food Security Index(1999-2000 =100)(%)
Year
FoodAvailabilityPer Capita*Index
FoodProductionPer CapitaIndex
FoodPrices(Relative)Index
Self-SufficiencyIndex
FoodSecurityIndex(FSI)
W 0.40 0.25 0.25 0.10
1999-2000 100.00 100.00 100.00 100.00 100.00
2000-01 99.68 90.36 100.80 97.15
2001-02 89.94 83.78 101.81 78.57
2002-03 85.93 86.33 102.13 82.89
2003-04 85.93 86.33 102.13 82.89
2004-05 83.65 92.50 98.87 81.20
2005-06 89.25 91.42 98.72 83.45
2006-07 90.83 93.57 96.45 87.46
2007-08 88.47 91.70 92.64 82.76 89.75
2008-09 89.01 98.38 90.44 82.80
2009-10 88.64 89.00 89.95 85.30
2010-11 88.83 89.74 8.78 84.06
2011-12 89.20 84.67 82.41 83.64

Dr. HAFIZ A PASHA | PROGRESSIVE FISCAL POLICY FOR INCLUSIVE GROWTH
14
2012-13 89.93 85.34 82.81 84.93
2013-14P 89.93 85.30 82.65 84.07 86.36
P = ProjectedSource: Estimated by Author from PES, PBS
2.6. Incidence of Poverty
As described above, the rising inequality in wealth and incomes; growing regional
disparities; worsening labor market conditions and greater food security, all imply that
poverty has been increasing in Pakistan.
Unfortunately, incidence of poverty has become a hotly disputed number. No official
estimates exist after 2004-05. However, credible estimates have been made by SPDC
(2012) from the HIES data base. These estimates are given in Table 2.9.
Table 2.9Incidence of Poverty, Urban and Rural(% of Population)
Urban Rural Total
2004-05 2010-11 2004-05 2010-11 2004-05 2010-11
Punjab 27.24 31.35(4.11)*
27.89 37.12(9.23)
27.69 35.30(7.61)
Sindh 24.32 30.75(6.43)
29.93 45.34(15.41)
27.18 38.30(11.12)
K-PK 41.41 48.31(6.90)
34.31 39.58(5.27)
35.41 41.06(5.65)
Balochistan 47.62 51.09(3.47)
54.38 43.40(-10.98)
53.11 45.24(-7.87)
Total 27.68 33.11(5.43)
30.74 39.42(8.68)
29.76 37.33(7.57)
*Annual Growth RateSource: SPDC (2012)

Dr. HAFIZ A PASHA | PROGRESSIVE FISCAL POLICY FOR INCLUSIVE GROWTH
15
The results are very striking. The incidence of poverty nationally has increased about 30
percent in 2004-05 to over 37 percent in 2010-11. In effect, 3 million people have been
falling below the poverty line every year, especially after 2007-08. This is a large number
and indicates how dire the situation is.
Rural poverty has increased faster than urban poverty. Not only has agriculture done
poorly, but the non-farm rural economy is small and stagnant in most parts of the
country.
The incidence of poverty is the highest in Balochistan, at over half the population. This
implies that the roots of insurgency in the Province can be found in economic
backwardness. A surprising finding is that the fastest growth in the incidence of poverty is
in Sindh. This is a reflection of the highest level of intra-regional inequality in the
Province.
2.7. Human Development
Finally, UNDP (2013) reveals a slowing down in the rate of improvement of the Human
Development Index (HDI) of Pakistan, as shown in Table 2.10. This is clearly an
indication of underinvestment on the people, especially in education and health.
Table 2.10HDI of Pakistan
Year Index Annual Growth Rate (%)
2000 0.419
2005 0.485 3.0
2010 0.512 1.1
2012 0.515 0.3
Source: UNDP, Human Development Report, 2013
There are also large disparities in access to basic economic and social services. The
provincial magnitudes of these indicators are presented in Table 2.11.

Dr. HAFIZ A PASHA | PROGRESSIVE FISCAL POLICY FOR INCLUSIVE GROWTH
16
Table 2.11Regional Disparities in Social and Economic Indicators2012-13(%)
Indicator Punjab Sindh K-PK Balochistan Pakistan
EDUCATION
Literacy Rate1 62 60 52 44 60
Primary Education
GER2 98 81 91 73 91
NER3 62 52 54 45 57
Middle Education
GER 60 48 61 39 56
NER 25 19 21 14 22
Matric Education
GER 62 54 58 37 59
NER 15 12 10 6 13
HEALTH
At least one Immunization4 98 98 98 92 98
Full Immunization4 89 74 76 53 82
Pre-Natal Consultation5 73 68 59 50 69
Post-Natal Consultation5 28 35 23 23 29
HOUSING
Access to Electricity 95 91 94 79 93
Access to Gas 36 53 26 23 38
Access to Tap Water 24 43 45 35 32
Access to Flush Toilet 77 63 71 30 71
1 of persons aged 10 years and above | 2 Gross Enrolment Rate | 3 Net Enrolment Rate4 of children aged 12-23 months | 5 of pregnant women aged 15-49 years
Source: PBS, Pakistan Social and Living Standards Measurement (PSLM) Survey.

Dr. HAFIZ A PASHA | PROGRESSIVE FISCAL POLICY FOR INCLUSIVE GROWTH
17
Punjab generally has better indicators than other provinces. Next are Sindh and K-PK.
The backwardness of Balochistan is clearly demonstrated.
Further, the extent of gender inequality is very pronounced in Pakistan as shown in Table
2.12. The literacy rate is lower by 23 percentage points. The biggest difference in gross
enrolment rate is at the secondary level. The unemployment rate is substantially higher and
the average wage much lower.
Table 2.12Indicators of Gender Inequality2012-13(%)
Male Female Ratio
EDUCATION
Literacy Rate1 71 48 68
Primary Education
GER2 98 83 85
NER3 61 54 89
Middle Education
GER 62 57 92
NER 23 21 91
Secondary Education
GER 67 49 73
NER 13 13 100
LABOUR FORCE AND EMPLOYMENT
Labor Force Participation Rate4 69 22 32
Unemployment Rate 5.4 9.0 167
Average Wage(Rs per month)5
12804 7868 61
1 of persons aged 10 years and above | 2 Gross Enrolment Rate | 3 Net Enrolment Rate4 of persons aged 10 years and above | 5 of employees
Source: PBS, PSLM and LFS.

Dr. HAFIZ A PASHA | PROGRESSIVE FISCAL POLICY FOR INCLUSIVE GROWTH
18
2.8. Key Elements of Progressive Fiscal Policy
The deficits in inclusive growth identified in the above sections have important implications
for the design of a progressive fiscal policy, as follows:
(i) Tax policy must focus on more progressive direct taxation to reduce inequality in
wealth and income. They key areas of focus are agricultural income, property and
unearned capital income from financial assets.
(ii) The policy on inter-governmental transfers will have to focus even more on
reduction in regional disparities. Inter-regional inequality is an issue to be taken by
NFC. The PFCs (yet to be reconstituted) will have to design appropriate revenue-
sharing formula to tackle intra-regional inequality.
(iii) The allocation of development funds will need to prioritize sectors with maximum
employment potential like agricultural and rural development, small-scale
manufacturing, construction, etc.
(iv) Appropriate policies will have to be designed for social protection programs
generally for the poor, and in particular for workers, women, youth, minorities,
etc.
(v) Food prices and affordability will have to managed through appropriate pricing of
agricultural inputs, support prices for outputs and income supplement programs.
(vi) A higher share of public expenditure will have to be devoted to social services,
especially education and health.

Dr. HAFIZ A PASHA | PROGRESSIVE FISCAL POLICY FOR INCLUSIVE GROWTH
19
CHAPTER 3
POLITICAL ECONOMY OF FISCAL POLICY
The desired focus of fiscal policy on deficits of inclusive growth is limited by what can be
broadly called ‘political economy’ considerations. Many of these are identified below.
3.1. Centralization of Power
The so-called ‘establishment’ in Pakistan consisting of the coalition of the military and the
civilian bureaucracy has ensured since Independence that the country remains a ‘security
state’ rather than a ‘developmental state’.
The obsessive concern for security has implied that power must remain ‘centralized’, lest
there be some loss of control. As such, sub-national governments have been kept week
and subject to manipulation. This has been achieved by creating a state of ‘dependency’,
whereby provincial governments have been granted limited fiscal powers and forced to
survive primarily on the basis transfer of resources from the Federal Government.
It is a paradox that the golden era for local governments has been during the tenure of
military governments (for 32 years out of the 67 years of Pakistan). Military governments
have weakened the units of the Federation and set up a multitude of small local
governments. These are seen as less of a ‘threat’ and as a substitute for democracy.
The centralization is also reflected in the allocation of functions, whereby the principle of
‘subsidiarity’ has seldom been applied. The original Constitution of 1973 contained two lists
of functions – a Federal Legislative List and Concurrent List. The latter could be performed
by either or both Federal and Provincial Governments. In practice, however, many of the
Concurrent List of functions were pre-empted by the Federal Government, including the
following:
Population Planning and Social Welfare
Environmental Pollution and Ecology
Welfare of labor, provident funds, old age pensions, etc.

Dr. HAFIZ A PASHA | PROGRESSIVE FISCAL POLICY FOR INCLUSIVE GROWTH
20
Trade unions; industrial and labor disputes
Electricity
Curriculum Development
Zakat and Auqaf
Others
An indication of the extent of centralization of revenue collection and of public expenditure
is given in Table 3.1.
Provincial Governments accounted for 12 percent of the total revenue collection and for 28
percent of public expenditure in 2009-10. These shares are much lower than in India
(also a Federation). The States in India have a share in revenue collection of 30
percent and in expenditure of 35 percent.
Following the return to democracy in 2008, there have been some important moves
towards decentralization and shifting the locus of power from Islamabad to the Provincial
capitals. First, the 18th Amendment increased the fiscal powers of the Provinces by the
transfer especially of the sales tax on services. Second, this Amendment also abolished
Table 3.1Share of Different Levels of Government(%)
Share ofFederalGovernment
ProvincialGovernments
Revenue Collection
1979-80 88 12
1989-90 90 10
1999-2000 89 11
2009-10 88 12
Expenditure
1979-80 80 20
1989-90 77 23
1999-2000 76 24
2009-10 72 28
Source: SBP

Dr. HAFIZ A PASHA | PROGRESSIVE FISCAL POLICY FOR INCLUSIVE GROWTH
21
the Concurrent List and transferred the functions in this List fully to the Provinces. Third,
the 7th NFC Award transferred more resources to provinces by raising the share in the
divisible pool from 50 percent to 57.5 percent. By 2012-13, the combined share of the
four Provincial Governments in revenues had increased in expenditure to over 30 percent.
But as they say, ‘the Empire strikes back’. The tendency towards centralization once again
has been promoted especially by the Federal bureaucracy. Some of the Concurrent list
functions have been either retained or duplicated on the grounds of the need for ‘co-
ordination’. The present PML-N government has more of a ‘centralist’ mind set than its
predecessor, the PPP. Consequently, tensions have increased between the Federal
Government and the Governments of Sindh and Khyber Pakhtunkhwa. Both these
Governments have other political parties in power.
3.2. Vested Interests / ‘Sacred Cows’
The real political economy in fiscal policy is visible in the role played by vested interests
and the presence of ‘scared cows’. Historically, the ultimate ‘sacred cow’ has been the
military establishment. The defense budget was traditionally presented as a lone-line item
and not subject to any discussion in the Parliament. Following some pressure for a
modicum of accountability, the defense budget of Rs 700 billion ($7 billion) has become
a six-line item. Needless to say, the argument is that transparency has to be sacrificed
on the grounds of security.
Then there is the category of ‘charged expenditure’, as per Article 81 of the Constitution.
Charged expenditure cannot be voted upon by the National Assembly. These charged
expenditures cover the budgetary provisions for the following:
National Assembly
Senate
President’s Staff and Allowances
Audit
Supreme Court
Islamabad High Court

Dr. HAFIZ A PASHA | PROGRESSIVE FISCAL POLICY FOR INCLUSIVE GROWTH
22
Electricity
Wafaqi Mohtasib
Federal Tax Ombudsman
The above charged expenditure adds up to Rs 10 billion. In addition, servicing and
repayment of debt is also in the nature of charged expenditure. It is interesting that the
cost of Prime Minister’s Office is not in the nature of charged expenditure and has to be
voted upon.
Turning to special tax treatment in terms of access to exemptions and concessions as well
other benefits/privileges, there are a number of powerful vested interests who actively
engage in rent-seeking behavior and thereby achieve a degree of state capture in
Pakistan. Some prime examples of such vested interests are listed below:
The Military
The Feudal class
The Trading Community
Exporters (especially APTMA)
Multinational Companies
Independent Power Producers (IPPs)
Commercial Banks
Urban Property Owners
VIPs and Parliamentarians
Capital Market / Stock Exchange
Public Sector Enterprises (PSEs)
Residents with Foreign Income
The types of benefits enjoyed are listed in Chart 3.1.
In effect, the tax system of Pakistan is like a ‘sieve’, with hundreds of holes. Some of
these tax benefits are incorporated in SROs. Others are even embodied in the tax law
(like the Second Schedule in the Income Tax Ordinance). The cost of the exemptions
and concessions is quantified in Chapter 4. These are often referred to as ‘tax
expenditures’.

Dr. HAFIZ A PASHA | PROGRESSIVE FISCAL POLICY FOR INCLUSIVE GROWTH
23
Chart 3.1Types of Benefits Pre-empted by Various Groups in Pakistan
A. FUEDAL CLASS
(1) Extremely Low income taxation
(2) Lack of Indexation of Land Revenue
(3) Very Low rates of Abiana and disproportionate allocation of water
(4) Subsidy on Imported Fertilizer
(5) High Procurement Price of Wheat (in relation to import parity price)
(6) Lower Tax Rate on Tractors
(7) Effectively Low Stamp Duty on Land Transactions
(8) ‘Tax Loophole’ of Agricultural Income
(9) Low Electricity Charges on Tubewells
(10) No Petroleum Levy on LDO
B. MILITARY
(1) Little or no Parliamentary scrutiny of defense budget
(2) Tax Privileges of Senior Officers
(3) No GST on Defense Stores
(4) Exemption of Business Income of Foundation / Trust
(5) Lower or no Property Tax collected from Cantonment Boards
(6) Access to Plots
C. TRADING COMMUNITY
(1) Low PIT, high evasion and low collection
(2) Exemption from GST (minor move now)
D. EXPORTERS (ESPECIALLY APTMA)
(1) Low PIT on Export Receipts
(2) Exemption of Domestic Sales from GST or very low rates
(3) Zero duty on imported cotton (5% recently)
(4) SROs for low duties on imported inputs
E. MNCs
(1) Relatively high tariff walls for import substitution e.g. Automotive Sector
(2) Now lower CIT on FDI (20 percent vs 33 percent)
(3) SROs for cheaper inputs, especially, pharmaceuticals and chemicals
(4) No Law on Transfer Pricing
F. POWER SECTOR
(1) Lifetime exemption from CIT of IPPs
(2) Big TDS and Retirement of Circular Debt

Dr. HAFIZ A PASHA | PROGRESSIVE FISCAL POLICY FOR INCLUSIVE GROWTH
24
Chart 3.1Types of Benefits Pre-empted by Various Groups in Pakistan
G. BANKS
(1) Tax rate down from 58 percent to 35 percent, despite large spreads
(2) Tax Deductibility for Provisioning against Bad Debt
(3) Under Capitalization
(4) No Withholding Tax on Interest Income
(Contd…)
(…Contd.) Chart 3.1Types of Benefits Pre-empted by Various Groups in Pakistan
H. URBAN PROPERTY OWNERS
(1) Very low rates of UIPT due to under assessment of GARVs
(2) Low Income Tax on Rental Income
(3) No Taxation of Long Term Capital Gains
(4) Low Rates of Stamp Duty / CVT due to outdated Valuation Lists
(5) Non-extension of Rating Areas to benefit Developers
I. VIPs*
(1) Tax exemption of Perquisites
(2) Access to Subsidized Land in Posh Societies
(3) Duty Free Imports
Parliamentarians
(1) Low Rate of Filing of Returns
(2) Development Fund Allocations for Constituencies(suspended currently)
Foreign Income of rich Residents
(1) Effectively not taxed even if generated in countries withwhich Pakistan has ADT agreements
J. CAPITAL MARKET / STOCK EXCHANGE
(1) No or very low Taxation of Capital Gains
(2) No Questions asked on source of investment
K. PUBLIC SECTOR ENTERPRISES
(1) High tariff Protection (e.g. Iron and Steel)
(2) Underwriting of Losses

Dr. HAFIZ A PASHA | PROGRESSIVE FISCAL POLICY FOR INCLUSIVE GROWTH
25
(…Contd.) Chart 3.1Types of Benefits Pre-empted by Various Groups in Pakistan
(3) Conversion of Debt into Equity (WAPDA)
(4) Access to Government Guarantees on Borrowing (PSO)
L. SENIOR BUREAUCRATS
(1) Low Rate of taxation on Monetization of Transport
(2) Large and Rapid Salary Increases and Pensions
(3) Exemption on Large Pensions and Provident Funds
(4) Exemption on Behbood Certificates after retirement
(5) Access to Subsidised Plots in Islamabad
*includes President, Prime Minister, Ministers, Supreme Court Judges, Chiefs of the Army, Navyand Air Force and Core Commanders.
3.3. Beneficiaries of Subsidies
Like tax benefits, many ‘subsidies’ which impose a cost on either the Federal and
Provincial exchequers are ‘hidden’ in character and not visible to the people at large.
Perhaps the most dramatic example of hidden subsidy is in irrigation. This benefits
disproportionately more the large farmer. Irrigation charges (abiana) recover only a minor
part of the cost (amortization plus O&M costs). According to SPDC (2002), abiana
covers only 9 percent of the total cost. The value of this subsidy is about Rs 150 billion
($1.5 billion) currently. Not only is this a high cost but also the low level of irrigation
charges has promoted wasteful use of water at a time when Pakistan has already become
a ‘water-stressed’ country.
The second subsidy which is not visible is on roads and highways. The amortization and
recurrent costs of this network is estimated at almost Rs 120 billion (1.2 billion). But
very few highways have toll charges and those that do, the charges are nominal. The
solitary exception is the Islamabad – Lahore Motorway. Here again, SPDC estimates the
subsidy at almost 95 percent of the cost. A progressive toll policy would be to charge
relatively more from private vehicles.

Dr. HAFIZ A PASHA | PROGRESSIVE FISCAL POLICY FOR INCLUSIVE GROWTH
26
The third example is of public higher education. According to Article 25A of the
Constitution, education, up to the secondary level, is to be provided by the State. But this
need not be the case with college and university education. However, public universities
and colleges charge very low fees. Recent estimates are that the net subsidy to these
institutions is in the region of Rs 100 billion ($1billion). A more appropriate policy would
be to charge higher fees coupled with merit-and need-based scholarships. But this system
is difficult to administer and students represent a vocal minority which will resist any such
move. It must also be recognized that public universities have played a major role in
promoting upward social mobility in the country.
Turning to subsidies which are explicitly highlighted in budget documents the largest subsidy
currently being provide is the tariff differential subsidy (TDS) to the power sector. This
aggregated to over Rs 300 billion in 2013-14. Life-line consumers (with consumption less
than 200 kwh per month) are charged a very low tariff of Rs 2 per kwh, which is less
than 12 percent of the cost.
There are two serious problems with the TDS. While it must be recognized that it is
major positive step by the Government to keep a high subsidy for the relatively poor,
domestic consumers, the number of such consumers has become artificially inflated in
collusion with staff of the distribution companies. According to one estimate, almost 60
percent of domestic consumers of electricity are life-line consumers.
This implies that almost half the TDS goes to life-line consumers. The second problem is
that beyond the life-line tariff, the tariff structure is very progressive in character and rises
from Rs 2 to Rs 18 per kwh. While this imposes a higher price on large consumers it
has created strong incentives for collusion and for evasion.
The other large subsidy is the food subsidy provided by both the Federal and Provincial
Governments. It is incurred in the process of procurement of wheat and supply to the flour
mills. The revealed amount of this subsidy is Rs 40 billion for the country as a whole.
But there is a large hidden part, involved especially in the interest cost of commodity
financing.

Dr. HAFIZ A PASHA | PROGRESSIVE FISCAL POLICY FOR INCLUSIVE GROWTH
27
The basic problem with the wheat subsidy, like other subsidies, is that it is a generalized
subsidy and not targeted towards the poor. Proposals for better targeting of this subsidy
are also given in Chapter 8.
Other relatively small subsidies are those on imported fertilizer and to the Utility Stores
Corporation. The former benefits more the large farmer who uses more fertilizer per acre,
while the latter is of greater benefit to poorer households.
Overall, the basic issue of the political economy of subsidies is that a large part benefits
the richer segments of society. In the presence of generalized subsidies, powerful interests
are likely to thwart moves towards better targeted subsidies.
3.4. Choice of Projects / Programs
The return to democracy has inevitably led to ‘constituency politics’. This was manifest
during the PPP Government in the form of the Peoples Works Program (PWP). Under
this program, MNAs/Senators were given allocations of funds for spending on projects in
their respective constituencies. There was some scope for leakages out of these funds for
personal benefit. At its peak, the size of the PWP was Rs 27 billion.
Beyond the PWP, the Prime Minister and the Federal Ministers each had discretionary
funds which could be used as desired without the due process of approval. Provincial
governments also had provisions for funding of MPAs constituency projects. In addition, the
Provincial ADPs had block grants which could be used at the discretion of the Chief
Minister.
In a ruling the Supreme Court has banned the practice of discretionary funds and
allocation of funds at the constituency level. The objectives are to restore a degree of
accountability and to prevent a situation where members of the opposition are discriminated
against.
The PML-N government has found another way of gaining political mileage through the
launching of populist programs. The most often quoted scheme is the distribution of
thousands of laptops among youth. In addition, under the banner of Prime Ministers
Schemes; the following schemes have been launched recently:

Dr. HAFIZ A PASHA | PROGRESSIVE FISCAL POLICY FOR INCLUSIVE GROWTH
28
PM’s Interest Free Loan Scheme
PM’s Business Loan Scheme
PM’s Fee Reimbursement Scheme for Less Developed Areas
PM’s Youth Training Scheme
PM’s Youth Skill Development Scheme
PM’s Housing Scheme
These schemes essentially reflect and extend the earlier announced Youth Program. The
combined allocation for these schemes is Rs 21 billion in 2014-15. The Provincial
Government of Punjab is also running similar schemes like the Yellow Cab Scheme.
The large Benazir Income Support Program is discussed in the chapter on Social
Protection. The new found predilection towards ‘mega projects’ is highlighted in the Chapter
on Development Priorities.
3.5. Role of the Legislature
The role of the Parliament in fiscal matters is specified in the following articles of the
Constitution:
73 Procedure with respect to the Money Bill
74 Federal Government’s consent required for financial measures
77 Tax to be levied by law only
80 Annual Budget Statement
81 Expenditure charged upon federal Consolidated Fund
84 Supplementary and excess grants
88 Finance Committees
One of the most important fiduciary functions of the Legislature is to pass the Money Bill,
before the start of any financial year (July to June). This Bill consists primarily of the
Finance Bill, which contains all the taxation proposals for the coming year. A copy of the
Money Bill is also sent to the Senate for recommendations on any changes. However,
these changes are not mandatory on the Government.

Dr. HAFIZ A PASHA | PROGRESSIVE FISCAL POLICY FOR INCLUSIVE GROWTH
29
According to Article 78, all revenues received by the Federal Government, all loans raised
shall form part of the Federal Consolidated Fund (FCF). All other money shall be
credited to the Public Account of the Federation.
Along with the Finance Bill, the Federal Government shall place before the National
Assembly a statement, the Annual Budget Statement (BAS), of estimated receipts and
expenditure for the forthcoming financial year and the revised estimates for the previous
year. The proposed expenditure, excluding the charged expenditure, shall be submitted in
the form of demands for grants and the National Assembly shall have the power to assent
to or refuse to assent to any demand, or to assent subject to reduction of the amount. A
description of the budgetary process is given in Annexure 1.
Similar provisions exist with regard to the approval of the Finance Bill and the Annual
Budget at the provincial level by the Provincial Assembly. The difference is that there is
no equivalent of the Senate in a Provincial legislature.
The Constitution, no doubt, provides for the due process of passage of the Annual
Budget, along with the Finance Bill. But, in practice, the discussion on expenditure
priorities and on the taxation proposals is not of a very high quality. Members are
generally not familiar with the technical aspects of the budget or taxation. The quality of
the debate in the Senate is somewhat higher.
3.6. Role of the Judiciary
The Supreme Court is the apex court of Pakistan. Among other functions it has the role
of ensuring that provisions of the Constitution are strictly adhered to in fiscal matters.
Some examples of judgments, given below, highlight the role of the Supreme Court. The
Supreme Court also has suo-moto power.
i) CRP NO1 / 2014, dated 14- May-2014
Judgment that no discretionary fund shall be granted to either the Prime Minister
or a Minister. Also no funds shall be expended on any scheme at the behest
of any MNA or MPA.
ii) SUO MOTO CASE NO 18 OF 2010

Dr. HAFIZ A PASHA | PROGRESSIVE FISCAL POLICY FOR INCLUSIVE GROWTH
30
Action regarding violation of PPRA, 2004, by NICL.
iii) CONSTITUTION PETITION NO 35 OF 2013
Action on the multi-billion scam in EOBI.
iv) CONSTITUTION PETITION NO 33 & 34 OF 2013
Action on the multi-billion scam in EOBI.
Therefore, one of the positive developments in recent years is the growing independence of
the Judiciary, one of the pillars of the State. This, as indicated above, has put greater
pressure for accountability of the Executive. Suo-moto powers have enabled the Supreme
Court to take action against mega scams and acts of corruption.

Dr. HAFIZ A PASHA | PROGRESSIVE FISCAL POLICY FOR INCLUSIVE GROWTH
31
CHAPTER 4
THE TAXATION SYSTEM OF PAKISTAN
The first three Chapters have provided the setting for identifying in specific terms the
contours of progressive fiscal policy. Chapter 1 highlighted the articles of the Constitution of
Pakistan which define the fundamental rights of the people and the principles of policy.
Chapter 2 identified the existing deficits in inclusive growth, removal of which constitutes
the principal challenge for progressive fiscal policy. Chapter 3 then presented the political
economy considerations in the formulation of fiscal policy presently, most of which could
act as impediments to making this policy more progressive in character.
An important caveat is in order here. Progressive fiscal policy will focus on equity both in
taxation and in benefits from public expenditure. However, it needs to be emphasized that
while the technical elements of such a policy can be described in depth, the basic issue
is the feasibility of implementation of such a policy in the existing political milieu. as
highlighted in Chapter 2, the State has been effectively captured by the elite. How then
will policies be adopted which lead to inclusive growth and benefit the people at large,
especially in the lower strata?
We have no answers to the feasibility question. But we still have faith that the ‘rough and
tumble’ of democracy will eventually lead to broader political representation and enable the
conduct of progressive fiscal policy. Already, there are signs of popular demands for
changes in the system. Meanwhile, as a blueprint for the future we proceed to highlight
the potential elements of a progressive fiscal policy.
This chapter and the next Chapter deal with progressive tax policy. Thereafter, the
subsequent chapters focus on the expenditure side of fiscal policy.
This Chapter describes the taxation system of Pakistan, both Federal and Provincial.
Section 4.1 identifies the trend in the overall tax-to-GDP ratio and the contribution of
individual taxes. Section 4.2 makes some international comparisons. Section 4.3 highlights
the sectoral distribution of taxes and Section 4.4 gives the incidence of the tax burden by
income level. The Chapter concludes with a quantification of tax expenditure.

Dr. HAFIZ A PASHA | PROGRESSIVE FISCAL POLICY FOR INCLUSIVE GROWTH
32
4.1. Tax-to-GDP Ratio
The overall tax-to-GDP ratio, inclusive of Federal and Provincial taxes, surcharges and
levies, was 9.6 percent in 2012-13, as shown in Table 4.1. During the last two decades
the tax-to-GDP ratio has shown a declining tendency, falling from a peak of 13.8 percent
in 1995-96. However, it has risen by almost 0.5 percent of the GDP in 2013-14.
A positive development is the rise in the share of direct taxes. Over the last decade,
direct taxes have increased from 28 percent to over 35 percent of total tax revenues.
This has contributed to a more balanced and progressive tax system. The significant fall is
in indirect taxes from 6.9 percent to 6.1 percent of the GDP, between 2000-01 and
2013-14. However, there continues to be greater reliance on indirect taxes, especially on
taxes on goods and services. This suggests that the major focus of tax reforms in the
country will have to be on further enhancing the share of direct taxes, as highlighted
earlier.
Table 4.1
Tax-to-GDP ratio of Pakistan, 2000/01–2012/13
(% of GDP)
Year Direct Taxes Indirect TaxesSurcharge/
LevyTotal Taxes
Share of DirectTaxes
2000-01 2.99 6.89 0.73 10.61 28.182001-02 3.20 6.41 1.23 10.83 29.542002-03 3.17 6.94 1.41 11.53 27.492003-04 2.92 6.84 1.09 10.84 26.942004-05 2.72 7.01 0.41 10.14 26.822005-06 2.82 7.06 0.67 10.54 26.752006-07 3.85 6.41 0.74 11.00 35.002007-08 3.79 6.47 0.34 10.60 35.752008-09 3.46 6.00 0.99 10.44 33.142009-10 3.66 5.83 0.90 10.39 35.232010-11 3.31 5.64 0.63 9.58 34.552011-12 3.58 6.06 0.40 10.04 35.652012-13 3.20 5.92 0.48 9.60 33.332013-14 3.38 6.09 0.43 10.09 35.46
Source: Ministry of Finance, GOP

Dr. HAFIZ A PASHA | PROGRESSIVE FISCAL POLICY FOR INCLUSIVE GROWTH
33
The structure of tax revenues is shown in Table 4.1. The highest contributor to the public
exchequer is sales tax followed by direct taxes on income and profits. A transition took
place in Pakistan following trade liberalization starting from the mid-90s whereby the
revenue contribution of taxes on trade declined. Over the last decade, the share of
customs duties has declined from 14 percent to 10 percent. The decline in the overall
tax-to-GDP ratio is, in part, attributable to Pakistan’s inability to fully compensate for the
revenue loss due to the process of trade liberalization.
Table 4.2Share of Revenues from Different Taxes(Rs in Billion)
2007-08 Share (%) 2012-13 Share (%)
Federal 1024.7 96.2 2383.0 93.1
Direct Taxes 387.7 36.4 891.0 33.4
Indirect Taxes 637.7 59.8 1384.0 59.7
Excise Duty 86.5 8.1 138.0 5.4
Sales Tax 385.5 36.2 1005.0 38.2
Customs Duties 150.5 14.1 241.0 10.9
Petroleum Levy andOthers
14.5 1.4 108.0 5.2
Provincial 40.2 3.8 180.0 6.9
Stamp Duties 11.3 1.1
n.a. n.a.MVTb 7.8 0.7
Property Tax 4.1 0.4
Othersc 17.0 1.6
Total 1064.9 100.0 2563.0 100.0aGas Development Surcharge | bMotor Vehicles Tax | cIncluding land revenue, agricultureincome tax, electricity duty and the sales tax on servicesSource: Fiscal Operations, MOF
Over 93 percent of taxes are generated by the federal government with the provincial
contribution being only about 7 percent. The share of the latter, however, has been on
the rise recently, particularly in the aftermath of the 7 th National Finance Commission
(NFC) award which devolved sales tax on services to the provinces.

Dr. HAFIZ A PASHA | PROGRESSIVE FISCAL POLICY FOR INCLUSIVE GROWTH
34
4.2. International Comparisons
Comparing Pakistan’s tax indicators with selected countries in the region, leads to a number
of conclusions. First, Table 4.3 demonstrates that Pakistan has the lowest tax-to-GDP ratio
among 13 selected developing countries. The average tax-to-GDP ratio of the 13 countries
is 14.5 percent as compared to under 10 percent for Pakistan, implying that, Pakistanis’, in
a manner of speaking, are under taxed to the tune of 3-4 percent of the GDP compared
to the other nationals in selected countries.
Table 4.3Comparison of the tax-to-GDP ratio and the taxation structure in selected countries
Country YearTax to GDPRatio (%)a
Share (%) of taxes onProfits,Income
Goods andServices
International Trade
Bangladesh 2011 10.0 26.7 36.9 36.6Brazil 2010 15.3 43.4 52.9 3.7China 2009 10.5 28.2 67.5 4.2India 2010 15.7 34.9 55.5 9.6Indonesia 2010 10.9 53.7 43.4 2.9Malaysia 2010 13.8 77.7 19.5 2.8Pakistan 2011 9.3 34.6 52.7 12.7Philippines 2011 12.3 47.6 30.3 22.1South Africa 2010 26.0 56.5 39.5 4.0Sri Lanka 2011 12.4 21.8 56.4 21.8Thailand 2011 17.6 46.4 48.2 5.4Turkey 2010 20.6 31.4 67.0 1.6Egypt 2010 14.1 48.5 42.3 9.2Average(13 Countries)
2009 to 2011 14.5 41.9 47.2 10.9
Source: Pasha (2013)
Second, the share of direct taxes is 35 percent in Pakistan while the average for the 13
countries is over 42 percent. Clearly our earlier conclusion of the need of moving the tax
structure towards direct taxes is substantiated. Third, the significance of trade related taxes in
Pakistan is in line with the average for the region. However, the share of taxation of goods
and services is more than the regional average.

Dr. HAFIZ A PASHA | PROGRESSIVE FISCAL POLICY FOR INCLUSIVE GROWTH
35
4.3. Sectoral Distribution
An important element in the taxation system is also how these are collected from different
sectors of the economy. The nominal incidence of taxes indicates the sectors which pay
the tax. Box 4.1 presents the sectorial distribution of taxes. Nine taxes are levied on
industry including corporate income tax, customs duties, withholding taxes, sales tax, excise
duties, petroleum levy, motor vehicle tax and gas development surcharge. The most number
of taxes are collected from industry. At the other extreme is the agricultural sector which
pays the withholding tax on crops, customs duties on agricultural items, presumptive income
tax on agricultural exports and agricultural income tax, land revenue and a share of stamp
duties.
Box 4.1Sectorial Incidence of Taxes
Services Sector
Sales Tax of ServicesFederal Sales TaxExcise Duty on ServicesCorporate Income Tax on ServicesWithholding Tax on ServicesShare in other Withholding TaxesCustom Duty on Freight and Insurance on Import GoodsUrban Immovable Property Tax
Industry
Corporate Income Tax on IndustryCustoms Duties on ManufacturersWithholding Taxes ShareSales Taxes on GoodsExcise Duties on ManufacturingPetroleum DutyMotor Vehicle TaxGas Development TaxUrban Immovable Property Tax
Agriculture
Withholding Tax on Agricultural Crops,Custom Duties on Agricultural Item,Presumptive Income Tax on Agricultural ExportsAgricultural Income Tax, Land Revenue and Stamp Duties.

Dr. HAFIZ A PASHA | PROGRESSIVE FISCAL POLICY FOR INCLUSIVE GROWTH
36
Services sector which accounts for over half of the economy and is the most rapidly
increasing sector bears the burden of seven taxes: provincial sales tax of services; federal
sales tax (on certain services like restaurants and franchises), excise duties; corporate
income tax; withholding tax; customs duty on freight and insurance, and; infrastructure
development fee on freight levied by Sindh government. The important question which arises
is what is the revenue contribution of each sector to the public exchequer?
Quantification of the nominal incidence indicates that the spread of tax burden on the three
sectors is very skewed, as shown in Table 4.4. Over 76 percent of tax revenues are
collected from the industrial sector. This is a very high share when compared to the other
sectors. Services sector contributes 21 percent to revenue collection and agriculture less
than 3 percent. Clearly taxation policy in Pakistan needs to more balanced sectorally and
effort needs to be made to tap more the services and agricultural sectors more.
Table 4.4National Sectoral Tax Incidence, 2011-12
(Rs. In Billion)Tax Revenue % of Tax Revenue
Industry 1567.6 76.4
Agriculture 54.9 2.6
Services 430.4 21.0
Total 2052.9 100.0
Source: Estimated
4.4. Incidence of Taxes
Equity considerations relating to horizontal and vertical equity require that the tax system is
designed such that there should be “equal treatment of equals” and those who have the
ability to pay more should pay more taxes than those who don’t. This is one of the
cardinal principles of progressive fiscal policy. As such, there is need to derive explicitly the
implications of the tax system on who bears the burden of taxes in Pakistan? This has
been derived for the year 2007-08 by Wahid and Wallace [2010] as part of a study
commissioned by FBR. The pattern of incidence is given in Table 4.5, according to which

Dr. HAFIZ A PASHA | PROGRESSIVE FISCAL POLICY FOR INCLUSIVE GROWTH
37
the burden appears to be mildly progressive, despite the many tax expenditures on the
richer segments of society.
However, there are reasons to believe that the tax burden has become less progressive
since 2007-08. First, the incidence of indirect taxes on the lower income deciles has
increased because of the change in the contribution of different commodities to revenues.
In particular, the share of revenues collected from POL products has risen from 19
percent in 2007-08 to over 32 percent by 2013-14. Bulk of the revenues accrues from
HSD oil which is used primarily for public transportation.
Table 4.5Incidence of Taxes in Pakistan, 2007-08
DecilesTaxes Paid as % of Income
Direct Taxes Indirect Taxes Total taxes
1 2.01 6.42 8.43
2 2.20 6.17 8.37
3 2.18 6.08 8.26
4 2.30 6.20 8.50
5 2.35 6.59 8.94
6 2.38 6.73 9.11
7 2.50 6.26 8.76
8 2.91 6.82 9.73
9 3.35 6.28 9.63
10 6.38 6.74 13.12
Source: FBR, Quarterly Review, April-June 2010
Second, the incidence of withholding taxes, especially on imports, contracts, electricity and
telephones, is likely to be more regressive than allowed for in the methodology used by
Wahid and Wallace [2010]. In fact, Kemal [2008] demonstrated that the overall incidence
of taxes was regressive in 1999-2000. More recently, IPP [2012] has calculated the
burden of indirect taxes by quintile in 2008-09. The results indicate that the incidence is
more regressive than indicated by the FBR study. Overall, the incidence of taxes in Pakistan
is not progressive.
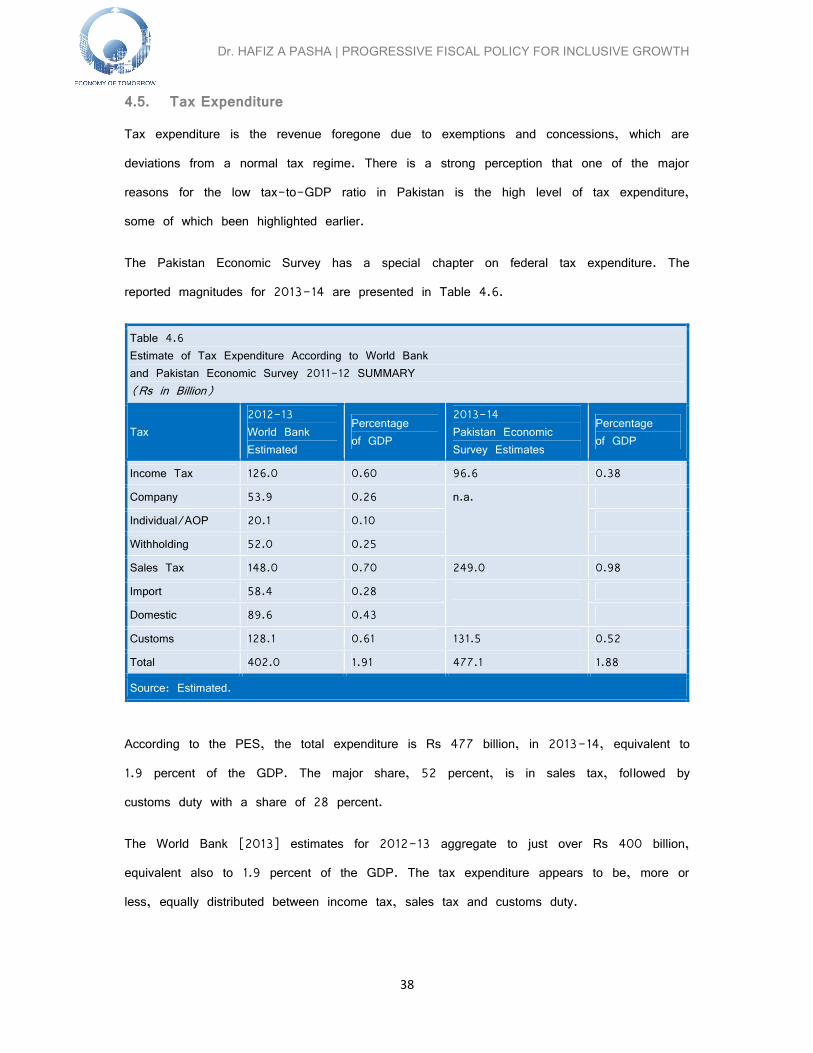
Dr. HAFIZ A PASHA | PROGRESSIVE FISCAL POLICY FOR INCLUSIVE GROWTH
38
4.5. Tax Expenditure
Tax expenditure is the revenue foregone due to exemptions and concessions, which are
deviations from a normal tax regime. There is a strong perception that one of the major
reasons for the low tax-to-GDP ratio in Pakistan is the high level of tax expenditure,
some of which been highlighted earlier.
The Pakistan Economic Survey has a special chapter on federal tax expenditure. The
reported magnitudes for 2013-14 are presented in Table 4.6.
Table 4.6Estimate of Tax Expenditure According to World Bankand Pakistan Economic Survey 2011-12 SUMMARY(Rs in Billion)
Tax2012-13World BankEstimated
Percentageof GDP
2013-14Pakistan EconomicSurvey Estimates
Percentageof GDP
Income Tax 126.0 0.60 96.6 0.38
Company 53.9 0.26 n.a.
Individual/AOP 20.1 0.10
Withholding 52.0 0.25
Sales Tax 148.0 0.70 249.0 0.98
Import 58.4 0.28
Domestic 89.6 0.43
Customs 128.1 0.61 131.5 0.52
Total 402.0 1.91 477.1 1.88
Source: Estimated.
According to the PES, the total expenditure is Rs 477 billion, in 2013-14, equivalent to
1.9 percent of the GDP. The major share, 52 percent, is in sales tax, followed by
customs duty with a share of 28 percent.
The World Bank [2013] estimates for 2012-13 aggregate to just over Rs 400 billion,
equivalent also to 1.9 percent of the GDP. The tax expenditure appears to be, more or
less, equally distributed between income tax, sales tax and customs duty.
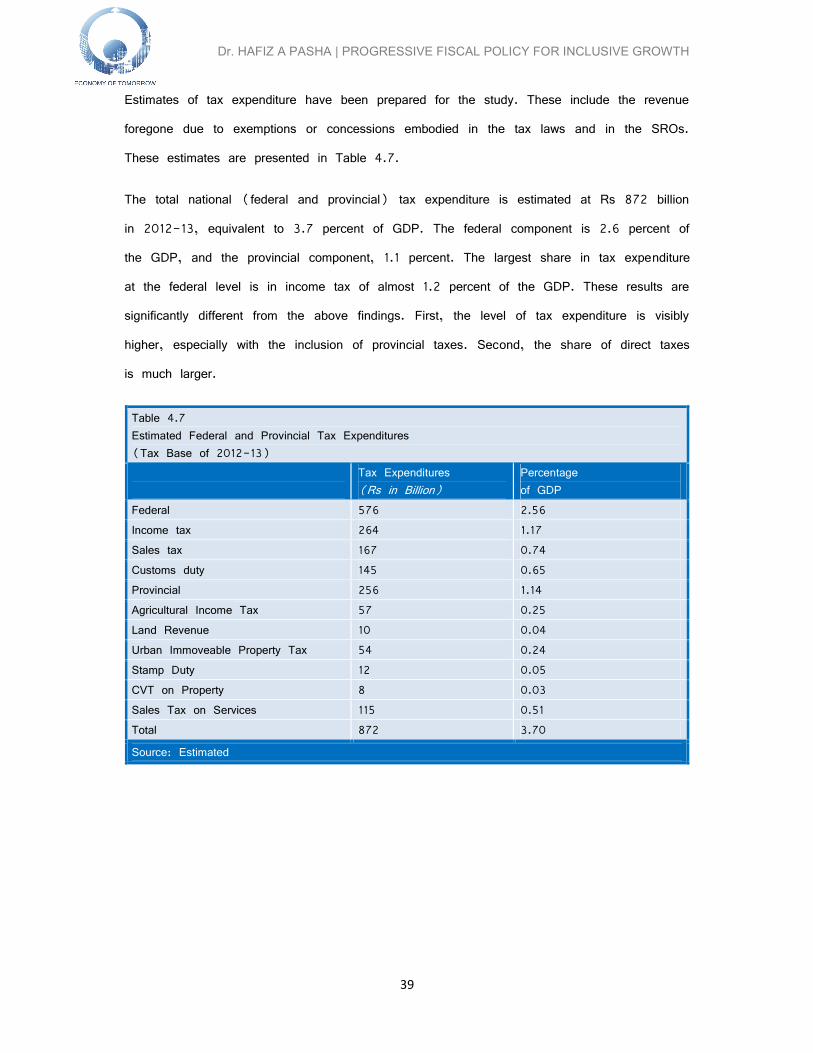
Dr. HAFIZ A PASHA | PROGRESSIVE FISCAL POLICY FOR INCLUSIVE GROWTH
39
Estimates of tax expenditure have been prepared for the study. These include the revenue
foregone due to exemptions or concessions embodied in the tax laws and in the SROs.
These estimates are presented in Table 4.7.
The total national (federal and provincial) tax expenditure is estimated at Rs 872 billion
in 2012-13, equivalent to 3.7 percent of GDP. The federal component is 2.6 percent of
the GDP, and the provincial component, 1.1 percent. The largest share in tax expenditure
at the federal level is in income tax of almost 1.2 percent of the GDP. These results are
significantly different from the above findings. First, the level of tax expenditure is visibly
higher, especially with the inclusion of provincial taxes. Second, the share of direct taxes
is much larger.
Table 4.7Estimated Federal and Provincial Tax Expenditures(Tax Base of 2012-13)
Tax Expenditures(Rs in Billion)
Percentageof GDP
Federal 576 2.56Income tax 264 1.17Sales tax 167 0.74Customs duty 145 0.65Provincial 256 1.14Agricultural Income Tax 57 0.25Land Revenue 10 0.04Urban Immoveable Property Tax 54 0.24Stamp Duty 12 0.05CVT on Property 8 0.03Sales Tax on Services 115 0.51Total 872 3.70
Source: Estimated

Dr. HAFIZ A PASHA | PROGRESSIVE FISCAL POLICY FOR INCLUSIVE GROWTH
40
Table 4.8Estimated Tax Expenditure in Income Tax(Tax Base of 2011-12)
No. DescriptionEstimated TaxExpenditure(Billion Rs)
A. Exemptions 102
1. Tax Holiday (Life Time) to Independent Power Producers 532. Under recovery of Capital Gains on Securities 293. Exemption to Profit from Behbood Savings Certificates and Pensioners’
Benefit Account11
4. Exemption of Income of Certain Trusts, Welfare Organizations, etc. 65. Exemption of Profit from Euro/Sukuk Bonds 3
B. Tax Deductions/Allowances 115
1. Accelerated (Initial) Depreciation Allowance 642. Investment Allowance to Personal Tax payers 93. Tax Deduction on Provisioning by Banks 244. Tax Deduction on WWF & WPPF Payments 115. Tax Credit on Pension Fund/Provident Fund Contributions 46. Tax Deduction on Charitable Contributions 3
C. Concessionary Tax Rates 34
1. Concessionary Rate on Sales Tax 52. Concessionary Rate on Export of Services 33. Concessionary Rate on Export of Goods 164. Concessionary Rate on Supplies 35. Concessionary Rate on Teachers 26. Concessionary Rate on Dividends 5
D. Others 13
1. Other regional/sector/enterprise exemptions 13
Total Tax Expenditure 264
Percentage of GDP 1.17
Source: Estimated
The major tax expenditures in federal income tax are identified in Table 4.8. The ‘big
ticket’ items are as follows:
Accelerated Initial Depreciation Allowance Tax holiday (lifetime) to IPPs Under-recovery of Capital Gains on Securities

Dr. HAFIZ A PASHA | PROGRESSIVE FISCAL POLICY FOR INCLUSIVE GROWTH
41
Tax deduction on provisioning by banks
Overall, a progressive fiscal policy will have to focus particularly on removal of tax
expenditures in income tax which benefit corporate entities and large personal tax payers.
4.6. Tax Evasion
The extent of tax evasion is difficult to quantify precisely because it is an unobserved
phenomenon. Various estimates, based largely on casual empiricism, have been mentioned,
ranging from 2 to 4 percent of the GDP.
There is, no doubt, some indirect evidence that supports the contention that tax evasion is
rampant in Pakistan. In particular, the recently published tax directory by FBR has come
up with some major findings as follows:
(i) The total number of tax payers who filed returns is only 791,123. The
corresponding number for India is 32 million. Given the relative size of the two
countries, the number in Pakistan should be about 3.5 million. In fact, earlier on
NADRA had detected that there should be 3 million filers of returns. In fact, the
number of individual taxpayers has fallen in the last six years.
(ii) The share of revenue from company returns is 73 percent and the remainder from
individuals / AOPs of 27 percent. Interestingly, the share of revenues from
companies is low in relation to other countries.
(iii) One of the most surprising statistics is that 45 percent of companies declared zero
tax liability in their returns. Further, less than half the companies registered with
SECP actually filed returns.
The analysis of the Tax Directory leads to a counter-intuitive conclusion. There is probably
more revenue to be gained by focusing on tax evasion by companies. This, of course,
must be accompanied by efforts for widening of the tax net to increase the number of
individual tax payers.

Dr. HAFIZ A PASHA | PROGRESSIVE FISCAL POLICY FOR INCLUSIVE GROWTH
42
CHAPTER 5
PROGRESSIVE TAX POLICY
Based on the previous chapters, the objectives of progressive tax policy are clear. First,
the emphasis has to be on raising the direct tax-to-GDP ratio and increasing its share in
total tax revenues. Second, both federal and provincial direct taxes need to be developed.
Third, wherever possible, the burden of regressive direct and indirect taxes should be
reduced. Fourth, implementation of progressive tax policy should not only lead to a more
equitable tax system but also to a higher overall tax-to-GDP ratio of the country.
The Chapter is organized as follows: Section 5.1 deals with major reforms in the federal
income tax and Section 5.2 with provincial direct taxes. Section 5.3 focuses on the
rationalization of direct taxes, especially at the federal level.
5.1. Federal Income Tax
As described in the previous chapter, tax expenditures in the federal income tax aggregate
to as much as Rs 264 billion. Progressive tax policy implies, first, the elimination of many
of those tax expenditures, which primarily benefit corporate entities and persons with large
incomes.
5.1.1. Elimination of Tax Expenditures
The following tax expenditures are proposed for elimination:
(i) Reduction in the first year depreciation allowance to companies from 25 percent to
15 percent.
(ii) Limitation of tax deductibility on loan provisioning by banks against bad debt only to
SMEs and small farmers (below 12.5 acres).
(iii) Taxation of business income (if above 50 percent of total income) of trusts and
foundations.
In addition there is a case for introduction of an inheritance tax to reduce wealth
disparities over generations.

Dr. HAFIZ A PASHA | PROGRESSIVE FISCAL POLICY FOR INCLUSIVE GROWTH
43
(iv) Taxation of foreign income of residents (citizens) in Pakistan accruing in countries
where Pakistan has an Avoidance of Double Taxation and Fiscal Evasion
agreement.
(v) Introduction of a Corporate Assets Tax at the rate of 0.25 percent initially as a
special levy to finance part of the on-going costs of Internally Displaced Persons
(IDPs).
(vi) Taxation of large pensions above Rs 1 million per annum.
5.1.2. Move from Scheduler to Comprehensive Income Taxation
Unearned capital incomes are generally taxed presumptively as separate blocs of income.
This includes the following:
PIT rate (%)
Dividends 10
Interest Income from Banks 10
Interest Income from NationalSaving Schemes
10
The proposal is to convert the PIT into a withholding tax so that tax payers are obliged
to include this income in their returns. This will significantly enhance the progressivity of
the tax system. Currently, even individuals with low incomes are subject to the PIT. This
is patently unfair.
5.1.3. Development of Capital Gains Tax
Revenues currently are marginal from capital gains tax either on shares / securities or on
property. The ITO provides for taxation only for capital gains accruing within a period of
the first two years. The proposal is to set up a system (like in India) of taxation of
realized real capital gains at any time, both on shares and properties. In addition, a
withholding tax is proposed, called the Transactions Tax, at the rate of 0.5 percent of the
reported value, in lieu of the capital gains.

Dr. HAFIZ A PASHA | PROGRESSIVE FISCAL POLICY FOR INCLUSIVE GROWTH
44
5.1.4. Rationalization of Tax Rates and Schedules
The present tax structure is given below:
(Rs in Million)
Type of Tax PayerExemption
Limit
Number of
Slabs
Maximum
Tax Rate
Taxable Income at
which maximum rate applies
Individual / Salaried 0.4 11 30 7
AOPs / Self-employed 0.4 7 35 6
Individual Company - - 33 -
The proposed reform will involve the reduction in the number of slabs for AOPs and
individuals to five, to make the tax structure more progressive. To benefit especially the
small tax payer, the exemption limit may be indexed to inflation every two years.
5.1.5. Reduction in Regressive Withholding Taxes
The Government has adopted the policy of raising withholding/ presumptive tax rates, even
in case where the effective incidence is likely to be regressive. These include the
following:
WHT RATE (%) Suggested Rate(%)
2012-13 2013-14 2
Supplies 3½ 3½ - 4 2
Importers 4 5 – 5½ 4
Contracts 6 6% 4
Telephone Charges 10 15 5
Electricity 5-10 5
Services 6 607 4
Cable TV Operators - 0.9 million 1
Transport Services 2 2 1

Dr. HAFIZ A PASHA | PROGRESSIVE FISCAL POLICY FOR INCLUSIVE GROWTH
45
It needs to be emphasized that withholding /presumptive taxes are essentially in the nature
of advance taxes. The objective should be to detect transactions and not to tax punitively
without determination of the underlying taxable income. The consequence will be less fi ling
of income with returns and more claims for refunds.
The overdevelopment of the withholding / presumptive tax regime in Pakistan is beginning
to become counter– productive and more regressive in nature. Currently these taxes now
account for almost 70 percent of total income tax revenue. Five years ago, the share was
less than 60 percent.
5.1.6. Measures to Reduce Tax Evasion
During 2013-14, FBR made attempts, under also some IMF pressure, to send notices to
persons with NTN who have not been filing returns. Unfortunately, this scheme has been
an abysmal failure. In the Budget of 2014-15, a new approach has been adopted
whereby withholding / presumptive tax rates have been enhanced generally for non-
compliant tax payers. It remains to be seen whether this new strategy will work, as in
many cases (e.g. bank transactions) it will impose high transaction costs on withholding
agents in distinguishing between compliant and non-compliant tax payers.
The abdication of collection responsibilities by FBR is an unfortunate development. It is
essential that the field staff of IRS use its existing power to detect tax evaders. For
example, Section 114 of the ITO specifies nine types of persons who are required to
furnish a return of income for a tax year. This includes persons who own urban property
with a land area of 250 square years (10 marlas) or a flat having covered area of
2000 sq. feet or more, located in a rating area. The obvious strategy should be for
PRAL to obtain the list of such property owners from the Provincial Excise and Taxation
departments, which collect the urban immoveable property tax.
An extreme solution that has sometimes been suggested is to apply the law of pre-
eminent domain on property transactions, whereby the tax authority has the right to buy a
property at, say 10 percent above the declared price. Given the quality of the tax
machinery in Pakistan today this move is not recommended. Instead, it may be made

Dr. HAFIZ A PASHA | PROGRESSIVE FISCAL POLICY FOR INCLUSIVE GROWTH
46
mandatory for the above types of property owners to furnish the last three year income tax
payment certificate at the time of sale of a property.
Many of the proposals made above are radical in nature and unlikely to find favour with
the present power structure in the country. However, they constitute a vital part of
progressive fiscal policy.
5.2. Provincial Direct Taxes
5.2.1. Agricultural Income Tax
Perhaps the most commonly perceived inequity in the tax system is the substantial under-
taxation of agricultural income in the country. The total AIT revenue from the four
provinces is less than Rs 1 billion out of a total income of over Rs 6000 billion.
There are two reasons for the massive under-collection. First, the effective tax rates are
very, very low and the penalty for not filing a return to BOR is a large amount of Rs
1000!
Second, given the political influence of the land owning class, the field level of
functionaries of BOR are reluctant to send out notices to landowners above the exemption
limit (of 12.5 acres).
A stage has been reached where the perception of inequity has led to a fall in
compliance levels among tax payers with non-agricultural income. Therefore, one of the
first tasks of a progressive fiscal policy must be tax effectively agricultural incomes, as
follows:
(i) Enhancement in PIT rates
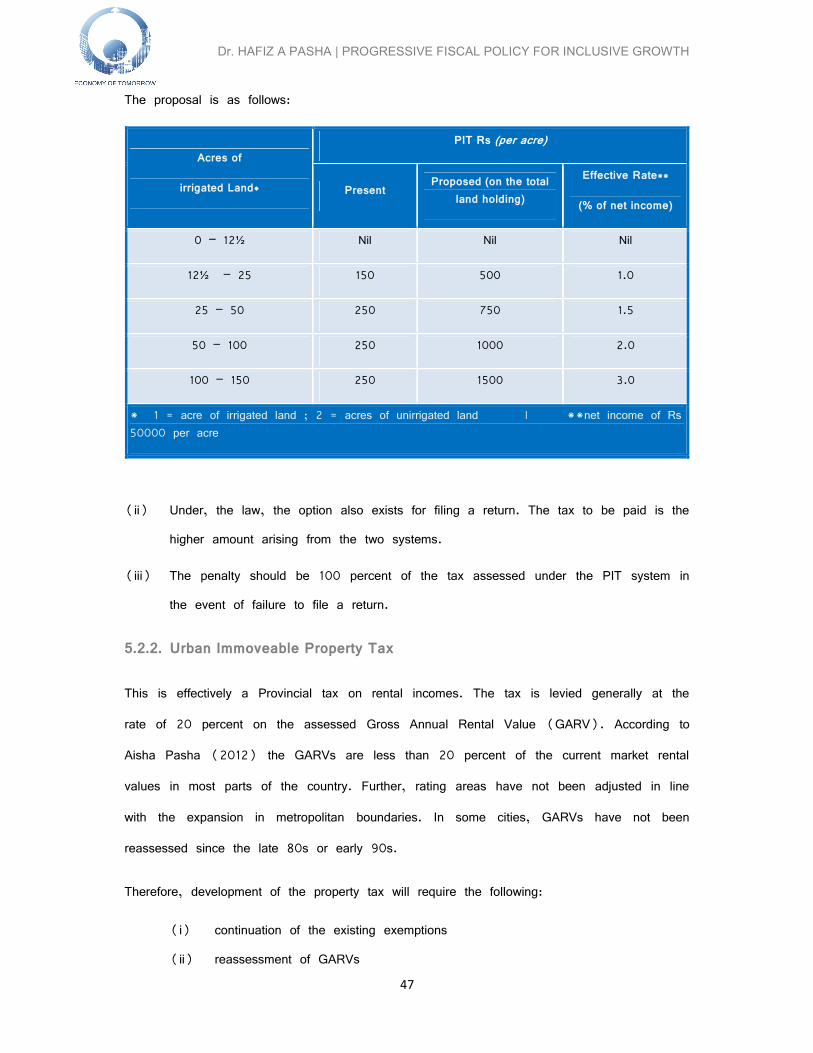
Dr. HAFIZ A PASHA | PROGRESSIVE FISCAL POLICY FOR INCLUSIVE GROWTH
47
The proposal is as follows:
Acres of
irrigated Land*
PIT Rs (per acre)
PresentProposed (on the total
land holding)
Effective Rate**
(% of net income)
0 – 12½ Nil Nil Nil
12½ – 25 150 500 1.0
25 – 50 250 750 1.5
50 – 100 250 1000 2.0
100 – 150 250 1500 3.0
* 1 = acre of irrigated land ; 2 = acres of unirrigated land | **net income of Rs50000 per acre
(ii) Under, the law, the option also exists for filing a return. The tax to be paid is the
higher amount arising from the two systems.
(iii) The penalty should be 100 percent of the tax assessed under the PIT system in
the event of failure to file a return.
5.2.2. Urban Immoveable Property Tax
This is effectively a Provincial tax on rental incomes. The tax is levied generally at the
rate of 20 percent on the assessed Gross Annual Rental Value (GARV). According to
Aisha Pasha (2012) the GARVs are less than 20 percent of the current market rental
values in most parts of the country. Further, rating areas have not been adjusted in line
with the expansion in metropolitan boundaries. In some cities, GARVs have not been
reassessed since the late 80s or early 90s.
Therefore, development of the property tax will require the following:
(i) continuation of the existing exemptions
(ii) reassessment of GARVs

Dr. HAFIZ A PASHA | PROGRESSIVE FISCAL POLICY FOR INCLUSIVE GROWTH
48
(iii) greater focus on commercial and industrial properties
(iv) decline in rebate for owner-occupied properties with size of property.
(v) computerization of records and eventual shifting to a self-assessment
regime on prescribed form.
Unfortunately, the UIPT is becoming the urban equivalent of the AIT. Provincial
governments are generally reluctant to raise revenues from this tax. In many countries, it
is the main source of financing the provision of municipal services.
5.3. Indirect Taxes
There are two big issues with regard to indirect taxes. First, they are generally regressive
in character and, second, in an effort to generate more revenues quickly, Governments
have opted for raising indirect tax rates. For example, the standard rate of the GST has
been raised from 12½ percent to 17 percent. According to ESCAP (2013) Pakistan has
the highest rate of sales tax among Asian development countries, with the exception of
Turkey.
The key elements of progressive fiscal policy on indirect taxes are discussed below.
5.3.1. Customs Duties
Progressive rounds of trade liberalization over the last two decades have led to a big
reduction in import tariffs. The maximum tariff was brought down to 25 percent but raised
subsequently in recent years to 35 percent. Today, there are seven slabs of tariff ranging
from 0 percent to 35 percent.
The problem of declining protection to domestic import-substituting industry has been
managed by the promulgation of SROs, with concessionary rates of duty or exemptions or
raw materials, intermediate goods, sub-components, components and machinery. There has
been a greatly deal of rent-seeking behavior around these SROs and resulting revenue
losses of up to Rs 131 billion.

Dr. HAFIZ A PASHA | PROGRESSIVE FISCAL POLICY FOR INCLUSIVE GROWTH
49
Fortunately, under pressure especially from the IMF, the Government is committed to
eliminate these SROs in a three-year time frame. Some initial steps have been taken by
the Government in the Budget of 2014-15.
Which are the industries which benefit most from import duty SROs? This is given in
Table 5.1 below.
Table 5.1Tax Expenditure on Import Duty SROs by Industry, 2013-14(Rs in Billion)
Chapter ofHarmonized Code
DescriptionTaxExpenditure
87 Vehicles and part thereof 36
27 Mineral fuels 15
85 Electrical Machinery and Equipment 13
84 Machinery & Mechanical Appliances 13
29 Organic Chemicals 8
72 Iron and Steel 6
23 Prepared Animal Feed 5
73 Articles of Iron and Steel 5
Others 31
TOTAL 132
The largest beneficiary of SROs is the automotive sector, accounting for over 27 percent
of the tax expenditure. It will be interesting to see how the Japanese manufacturers, who
dominate this industry, will react to the withdrawal of concessions.
The other big group is machinery. It is essential that the domestic engineering industry be
provided a modicum of protection by levying an import tariff of 5 percent on machinery,
rather than allow import at zero duty.
A progressive fiscal policy on import duties ought to follow a ‘big bang’ approach. Import
tariffs should be cascaded down in one go and most of the concessionary SROs withdrawn
at the same time. This will not only minimize any negative impact on domestic industry,
but also make the tariff structure much simpler and more transparent.

Dr. HAFIZ A PASHA | PROGRESSIVE FISCAL POLICY FOR INCLUSIVE GROWTH
50
The proposed change in the import tariff structure is as follows:
Statutory Rate of Duty
Slabs of Duty(%)
Proposed(%)
Change(%)
0 0 0
5 5a 0
10 5 -5
15 5 -10
20 15b -5
25 15 -10
30 25c -5
35 25 -10
a 5% on raw materials and machinery | b 15% on semi-finished goods | c 25% of finishedgoods
Concessionary SROs on essential items, especially food, should continue. This is a big
and complex proposal. In the event of any tariff anamolies emerging, a special committee
may be appointed to remove them.
5.3.2. General Sales Tax
Most of the SROs in the GST relate to import sales tax. The chapters which benefit most
from the SROs are listed below in Table 5.2.

Dr. HAFIZ A PASHA | PROGRESSIVE FISCAL POLICY FOR INCLUSIVE GROWTH
51
Table 5.2
Tax Expenditure on SROs in Import Sales Tax, 2013-14
(Rs in Billion)
Chapter ofHarmonized Code
DescriptionTax
Expenditure
27 Mineral fuels 61
99 Special classification 33
15 Vegetable Oils 25
85 Electrical Machinery 22
29 Organic Chemicals 14
84 Machinery and Mechanical Appliances 13
52 Cotton 13
72 Iron and Steel 7
89 Ships, boats 6
54 Man-made filaments 6
Others 49
TOTAL 249
The policy on import sales tax SROs ought to be as follows:
(i) The SROs should continue on essential items
(ii) A new reduced tax rate of 5 percent may be used to cover inputs into
export-oriented industries like textiles, e.g., Chapters 52 and 54. Also,
import of machinery in Chapters 84 and 85 may also be subject to the
5 percent sales tax.
(iii) The standard GST rate may be applied on other Chapters.
Following the above broad-basing of the GST, the standard rate should be brought down
to 15 percent from 17 percent, with the eventual target of 12½ percent. This will benefit
the lower income households.
Dr. HAFIZ A PASHA | PROGRESSIVE FISCAL POLICY FOR INCLUSIVE GROWTH
52
In addition, excise duty may be levied on activities which confer negative externalities, in
the form of noise, pollution, etc. There is a list of Dangerous and Offensive trades which
could be brought under the ambit of the excise duty. As opposed to this, direct and
indirect tax incentives should be provided for investments in renewable and clean energy.
5.3.3. Provincial Sales Tax on Services
This tax was transferred to the Provinces in the 18th Amendment. The Provinces have
made major attempts to develop this tax by setting up specialized tax agencies, SRB and
PRA. This is consistent with the goals of progressive fiscal policy, because, first, services
are under taxed presently and, second, consumption of services is relatively more by the
upper income groups.
Proposals that could be implemented to raise more revenues include the following:
(i) Taxation of imported services, under the ‘reverse charge’ principle.
(ii) Taxation of services provided by different types of consultants, travel agents, and
car dealers (via companies).
(iii) A low non-invoiceable tax rate of 4 percent on rental services by commercial
and industrial property; private educational institutions (charging fees above Rs
50000 per annum) and private hospitals.
(iv) Introduction of a withholding sales tax of 4 percent at the time of payment for
services received by government entities and companies.
(v) Make a transition within the next three years from the positive list of taxable
services to a negative list.
Following the implementation of the above proposals, the standard rate should be brought
down from 16 percent to 15 percent, with the eventual target of 12½ percent.
5.3.4. The Petroleum Levy
This is a flat levy per litre on selected petroleum products by the Federal Government on
two products – motor spirit and HSD oil. It generates significant revenues of almost Rs

Dr. HAFIZ A PASHA | PROGRESSIVE FISCAL POLICY FOR INCLUSIVE GROWTH
53
100 billion annually. The consumption of motor spirit is progressive in character, while HSD
is used for the transportation of goods, and is likely to impose a regressive burden.
It is suggested that the flat rate structure be changed to make the levy more progressive,
as shown below:
Petroleum Levy
(Rs per litre) Present Proposed
High Octane 14 20
Motor Spirit 10 14
HSD 8 4
LDO - 4
Kerosene Oil - -
Overall, readers of this Chapter may be inclined to conclude that the above set of
proposals in Federal and Provincial Taxes essentially constitute a ‘wish list’, which is highly
unlikely to be implemented given the ‘political economy’ of tax policy today. But it is
important to highlight the key elements of progressive fiscal policy, to show how far we
are from the ‘ideal’. Of course, if implemented, the above package has the potential of
raising the tax-to-GDP ratio by up to 2 percent of the GDP.
The revenue impact of different taxation proposals is given in Table 5.3. Out of the total
package of Rs 500 billion, the share of revenue from direct taxes, both federal and
provincial, is 50 percent. This will increase the share of such taxes in total tax revenue.

Dr. HAFIZ A PASHA | PROGRESSIVE FISCAL POLICY FOR INCLUSIVE GROWTH
54
Table 5.3
Revenue Impact of Progressive Taxation Proposals
(2013-14 Tax Base)Revenue Import
(Rs in Billion)FEDERAL DIRECT TAX 200 Withdrawal of Tax Expenditure 70
Move from Schedular to Comprehensive Income 20
Taxation of Capital Gains 50
Measures to reduce tax evasion 100
(Companies) (75)(AOPs / Individuals) (25)
Reduction in Regressive Withholding Taxes -60
Others 20
IMPORT DUTIES 50
IMPORT SALES TAX 150
PROVINCIAL 100AIT 30UIPT 20Provincial Sales Tax on Services 50
TOTAL% of GDP 2
Source: Derive by author
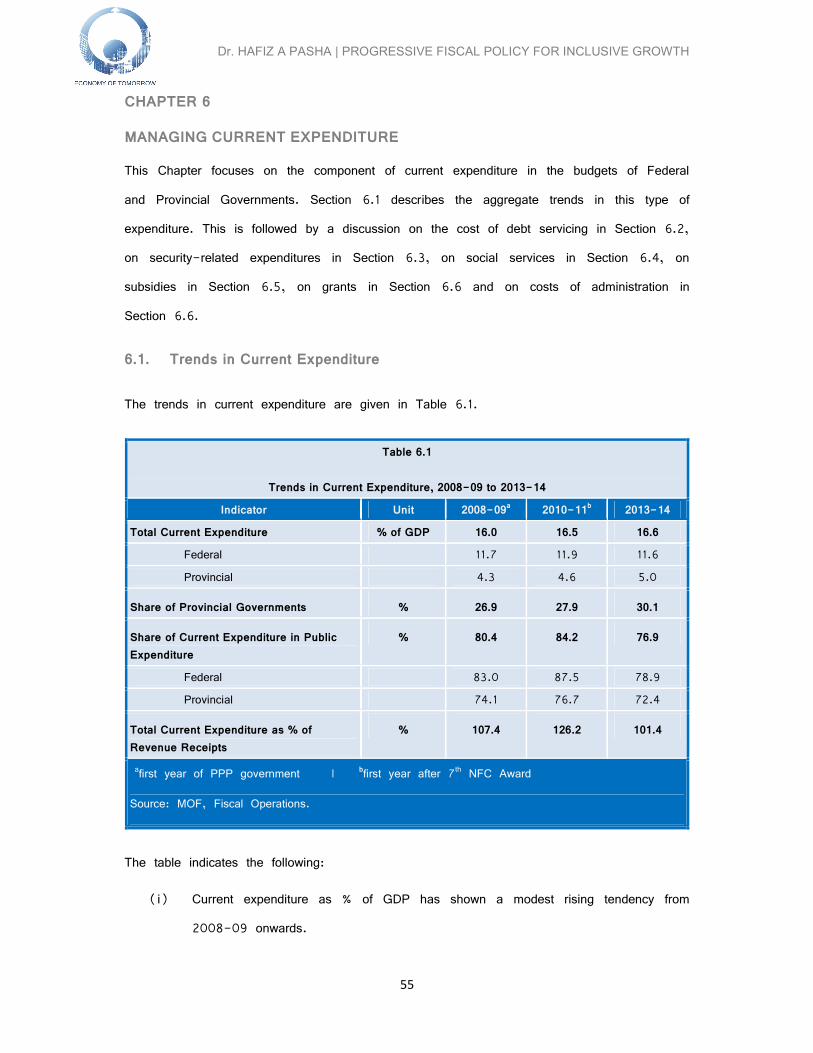
Dr. HAFIZ A PASHA | PROGRESSIVE FISCAL POLICY FOR INCLUSIVE GROWTH
55
CHAPTER 6
MANAGING CURRENT EXPENDITURE
This Chapter focuses on the component of current expenditure in the budgets of Federal
and Provincial Governments. Section 6.1 describes the aggregate trends in this type of
expenditure. This is followed by a discussion on the cost of debt servicing in Section 6.2,
on security-related expenditures in Section 6.3, on social services in Section 6.4, on
subsidies in Section 6.5, on grants in Section 6.6 and on costs of administration in
Section 6.6.
6.1. Trends in Current Expenditure
The trends in current expenditure are given in Table 6.1.
Table 6.1
Trends in Current Expenditure, 2008-09 to 2013-14
Indicator Unit 2008-09a 2010-11b 2013-14
Total Current Expenditure % of GDP 16.0 16.5 16.6
Federal 11.7 11.9 11.6
Provincial 4.3 4.6 5.0
Share of Provincial Governments % 26.9 27.9 30.1
Share of Current Expenditure in PublicExpenditure
% 80.4 84.2 76.9
Federal 83.0 87.5 78.9
Provincial 74.1 76.7 72.4
Total Current Expenditure as % ofRevenue Receipts
% 107.4 126.2 101.4
afirst year of PPP government | bfirst year after 7th NFC Award
Source: MOF, Fiscal Operations.
The table indicates the following:
(i) Current expenditure as % of GDP has shown a modest rising tendency from
2008-09 onwards.

Dr. HAFIZ A PASHA | PROGRESSIVE FISCAL POLICY FOR INCLUSIVE GROWTH
56
(ii) Following the 7th NFC Award, the share of provincial governments has
increased. It crossed 30 percent in 2013-14. This indicates a gradual process
of fiscal decentralization.
(iii) The share of current expenditure in total expenditure shows a mixed trend. It
has been rising for the Federal government, indicating some ‘crowding out’ of
development expenditure. As opposed to this, the Provinces have been able to
reduce the share of current expenditure in their respective budgets.
(iv) Current expenditure has generally exceeded total revenue receipts, implying a
revenue deficit in the consolidated budget of the Federal and Provincial
Governments. The improvement in 2013-14 is due to large ‘gift’ from a friendly
country.
Overall, it appears that current expenditure is consuming more than the available resources,
and development expenditure has been constrained to a low level in order to limit the size
of the fiscal deficit. This has had major implications on the growth process in the economy
and led to the emergence of large infrastructure deficits.
A progressive fiscal policy will aim to reduce the share of current expenditure and ensure
that there is no revenue deficit. As such, the proposed targets over the next three years
are as follows:
(i) Containment of total expenditure to 15.5 percent of GDP
(ii) Increase in development expenditure to 6 percent of the GDP
(iii) Increase in total revenue receipts to at least 15.5 percent of the GDP
6.2. Cost of Debt Servicing
The cost of debt servicing is given in Table 6.2. The major development is the big
increase of almost 67 percent between 2010-11 and 2013-14, equivalent a rise of 0.8
percent of the GDP. This explosion is due primarily to a phenomenal jump in domestic
debt of Rs 4870 billion, an increase of 105 percent. Consequently, even though the
effective interest rate has fallen significantly, the debt servicing cost has increased by
almost Rs 480 billion in three years.

Dr. HAFIZ A PASHA | PROGRESSIVE FISCAL POLICY FOR INCLUSIVE GROWTH
57
The increase is expected to moderate somewhat to Rs 138 billion in 2014-15. This is the
consequence of the decline in fiscal deficit from 8 percent or more of the GDP in 2011-
12 and 2012-13 to less than 6 percent of the GDP in 2013-14.
Table 6.2
Cost of Debt Servicing, 2008-09 to 2013-14
Unit 2008-09 2010-11 2013-142014-15
(P)
Interest of Paymentsa Rs in Billion 630.0 708.0 1187.3 1325.2
on Domestic Debt “ 558.6 653.6 1108.8 1224.6
on External Debt “ 71.7 74.4 78.5 100.6
Interest of Paymentsa % of GDP 4.8 4.0 4.7 4.6
on Domestic Debt “ 4.2 3.6 4.4 4.2
on External Debt “ 0.6 0.4 0.3 0.4
Outstanding Debtb Rs in Billion 8409.9 14000.4 15909.5
Domestic Debt “ 4650.8 9520.9 11019.0
External Debt “ 3759.1 4479.5 4890.5
Outstanding Debtb % of GDP 56.6 62.2 62.6
Domestic Debt “ 31.3 42.3 43.4
External Debt “ 25.3 19.9 19.2
Interest Payments as % ofOutstanding Debt
% 8.4 8.5 8.3
Domestic Debt “ 14.0 11.6 11.1
External Debt “ 2.0 1.8 2.0
a by the Federal Government | b of the Federal Government, lagged by one year
Source: MOF, Fiscal Operations.
The Implications for progressive fiscal policy are as follows:
(i) The consolidated fiscal deficit must be controlled to below 6 percent of the
GDP. This is below the target for 2014-15, although IPR [2014] projects
that it will approach 7 percent of the GDP.

Dr. HAFIZ A PASHA | PROGRESSIVE FISCAL POLICY FOR INCLUSIVE GROWTH
58
(ii) The mix of outstanding debt has changed sharply in favor of domestic debt,
from 55.3 percent to 69.3 percent in three years. in the absence of large
currency depreciation, domestic debt tends to be more expensive than
borrowing externally from traditional sources, like the multilateral agencies.
The implication is that while low cost external debt should be preferred,
reliance on high cost external debt, like the Eurobonds, should be avoided.
(iii) Within domestic debt, the composition (MTBs vs PIBs) should be a
function of the outlook for interest rates. If these are expected to rise than
PIBs should be preferred. As opposed to this, if they are anticipated to fall,
then the choice should be in favor of MTBs. In 2013-14, PIBs have been
the primary form of domestic borrowing.
6.3. Security-Related Expenditures
Security-related expenditures not only include the defense budget but also the cost of
quasi-military forces and the expenditure on police (primarily by provincial governments).
Estimates of security-related expenditure are given for recent years in Table 6.3.
Table 6.3
National Security-Related Expenditure
by the Federal and Provincial Governments
2012-13 to 2014-15
(Rs in Billion)
Head 2012-13 2013-14 2014-15 (P)
FEDERAL 820.1 901.8 1007.8
Defense (Military) Services 570.4 629.8 700.1
Police 66.0 71.4 79.8
Airport Security Force 3.0 3.6 4.3
Civil Armed Forces 29.1 32.4 36.0
Frontier Constabulary 6.2 6.2 7.0
Pakistan Coast Guards 1.4 1.5 1.6
Pakistan Rangers 12.6 14.5 15.6

Dr. HAFIZ A PASHA | PROGRESSIVE FISCAL POLICY FOR INCLUSIVE GROWTH
59
Military Pensions 131.4 142.4 163.4
PROVINCIAL 145.3 161.2 179.0
Law and Order (Police, etc.) 145.3 161.2 179.0
TOTAL 965.4 1063.0
(10.1)*
1186.8
(11.6)*
% of GDP 4.8 4.7 4.1
* growth rate
Source :Annual Budget Statements
These are much larger than generally perceived. In fact, they are 43 percent more than
the defense budget alone. In 2014-15, total security-related expenditure is expected to
cross Rs 1 trillion ($10 billion), second only to interest payments on debt. In fact, these
two heads consume virtually the entire net revenue receipts of the Federal Government. All
other expenditures have to be financed through borrowing.
According to the ABS of 2014-15, security related expenditure is expected to fall from 4.7
percent of the GDP in 2013-14 to 4.1 percent in 2014-15. This is very unlikely. Pakistan
is engaged in a war in the FATA region. Consequently, costs of military operations will be
significantly higher.
In addition, there is the cost of one million IDPs. It has already been suggested in
Chapter 5 that there should be a temporary levy of the Corporate Assets Tax. In addition,
an IDP surcharge was levied on large individual tax payers in 2010-11.
The high level of security-related expenditure of 4.7 percent of the GDP in 2013-14
demonstrates the high cost that Pakistan has had to incur to counter militancy and
terrorism, as well as the insurgency in Balochistan and the bad law and order situation in
Karachi. This is almost 150 percent of the total public expenditure on education and
health.
It is hoped that if the Army is able to establish the writ of the state in FATA and clean
up terrorist cells in the rest of the country that this expenditure can be brought down
eventually to the level in the 90s of less than 3.5 percent of the GDP.

Dr. HAFIZ A PASHA | PROGRESSIVE FISCAL POLICY FOR INCLUSIVE GROWTH
60
6.4. Expenditure on Social Services
We turn now to the public expenditure on social services. Following the 18 th Amendment a
large part of this expenditure is incurred by the Provincial governments, as shown in Table
6.4.
Table 6.4Public Expenditure* on Social Services2008-09 to 2012-13
(Rs in Billion)2008-09 2010-11 2012-13
EDUCATION 240.4 322.3 479.8Federal 44.4 59.8 71.7Provincial 196.0 262.5 408.1HEALTH 83.7 106.0 161.2Federal 16.8 22.8 11.4Provincial 66.9 83.2 149.8WATER SUPPLY AND SANITATION 22.2 28.5 34.0Federal 0.1 0.6 1.9Provincial 22.1 27.9 32.1TOTAL 346.3 456.8 675.0Federal 61.3 83.2 85.0Provincial 285.0 373.6 590.0AS % OF GDPExpenditure on:Education 1.8 1.8 2.1Health 0.6 0.6 0.7WSS 0.2 0.2 0.2Total 2.6 2.6 3.0SHARE OF PROVINCIAL GOVERNMENTS (%) 82.2 81.8 87.4* both current and development expenditureSource: PRSP progress reports
Public expenditure on different social services is low in Pakistan. In 2012-13, expenditure
on education exceeded 2 percent of the GDP, perhaps for the first time. Expenditure on
health is only one-third of the expenditure on education. Combined expenditure on social
services approached 3 percent of the GDP in 2012-13. This represents a share of only
15 percent of total public expenditure.
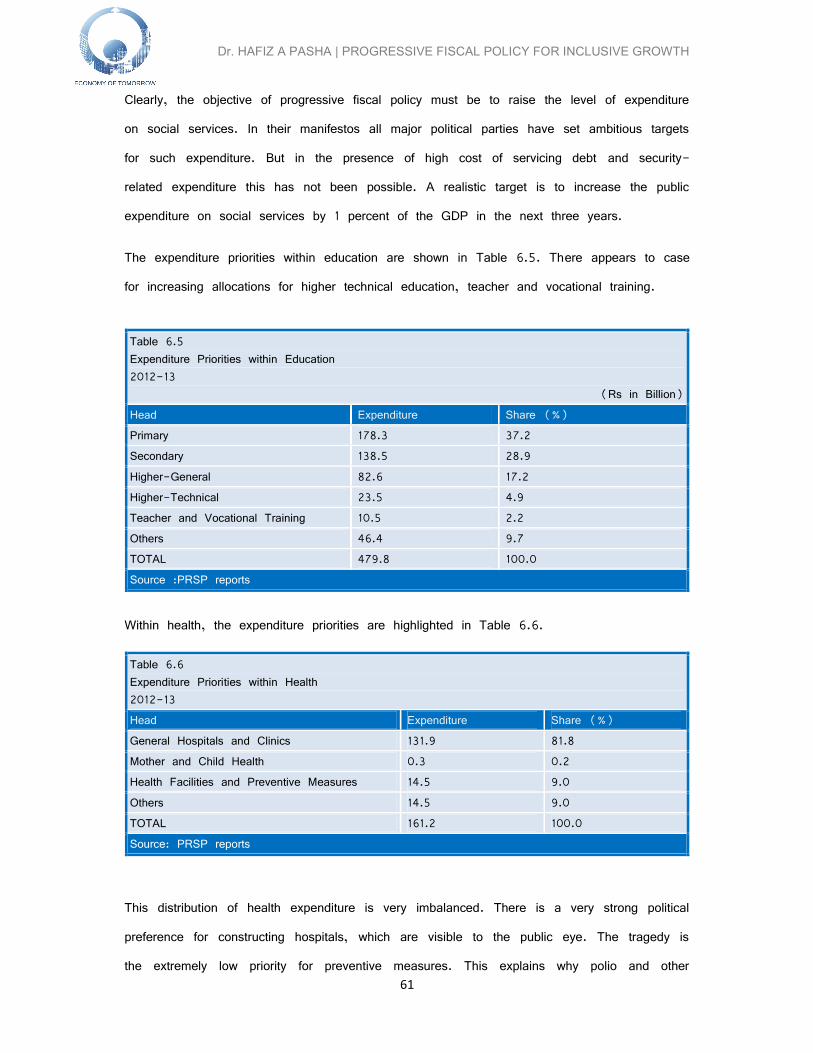
Dr. HAFIZ A PASHA | PROGRESSIVE FISCAL POLICY FOR INCLUSIVE GROWTH
61
Clearly, the objective of progressive fiscal policy must be to raise the level of expenditure
on social services. In their manifestos all major political parties have set ambitious targets
for such expenditure. But in the presence of high cost of servicing debt and security-
related expenditure this has not been possible. A realistic target is to increase the public
expenditure on social services by 1 percent of the GDP in the next three years.
The expenditure priorities within education are shown in Table 6.5. There appears to case
for increasing allocations for higher technical education, teacher and vocational training.
Table 6.5Expenditure Priorities within Education2012-13
(Rs in Billion)Head Expenditure Share (%)Primary 178.3 37.2Secondary 138.5 28.9Higher-General 82.6 17.2Higher-Technical 23.5 4.9Teacher and Vocational Training 10.5 2.2Others 46.4 9.7TOTAL 479.8 100.0Source :PRSP reports
Within health, the expenditure priorities are highlighted in Table 6.6.
Table 6.6Expenditure Priorities within Health2012-13Head Expenditure Share (%)General Hospitals and Clinics 131.9 81.8Mother and Child Health 0.3 0.2Health Facilities and Preventive Measures 14.5 9.0Others 14.5 9.0TOTAL 161.2 100.0Source: PRSP reports
This distribution of health expenditure is very imbalanced. There is a very strong political
preference for constructing hospitals, which are visible to the public eye. The tragedy is
the extremely low priority for preventive measures. This explains why polio and other

Dr. HAFIZ A PASHA | PROGRESSIVE FISCAL POLICY FOR INCLUSIVE GROWTH
62
diseases are still present in Pakistan. Over 10 percent of children aged 1 to 2 years have
not been through a full course of inoculation. Provincial governments should start gender-
responsive budgeting of social sector expenditures.
Within the target increase of 1 percent of the GDP in social services, half should go to
health. Within the increase in allocation for health, half should be devoted to preventive
measures and to mother and child clinics.
6.5. Subsidies
Bulk of the subsidies is financed by the Federal Government. As shown in Table 6.7,
subsidies virtually trebled between 2008-09 and 2011-12, reaching the peak level of Rs
512 billion in 2011-12. Since then they have fallen by 37 percent to Rs 323 billion in
2013-14, equivalent to 1.3 percent of the GDP.
Table 6.7
Breakup of Subsidies* by Federal Government
(Rs in Billion)
2008-09 2009-10 2010-11 2011-12 2012-13 2013-14
Tariff Differential Subsidy 111.6 179.5 343.1 464.2 349.3 309.4
WAPDA 92.8 147.0 295.8 419.0 265.0 245.1
KESC 18.8 32.5 47.3 45.2 84.3 64.3
ICP** 26.6 30.0 171 18.2 - -
Utility Stores Corporation 3.8 4.2 4.2 2.0 6.0 6.0
Oil Refineries / OMCs 70.0 11.2 10.8 7.9 1.2 -
Import of Fertilizer 31.7 10.0a 5.0 - - -
TOTAL 252.0 229.0 395.8 512.3 367.5 323.0
Memo Item:
Share of TDS (%) 44.2 78.4 86.6 90.6 95.0 95.8
* Excluding retirement of circular debt | ** for import of wheat and sugar
Source: Ministry of Finance, GOP

Dr. HAFIZ A PASHA | PROGRESSIVE FISCAL POLICY FOR INCLUSIVE GROWTH
63
The increase in the subsidy bill is primarily attributable to the explosive growth in the tariff
differential subsidy (TDS) to the power sector, which currently accounts for over 95
percent of the cost of subsidies. Cumulatively, since 2008-09, the TDS has aggregated to
Rs 1757 billion!
One of the biggest challenges for the Federal Government is to reduce the TDS. If
retirement of circular debt is added to the TDS then the total cost exceeds Rs 600 billion
annually. In fact, the main reason why the fiscal deficit reached 8 percent of the GDP in
2012-13 was the retirement of accumulated circular debt of Rs 480 billion. Currently, the
pending circular debt to be cleared is Rs 350 billion. However, no provisions have been
made in the Budget of 2014-15 to take care of this liability.
It is clear that fiscal stabilization will not be achieved until the financial viability of the
power sector is restored. The Government raised power tariffs substantially in the earlier
part of the year in 2013-14, but the TDS remained above Rs 300 billion.
Tariff increases have not yielded the desired revenues because of serious structural
problems and bad governance in the sector. Billing losses have increased sharply
following the tariff increases. The fuel mix has implied higher generation costs due to
reduced availability of gas. The Government has now accepted that it will take at least
four years to restore viability of the sector and bring down load shedding to low levels.
6.6. Grants
There are a number of receipts of grants from the Federal Government. These include
regional grants, grants to loss-making state utilities and public enterprises, etc. The break-
up is given in Table 6.8.

Dr. HAFIZ A PASHA | PROGRESSIVE FISCAL POLICY FOR INCLUSIVE GROWTH
64
Table 6.8
Grants by Federal Government
2012-13 to 2013-14
(Rs in Billion)
Recipient 2012-13 2013-142014-15
(B.E)
Special Grants to Provinces 61.2 53.8 24.2
Grants to AJ&K, Gilgit-Baltistan Governments 36.3 36.0 42.0
Subsidy to PSEs / Utilities 35.4 33.5 37.0
Pakistan Railways 33.4 33.5 37.0
Pakistan Steel Mill 2.0 - -
Contingent Liabilities 150 150 190.0
Social Protection 6.0 4.4 4.4
Others 45.7 58.2 73.2
TOTAL 334.6 335.9 370.8
(B.E.) Budget Estimates
The largest head is contingent liabilities. These are presumably funds for unanticipated
expenditures like losses of other PSEs, subventions for power sector, commodity financing.
This is over 5 percent of total expenditure, and there is need for greater transparency and
accountability of this expenditure.
Then there are special grants to the Provincial Governments. These should have been
avoided after the generous 7th NFC Award. In 2014-15, these grants will be reduced by
55 percent, a step in the right direction. The governments of Azad Jammu and Kashmir
and Gilgit-Baltistan also receive sizeable grants.
The Pakistan Railway has been running into substantial losses, requiring a bail-out from
the Federal Government. Other PSEs receiving support are Pakistan Steel Mills, PIA, etc.
The objective must be to either restructure these entities and/or privatize them.
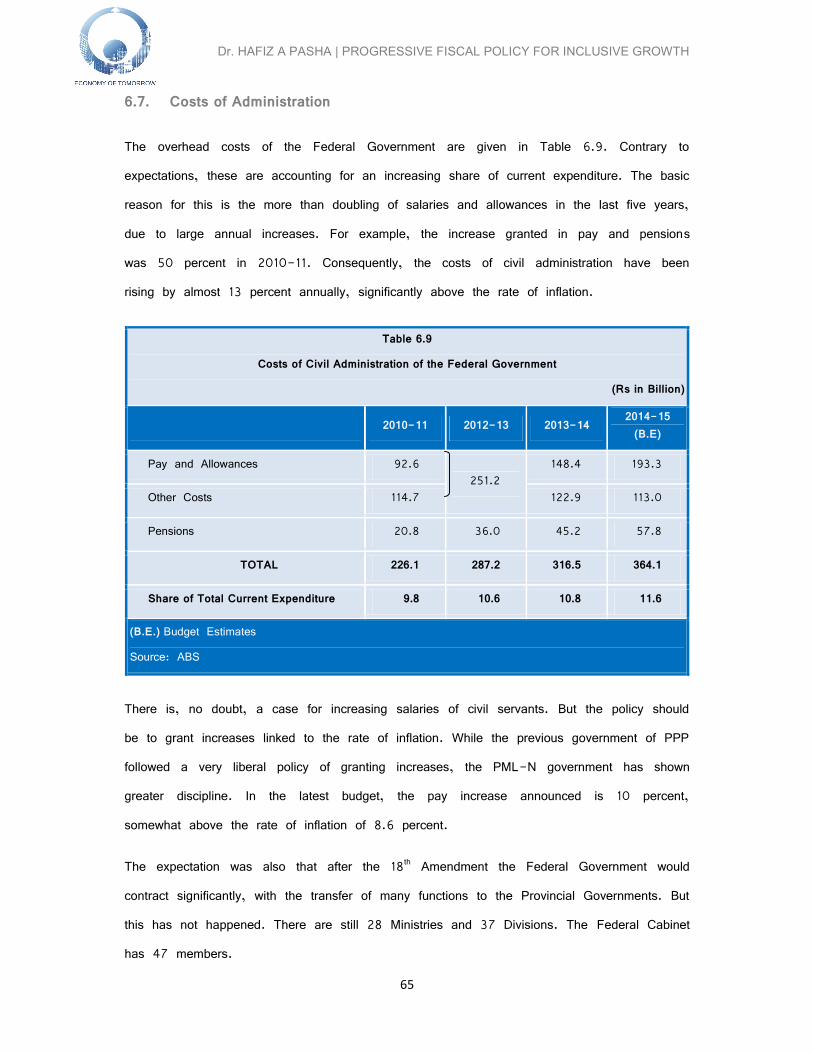
Dr. HAFIZ A PASHA | PROGRESSIVE FISCAL POLICY FOR INCLUSIVE GROWTH
65
6.7. Costs of Administration
The overhead costs of the Federal Government are given in Table 6.9. Contrary to
expectations, these are accounting for an increasing share of current expenditure. The basic
reason for this is the more than doubling of salaries and allowances in the last five years,
due to large annual increases. For example, the increase granted in pay and pensions
was 50 percent in 2010-11. Consequently, the costs of civil administration have been
rising by almost 13 percent annually, significantly above the rate of inflation.
Table 6.9
Costs of Civil Administration of the Federal Government
(Rs in Billion)
2010-11 2012-13 2013-142014-15
(B.E)
Pay and Allowances 92.6251.2
148.4 193.3
Other Costs 114.7 122.9 113.0
Pensions 20.8 36.0 45.2 57.8
TOTAL 226.1 287.2 316.5 364.1
Share of Total Current Expenditure 9.8 10.6 10.8 11.6
(B.E.) Budget Estimates
Source: ABS
There is, no doubt, a case for increasing salaries of civil servants. But the policy should
be to grant increases linked to the rate of inflation. While the previous government of PPP
followed a very liberal policy of granting increases, the PML-N government has shown
greater discipline. In the latest budget, the pay increase announced is 10 percent,
somewhat above the rate of inflation of 8.6 percent.
The expectation was also that after the 18th Amendment the Federal Government would
contract significantly, with the transfer of many functions to the Provincial Governments. But
this has not happened. There are still 28 Ministries and 37 Divisions. The Federal Cabinet
has 47 members.
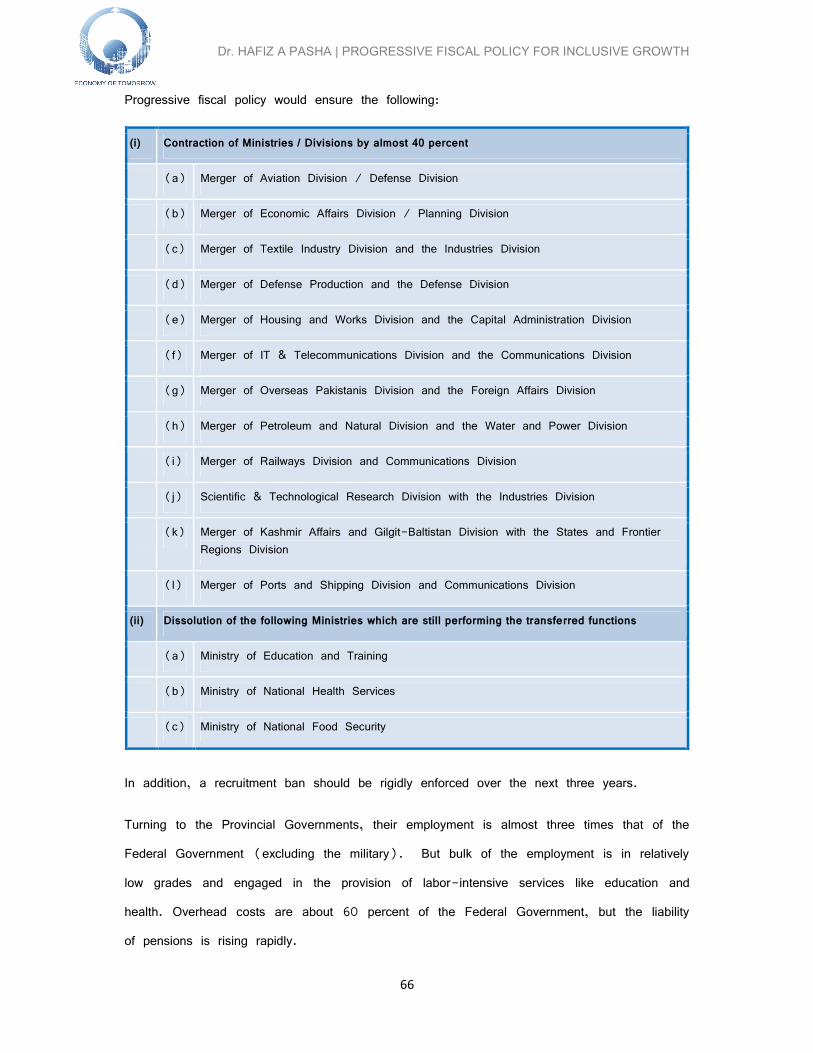
Dr. HAFIZ A PASHA | PROGRESSIVE FISCAL POLICY FOR INCLUSIVE GROWTH
66
Progressive fiscal policy would ensure the following:
(i) Contraction of Ministries / Divisions by almost 40 percent
(a) Merger of Aviation Division / Defense Division
(b) Merger of Economic Affairs Division / Planning Division
(c) Merger of Textile Industry Division and the Industries Division
(d) Merger of Defense Production and the Defense Division
(e) Merger of Housing and Works Division and the Capital Administration Division
(f) Merger of IT & Telecommunications Division and the Communications Division
(g) Merger of Overseas Pakistanis Division and the Foreign Affairs Division
(h) Merger of Petroleum and Natural Division and the Water and Power Division
(i) Merger of Railways Division and Communications Division
(j) Scientific & Technological Research Division with the Industries Division
(k) Merger of Kashmir Affairs and Gilgit-Baltistan Division with the States and FrontierRegions Division
(l) Merger of Ports and Shipping Division and Communications Division
(ii) Dissolution of the following Ministries which are still performing the transferred functions
(a) Ministry of Education and Training
(b) Ministry of National Health Services
(c) Ministry of National Food Security
In addition, a recruitment ban should be rigidly enforced over the next three years.
Turning to the Provincial Governments, their employment is almost three times that of the
Federal Government (excluding the military). But bulk of the employment is in relatively
low grades and engaged in the provision of labor-intensive services like education and
health. Overhead costs are about 60 percent of the Federal Government, but the liability
of pensions is rising rapidly.

Dr. HAFIZ A PASHA | PROGRESSIVE FISCAL POLICY FOR INCLUSIVE GROWTH
67
Overall, Pakistan is caught is a quagmire. The high costs of debt servicing, security and
subsidy to cover losses in the power sector imply that development expenditure on
infrastructure and outlays on social services will continue to be ‘crowded out’. This
highlights the urgency for implementing progressive tax reforms to create more ‘fiscal
space’ for priority expenditures and keep the fiscal deficit at below 6 percent of the GDP.

Dr. HAFIZ A PASHA | PROGRESSIVE FISCAL POLICY FOR INCLUSIVE GROWTH
68
CHAPTER 7
MANAGING DEVELOPMENT SPENDING
Pakistan today suffers from a large ‘infrastructure deficit’, especially in power and water.
The index of human development is growing very slowly because of underinvestment in the
people. These are a reflection of low development spending, both at the Federal and
Provincial Levels.
The first section of this Chapter highlights the low level of development expenditure and
how this has been the first casualty in the process of fiscal stabilization. Section 2
presents the sectoral composition of PSDP / ADPs. Section 3 describes the existing
portfolio of Federal projects and the ‘mega projects’ in the process of being executed.
Section 4 discusses the components of the other so-called ‘other development expenditure’
and net lending by the Federal government.
7.1. Size of PSDP / ADPs
The size and distribution of development spending on projects/programs between the
Federal and Provincial Governments is given in Table 7.1. In the last five years, the
combined development spending has generally been below 4 percent of the GDP. This is
in contrast to the peak period of development spending in the history of Pakistan. During
the 80s, Pakistan used to allocate almost 8 percent of the GDP for public development
spending.
Table 7.1Level and Distribution of Development Spending
(Rs in Billion)
2008-09 2012-13 2013-142014-15(B.E)
PSDP 517.9 695.1 904.0 1225.8
Federal 259.5 323.5 425.0 525.0
Provincial 258.4 371.6 479.0 700.8
Share of Federal Government in PSDP (%) 50.1 46.5 47.0 42.8
Total PSDP as % of GDP 3.9 3.1 3.5 4.2
(B.E.) Budget EstimatesSource: MOF

Dr. HAFIZ A PASHA | PROGRESSIVE FISCAL POLICY FOR INCLUSIVE GROWTH
69
Further, there are annually large cut backs, in an effort to reach fiscal deficit targets,
especially during the tenure of IMF programs. For example, in the first year 2013-14, in
the presence of the Extended Fund Facility of the IMF, the total development program has
been reduced by Rs 252 billion in relation to the original budgetary estimates. This
represents a cut back of 22 percent, as shown in Table 7.2.
Table 7.2Cutback in the PSDPs(Rs in Billion)
Federal Provincial Total2009-10Budget Estimate 441 200 641Actual 310 200 510% Cut back 25.0 0.0 22.82012-13Budget Estimate 360 513 873Actual 388 463 851% Cut back -7.8a 9.7 2.62013-14Budget Estimate 540 615 1155Actual 425 478 903% Cut back 21.3 22.3 22.0a Actual expenditure higher than bud
7.2. Sectoral Distribution
7.2.1. Federal
The sectoral distribution of the PSDP executed at the Federal level is given in Table 7.3
for 2012-13 and 2013-14. A change in priorities is visible in 2013-14, with the transition
from a PPP to PML-N Government. The latter is more oriented towards infrastructure
development. Consequently, the share of actual allocations to infrastructure has increased
by 38.2 percent, as shown in Table 7.3.
In the proposed PSDP of 2014-15, the largest allocation is to the National Highways
Authority of over Rs 111 billion. This is primarily to start work on the Lahore-Karachi
Motorway. The next largest allocation is Rs 64 billion for WAPDA (power). Inclusive of

Dr. HAFIZ A PASHA | PROGRESSIVE FISCAL POLICY FOR INCLUSIVE GROWTH
70
allocations to PAEC and self-financing by WAPDA the total proposed investment in the
power sector is over Rs 200 billion.
Table 7.3
Sectoral Distribution of the PSDP of the Federal Government
(Rs in Billion)
2012-13
Share
(%)
2013-14
Share
(%)
2014-15
(B.E)
Share
(%)
INFRASTRUCTURE 221.3 57.0 305.9 72.0 131.1 59.6
Communications 0.1 0.2 - 0.2 -
National Highways Authority 71.1 88.5 20.8 111.6 21.3
Pakistan Atomic Energy Commission 44.0 52.3 12.3 51.5 9.8
Ports and Shipping 0.3 6.3 1.5 2.6 0.5
Railways 25.8 28.0 6.6 39.6 7.5
Water and Power (Water) 45.3 54.0 12.7 43.4 8.3
WAPDA (Power) 34.7 76.1 17.9 63.6 12.1
Information Technology &Telecommunication
0.8 0.5 0.1 0.6 0.1
SOCIAL SERVICES 47.7 12.3 52.5 12.3 63.1 12.0
Education and Training 2.9 3.2 0.7 3.5 0.7
Higher Education Commission 15.6 22.5 5.3 20.1 3.8
National Health Services 0.2 26.8 6.3 27.0 5.1
MDGs Programme - - 12.5 2.4
Finance Division 29.0 - - -
DIRECTLY PRODUCTIVE SECTORS 2.9 4.7 1.1 4.3 0.8
Defence Production 0.5 0.5 0.1 0.9 0.2
Industries 0.7 1.4 0.3 1.1 0.2
National Food Security 0.3 0.5 0.1 1.1 0.2
Science and Technology 1.2 2.0 0.5 0.9 0.2

Dr. HAFIZ A PASHA | PROGRESSIVE FISCAL POLICY FOR INCLUSIVE GROWTH
71
Textile Industry 0.2 0.3 0.1 0.3 -
GOVERNANCE 6.1 26.7 6.3 5.0 1.0
Cabinet 1.9 24.7 5.8 2.0 0.4
Inter-Provincial Coordination 2.7 0.4 0.1 0.4 0.1
Law and Justice 1.2 1.3 0.3 2.4 0.4
Revenue 0.3 0.3 0.1 0.2 -
REGIONAL 46.5 10.9 76.5 14.5
Kashmir & Gilgit-Baltistan 19.4 23.0 5.4 21.4 4.1
States and Frontier Regions 15.3 18.5 4.4 19.1 3.6
Tameer-e-Pakistan 46.4c 5.0 1.1 - -
Province and Special Areas - - 36.0 6.9
OTHERS -11.3 -2.6 63.0b 12.0
TOTAL 388.4 425.0 100.0 525.0 100.0
a Actual expenditure higher than budget
Other sectors with relatively high priority are Railways (Rs 39.6 billion), WAPDA for hydro-
electricity (Rs 43.4) billion and Rs 27 billion for health. Two new programs are being
initiated. The first program is a community based program for achieving the MDGs, while the
second program is for development of backward areas in the country.
It remains to be seen how much of the PSDP of Rs 525 billion will be executed in
2014-15. The Government is committed to achieving a big reduction in fiscal deficit to
less than 5 percent of the GDP.

Dr. HAFIZ A PASHA | PROGRESSIVE FISCAL POLICY FOR INCLUSIVE GROWTH
72
7.2.2. Provincial
The proposed sectoral distribution of the ADPs of each Provincial Government in 2014-15
is given in Table 7.4. There is significant variation in priorities among the four provincial
governments, as described below.
(i) The Punjab Government has allocated 43 percent of its ADP to development
of infrastructure. The largest allocation in this category is for urban
development, including the controversial Lahore Metro Transit project (costing
$1.6 billion, with financing from China). Other Provinces have devoted about
one fourth of their respective ADPs to infrastructure projects.
(ii) The highest priority to social sectors has been given by the Government of
Khyber-Pakhtunkhwa, with a share of 43 percent. Within this allocation,
almost 44 percent is for education. Other Provinces propose to devote 21
percent to 43 percent of their ADPs to social sectors.
(iii) A major new development is entry of Provincial Governments into the
funding of energy projects, especially by Punjab and Sindh. This will support
Federal efforts to remove the energy constraint.
(iv) A worrying development is the large allocation to special initiatives /
programmes, especially by the Government of Sindh of over 19 percent. The
details of such programs are not given and frequently represent funds to be
spent at the discretion of the Chief Minister.
(v) The ADPs of Sindh and Khyber-Pakhtunkhwa are more decentralized than
Punjab. The share of District Development Program is the highest in Sindh
at 13 percent and the lowest in Punjab at 2 percent.

Dr. HAFIZ A PASHA | PROGRESSIVE FISCAL POLICY FOR INCLUSIVE GROWTH
73
Table 7.4
Sectoral Priorities in Provincial ADPs
2014-15
(Rs in Billion)
SectorPUNJAB SINDH
Allocation Share (%) Allocation Share (%)
INFRASTRUCTURE 148.5 43.0 47.6 24.7
Roads 31.6 9.2 14.2 7.4
Irrigation 30.6 8.9 12.9 6.7
Energy 31.0 9.0 20.5 10.6
Urban Development 42.4 12.3 - -
Others - - - -
SOCIAL SECTORS 119.4 34.6 55.7 28.9
Education 48.3 14.0 15.0 7.8
Health 31.1 9.0 15.7 8.1
WSS 17.2 5.0 - -
DD 7.5 2.2 25.0 13.0
Others 15.3 4.4 - -
DIRECTLY PRODUCTIVE 26.3 7.6 9.5 4.9
Agriculture 8.0 2.3 7.2 3.7
Livestock 5.2 1.5 2.2 1.1
Industries 7.1 2.1 0.1 -
SPECIAL INITIATIVES/PROGRAMME 33.0 9.6 43.0 22.3
OTHES 17.8 5.2 37.0 19.2
TOTAL 345.0 100.0 192.8 100.0

Dr. HAFIZ A PASHA | PROGRESSIVE FISCAL POLICY FOR INCLUSIVE GROWTH
74
SectorK-PK BALOCHISTAN
Allocation Share (%) Allocation Share (%)
INFRASTRUCTURE 36.4 26.0 53.9
Roads 17.3 12.4 33.3
Irrigation 4.7 3.4 10.7
Energy 5.6 4.0 6.0
Urban Development 8.8 6.3 3.9
SOCIAL SECTORS 60.1 43.0 21.3
Education 26.1 18.7 6.0
Health 11.2 8.0 3.6
WSS 5.8 4.1 6.3
DDP 17.0 12.2 5.4
DIRECTLY PRODUCTIVE 7.6 5.4 5.6
Agriculture 2.5 1.8
Livestock - -
Industries 5.1 3.6
SPECIAL INITIATIVES/PROGRAMME 9.1 6.5
OTHERS 26.6 19.0 19.2
TOTAL 139.8 100.0 100.0
7.3. Portfolio of Projects
Table 7.5 gives the throw forward (remaining cost) and the cost of new projects included
in the federal PSDP of 2014-15. The portfolio of projects has a total cost of Rs 7.76
trillion ($77.6 billion). New projects have added Rs3.54 trillion ($35.4 billion). In
effect, the Federal Government has added 83 percent to the cost of the existing portfolio
in one year. This is unprecedented.
The major sectors/agencies in the portfolio are Communications ($10.6 billion), including
the China-Pakistan Economic Corridor (CPEC); Pakistan Atomic Energy Commission

Dr. HAFIZ A PASHA | PROGRESSIVE FISCAL POLICY FOR INCLUSIVE GROWTH
75
($10.5 billion) for nuclear power; WAPDA for the power sector ($43.9 billion), including
$32.5 billion for three major dams (Dasu, Daimer-Basha and Benji). In effect, 70
percent of the portfolio consists of projects in the power sector.
The disproportionately large size of the portfolio of $77.6 billion can be seen in relation to
the PSDP in 2014-15 of $5.2 billion. This implies that on average a project will take
almost fifteen years to complete! There is, therefore, no option but to prioritize the
implementation of the portfolio, over the next four to five years.
A suggested prioritization is as follows:
(i) First priority to energy projects and associated infrastructure with relatively short
gestation periods. These include the Karachi Coastal Project ($9.8 billion);
Upgradation of Mangla ($0.5 billion); two coal-fired power plants at Jamshoro
($1.8 billion); there 750 MW CCPP in Punjab ($0.7 billion); coal fired plant
at Lakhra ($0.9 billion); power evacuation from Gaddani to National Grid ($3
billion); Jetty and infrastructure at Gaddani ($0.7 billion) and initial funding of
only one dam, the Dasu dam ($4.9 billion). The total cost of these projects
in the power sector development program is $22.3 billion. This will require
annual PSDP allocations for the power sector of over $5 billion, as compared
to less than $2 billion currently. Much of the financing could come from China
and the multi-lateral development banks. The federal PSDP would have to be
increased by at least 1.2 percent of the GDP to create space for the power
sector investments.

Dr. HAFIZ A PASHA | PROGRESSIVE FISCAL POLICY FOR INCLUSIVE GROWTH
76
Table 7.5
Throw-forward of Federal On-Going Projects and Cost of New Projects
(Rs in Million)
Division / Agency
Throw-forward
as of01.07.20
14
Allocation
2014-15
to On-Going
Projects
Cost ofNew
Projects
Allocation
2014-15
to NewProjects
Size ofPortfolio
[1] + [3]
TotalAllocation
2014-15
[1] [2] [3] [4]
1. Aviation 7286 196 14252 1205 21538 1401
2. Cabinet 3528 1896 317 182 3845 2078
3. CAD 1477 807 4175 999 5652 1806
4. Climate Change 53 15 120 10 173 25
5. Commerce 596 363 - - 596 363
6. Communications 162555 54733 896708
57020 1059263
111752
Ministry 898 191 - - 989 191
NHA 161566 54542 150375
8020 311941 62556
CPEC - - 746333
49000 746333 49000
7. Defence 8910 2161 14175 100 23085 2261
8. Defence Production 1624 937 - - 1624 937
9. EAD 100 5 - - 100 5
10. Education, Training 4918 1884 2637 1567 7555 3451
11. Establishment 65 65 1000 100 1065 165
12. Federal Tax Ombudsman 13 13 - - 13 13
13. Finance 56823 875 19571 2310 76394 11062

Dr. HAFIZ A PASHA | PROGRESSIVE FISCAL POLICY FOR INCLUSIVE GROWTH
77
14. Foreign Affairs 255 255 - - 255 255
15. HEC 68155 16793 50372 3275 118527 20068
16. Housing & Works 11945 1824 185 110 12130 1934
17. Industries & Production 24435 1048 1000 100 25435 1148
18. Information 2286 384 200 40 2486 424
19. IT & Telecommunications 2324 435 10450 121 12792 556
20. Inter-Provincial Co-ord. 611 292 557 120 1168 412
21. Interior 17665 2735 8273 1165 25938 3900
22. Kashmir & G-B 25419 20907 12004 450 37423 21357
Kashmir 8230 11727 7004 400 15234 12127
Gilgit-Baltistan 17189 9180 5000 50 22189 9230
23. Law 2391 1062 3937 1290 6328 2352
24. Narcotics Control 1221 292 1770 32 2991 324
25. Food Security 2810 740 2723 331 5533 1071
Table Continued

Dr. HAFIZ A PASHA | PROGRESSIVE FISCAL POLICY FOR INCLUSIVE GROWTH
78
Table 7.5 (…Continued)
Throw-forward of Federal On-Going Projects and Cost of New Projects
(Rs in Million)
Division / Agency
Throw-forward
as of01.07.20
14
Allocation
2014-15
to On-Going
Projects
Cost ofNew
Projects
Allocation
2014-15
to NewProjects
Size ofPortfoli
o
[1] + [3]
TotalAllocatio
n
2014-15
[1] [2] [3] [4]
26. Health 115840 26814 1000 200 116840 27014
27. PAEC 1049005
51043 3743 432 1052748
51475
28. PNRA 659 200 700 30 1359 230
29. Petroleum & NR 322 153 57 14 379 167
30. P & D 2303 799 15446 2070 17749 2869
31. P & D (Other) - - 30009 30009 30009 30009
32. MDGs - - 25000 12500 25000 12500
33. Special Fed Programme - - 36000 36000 36000 36000
34. Ports & Shipping* 104 127 51663 2449 51767 2576
35. Railways* 140979 31641 57818 7925 198797 39566
36. Revenue 300 134 8522 18 8822 152
37. Science and Technology 1497 561 2169 343 3666 904
38. States and Frontier - - 19100 19100 19100 19100
39. Statistics 926 220 279 20 1205 240
40. SUPARCO 19570 700 - - 19570 700
41. Textile Industries 309 309 60 20 369 239

Dr. HAFIZ A PASHA | PROGRESSIVE FISCAL POLICY FOR INCLUSIVE GROWTH
79
42. Water & Power
(Power Sector)
2169819 175553 2222403 25027 4392222
200580
WAPDA (Hydel) 1651915 81227 1595320**
200 3247235
81427
Generation (GENCOs) 285895 22900 164087 500 449982 23400
NTDC 177123 39924 435641 18867 612764 58791
DISCOs 54886 31502 27355 5460 82241 36962
43. Water and Power(Water)
304232 42554 21770 873 326002
43727
44. ERRA 5000 5000 - - 5000 5000
TOTAL 4218348 454402 3540165 207557 7758513
661959***
*including CPEC Projects
**Bunji Dam
***including self-financing by corporation
(ii) In the absence of adequate resources and the need to restrict the fiscal deficit
to a maximum of 6 percent of the GDP it is proposed that other projects be
deferred for implementation. In particular, the Lahore - Islamabad Motorway
must receive much less priority than the power sector projects.
Overall, the ‘spreading thin’ of the PSDP must be avoided. This leads to substantial
delays and large cost overruns. Within the available resources, water and power sector
projects must have the highest priority.

Dr. HAFIZ A PASHA | PROGRESSIVE FISCAL POLICY FOR INCLUSIVE GROWTH
80
Table 7.6
New Mega Projects*
(Rs in Billion)
Type**Total
Cost
Allocation
2014-15
H China – Pak Economic Corridor (CPEC) 746.3 49.0
P Karachi Coastal Power Project 958.7 12.1
R Procurement of 150 D.E. Locomotives 55.5 -
P Bunji Hydro Power Project (7100MW) – (Gilgit) 1595.3 -
P Diamer- Basha Dam Project (4500MW) 894.0 25.0
P Dasu Hydro Power Project (2160MW) – (K-PK) 486.0 4.4
P Upgradation of Generation of Mangla (310MW) 52.2 1.3
P Installation of New Coal Fired Power Plants at Jamshoro(2x660MW)
177.1 9.3
P 750MW CCPP at Shahdra, Multan and Faisalabad 75.0 -
P Coal Fired Plant Lakhra (1x660) 88.6 -
P Power Evacuation from Gaddani to National Grid 300.0 12.8
H Jetty and Infrastructure at Gaddani (CPEC) 70.0 1.0
W CRBC 1st Lift Cum Gravity Project, D.I. Khan 61.1 -
W Raising of Mangla Dam Project (AJ&K) 96.9 -
TOTAL OF ABOVE 5656.7
% OF PORTFOLIO 73%
H = Highways | P = Power | R = Railway | W = Water
*Projects above Rs 50 billion in size on which less than 5 percent of the expenditure has beenincurred.
Source: Planning Commission, PSDP, 2014-15.

Dr. HAFIZ A PASHA | PROGRESSIVE FISCAL POLICY FOR INCLUSIVE GROWTH
81
7.4. Other Development Expenditure
The breakup of the other development is given in Table 7.7. This is a relatively new
expenditure head. It was initially created to primarily accommodate the allocation to the
Benazir Income Support Program (BISP). Since then, the expenditure on subsidizing
imported fertilizer has been brought into this. In 2013-14, there was a large transfer
once-off of Rs 157 billion to the Pakistan Development Fund (PDF) equivalent to the
amount received as ‘a gift’ from a friendly country.
There has been some discussion as to whether this category of expenditure is really
development expenditure. IMF classifies it as part of ‘current’ expenditure. The Government
has preserved the classification of this expenditure as development expenditure because it
understates the revenue deficit.
Table 7.7
Breakup of Other Development Expenditure
by the Federal Government
(Rs in Billion)
2010-11 2013-142014-15
(B.E)
Benazir Income Support Program (BISP) 35.0 70.3 97.2
Grant for PPAF 3.0 14.5 7.7
Subsidy to TCP for Import of Fertilizer - 30.0 25.0
Prime Minister’s Schemes - - 21.0
Others 7.5 174.6* 10.9
TOTAL 45.5 289.4 161.8
Share of BISP (%) 76.9 24.3 60.0
% of GDP 1.1 0.6
*including transfer of Rs 157 billion to the Pakistan Development Fund.
Source:ABS

Dr. HAFIZ A PASHA | PROGRESSIVE FISCAL POLICY FOR INCLUSIVE GROWTH
82
CHAPTER 8
SOCIAL PROTECTION PROGRAMS
In this Chapter, various types of social protection programs are described. Along with
expenditures on basic social services, these programs represent the redistributive role of
fiscal policy. Progressive fiscal policy requires that social protection programs/ schemes
satisfy most of the following criteria.
8.1. Evaluation Criteria
(i) Targeting efficiency: measured by the extent to which a program’s expenditure
actually reaches poor people rather than the relatively well-off segments of the
population. Programs which promote self-targeting by the poor are also ranked
high on this criterion. For example, if the wage rate in a public works
program is kept low enough to attract unemployed workers only and not divert
workers from other jobs. Alternatively, provision of subsidy for a coarse or low
quality food grain is likely to be availed only by relatively low income
households.
(ii) Extent of program coverage: the proportion of poor households which receive
benefits from the program;
(iii) Degree of ease of access: the level of transactions costs imposed on eligible
households in accessing to the program, as indicated by the simplicity and
transparency of procedures, documentation requirements and level of discretion
with program officials in the disbursement of benefits. Programs with relative
ease of access can be ranked ‘high’ on this criterion;
(iv) Percentage of program expenditure dedicated to benefits: measured by how
much of the program budget is spent on benefits rather than on administrative
costs;
(v) Adequacy of support: the extent to which the benefit reduces the poverty of a
recipient;

Dr. HAFIZ A PASHA | PROGRESSIVE FISCAL POLICY FOR INCLUSIVE GROWTH
83
(vi) Income equivalence of transfer: the extent to which the transfer is equivalent
to a cash transfer and does not distort consumption choices of beneficiaries.
For example, an open-ended subsidy on a good or service may lead to
over-consumption and waste;
(vii) Absence of negative incentive effects: anti-poverty interventions can change
behavior. For example, an unemployment benefit may reduce the motivation for
job search. On the other hand, school food programs can raise school
participation and reduce dropout rates;
(viii) Extent of self finance / progressive financing: programs which raise funding
through well-defined and earmarked sources are likely to be more sustainable
fiscally. A program is more secure if it is supported by higher income
households rather than general budgetary sources which are vulnerable to
inflation and cut-back when the fiscal position worsens as has happened in
Pakistan during the last few years;
(ix) Degree of independence from private transfers: a transfer should ideally not
displace corresponding transfers by households or private sector entities. An
example of substitution is the Zakat whereby compulsory deductions may lead
to a, more or less, matching reduction in private charitable contributions;
(x) Degree of impact on development: programs can contribute either directly or
indirectly to development. A public works program, for example, could lead to
the creation of improved irrigation or farm-to-market roads and thereby
contribute to high agricultural productivity.
8.2. The Social Protection Programs
There are five types of social protection programs in Pakistan, as follows:
Social security (pensions)
Cash Assistance
Price Subsidy
Employment Programs
Education and Training Programs

Dr. HAFIZ A PASHA | PROGRESSIVE FISCAL POLICY FOR INCLUSIVE GROWTH
84
Social Security: Pensions are provided to civil and military personnel on fulfillment of some
conditions. It is estimated that half the annual payment of pensions is made to relatively
low level former employees.
The other major social security program is for workers in the form of the EOBI (see Box
8.1). There is also a Workers’ Welfare Fund WWF (see Box 8.2).
Cash Assistance: The largest program is the Benazir Income Support Program (BISP),
which today covers almost half the poor household in the country (see Box 8.3). The
other programs like Zakat and Baitul Maal have a genesis in the religion but are relatively
small.
Price Subsidy: The biggest mechanism of social protection in Pakistan today is the large
subsidy to life-line consumers of electricity. This is costing as much as Rs 140 billion
today. It is a big part of the TDS given to the power sector. There is a strong case for
targeting this subsidy, as currently an inflated number of 17 million electric consumers are
claiming this benefit.
The other major subsidy is the wheat price subsidy, given mostly by the Provincial
governments. It is a generalized subsidy and should be made a more targeted subsidy.
The Utility Stores Corporation (USC) has a chain of outlets in urban areas which sell
food items like atta, sugar, ghee, etc., at prices lower than those prevailing in the market.
But USC has only limited coverage, It is accessible to all income groups although quality
is low and prone to leakages.
Employment Programs: These programs primarily involve the provision of micro-credit. The
PPAF has the largest clientage, but still covers only 10 percent of the potential borrowers.
Education and Training Programs: Given the serious nature of the youth employment issue,
the Federal Government has started under the PM’s name a number of schemes.
Provincial Governments, especially of Punjab, are also getting increasingly active in this
area.

Dr. HAFIZ A PASHA | PROGRESSIVE FISCAL POLICY FOR INCLUSIVE GROWTH
85
Perhaps contrary to expectations, the total outlay on social protection in Pakistan is quite
large. It is estimated at Rs 439 billion in 2013-14, as shown in Chart 1, equivalent to 1.7
percent of the GDP. The largest share is of price subsidy (39.4 percent) followed by
Social Security (29.4 percent) and Cash Assistance (17.5 percent.)
Table 8.1
Outlays on Different Social Protection Programs in Pakistan
(Rs in Billion)
Scheme Benefits FinancingOutlay
(2013-14)
1. SOCIAL SECURITY
Civil / Ministry Pension Fund Pensions Federal andProvincial Budgets
115a
Employees Old-Age BenefitsInstitution (EOBI)
Old age Pension
Invalid Pension
Survivor’s Pensionfor Workers
Employer’sContribution
EmployeesContribution
9
Workers Welfare Fund Schools
Hospitals
Housing forWorkers
Employers’Contribution
5
TOTAL 129
2. CASH ASSISTANCE
Benazir Income Support Program Cash Assistance Federal Budget 70
Zakat Cash Assistance Deduction fromBank Deposits
5
Baitul Maal Cash Assistance Federal Budget 2
TOTAL 77

Dr. HAFIZ A PASHA | PROGRESSIVE FISCAL POLICY FOR INCLUSIVE GROWTH
86
3. PRICE SUBSIDY
Subsidy to Life-Line Consumersof Electricity (Rs 2 / kwh)
Lower Price ofElectricity
Federal Budget 140
Subsidy on Procurement Lower Whet Price Federal Budget(PASSCO)
27
Utility Stores Corporation (USC) Lower Price ofFood Items
Federal Budget 6
TOTAL 173
4. EMPLOYMENT PROGRAMS
Pakistan Poverty Alleviation Fund(PPAF)
Microcredit Federal Budget 15
PM’s Schemes Interest Free Loans
Business Loans
Federal Budget 10
Punjab Yellow Cab Scheme Subsidized Creditfor CommercialVehicles
Provincial Budget 4
TOTAL 29
(Continued…)a 50 percent of the pensions are assumed to be received by low –level employees.

Dr. HAFIZ A PASHA | PROGRESSIVE FISCAL POLICY FOR INCLUSIVE GROWTH
87
(…Continued)
Table 8.1
Outlays on Different Social Protection Programs in Pakistan
(Rs in Billion)
Scheme Benefits FinancingOutlay
(2013-14)
5. EDUCATION AND TRAINING PROGRAMS
PMs Schemes:
o Fee Reimbursement Scheme
o Youth Training
o Youth Skill Development
o Laptop Scheme
SubsidizedEducation andTraining
FederalGovernmentBudget
11
Punjab and Other GovernmentsSchemes
SubsidizedTechnical andVocational Training
Provincial Budgets 20
TOTAL 31
S U M M A R Y
(Rs in Billion) (%)
1. Social Security 129 29.4
2. Cash Assistance 77 17.5
3. Price Subsidy 173 39.4
4. Employment Programs 29 6.6
5. Education and Training Programs 31 7.1
OVERALL TOTALS 439 100.0
%OF GDP 1.7

Dr. HAFIZ A PASHA | PROGRESSIVE FISCAL POLICY FOR INCLUSIVE GROWTH
88
Box 8.1
Employees Old Age Benefits Institution
The EOBI Act 1976 was designed to introduce pensions as per the Constitution. The Act coversall workers in establishments with five or more workers. Currently, over 67,500 establishmentsare actively registered with EOBI and the number of workers ensured is 5.7 million, while485,000 are currently receiving pensions.
The EOBI is based on contributions from employers and employees and receives no subsidy fromthe Government. The employers’ contribution is 5 percent of the minimum wage per worker whilethe employees’ contribution is 1 percent.
Currently, there are four types of pensions: old age pension, invalidity pension, old age grantand survivor’s pension. The minimum pension is Rs 3600 per month. The maximum pension isbased on a formula.
According to the latest cash flow statement, of 2011, EOBI received Rs 9.2 billion ascontributions and Rs 10.9 billion as investment income. Benefits paid to workers added up to Rs9.4 billion. The overhead cost of EOBI was Rs 2.3 billion. The value of assets with EOBI isclose to Rs 200 billion.
Proposals with regard to EOBI are as follows:
(i) The Government has raised the minimum wage recently to Rs 12000 per month. TheEOBI has the financial resources to also raise its minimum pension.
(ii) EOBI has been racked by scandals with regard to its investments. The Board has toexercise more oversight.
(iii) The contributions should be linked not to the minimum wage but to the actual wages.
(iv) The EOBI schemes only cover workers in the formal sector. The self-employed couldalso be covered through an individual pass book system.
(v) Old age insurance was in the Concurrent List of the Constitution, which stands abolishedafter the 18th Amendment. Therefore, this function has to be transferred to the Provinces.This will require the allocation of assets of EOBI to the four Provincial Governments onthe basis of some formula. This is a contentious issue.
(vi) The EOBI coverage should be extended to self-employed persons through a pass booksystem containing a record of their contribution at Rs 6000 per month (5 percent ofminimum wage).

Dr. HAFIZ A PASHA | PROGRESSIVE FISCAL POLICY FOR INCLUSIVE GROWTH
89
Box 8.2
Worker’s Welfare Fund
The Workers Welfare Fund Ordinance, 1971, is the basis for the establishment of theWWF. It aims to provide workers with education and health facilities and low costresidential accommodation. Provincial Workers’ Welfare Boards have been established andthe Provincial ESSIs manage some of the projects.
The law is applicable to all establishments covered by the Shops and EstablishmentsOrdinance, 1968. The FBR collects contributions from establishments at the rate of 2percent of net income. In 2012-13, the total WWF collection was 4.5 billion.
The WWF also makes marriage/wedding grants and death grants.
Box 8.3
Benazir Income Support Program
The genesis of BISP is the sharp rise in food prices, especially of atta, in 2008-09.
Initially, an allocation of Rs 34 billion was made to provide a cash supplement of Rs
1000 per month to poor families throughout Pakistan. The recipient is the adult female
of a family.
Identification of beneficiaries is based on the ‘Poverty Scorecard’, a proxy means
testing technique. Wherever possible the smart card system is being used to distribute
the assistance on a quarterly basis.
A number of special initiatives have been introduced in the BISP. These include
schemes for small loans, skill development, and support for catastrophic illness and for
education of children of beneficiary families.
The BISP is funded entirely from the Federal Budget. The amount disbursed in 2013-
14 was Rs 70 billion, which is being raised to Rs 97 billion in 2014-15. In line with
inflation, the cash assistance per family has been raised from Rs 1200 to Rs 1500
per month. Over 5 million families are being covered by BISP. Almost half the poor in

Dr. HAFIZ A PASHA | PROGRESSIVE FISCAL POLICY FOR INCLUSIVE GROWTH
90
Pakistan are benefiting from BISP.
In the Budget of 2013-14, the Government proposed an earmarked tax, the Income
Support Levy, to provide funds especially for BISP. The levy was 0.5 percent of net
moveable assets of a person. But the levy was challenged in the Courts and has
been withdrawn in the Budget of 2014-15.
Proposals regarding BISP are as follows:
(i) BISP must be seen as the ‘Flagship’ social protection scheme of the
Government, with focus primarily on cash assistance.
(ii) BISP should acquire the characteristics of a Conditional Cash Transfer (CCT)
program. The basic support to families of Rs 1500 per month should be
augmented for inoculation against polio and other diseases of the children in a
recipient family and for sending the girl child to school. For this, cooperation
must be sought from the Provincial Governments.
(iii) Efforts should be made to apply the Poverty Score Card periodically on recipient
families to see if their conditions have improved to the extent that they can
‘exit’ from the Program.

Dr. HAFIZ A PASHA | PROGRESSIVE FISCAL POLICY FOR INCLUSIVE GROWTH
91
8.3. Evaluation of Programs
Many of the programs mentioned in Chart 1 are evaluated on the ten criteria given in
Section 8.1. The results are given in Chart 2.
The evaluation / rating formula is as follows:
(a) for an evaluation criteria
If rated Score
High (H) 4
Medium (M) 2
Low (L) 0
(b) The maximum score is 40 and the minimum is zero
(c) All criteria have been equal weight.
The three programs / schemes with the highest scores are the following
Score
1. PPAF (Micro Credit) 28
2. Government Pension Scheme 24
3. BISP 24
The two programs / schemes with the lowest scores are the following
Score
1. Zakat / Baitul Maal 28
2. Utility Stores Corporation 24

Dr. HAFIZ A PASHA | PROGRESSIVE FISCAL POLICY FOR INCLUSIVE GROWTH
92
8.4. Proposals
Based on the principles of progressive fiscal policy, the following proposals are made
regarding social protection programs:
(i) The BISP must be seen as the ‘Flagship’ program. It should be upgraded to a
Conditional Cash Transfers (CCT) with implementation by cooperation with
Provincial governments. Supplements should be given for inoculation and children
and for sending the girl child to school. As more resources become available, the
coverage of BISP should be expanded. There should also a monitoring system for
‘exit’ of households.
(ii) All generalized subsidies should be converted into targeted subsidies, especially the
food (wheat) subsidy.
(iii) The price subsidy on electricity should be restricted to families who fall below a
particular score in the Poverty Score Card and with an electricity connection. For
other consumers, the tariff may be raised gradually from Rs 2 to Rs 4 per kwh,
as the load shedding situation improves. Savings should be diverted to BISP.
(iv) The EOBI has sufficient financial resources. As such, within the next two years the
minimum pension should be raised from Rs 3600 to 6000 per month. The latter
is the minimum pension for government employees. Employers’ contribution must be
raised accordingly and linked to the actual wage bill.
(v) ‘Social Welfare’ has been transferred as a function to the Provincial Governments
after the 18th Amendment. As such, the Federal Government should avoid launching
new populist schemes. It is indeed unusual to see the Prime Minister of a country
distributing laptops!

Dr. HAFIZ A PASHA | PROGRESSIVE FISCAL POLICY FOR INCLUSIVE GROWTH
93
Chart 2
Evaluation of Programs
Criteria BISP
Zakat/Baitul
-Maal
Govt.Pensions
(lowgrades)
EOBI
Electricity
Subsidy
Wheat
Subsidy
USC
PPAF
PM’sSchem
es
Numberof
Schemes with
H
Targeting Efficiency H M H H M L L H L 4
Extent of ProgramCoverage
H L L L H M L L L 1
Degree of Ease ofAccess
L H L L M H M L M 2
Share of Benefitin ProgramExpenditure
M M H M M L L M L 1
IncomeEquivalence ofProgram Benefits
H H H H M M M H H 6
Absence ofNegative
Incentive Effects
M M H M L M H H H 4
Adequacy ofSupport
M L M L H M L H M 2
Extent of Self/ProgressiveFinance
M H M H L M M M M 2
Degree ofIndependence fromPrivate Transfers
H L H H H H H H H 8
Degree of Impacton Development
L L L L L H L H M 2
SCORES 24 10 24 20 20 22 14 28 20
High (H) 4 3 5 4 3 3 1 6 3
Medium (M) 4 3 2 2 4 5 3 2 4
Low (L) 2 4 3 4 3 2 5 2 3

Dr. HAFIZ A PASHA | PROGRESSIVE FISCAL POLICY FOR INCLUSIVE GROWTH
94
CHAPTER 9
MEDIUM-TERM BUDGET STRATEGY
This final chapter brings together the key elements of progressive fiscal policy, discussed
the previous chapters, for inclusive growth into a medium-term budget strategy (MTBS).
Section 9.1 presents the MTBS of the Government for the period up to 2016-17. Section
9.2 then highlights the MTBs proposed by us. A statement is made of the key differences
with the Government’s MTBS.
9.1. The Government’s MTBS
The Government’s MTBs is presented in Table 9.1. It is unfortunately too aggregate in
character and does not highlight the projected budgetary outcomes for the Federal and
Provincial governments.
Table 9.1
Medium-Term Budgetary Strategy of the GOP
Budget
2013-14
RevisedForecast
2013-14
Budget
2014-15
Forecast
2015-16 2016-17
Real GDP Growth (%) 4.4 4.1 5.1 6.1 7.2
Inflation (%) 8.0 8.5 8.0 8.0 8.0
(as percentage of GDP unless otherwise indicated)
Total Revenue 14.0 15.1 14.5 14.6 15.1
Tax Revenue 10.9 10.6 11.5 12.1 12.9
FBR Tax Revenue 9.5 9.0 9.7 10.4 11.1
Total Expenditure 20.4 20.9 19.4 18.6 19.0
Current 15.2 16.2 15.2 14.1 14.2
Development 5.1 4.7 4.2 4.4 4.8
Fiscal Balance -6.3 -5.8 -4.9 -4.0 -4.0
Revenue Balance -1.2 -1.1 -0.7 0.4 0.9

Dr. HAFIZ A PASHA | PROGRESSIVE FISCAL POLICY FOR INCLUSIVE GROWTH
95
Total Public Debt 61.3 62.0 58.7 55.3 51.5
GDP at market prices(Rs in Billion)
26,001 25,402 29,078 33,667 39,250
The key targets in this MTBS are as follows:
(i) Raise the tax revenue to GDP ratio from 10.6 percent in 2013-14 by 2.3
percentage points to 12.9 percent by 2016-17.
(ii) Reduce the current expenditure as percentage of the GDP by two percentage points
from 16.2 percent in 2013-14 to 14.2 percent in 2016-17.
(iii) Keep development expenditure, more or less, at the same level in 2016-17 as in
2013-14.
(iv) Use the higher revenues and lower current expenditure ratios to bring the fiscal
deficit down by almost two percentage points by 2016-17 to 4 percent of the
GDP.
Before, a comment can be made on the above MTBS, it is necessary to highlight a
serious error in the numbers for 2014-15. The level of development expenditure for the
year is estimated at 4.1 percent of the GDP. But this is only the budgeted PSDP / ADP
expenditures combined of the Federal and Provincial Governments. It does not include
‘other development expenditure’ of Rs 160 billion and ‘development lending’ of Rs 120
billion. This raises the development expenditure projection for 2014-15 from 4 percent to 5
percent of the GDP. Consequently, the expected fiscal deficit in 2014-15 is 5.9 percent of
the GDP and not 4.9 percent of the GDP. Of course, this violates the target agreed with
the IMF.
The fundamental flaw with the Government’s MTBF is that it does not create any fiscal
space for the larger portfolio of projects in the Federal PSDP as highlighted in Chapter
7.Inevitably, the annual size of the PSDP in 2015-16 and 2016-17 will have to be
substantially larger if the energy sector development program and other ‘mega’ projects are
to be executed.

Dr. HAFIZ A PASHA | PROGRESSIVE FISCAL POLICY FOR INCLUSIVE GROWTH
96
9.2. The Alternative MTBS
The alternative MTBS is presented in Table 9.2. It has much greater disaggregation than
the Government’s MTBS. The objective is to clearly implement the key recommendations in
the previous Chapters and to show them explicitly, as follows:
(i) As suggested in Chapter 5, the overall tax-to-GDP is proposed to be raised by
two percentage points, with half the increase coming from direct taxes and the
remaining half from direct taxes.
Table 9.2
Alternative Medium-Term Budget Strategy
2014-15 to 2016-17
(% of GDP)
2013-14 2014-15 2015-16 2016-17
A. Total Tax Revenue by tax: 10.6 11.2 11.9 12.6
Direct Taxes 3.6 3.8 4.2 4.6
Indirect Taxes 7.0 7.4 7.7 8.0
By Government: 50.1 46.5 47.0 42.8
Federal 9.9 10.4 10.9 11.3
Provincial 0.7 0.8 1.0 1.1
B. Total Non-Tax Revenue 4.5 3.1 3.3 3.5
Federal 4.2 2.8 2.9 3.0
Provincial 0.3 0.3 0.4 0.5
C. Total Revenues 15.1 14.3 15.2 15.9
Federal 14.1 13.2 13.8 14.3
Provincial 1.0 1.1 1.4 1.6
D. Net Transfer of Federal Revenues
to Provinces
-5.5 -5.7 -6.0 -6.2
E. Net Revenue Receipts of the
Federal Government
8.6 7.5 7.8 8.1

Dr. HAFIZ A PASHA | PROGRESSIVE FISCAL POLICY FOR INCLUSIVE GROWTH
97
F. Federal Budget 8.6 7.5 7.8 8.1
F.1. Net Revenue Receipts 8.6 7.5 7.8 8.1
F.2. Current Expenditure 11.6 11.1 10.6 10.1
Debt Servicing 4.7 4.6 4.8 5.0
Defence 2.5 2.7 2.6 2.5
Grants 1.5 1.3 1.0 0.7
Subsidies 0.7 0.6 0.5 0.4
Others 1.6 1.9 1.7 1.5
G. Development Expenditure 3.1 2.8 3.3 4.1
G.1. PSDP 1.7 1.8 2.4 3.3
Infrastructure 1.2 1.0 1.8 2.5
Social Services 0.2 0.2 0.2 0.2
Other 0.3 0.6 0.4 0.4
G.2. Other Development Expenditure
and Net Lending
1.4 1.0 0.9 0.8
H. Federal Fiscal Deficit -6.1 -6.4 -6.1 -6.1
Memo Items
GDP Growth Rate (%) 4.1 4.0 4.5 5.0
Rate of Inflation 8.6 8.5 8.0 8.0
(ii) The Federal tax to GDP ratio is projected increase by 1.4 percent of the GDP and
the provincial ratio by 0.6 percent of the GDP, in line also with the analysis in
Chapter 5.
(iii) The provincial non-tax-to-GDP is increased by 0.2 percentage points, based on
the proposals in Chapter 3 of increase in irrigation charges, highway tolls and fees
for higher education.

Dr. HAFIZ A PASHA | PROGRESSIVE FISCAL POLICY FOR INCLUSIVE GROWTH
98
(iv) The transfer of revenues from the Federal to the Provincial Governments is based
on the assumption that there will be no material change in the vertical sharing
formula in the forthcoming 8th NFC Award, in light of the Article 160(3A) in the
Constitution.
(v) Current expenditure of the Federal Government is expected to fall by 1.5 percent of
the GDP by 2016-17. This is consistent with the analysis carried out in Chapter
6. Debt servicing will rise moderately, but grants, subsidies and costs of civil
administration are expected to come down significantly in line with the proposals
made in the Chapter.
(vi) A major provision is made for a quantum jump in the size of the PSDP, especially
the federal component, of over 1.5 percent of the GDP, in line with the execution
of the Energy Sector Development Plan, described in Chapter 7.
(vii) The Federal fiscal deficit is expected to remain close to 6 percent throughout the
period. This is likely to also be the consolidated fiscal deficit as the Provincial
Governments will probably carry balanced budgets.
(viii) The availability of financial resources with the Provincial Governments is projected to
rise from 6.5 percent of the GDP in 2013-14 to 7.8 percent of the GDP by
2016-17. This should enable Provinces to raise their social sector spending by at
least 1 percent of the GDP and also spend more on agriculture, irrigation and
energy.
What is the impact of a 6 percent deficit or slightly more on public debt? This is derived
in Table 9.3. The public debt to GDP ratio falls in this MTBS from 62.3 percent of the
GDP in 2013-14 to below 60 percent by 2016-17. This is the ceiling imposed by the
Fiscal Responsibility and Debt Limitation Act.

Dr. HAFIZ A PASHA | PROGRESSIVE FISCAL POLICY FOR INCLUSIVE GROWTH
99
Table 9.3
Projected Level of Public Debt
(Rs in Billion)
2013-14 2014-15 2015-16 2016-17
GDP 25402 28663 32349 36684
Fiscal Deficit 1550 1834 1973 2237
Public Debt 15826 17660 19633 21870
Public Debt as % of GDP 62.3 61.6 60.7 59.6
In conclusion, the report has highlighted in-depth the elements of progressive fiscal policy,
both on the revenue and expenditure side. Many may consider this as a ‘wish list’,
especially on the taxation side which is unlikely to be implemented given the prevailing
power structure in the country. But we have proceeded to develop the contours of
progressive fiscal policy to demonstrate how far we are from the ‘ideal’ and in the hope
that a time will come when most of the proposed reforms will be implemented.

Dr. HAFIZ A PASHA | PROGRESSIVE FISCAL POLICY FOR INCLUSIVE GROWTH
100
ANNEXURE-1
73 Procedure with respect to Money Bill.
163[
(1) Notwithstanding anything contained in Article 70, a Money Bill shall originate in theNational Assembly:
Provided that simultaneously when a Money Bill, including the Finance Bill containing theAnnual Budget Statement, is presented in the National Assembly, a copy thereof shall betransmitted to the Sentate which may, within fourteen days, make recommendations thereonto the National Assembly.
(1A) The National Assembly shall consider the recommendations of the Senate and afterthe Bill has been passed by the Assembly with or without incorporating therecommendations of the Senate, it shall be presented to the President for assent.
] 163
(2) For the purpose of this Chapter, a Bill or amendment shall be deemed to be aMoney Bill if it contains provisions dealing with all or any of the following matters,namely:-
(a) the imposition, abolition, remission, alteration or regulation of anytax;
(b) the borrowing of money, or the giving of any guarantee, by theFederal government, or the amendment of the law relating to thefinancial obligations of that Government;
(c) the custody of the Federal Consolidated Fund, the payment ofmoneys into, or the issue of moneys from, that Fund;
(d) the imposition of a charge upon the Federal Consolidated Fund, orthe abolition or alteration of any such charge;
(e) the receipt of moneys on account of the Public Account of theFederation, the custody or issue of such moneys;

Dr. HAFIZ A PASHA | PROGRESSIVE FISCAL POLICY FOR INCLUSIVE GROWTH
101
(f) the audit of the accounts of the Federal Government or a ProvincialGovernment; and
(g) any matter incidental to any of the matters specified in thepreceding paragraphs.
(3) A Bill shall not be deemed to be a Money Bill by reason only that it provides:-
(a) for the imposition or alteration of any fine or other pecuniarypenalty, or for the demand or payment of a licence fee or a feeor charge for any service rendered; or
(b) for the imposition, abolition, remission, alteration or regulation ofany tax by any local authority or body for local purposes.
(4) If any question arises whether a Bill is a Money Bill or not, the decision of theSpeaker of the National Assembly thereon shall be final.
(5) Every Money Bill presented to the President for assent shall bear a certificate underthe hand of the Speaker of the National Assembly that it is a Money Bill, andsuch certificate shall be conclusive for all purposes and shall not be called inquestion.
80 Annual Budget Statement.(1) The Federal Government shall, in respect of every financial year, cause to be laid
before the National Assembly a statement of the estimated receipts and expenditureof the Federal Government for that year, in this Part referred to as the AnnualBudget Statement.
(2) The Annual Budget Statement shall show separately-
(a) the sums required to meet expenditure described by the Constitutionas expenditure charged upon the Federal Consolidated Fund; and
(b) the sums required to meet other expenditure proposed to be madefrom the Federal Consolidated Fund; and shall distinguishexpenditure on revenue account from other expenditure.
82 Procedure relating to Annual Budget Statement.(1) So much of the Annual Budget Statement as relates to expenditure charged upon
the Federal Consolidated Fund may be discussed in, but shall not be submitted tothe vote of, the National Assembly.

Dr. HAFIZ A PASHA | PROGRESSIVE FISCAL POLICY FOR INCLUSIVE GROWTH
102
(2) So much of the Annual Budget Statement as relates to other expenditure shall besubmitted to the National Assembly in the form of demands for grants, and theAssembly shall have power to assent to, or to refuse to assent to, any demand,or to assent to any demand subject to a reduction of the amount specified therein;
Provided that, for a period of ten years from the commencing day or the holdingof the second general election to the National Assembly, whichever occurs later, ademand shall be deemed to have been assented to without any reduction of theamount specified therein, unless, by the votes of a majority of the total membershipof the Assembly, it is refused or assented to subject to a reduction of the amountspecified therein.
(3) No demand for a grant shall be made except on the recommendation of theFederal Government.
84 Supplementary and excess grants.If in respect of any financial year it is found-
(a) that the amount authorized to be expended for a particular service for the currentfinancial year is insufficient, or that a need has arisen for expenditure upon somenew service not included in the Annual Budget Statement for that year; or
(b) that any money has been spent on any service during a financial year in excessof the amount granted for that service for that year; the Federal Government shallhave power to authorize expenditure from the Federal Consolidated Fund, whetherthe expenditure is charged by the Constitution upon that Fund or not, and shallcause to be laid before the National Assembly a Supplementary Budget Statementor, as the case may be, an Excess Budget Statement, setting out the amount ofthat expenditure, and the provisions of Articles 80 to 83 shall apply to thosestatements as they apply to the Annual Budget Statement.
88 Finance Committees.
(1) The expenditure of the National Assembly and the Senate within authorisedappropriations shall be controlled by the National Assembly or, as the case maybe, the Senate acting on the advice of its Finance Committee.
(2) The Finance Committee shall consist of the Speaker or, as the case may be, theChairman, the Minister of Finance and such other members as may be electedthereto by the National Assembly or, as the case may be, the Senate.
(3) The Finance Committee may make 183 rules for regulating its procedure.Ordinances.

Dr. HAFIZ A PASHA | PROGRESSIVE FISCAL POLICY FOR INCLUSIVE GROWTH
103
BIBLIOGRAPHY
Institute of Public Policy, Annual Review, 2012.
SRB, Expansion of the Tax Base, 2013.
Institute of Public Policy, Development of Sub-National Taxes, FBR/GIZ, 2013.
Pasha, Hafiz A. ‘Strategy for Tax Reforms’, FBR, 2013.
SPDC, Hidden Subsidies, 2002.
SPDC, Poverty Estimates, 2011.
SPDC, Household Integrated Economic Survey, various years.
FBR, Quarterly Reviews, various issues.
Kemal, A.R. Background Paper for PRSP, 2008.
Pasha, A. G., Revenue Potential of Sub-National Taxes, FBR, 2012.
Wahid and Whalley, ‘Incidence of Taxes in Pakistan’, 2009.
PBS, Labor Force Survey, various issues.
UNESCAP, Tax Reforms in Asia-Pacific, 2014.
Dr. HAFIZ A PASHA | PROGRESSIVE FISCAL POLICY FOR INCLUSIVE GROWTH
104
About the author
Dr. Hafiz A. Pasha, is Former FederalMinister for Finance and Economic Affairs,and currently Managing Director of theInstitute for Policy Reforms, Lahore
Imprint:
Friedrich-Ebert-StiftungPakistanNo. 10-A, Street No. 31, F-8/1,Islamabad, Pakistan.
Responsible:Philipp KauppertResident DirectorFriedrich-Ebert-Stiftung, Pakistan
Phone: +92 51 2850912-6Fax: +92 51 2850917Email: [email protected]: www.fes-pakistan.org
Commercial use of all media publishedby the Friedrich-Ebert-Stiftung (FES) isnot permitted without the written consentof the FES.
Disclaimer:
The views expressed in this publication are notnecessarily those of the Friedrich-Ebert-Stiftung.