progress report research projects funded by the … · progress report research projects funded by...
TRANSCRIPT

1 | P a g e
Progress Report
Research projects funded by the Childhood Eye Cancer Trust
All information provided in this report is confidential, unless stated otherwise
Name
Dr. Subramanian Krishnakumar
Vision Research Foundation,
Sankara Nethralaya
Chennai-600 006, India
Email: [email protected]
Collaborators and Co-I from USA
Dr. Raghuraman Kannan (PI)
Associate Professor, Departments of Radiology and Bioengineering
Dr. Anandhi Upendran (Co-I)
Director- Biomedical Innovation,
Institute of Clinical and Translational Sciences (MU
School of Medicine
University of Missouri - Columbia
206 Alton Bldg., 301 Business Loop, 70W
Columbia, MO- 65203
Date: 11-07-2016
Date: 16-october-2014 awarded
Project title: Use of Aptamers to increase the efficacy of HMGA2 targeted therapy in
Retinoblastoma
Date awarded &
value:
GBP 47,297.52 for 2 years

2 | P a g e
Vision Research
Foundation:
GBP 23,511.53 for 2 years
Missouri
University:
GBP 23,784.81 for 2 years
CHECT grant update
As we faced delivery issues with HMA2 siRNA in our earlier work, we adapted a different
strategy for delivering HMGA2 siRNA using nucleolin aptamer and bispecific linker
(Lai et al, 2014). We conjugated nucleolin aptamer and HMGA2 siRNA using a bispecific linker
sulfo SMPB. For this conjugation the 5’ and 3’ end of nucleolin aptamer was modified with
amine group and fluorescein respectively. The 5’ end of HMGA2 siRNA was modified with
thiol group and all ‘C’ and ‘U’ of sense strand of siRNA was 2’fluoro modified to increase the
stability.
Figure 1: Schematic representation of conjugation of amine modified nucleolin aptamer and
thiol modified HMGA2 siRNA using Sulfo SMPB linker.
Step 1 Step 2
Step 3
3 | P a g e
Fluorescein channel
EtBr channel
Merged image
1 2 3 4 5 6 7
bp
300200150
10075
50
35
25
20
15
A C
B
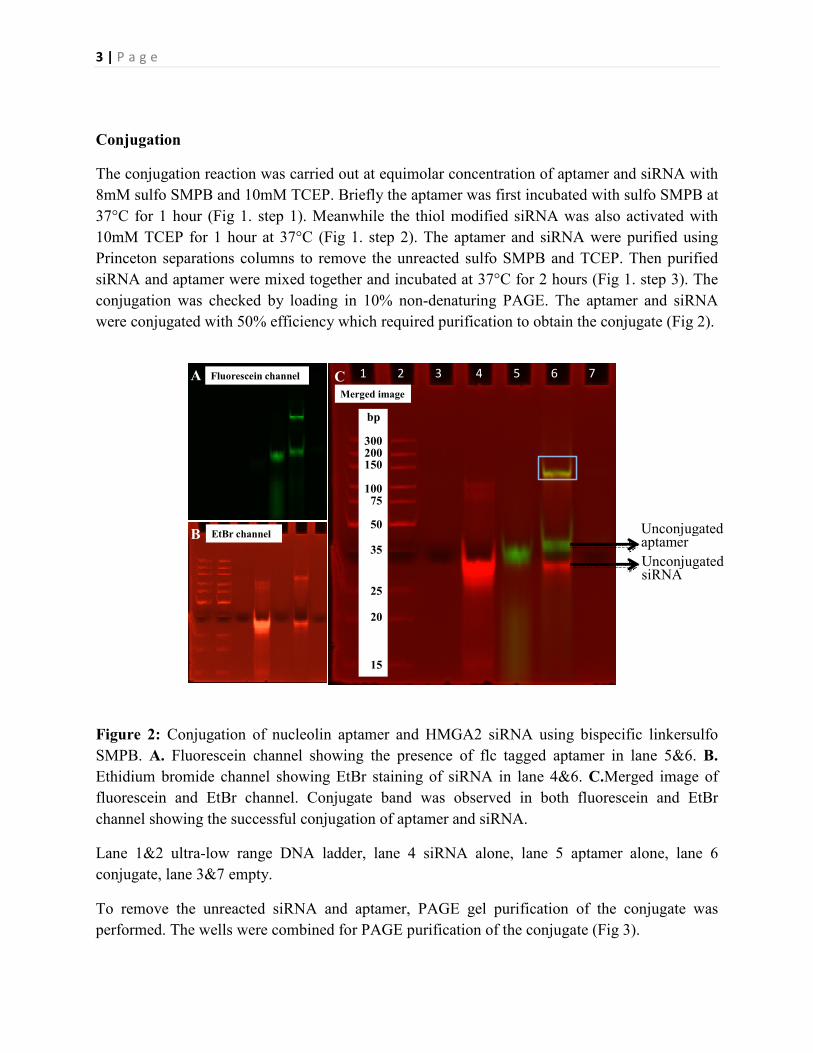
Conjugation
The conjugation reaction was carried out at equimolar concentration of aptamer and siRNA with
8mM sulfo SMPB and 10mM TCEP. Briefly the aptamer was first incubated with sulfo SMPB at
37°C for 1 hour (Fig 1. step 1). Meanwhile the thiol modified siRNA was also activated with
10mM TCEP for 1 hour at 37°C (Fig 1. step 2). The aptamer and siRNA were purified using
Princeton separations columns to remove the unreacted sulfo SMPB and TCEP. Then purified
siRNA and aptamer were mixed together and incubated at 37°C for 2 hours (Fig 1. step 3). The
conjugation was checked by loading in 10% non-denaturing PAGE. The aptamer and siRNA
were conjugated with 50% efficiency which required purification to obtain the conjugate (Fig 2).
Figure 2: Conjugation of nucleolin aptamer and HMGA2 siRNA using bispecific linkersulfo
SMPB. A. Fluorescein channel showing the presence of flc tagged aptamer in lane 5&6. B.
Ethidium bromide channel showing EtBr staining of siRNA in lane 4&6. C.Merged image of
fluorescein and EtBr channel. Conjugate band was observed in both fluorescein and EtBr
channel showing the successful conjugation of aptamer and siRNA.
Lane 1&2 ultra-low range DNA ladder, lane 4 siRNA alone, lane 5 aptamer alone, lane 6
conjugate, lane 3&7 empty.
To remove the unreacted siRNA and aptamer, PAGE gel purification of the conjugate was
performed. The wells were combined for PAGE purification of the conjugate (Fig 3).
Unconjugated aptamer
Unconjugated siRNA

4 | P a g e
Fluorescein channel
EtBr channel
Merged image
1 2 3 4 5 6 7 8
bp
300
200150
100
75
50
35
25
A C
B
Figure 3:Purification of conjugate using 10% non-denaturing PAGE. A. Fluorescein channel
showing the presence of flc tagged aptamer in lane 4 and 7&8 B. Ethidium bromide channel
showing EtBr staining of siRNA in lane 5 and 7&8. C. Merged image of fluorescein and EtBr
channel.
Lane 2 ultra-low range DNA ladder, lane 4aptamer alone, lane 5 siRNA alone, lane 7&8
conjugate, lane 1,3&6 empty.
The conjugate band was excised from the gel and was subjected to modified crush and soak
method (Chen &Ruffner, 1996). The gel slice was crushed with 0.1M sodium acetate pH 6.0.
The mixture was then incubated in boiling water bath for 5 mins followed by freezing at -80°C
for 5 mins. Then it was spun down and the supernatant containing conjugate was collected. To
remove sodium acetate, the conjugate was passed through Princeton columns and loaded onto gel
to check the stability of the conjugate after purification. The conjugate remained intact after
purification (Fig 4) and was used for further studies. The concentration of the conjugate was
quantified using Nano drop spectrophotometer and the molar concentration was calculated based
on the molecular weight of the siRNA.
5 | P a g e
Fluorescein channel
EtBr channel
Merged image
1 2 3 4 5 6 7 8
bp
30020015010075
50
35
25
15
A C
B
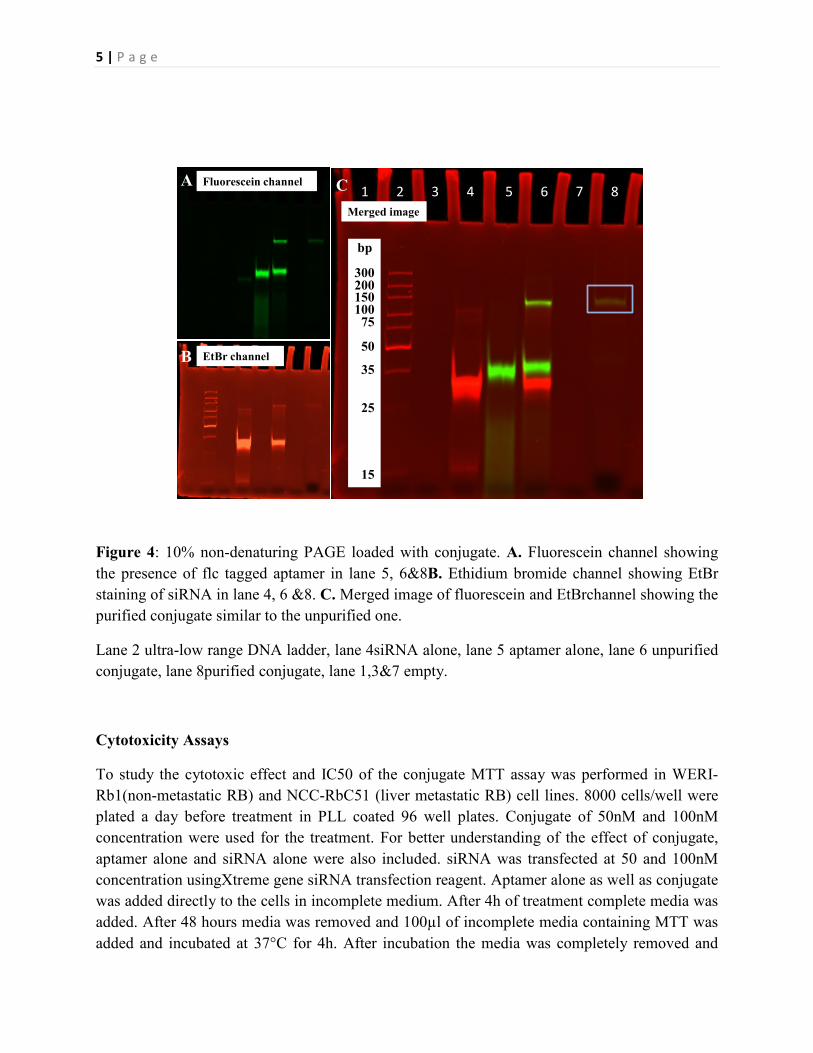
Figure 4: 10% non-denaturing PAGE loaded with conjugate. A. Fluorescein channel showing
the presence of flc tagged aptamer in lane 5, 6&8B. Ethidium bromide channel showing EtBr
staining of siRNA in lane 4, 6 &8. C. Merged image of fluorescein and EtBrchannel showing the
purified conjugate similar to the unpurified one.
Lane 2 ultra-low range DNA ladder, lane 4siRNA alone, lane 5 aptamer alone, lane 6 unpurified
conjugate, lane 8purified conjugate, lane 1,3&7 empty.
Cytotoxicity Assays
To study the cytotoxic effect and IC50 of the conjugate MTT assay was performed in WERI-
Rb1(non-metastatic RB) and NCC-RbC51 (liver metastatic RB) cell lines. 8000 cells/well were
plated a day before treatment in PLL coated 96 well plates. Conjugate of 50nM and 100nM
concentration were used for the treatment. For better understanding of the effect of conjugate,
aptamer alone and siRNA alone were also included. siRNA was transfected at 50 and 100nM
concentration usingXtreme gene siRNA transfection reagent. Aptamer alone as well as conjugate
was added directly to the cells in incomplete medium. After 4h of treatment complete media was
added. After 48 hours media was removed and 100µl of incomplete media containing MTT was
added and incubated at 37°C for 4h. After incubation the media was completely removed and
6 | P a g e
Number of families 1 WERI-Rb1
Number of comparisons per family 21
Alpha 0.05
Tukey's multiple comparisons test Mean Diff. 95% CI of diff. Significant? Summary
Control vs. siRNA 50nM 13.73 7.449 to 20.01 Yes ****
Control vs. siRNA 100nM 21.25 14.96 to 27.53 Yes ****
Control vs. Aptamer 50nM 29.02 22.74 to 35.30 Yes ****
Control vs. Aptamer 100nM 28.95 22.67 to 35.23 Yes ****
Control vs. Conjugate 50nM 40.69 34.41 to 46.97 Yes ****
Control vs. Conjugate 100nM 52.57 46.29 to 58.85 Yes ****
siRNA 50nM vs. siRNA 100nM 7.515 1.234 to 13.80 Yes *
siRNA 50nM vs. Aptamer 50nM 15.29 9.008 to 21.57 Yes ****
siRNA 50nM vs. Aptamer 100nM 15.22 8.937 to 21.50 Yes ****
siRNA 50nM vs. Conjugate 50nM 26.96 20.68 to 33.24 Yes ****
siRNA 50nM vs. Conjugate 100nM 38.84 32.56 to 45.12 Yes ****
siRNA 100nM vs. Aptamer 50nM 7.774 1.493 to 14.06 Yes *
siRNA 100nM vs. Aptamer 100nM 7.703 1.422 to 13.98 Yes *
siRNA 100nM vs. Conjugate 50nM 19.45 13.16 to 25.73 Yes ****
siRNA 100nM vs. Conjugate 100nM 31.33 25.05 to 37.61 Yes ****
Aptamer 50nM vs. Aptamer 100nM -0.07127 -6.352 to 6.210 No ns
Aptamer 50nM vs. Conjugate 50nM 11.67 5.391 to 17.95 Yes ***
Aptamer 50nM vs. Conjugate 100nM 23.55 17.27 to 29.83 Yes ****
Aptamer 100nM vs. Conjugate 50nM 11.74 5.462 to 18.02 Yes ***
Aptamer 100nM vs. Conjugate 100nM 23.62 17.34 to 29.91 Yes ****
Conjugate 50nM vs. Conjugate 100nM 11.88 5.600 to 18.16 Yes ***
1 NCCRbC51
21
0.05
Mean Diff. 95% CI of diff. Significant? Summary
19.64 14.01 to 25.27 Yes ****
24.65 19.02 to 30.28 Yes ****
32.22 26.59 to 37.85 Yes ****
30.27 24.64 to 35.90 Yes ****
41.58 35.95 to 47.21 Yes ****
54.17 48.54 to 59.80 Yes ****
5.015 -0.6151 to 10.65 No ns
12.58 6.953 to 18.21 Yes ****
10.63 5.005 to 16.26 Yes ***
21.94 16.31 to 27.57 Yes ****
34.53 28.90 to 40.16 Yes ****
7.568 1.938 to 13.20 Yes **
5.620 -0.01050 to 11.25 No ns
16.92 11.29 to 22.56 Yes ****
29.52 23.89 to 35.15 Yes ****
-1.949 -7.579 to 3.682 No ns
9.357 3.727 to 14.99 Yes ***
21.95 16.32 to 27.58 Yes ****
11.31 5.675 to 16.94 Yes ***
23.90 18.27 to 29.53 Yes ****
12.59 6.964 to 18.22 Yes ****
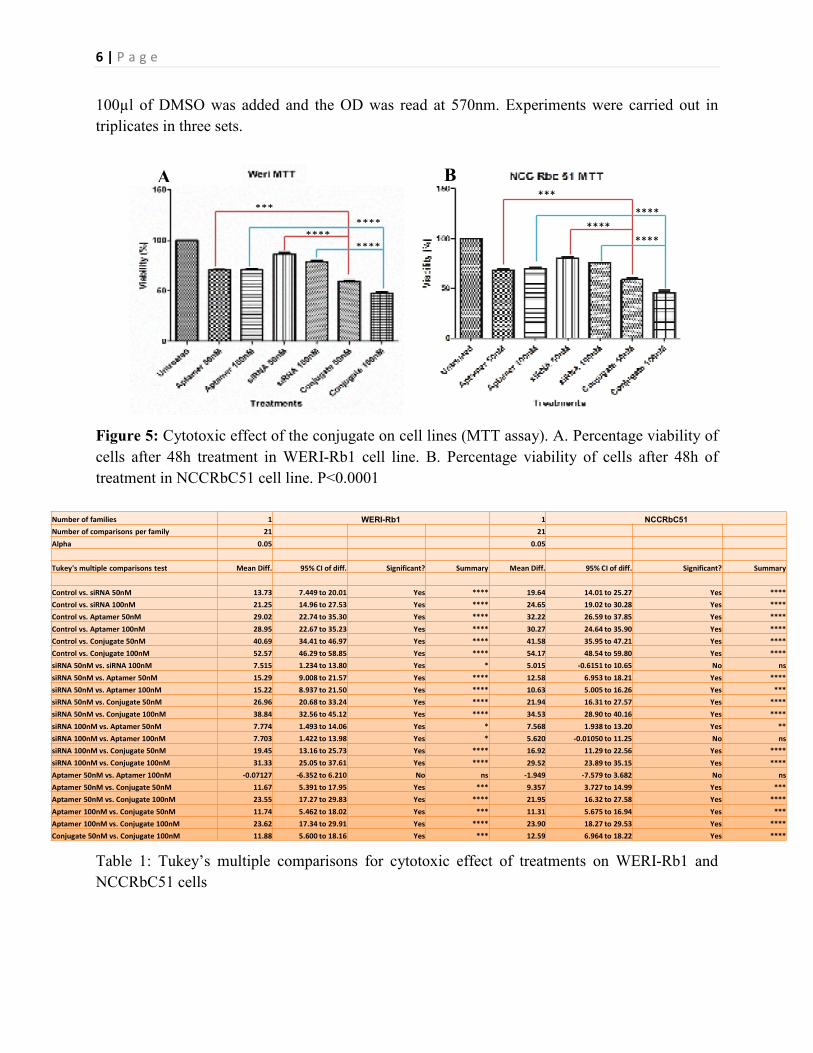
100µl of DMSO was added and the OD was read at 570nm. Experiments were carried out in
triplicates in three sets.
Figure 5: Cytotoxic effect of the conjugate on cell lines (MTT assay). A. Percentage viability of
cells after 48h treatment in WERI-Rb1 cell line. B. Percentage viability of cells after 48h of
treatment in NCCRbC51 cell line. P<0.0001
Table 1: Tukey’s multiple comparisons for cytotoxic effect of treatments on WERI-Rb1 and
NCCRbC51 cells
A B
***
****
****
****
***
****
****
****
7 | P a g e
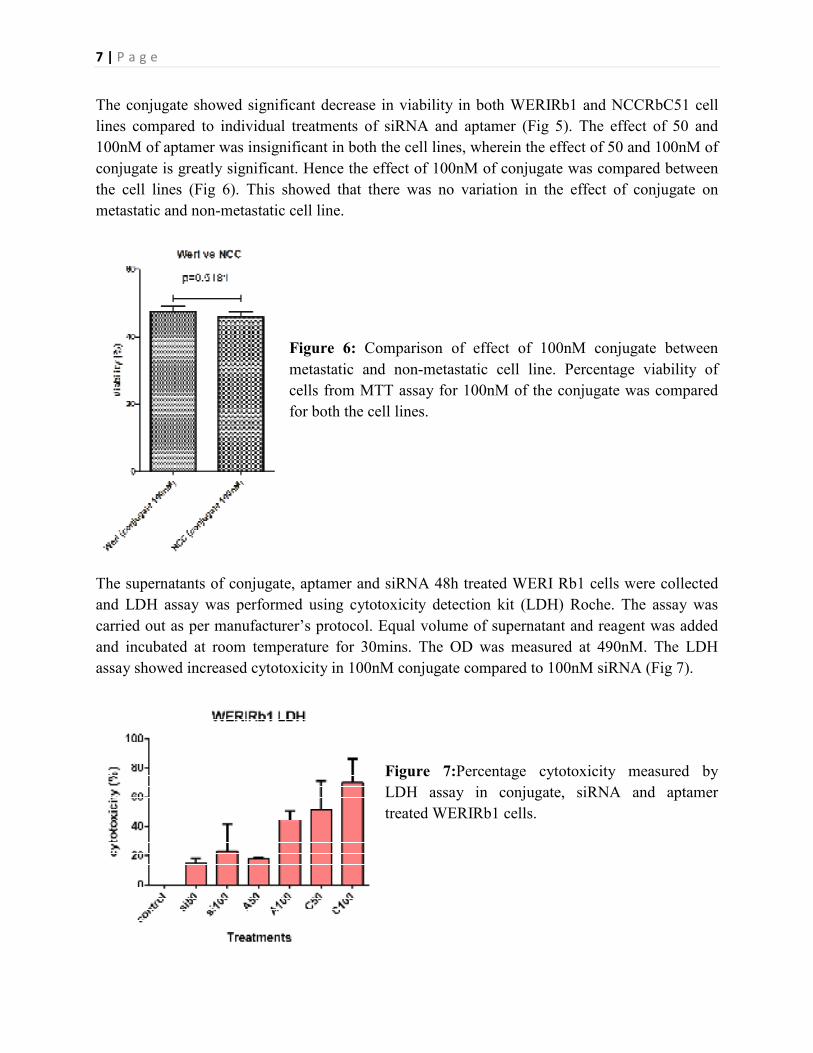
The conjugate showed significant decrease in viability in both WERIRb1 and NCCRbC51 cell
lines compared to individual treatments of siRNA and aptamer (Fig 5). The effect of 50 and
100nM of aptamer was insignificant in both the cell lines, wherein the effect of 50 and 100nM of
conjugate is greatly significant. Hence the effect of 100nM of conjugate was compared between
the cell lines (Fig 6). This showed that there was no variation in the effect of conjugate on
metastatic and non-metastatic cell line.
Figure 6: Comparison of effect of 100nM conjugate between
metastatic and non-metastatic cell line. Percentage viability of
cells from MTT assay for 100nM of the conjugate was compared
for both the cell lines.
The supernatants of conjugate, aptamer and siRNA 48h treated WERI Rb1 cells were collected
and LDH assay was performed using cytotoxicity detection kit (LDH) Roche. The assay was
carried out as per manufacturer’s protocol. Equal volume of supernatant and reagent was added
and incubated at room temperature for 30mins. The OD was measured at 490nM. The LDH
assay showed increased cytotoxicity in 100nM conjugate compared to 100nM siRNA (Fig 7).
Figure 7:Percentage cytotoxicity measured by
LDH assay in conjugate, siRNA and aptamer
treated WERIRb1 cells.
8 | P a g e
0
20
40
60
80
100
120
140
Relative change in HMGA2 mRNA
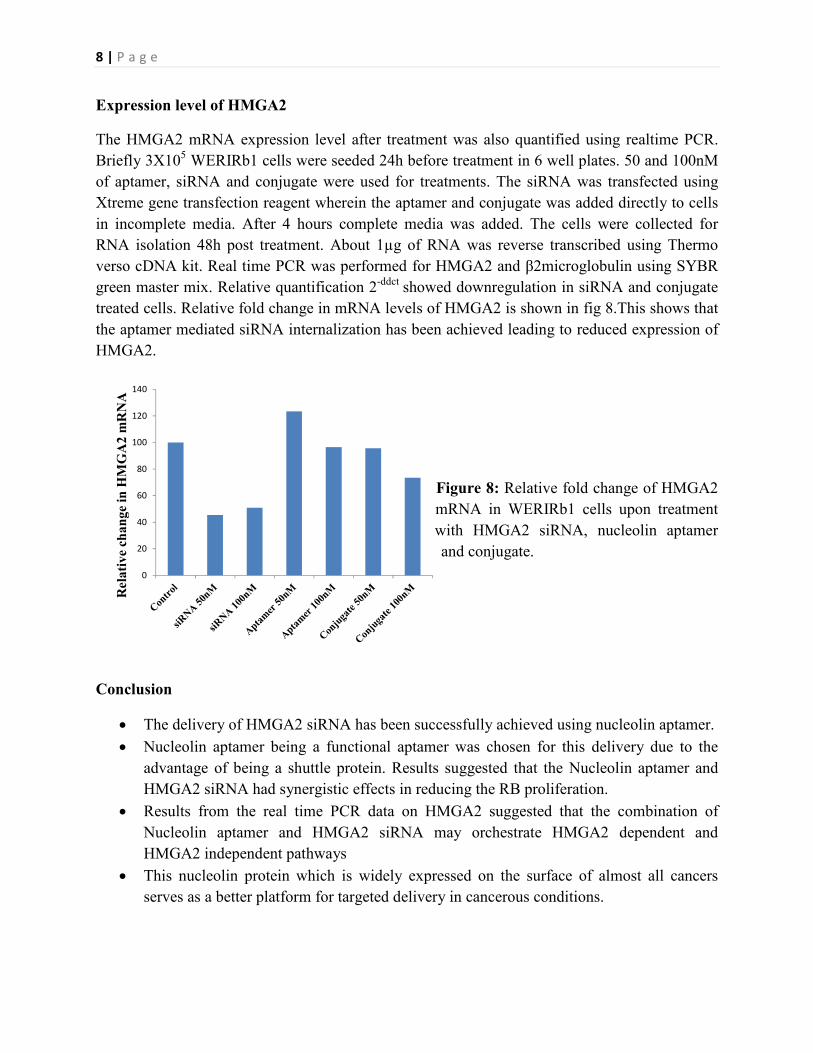
Expression level of HMGA2
The HMGA2 mRNA expression level after treatment was also quantified using realtime PCR.
Briefly 3X10⁵ WERIRb1 cells were seeded 24h before treatment in 6 well plates. 50 and 100nM
of aptamer, siRNA and conjugate were used for treatments. The siRNA was transfected using
Xtreme gene transfection reagent wherein the aptamer and conjugate was added directly to cells
in incomplete media. After 4 hours complete media was added. The cells were collected for
RNA isolation 48h post treatment. About 1µg of RNA was reverse transcribed using Thermo
verso cDNA kit. Real time PCR was performed for HMGA2 and β2microglobulin using SYBR
green master mix. Relative quantification 2-ddct
showed downregulation in siRNA and conjugate
treated cells. Relative fold change in mRNA levels of HMGA2 is shown in fig 8.This shows that
the aptamer mediated siRNA internalization has been achieved leading to reduced expression of
HMGA2.
Figure 8: Relative fold change of HMGA2
mRNA in WERIRb1 cells upon treatment
with HMGA2 siRNA, nucleolin aptamer
and conjugate.
Conclusion
• The delivery of HMGA2 siRNA has been successfully achieved using nucleolin aptamer.
• Nucleolin aptamer being a functional aptamer was chosen for this delivery due to the
advantage of being a shuttle protein. Results suggested that the Nucleolin aptamer and
HMGA2 siRNA had synergistic effects in reducing the RB proliferation.
• Results from the real time PCR data on HMGA2 suggested that the combination of
Nucleolin aptamer and HMGA2 siRNA may orchestrate HMGA2 dependent and
HMGA2 independent pathways
• This nucleolin protein which is widely expressed on the surface of almost all cancers
serves as a better platform for targeted delivery in cancerous conditions.
9 | P a g e
References:
Lai WY, Wang WY, Chang YC, Chang CJ, Yang PC, Peck K. Synergistic inhibitionof lung
cancer cell invasion, tumor growth and angiogenesis using aptamer-siRNAchimeras.
Biomaterials. 2014 Mar;35(9):2905-14. doi:10.1016/j.biomaterials.2013.12.054. Epub 2014 Jan
4. PubMed PMID: 24397988.
Chen Z, Ruffner DE. Modified crush-and-soak method for recoveringoligodeoxynucleotides
from polyacrylamide gel.Biotechniques. 1996Nov;21(5):820-2. PubMed PMID: 8922620.
Biotechniques 21: 820-822.
Publication from the grant
• Nalini V. Deepa P.R. Raguraman R. Khetan V. Reddy M.A. Krishnakumar S.Targeting
HMGA2 in Retinoblastoma Cells in vitro Using the Aptamer Strategy. Ocul Oncol
Pathol 2016;2:262-269 (DOI:10.1159/000447300)
Presentations:
• Abstract submitted to Asia Arvo Indian Eye Research Group Meeting to be held at
Hyderabad in July 2016
Dr S.Krishnakumar MD
11-July-2016