progress and way forward - asian development bank · pdf fileprogress and way forward 9 789292...
TRANSCRIPT

ASIAN DEVELOPMENT BANK
Trade Facilitation for a More Inclusive and Connected Asia and Pacific Region Progress and Way Forward
Trade facilitation increases trade flows, lowers trade cost, and ultimately contributes to sustainable and inclusive growth. This publication, jointly prepared by the Asian Development Bank and the United Nations Economic and Social Commission for Asia and the Pacific, provides an overview of assessments from the 2017 global survey on trade facilitation and paperless trade in the region. The progress and challenges in the regional and subregional trade facilitation efforts being made to streamline trade procedures are also presented.
About the Asian Development Bank
ADB’s vision is an Asia and Pacific region free of poverty. Its mission is to help its developing member countries reduce poverty and improve the quality of life of their people. Despite the region’s many successes, it remains home to a large share of the world’s poor. ADB is committed to reducing poverty through inclusive economic growth, environmentally sustainable growth, and regional integration.
Based in Manila, ADB is owned by 67 members, including 48 from the region. Its main instruments for helping its developing member countries are policy dialogue, loans, equity investments, guarantees, grants, and technical assistance.
About the United Nations Economic and Social Commission for Asia and the Pacific
ESCAP is the regional development arm of the United Nations and serves as the main economic and social development center for the United Nations in Asia and the Pacific. Its mandate is to foster cooperation between its 53 members and 9 associate members. ESCAP provides the strategic link between global and country-level programs and issues. It supports governments of countries in the region in consolidating regional positions and advocates regional approaches to meeting the region’s unique socioeconomic challenges in a globalizing world. The ESCAP office is located in Bangkok, Thailand. Please visit the ESCAP website at www.unescap.org for further information.
ASIAN DEVELOPMENT BANK6 ADB Avenue, Mandaluyong City1550 Metro Manila, Philippineswww.adb.org
TRADE FACILITATION FOR A MORE INCLUSIVE AND CONNECTED ASIA AND PACIFIC REGIONProgress and Way Forward
9 789292 578718
ISBN 978-929257871-8


ASIAN DEVELOPMENT BANK
TRADE FACILITATION FOR A MORE INCLUSIVE AND CONNECTED ASIA AND PACIFIC REGIONProgress and Way Forward

Creative Commons Attribution 3.0 IGO license (CC BY 3.0 IGO)
© 2017 Asian Development Bank6 ADB Avenue, Mandaluyong City, 1550 Metro Manila, PhilippinesTel +63 2 632 4444; Fax +63 2 636 2444www.adb.org
Some rights reserved. Published in 2017.
ISBN 978-92-9257-871-8 (Print), 978-92-9257-872-5 (e-ISBN) Publication Stock No. TCS178897-2 DOI: http://dx.doi.org/10.22617/TCS178897-2
The views expressed in this publication are those of the authors and do not necessarily reflect the views and policies of the Asian Development Bank (ADB) or its Board of Governors or the governments they represent.
ADB does not guarantee the accuracy of the data included in this publication and accepts no responsibility for any consequence of their use. The mention of specific companies or products of manufacturers does not imply that they are endorsed or recommended by ADB in preference to others of a similar nature that are not mentioned.
By making any designation of or reference to a particular territory or geographic area, or by using the term “country” in this document, ADB does not intend to make any judgments as to the legal or other status of any territory or area.
This work is available under the Creative Commons Attribution 3.0 IGO license (CC BY 3.0 IGO) https://creativecommons.org/licenses/by/3.0/igo/. By using the content of this publication, you agree to be bound by the terms of this license. For attribution, translations, adaptations, and permissions, please read the provisions and terms of use at https://www.adb.org/terms-use#openaccess
This CC license does not apply to non-ADB copyright materials in this publication. If the material is attributed to another source, please contact the copyright owner or publisher of that source for permission to reproduce it. ADB cannot be held liable for any claims that arise as a result of your use of the material.
Please contact [email protected] if you have questions or comments with respect to content, or if you wish to obtain copyright permission for your intended use that does not fall within these terms, or for permission to use the ADB logo.
Notes:In this publication, “$” refers to US dollars.Corrigenda to ADB publications may be found at http://www.adb.org/publications/corrigenda

ContentsAcknowledgments iiAbbreviations iii
Highlights iv
1. Introduction 1
2. Impact of Trade Facilitation 3
3. Status and Progress of Trade Facilitation in Asia and the Pacific 5 3.1 Global Survey Results on Trade Facilitation and Paperless Trade 5 3.2 Subregional Cooperation Initiatives and Trade Facilitation in Asia and the Pacific 8 Central Asia Regional Economic Cooperation Program 8 Greater Mekong Subregion Program 10 South Asia Subregional Economic Cooperation Program 12 The Pacific 14 3.3 Digital Trade and Small and Medium-sized Enterprises 15
4. Challenges and Way Forward 19
References 21
Tables, Figures, and Boxes
Tables1 Intraregional and Extra-Regional Comprehensive Trade Costs in Asia and the Pacific (excluding tariff costs), 2008–2013 22 Changes in International Trade Costs of Asia and Pacific as a Result of WTO TFA Implementation 83 Impact of Trade Facilitation Measures at the Subregional Level 12 Figures1 The Four Pillars and Five Key Areas of Trade Facilitation 22 Impact of Trade Facilitation 33 Overall Implementation of Trade Facilitation Measures (44 Asia and Pacific countries) 64 Trade Facilitation Implementation across Asia and Pacific Subregions and Countries with Special Needs 75 Implementation of Different Groups of Trade Facilitation Measures 76 Central Asia Regional Economic Cooperation Corridors 107 Greater Mekong Subregion Economic Corridors 118 South Asia Subregional Economic Cooperation Program Economic Corridors 13 Boxes1 Estimates of Gains from Trade Facilitation 42 The World Trade Organization’s Trade Facilitation Agreement 16

This publication was jointly prepared by the Regional Cooperation and Integration Division (ERCI) of the Economic Research and Regional Cooperation Department (ERCD), the Asian Development Bank (ADB), and Trade, Investment and Innovation Division (TIID), the United Nations Economic and Social Commission for Asia and the Pacific (ESCAP).
Cyn-Young Park, Director of ERCI, ADB and Yann Duval from TIID, ESCAP led the preparation of this publication. The main contributors from ADB comprised Kijin Kim and Aleli Rosario. Paulo Rodelio Halili and Maria Criselda Aherrera provided additional inputs and administrative support. A group of consultants, namely, Zemma Ardaniel, Regina Villasor, and Benjamin Endriga provided research support. The main contributors from the ESCAP included Tengfei Wang and Yan Duval, with support from Chorthip Utoktham, consultant, and Agathe Blanchard during her internship at ESCAP.
Guy Sacerdoti edited the manuscripts. Achilleus Coronel created the cover design. Ariel Paelmo did the layout and typesetting. Support for printing and publishing this report was provided by the Printing Services Unit of ADB’s Office of Administrative Services and by the publishing team of the Department of External Relations.
Acknowledgments

AbbreviationsADB Asian Development BankASEAN Association of Southeast Asian NationsCAREC Central Asia Regional Economic CooperationESCAP United Nations Economic and Social Commission for Asia and the PacificEU European UnionFA-PT framework agreement on facilitation of cross-border paperless trade in Asia and the PacificGDP gross domestic productGMS Greater Mekong SubregionLDC least developed countryLLDC landlocked developing countryOECD Organisation for Economic Co-operation and DevelopmentPRC People’s Republic of ChinaSAARC South Asian Association for Regional CooperationSASEC South Asia Subregional Economic CooperationSDG sustainable development goalSIDS small island developing statesSMEs small and medium-sized enterprisesSMEWG small and medium enterprises working groupSPS sanitary and phytosanitaryTFA Trade Facilitation AgreementTTF-AP transport and trade facilitation action programTTFMM trade and transport facilitation monitoring mechanismUN United NationsUNRC United Nations Regional CommissionWTO World Trade Organization

Highlights• Reducing trade costs is essential for economies to join regional and global value chains; it allows trade to
continue as a major engine of growth and sustainable development.• Trade facilitation has a direct impact on trade costs and an indirect impact on the price of traded goods; it
increases trade flows and ultimately leads to higher growth.• A global survey was conducted first in 2015 to assess the implementation status of trade facilitation worldwide.
The second global survey 2017 draws on the final list of provisions under the World Trade Organization’s Trade Facilitation Agreement (WTO TFA) and the text of the regional UN treaty on cross-border paperless trade facilitation. It also includes additional questions on trade facilitation in the context of Sustainable Development Goals (SDGs).
The survey covers 47 trade facilitation measures in seven groups—(i) General trade facilitation measures, (ii) Paperless trade, (iii) Cross-border paperless trade, (iv) Transit facilitation, (v) Trade facilitation for SMEs, (vi) Agricultural trade facilitation and (vii) Women in trade facilitation. Main findings are as follows:
— Overall, the Asia and Pacific region shows a 50% average implementation rate for trade facilitation and paperless trade measures.
— However, the level of trade facilitation implementation varies widely within each subregional group. Apart from Australia and New Zealand, the highest average WTO FTA implementation is 73.7% for East and Northeast Asia, followed by Southeast Asia (60.1%), North and Central Asia (52.4%) and South and Southwest Asia (45.8%). Pacific Island Developing Economies lags far behind other subregions (28.2%).
— On (i) General trade facilitation measures and (iv) Transit facilitation—mostly covered by WTO TFA, the region’s implementation rates are generally high at 50-70%. However, areas such as cross-border paperless trade remain at an early stage.
— Very few countries in Asia and the Pacific have customized trade facilitation measures to support SMEs and women, as reflected by the low average implementation rates in (v) Trade facilitation for SMEs at 34% and (vii) Women in trade facilitation at 16%, respectively.
• Institutional coordination is key to successful trade facilitation. The Framework Agreement on Facilitation of Cross-Border Paperless Trade in Asia and the Pacific, as a UN treaty, provides a unique opportunity for Member States to boost their trade and investment competitiveness and actively support the growth of their digital economy.
• Moving forward, further study is needed on how trade facilitation helps meet the SDGs.

Introduction 1
Trade helps drive inclusive growth and poverty reduction. For developing Asia, strong value-added from trade-related activities contributes
to economic growth and development. Global trade helps reallocate capital and labor toward sectors holding comparative advantage. And international trade is one important way to help meet the United Nations Sustainable Development Goals (SDGs). The beneficial links between trade and investment catalyzes economic transformation, job creation, and skill development—which all support SDG 8 (promoting decent work and economic growth), SDG 9 (building resilient infrastructure, promoting inclusive and sustainable industrialization and fostering innovation), SDG 10 (reducing inequality within and among countries), and SDG 17 (revitalized and enhanced global partnership).14
Trade facilitation eases the cross-border movement of goods by cutting costs and simplifying trade procedures (OECD, 2005). It rests on four core pillars: (i) transparency; (ii) simplification; (iii) harmonization; and (iv) standardization. Transparency promotes openness and accountability; it involves publicizing easily understood regulations so stakeholders can provide feedback prior to enforcement. Simplification eliminates unnecessary elements and duplications, focusing on essential aspects of trade and critical processes. Harmonization aligns national procedures, operations and documents among trading partners. And Standardization aims to develop international best practices (UNECE, 2012).
Based on these principles, trade facilitation focuses on five key areas: (i) publicizing and administering policies related to trade issues; (ii) establishing rules and procedures for import and export; (iii) creating
1 M. Kituyi. 2016. SDGs: the people’s agenda. Why trade matters. http://www.sustainablegoals.org.uk/why-trade-matters/
product standards that conform to WTO guidelines on standards; (iv) building trade-related infrastructure and supplying quality services that effectively reduce trade costs; and (v) balancing fast customs clearance with adequate security and protection from fraud (ADB, 2013, Figure 1).
Trade facilitation particularly benefits landlocked and island countries, where it boosts participation in international supply chains. They can diversify production of intermediate and final goods to cater to the global market, thereby benefiting other regions as well.25
According to the latest data from the ESCAP–World Bank International Trade Cost Database (Table 1), the overall cost of trading goods among the three largest European Union (EU) economies is equivalent to a 43% average tariff on the value of goods traded. The People’s Republic of China (PRC), Japan, and Republic of Korea (East Asia-3) come closest to matching intra-EU trade costs (51% tariff equivalent), followed by middle-income Association of Southeast Asian Nations (ASEAN) members (76% tariff equivalent). Countries in South Asia, including Bhutan, face the region’s highest trade costs (186% tariff equivalent).
Recent studies suggest that much of the reduction in trade costs since 2000 has come through eliminating or lowering of tariffs.36 Any further cost-cutting will have centered on reducing nontariff costs, such as inefficient transport and logistics infrastructure and services, and cumbersome regulatory procedures and documentation.
2 Developing countries in East and Southeast Asia accounted for approximately 40% percent of global supply chain trade in 2015, compared with 34% percent for the European Union (EU), 10% percent for the United States (US), and 5% percent for Japan (http://www.dailymirror.lk/article/Can-Sri-Lanka-join-Asian-supply-chains--122750.html#sthash.mQiMCLW0.dpuf)
3 For example, see ESCAP. 2011. Asia-Pacific Trade and Investment Report 2011.
1. Introduction

Trade Facilitation for a More Inclusive and Connected Asia and Pacific Region2
Publication and administration of policies related to
trade issues
Rules and procedures for
import and export
Product standards and conformance
Trade-related infrastructure and
services
Goods in transit
Figure 1. The Four Pillars and Five Key Areas of Trade Facilitation
Source: National Board of Trade, Sweden; ADB (2013).
Table 1. Intraregional and Extra-Regional Comprehensive Trade Costs in Asia and the Pacific (excluding tariff costs), 2010–2015
ASEAN = Association of Southeast Asian Nations, AUS = Australia, EU = European Union, NZL = New Zealand, SAARC = South Asian Association for Regional Cooperation. Notes: Trade costs may be interpreted as tariff equivalents. Percentage changes in trade costs between 2004–2009 and 2010–2015 are in parentheses. ASEAN-4 includes Indonesia, Malaysia, the Philippines, and Thailand; East Asia-3 includes the People’s Republic of China, Japan, and the Republic of Korea; North and Central Asia-4 includes Georgia, Kazakhstan, the Kyrgyz Republic, and the Russian Federation; Pacific Islands Developing Economies include Fiji and Papua New Guinea; SAARC-4 includes Bangladesh, India, Pakistan, and Sri Lanka; and EU-3 includes France, Germany, and the United Kingdom.Source: UNESCAP. ESCAP-World Bank Trade Cost Database (June 2015 update).http://databank.worldbank.org/data/views/variableselection/selectvariables.aspx?source=escap-world-bank-international-tradecosts.
Region ASEAN-4 East Asia-3
North and
Central Asia - 4
Pacific Islands
Developing Economies
SAARC-4
AUS-NZL EU-3
ASEAN-4 76% (6.7%) East Asia-3 76% 51% (4.1%) (-2.9%) North and 343% 167% 116% Central Asia - 4 (5.4%) (-9.9%) (-0.9%) Pacific Islands 172% 173% 370% 130% Developing Economies (-9.0%) (-3.1%) (21.6%) (-8.8%) SAARC-4 130% 123% 302% 300% 119% (3.5%) (-2.1%) (7.7%) (-4.6%) (12.9%) AUS-NZL 101% 87% 341% 82% 136% 51% (2.9%) (-5.4%) (-4.9%) (-8.9%) (-6.7%) (-4.9%) EU-3 105% 84% 150% 204% 113% 108% 42% (-3.4%) (-3.4%) (-7.1%) (-7.1%) (0.3%) (-2.3%) (-8.1%) United States 86% 63% 174% 161% 112% 100% 67% (8.0%) (0.4%) (-3.5%) (-5.4%) (6.7%) (2.9%) (0.4%)

Status and Progress of Trade Facilitation in Asia and the Pacific 3
Figure 2. Impact of Trade Facilitation
FDI = foreign direct investment, SME = small and medium-sized enterprise.Source: Authors.
- Higher SME participation in international trade
2. Impact of Trade Facilitation
Everyone gains from easier trading processes (OECD, 2005b)—trade facilitation brings governments higher revenues from reduced
fraud; businesses become more competitive and efficient, raising profits; and consumers save from lower prices. Inefficient trade procedures add significant costs, usually shouldered by the taxpayer or buyer, and it makes investment less attractive.
Trade facilitation increases trade flows and ultimately sustainable and inclusive growth (Figure 2). It lowers direct costs by raising efficiency among interacting businesses and administering agencies. Prices fall as they indirectly benefit from simpler, transparent border procedures. Even modest cost reductions show a positive link between trade facilitation and increased trade. All countries—especially those developing—stand to gain. Countries that improve border procedures would benefit most.
Trade facilitation can have a greater impact on specific product groups, firms, and economies (Box 1). For example, agro-food products have higher cross-border costs than manufactured goods, as they are subjected to special border procedures (costing 1%-15% of product value). Long border delays raise final costs by increasing spoilage.
Small and medium-sized enterprises (SMEs) are more vulnerable to financial and efficiency costs than large enterprises. The larger the international trade within a firm, the more economies of scale and comparative advantage exist for logistics and administrative coordination. In a highly competitive environment, SMEs have to address the constraints of limited human resources, information, and capital. They are also often classified as high-risk and are required to comply with additional documentary and cargo checks. An Organisation for Economic Co-operation and

Trade Facilitation for a More Inclusive and Connected Asia and Pacific Region 4
Box 1. Estimates of Gains from Trade Facilitation
The benefits from trade facilitation vary by degree, particularly in efficiency gains. Certain product groups and countries—small and medium enterprises and developing countries, for example—benefit more from trade facilitation than others. • For agriculture and food products, sanitary and
phytosanitary measures, additional documentation and physical inspections are required for border clearance. For example, agricultural product exporters from India currently face a 37% cost disadvantage to those firms.
• In Bangladesh, export earnings could increase 30% with higher port efficiency.
• In Japan, use of electronic data led to a 7% reduction in costs and a 4% shorter waiting time for goods subject to similar procedures.
• In Australia, paperless trade resulted in a 1.5% savings for bulk sea shipments and 15% for air cargo.
• In Thailand, the 2008 implementation of a National Single Window brought savings of about $1.5 billion annually and cut time-to-export from 17 days to 14 days.
• Singapore’s single-window system reduced documentation costs by more than half.
• In New Zealand, processing time fell from 10 days to 12 minutes over a 4-year period after the automation of customs procedures.
Source: UNNext (2012) and OECD (2003 and 2005b).
Development (OECD) report (OECD, 2003) estimates that using simplified trade facilitation procedures, would cut SME trade costs by 50%.
This is especially true for non-OECD countries with high trade-to-gross domestic product (GDP) ratios—and thus highly sensitive to changes in import and
export costs. Developing countries would experience the largest relative gains from trade facilitation. Those best able to ease border flows with minimal financial resources show how small investments in trade facilitation can bring high relative returns. Additional investments would amplify the benefits.
Status and Progress of Trade Facilitation in Asia and the Pacific 5
3. Status and Progress of Trade Facilitation in Asia and the Pacific
3.1 Global Survey Results on Trade Facilitation and Paperless Trade
In 2012, the ESCAP Secretariat—in conjunction with the Asia-Pacific Trade Facilitation Forum organized by ESCAP and ADB—conducted the first regional
survey on the implementation of trade facilitation and paperless trade. A second regional survey was conducted in 2013/14. Extensive discussions at the Global Trade Facilitation Forum 20134 over the lack of reliable, detailed and regularly updated data on the implementation of trade facilitation—building on ESCAP’s regional surveys—led to the first global survey, jointly by all United Nations Regional Commissions (UNRCs) and other international organizations in 2015.
The second global survey began in early 2017. The survey uses the final list of provisions included in the World Trade Organization’s Trade Facilitation Agreement (WTO TFA)5 and the draft text of the regional UN treaty on cross-border paperless trade facilitation under negotiation at ESCAP. It covers 47 trade facilitation measures divided into seven groups—(i) General trade facilitation measures, (ii) Paperless trade, (iii) Cross-border paperless trade, (iv) Transit facilitation, (v) Trade facilitation for SMEs, (vi) Agricultural trade facilitation and (vii) Women in trade facilitation.6 While General trade facilitation measures and Transit facilitation measures are largely featured in the WTO TFA, most cross-
4 Organized jointly by all the UN Regional Commissions (UNRCs) in Bangkok in November 2013. See http://www.unescap.org/events/global-trade-facilitation-conference-2013
5 Box 2 shows the recent progress of the WTO TFA.6 The survey questionnaire is available in full at: http://unnext.unescap.
org/tfforum14-survey.asp
border paperless trade measures are not (although they support implementation in many General trade facilitation measures). To ensure comparability across countries, two measures classified under Institutional arrangement and cooperation (No. 33, 34), one measure under Paperless trade (No. 20), and one measure under Transit facilitation (No. 35) are excluded from the regional analysis. Because of very limited data on Trade facilitation for SMEs, Agricultural trade facilitation and Women in trade facilitation, indictors in these groups are also excluded for regional analysis.
For analysis and presentation of the results, each trade facilitation measure included was rated either as “fully implemented,” “partially implemented,” “on a pilot basis,” or “not implemented.” A score (weight) of 3, 2, 1, and 0 was assigned to each implementation stage to calculate scores for individual measures across countries, regions or categories.7
Implementation levels of 44 countries in Asia and the Pacific were calculated based on 31 trade facilitation and paperless trade measures (Figure 3).8 The regional average implementation of this comprehensive set of trade facilitation measures was 50%, though results
7 Note: for the data on trade facilitation and paperless implementation used in this report, the cut-off date for data validation was 31 June 2017. Some data may be subject to changes if some individual countries send feedback on data validation in July 2017. Accordingly, the results reported here are still preliminary.
8 Among 38 trade facilitation measures surveyed, three measures—including 20. Electronic Submission of Sea Cargo Manifests, 33. Alignment of working days and hours with neighboring countries at border crossings, and 34. Alignment of formalities and procedures with neighboring countries at border crossings—are excluded for calculating the overall score as they do not apply to all countries surveyed. Similarly, four transit facilitation measures are also excluded. The overall score of each country is simply the sum of the implementation scores (3,2,1 or 0) for each trade facilitation measure. The maximum possible score is 93 and the average score across all 44 countries is 43.3 (or 46.5% in percentage terms).

Trade Facilitation for a More Inclusive and Connected Asia and Pacific Region 6
vary widely by country. Australia, the Republic of Korea, Singapore, the People’s Republic of China and Japan have implementation rates over 80%, while several Pacific countries barely reach 15%.
Figure 4 presents implementation rates of trade facilitation measures (measured by percentage) by subregion and groups of countries with special needs—landlocked developing countries (LLDCs), least developed countries (LDCs) and small island developing states (SIDS)—as well as the average implementation rate of each group (indicated by the red bars). After Australia and New Zealand, the highest average rate was in East and Northeast Asia (73.7%), followed by Southeast Asia (60.1%), North and Central Asia (52.4%) and South and Southwest Asia (45.8%). The Pacific lags behind at 28.2%.
Implementation varies widely within each subregional group. In Southeast Asia, all of ASEAN have well-implemented trade facilitation measures. In contrast, Timor-Leste only recently began to actively engage in international trade. Differences in trade facilitation implementation are smallest in the Pacific, possibly
due to economic cooperation initiatives on trade facilitation—but arguably more likely because they all face relatively similar implementation constraints.
Countries with special needs face particular challenges in implementing trade facilitation measures—in particular paperless trade and cross-border paperless trade. The average implementation level of these countries varies between 29% and 41% depending on the group considered (see Figure 4). Interestingly, LLDCs as a group have higher levels of trade facilitation on average than LDCs or SIDSs. This is welcome given the particular importance of trade facilitation for these economies—and the strong support of development partners in supporting trade and transport facilitation in LLDCs (and in the context of the Vienna Programme of Action (VPoA).9
9 http://unohrlls.org/about-lldcs/programme-of-action/
Figure 3. Overall Implementation of Trade Facilitation Measures (44 Asia and Pacific countries)
FSM = Federated States of Micronesia, Lao PDR = Lao People’s Democratic Republic, PRC = People’s Republic of China.Source: The second global survey on trade facilitation and paperless trade implementation (2017).
0%
25%
50%
75%
100%
PRC
Japa
nKo
rea,
Rep
ublic
of
Mon
golia
Arm
enia
Azer
baija
nKa
zakh
stan
Kyrg
yz R
epub
licRu
ssia
n Fe
dera�o
nTa
jikist
anU
zbek
istan Fi
jiKi
riba�
FSM
Nau
ruPa
lau
Papu
a N
ew G
uine
aSa
moa
Solo
mon
Isla
nds
Tong
aTu
valu
Vanu
atu
Afgh
anist
anBa
ngla
desh
Bhut
anIn
dia
Mal
dive
sN
epal
Paki
stan
Sri L
anka
Turk
ey
Brun
ei D
arus
sala
mCa
mbo
dia
Indo
nesia
Lao
PDR
Mal
aysia
Mya
nmar
Phili
ppin
esSi
ngap
ore
Thai
land
Tim
or-L
este
Viet
Nam
Aust
ralia
New
Zea
land
Transparency Formali�es Ins�tu�onal arrangement and coopera�on Paperless trade Cross-border paperless trade
East and Northeast
North and Central Asia
(52.4%)Pacific Islands Developing Economies (28.2%)
South and Southwest Asia (45.8%)
Southeast Asia (60.1%)
Australiaand New Zealand(86.0%)

Status and Progress of Trade Facilitation in Asia and the Pacific 7
As shown in Figure 5, “transparency” measures have been the best implemented (regional average implementation at 68.5%), followed by “formalities” measures (60%). Measures aimed at reducing or
Figure 5. Implementation of Different Groups of Trade Facilitation Measures
Note: Blue diamonds represent country scores; red lines are group averages.Source: The second global survey on trade facilitation and paperless trade implementation.
0%
10%
20%
30%
40%
50%
60%
70%
80%
90%
100%
transparency Formalities Institutionalarrangement
andcooperation
Paperlesstrade
Cross-borderpaperless
trade
Transitfacilitation
Tradefacilitationand SMEs
Tradefacilitation
andagriculture
trade
Women andtrade
facilitation
speeding-up have also been given serious attention in many economies of the region, with the regional average implementation rate exceeding 50% in that category. Regional average implementation also
Figure 4. Trade Facilitation Implementation across Asia and Pacific Subregions and Countries with Special Needs
Note: Blue diamonds represent country scores; red lines are group averages.Source: The second global survey on trade facilitation and paperless trade implementation.
0%
10%
20%
30%
40%
50%
60%
70%
80%
90%
100%
Australiaand NewZealand
East andNortheast
Asia
SoutheastAsia
North andCentral Asia
South andSouthwest
Asia
PacificIsland
DevelopingEconomies
LandlockedDevelopingCountries
LeastDevelopedEconomies
Small IslandDeveloping
States

Trade Facilitation for a More Inclusive and Connected Asia and Pacific Region 8
reaches over 50% for measures related to “institutional arrangements and inter-agency cooperation” and “transit”.
The regional average level of implementation of “paperless trade” measures also stands close to 50%. While many economies have developed legal frameworks to enable paperless trade, implementation of “cross-border paperless trade” has yet to begin in many developing countries and the average rate of implementation stands at 23%.
To better reflect trade facilitation in the context of SDGs, three groups of trade facilitation measures including “trade facilitation for SMEs”, “trade facilitation for agricultural trade” and “women in trade facilitation” were added to the Survey in 2017. Figure 5 shows that, according to the data received from 16 countries surveyed, agricultural trade facilitation has been generally well implemented. However, very few countries have customized trade facilitation measures to support SMEs and women, as reflected by the low average implementation rates at 34% and 16%, respectively.
Studies by UNESCAP (2015; 2016) reveal that the implementation both of the binding and non-binding TFA measures would results in a 5% reduction in trade costs, on average, under a partial implementation scenario, and an 11% reduction under the more ambitious full implementation scenario. In contrast, implementation of the binding TFA measures alone results, at best, in a 6.77% decrease in trade costs on
average in the Asia and Pacific region. Under a WTO TFA+ scenario, where paperless trade measures not included in the TFA are also implemented, the average trade cost reduction across countries increases to more than 13% (Table 2).
3.2 Subregional Cooperation Initiatives and Trade Facilitation in Asia and the Pacific
This section presents a brief introduction to major subregional programs in Asia and the Pacific. It also describes trade facilitation projects that promote development through deepening regional cooperation and integration.
Central Asia Regional Economic Cooperation Program
Overview
Established in 2001, the CAREC program covers 11 countries—Afghanistan, Azerbaijan, the People’s Republic of China (PRC), Georgia, Mongolia, Pakistan, Kazakhstan, the Kyrgyz Republic, Tajikistan, Turkmenistan, and Uzbekistan—the last five forming the core economies of the subregion. The program
Table 2. Changes in International Trade Costs of Asia and Pacific as a Result of WTO TFA Implementation (%)
TF = trade facilitation , WTO TFA = World Trade Organization’s Trade Facilitation Assessment.Source: UNESCAP (2015; 2016).
WTO TFA (Binding only)
WTO TFA (Binding + non-binding)
WTO TFA+ (Binding + non-binding +
other paperless trade) Partially
implemented Fully
implemented Partially
implemented Fully
implemented Partially
implemented Fully
implemented Model 1 Overall TF -3.15 -6.77 -5.38 -11.11 -6.71 -13.16 Model 3
Transparency -0.79 -1.67 -1.13 -3.09 -1.13 -3.09 Formalities -2.25 -3.17 -2.66 -3.95 -2.66 -3.95 Institution -0.10 -0.35 -0.10 -0.35 -0.10 -0.35 Paperless trade - - -1.45 -2.34 -2.91 -4.83
Source: UNESCAP (2015; 2016).

Status and Progress of Trade Facilitation in Asia and the Pacific 9
focuses on regional infrastructure development and trade issues prioritizing (i) energy, (ii) transport, (iii) trade facilitation, and (iv) trade policy.
At the heart of CAREC is an institutional framework that guides and strengthens initiatives from planning to implementation. The annual Ministerial-level conference is CAREC’s policy-making body, providing guidance on the program’s overall direction. The Senior Officials’ Meeting,10 sector coordinating committees for transport, energy, trade policy, and trade facilitation,11 and national focal points 12 provide support. Output growth in Central Asia fell to 2.1% in 2016 from 3.1% in 2015 as low oil prices, recession in the Russian Federation and weak export demand continued to constrain growth. Growth is projected to rise to 3.1% in 201713 with the anticipated partial recovery in international oil prices and other commodities, a milder contraction in the Russian Federation, and stronger growth in the PRC.
New growth opportunities include economic corridor development—particularly the Almaty-Bishkek corridor between Kazakhstan and the Kyrgyz Republic. Still in its early phase, the corridor is “instrumental in promoting the regional cooperation agenda” by linking markets, ideas and people (CAREC). Other initiatives include the PRC’s Belt and Road, the US-favored New Silk Road, the Eurasia Initiative promoted by the Republic of Korea, and the Quality Infrastructure initiative sponsored by Japan. The entry of Kazakhstan and the Kyrgyz Republic to the Eurasian Economic Union is also expected to lower internal trade and investment barriers. The establishment of the Asian Infrastructure Investment Bank and New Development Bank also expands multilateral development financing in the region.
10 Coordinates cross-sectoral issues, prepares for ministerial conferences, and ensures implementation of policy decisions made at ministerial meetings.
11 Coordinates respective sectoral issues, strategy articulation, and program development and implementation.
12 Ensures coordination among government agencies and other parties concerned.
13 Asian Development Outlook 2017: Transcending the Middle-Income Challenge.
While these developments are important, CAREC needs to adapt quickly to a new normal of more moderate capital inflows, subdued yet stable oil prices, and lower purchasing power of remittances. This is crucial if members are to capitalize on changing patterns of trade, particularly the “shift of resources from production that is not internationally traded to production that competes in international markets,” the increasing tradability of services across borders and reorientation of trade toward Asia (WB 2017).
Trade Facilitation in Central Asia Regional Economic Cooperation14
Trade facilitation is central to the CAREC Program. Guided by the Transport and Trade Facilitation Strategy, it aims to (i) reduce time, costs, and uncertainty in trade transactions; (ii) encourage free movement of people and goods; and (iii) enhance legal transparency. Trade facilitation has two components,15 customs cooperation on reforms and modernization, and integrated trade facilitation by establishing a regional mechanism. The trade facilitation program is coordinated through the Customs Cooperation Committee and the CAREC Federation of Carrier and Forwarder Associations. ADB assistance covers regional sanitary and phytosanitary (SPS) cooperation and border services projects in the Kyrgyz Republic, Mongolia, Pakistan, and Tajikistan.
CAREC plans six multimodal transport corridors in the region (Figure 6). By 2015, corridor implementation included the development of two ports, two logistics centers, three border crossings, and six civil aviation centers. CAREC projects contributed to building or improving 809 kilometers (km) of expressways or national highways, 93% of the target under the Transport and Trade Facilitation Strategy 2020. In
14 As of September 2016, ADB’s cumulative CAREC investments under CAREC totaled $28.9 billion (ADB, 2016; CAREC Mid-Term Report). Of the total, this figure, $22.6 billion (78%) was in transport, $5.7 billion (20%) in energy, and $0.6 billion (2%) in trade facilitation. ADB’s share of the total was $10.1 billion (35%). In addition, CAREC has financed a total of $466 million in technical assistance, (TA), of which ADB’s share was $152 million (33%).
15 The first Transport and Trade Facilitation Strategy has three components: customs reform and modernization, integrated trade facilitation, and developing efficient regional logistics.

Trade Facilitation for a More Inclusive and Connected Asia and Pacific Region 10
Source: ADB.
Figure 6. Central Asia Regional Economic Cooperation Corridors
2015, CAREC projects covered road safety, road asset management, transport facilitation, and railway improvement.
Trade facilitation is having a positive effect. ADB estimates the average time needed to clear a border-crossing along CAREC transport corridors—by rail and road—was reduced by an hour in 2015 from 2014 (ADB 2016). Travel time by rail dropped 5.2 hours, while average train speed increased 20%. Cross-border clearance time by road declined 6.1% in 2015. Similarly, costs have declined—average border costs fell to $161 in 2015 from $172 in 2014 (road transport costs declined from $177 to $149). Intraregional trade volume grew 49% from 2005 to 2013, exceeding the planned 25% target (ADB and CAREC 2014). And road transport costs fell 9.3% in 2015, mostly due to progress along the Trans-Mongolian Corridor (CAREC 2016). See Table 3.
Greater Mekong Subregion Program
Overview
The Greater Mekong Subregion (GMS) Program was established in 1992 with Cambodia, the PRC (Yunnan Province and Guangxi Zhuang Autonomous Region), the Lao People’s Democratic Republic (Lao PDR), Myanmar, Thailand, and Viet Nam as members.
The subregion’s aggregate GDP expanded from $796 billion in 2010 to $1.2 trillion in 2015. Robust GDP per capita growth lifted incomes across the GMS, led by Guangxi and Yunnan provinces in the PRC. Poverty incidence declined in all GMS economies from the early to mid-1990s to the early 2000s.
Having started earlier than other subregional programs, GMS members are more integrated. Intra-GMS trade shares increased from 2% in 1992 ($5 billion) to 9.3%

Status and Progress of Trade Facilitation in Asia and the Pacific 11
Figure 7. Greater Mekong Subregion Economic Corridors
Source: ADB.
in 2015 ($444 billion). Aggregate intra-GMS foreign direct investment (FDI) increased from $8.3 billion in 2001–2006 to $29.2 billion in 2010–2015. Physical connectivity among members also improved. In 2015, the PRC’s liner shipping bilateral connectivity index was highest with Viet Nam (0.59) and Thailand (0.58). Viet Nam’s connectivity with Cambodia (0.29) and Myanmar (0.22) was more modest.
GMS uses a three-pronged strategy to enhance cooperation and integration: (i) increasing connectivity through infrastructure and economic corridors; (ii) improving competitiveness through efficient
facilitation of cross-border movement and market integration; and (iii) building a sense of community through projects and programs (Figure 7). GMS employs a 10-year Strategic Framework to guide the program. The Strategic Framework covering 2012-2022 “expands the GMS Program from the conventional infrastructure to multi-sector investments designed to foster economic corridor development” (ADB 2013).

Trade Facilitation for a More Inclusive and Connected Asia and Pacific Region 12
Trade Facilitation in Greater Mekong Subregion
A Cross-Border Transport Facilitation Agreement (CBTA) uses a single legal instrument for “key nonphysical measures for efficient cross-border land transport” (ADB 2011) to further increase and facilitate traffic and to promote transport and trade facilitation. In addition, a Transport and Trade Facilitation Action Program (TTF-AP) provides advisory support and capacity building. It “supports the development of a more integrated GMS market that can serve as a vibrant subregional production base” (ADB 2015) by focusing on (i) expanding transport and traffic rights; (ii) simplifying and modernizing customs procedures and border management; (iii) supporting enhanced transport and logistics; and (iv) strengthening capacity of SPS agencies.
The TTF-AP has extended the East West Economic Corridor between GMS capitals (Bangkok, Hanoi, Vientiane), streamlined Single-Stop Customs Inspection Mechanisms at key border crossings, and implemented bilateral traffic rights exchanges between the PRC, Viet Nam, Cambodia and Thailand, and
Table 3. Impact of Trade Facilitation Measures at the Subregional Level
CAREC = Central Asia Regional Economic Cooperation, GMS = Greater Mekong Subregion, TF = trade facilitation.Sources: ADB 2016, ADB and CAREC 2014, CAREC 2016.
Table 3. Impact of Trade Facilitation Measures at the Subregional Level
TF Measure Impact
Border-crossing improvement (CAREC) Drop in average time to clear border-crossing point along CAREC transport corridors in 2015:
(i) by rail, down to 5.2 hours with train travel speed up by 20%
(ii) by road, declined by 6.1% Reduced costs in 2015 from 2014:
(i) average border-crossing cost by $11 (ii) road transport cost by $23
Increase volume of intra-regional trade exceeding target by 24% in 2013
Corridor improvement (CAREC) Reduced road transport cost by 9.3% in 2015 from 2014
Hardware and software improvements at key border crossing points (GMS)
Reduced travel time between Bavet, Cambodia and and Moc Bai (Viet Nam) from about 10 hours in 1999 to half in 2013
Increased cross-border trade from $10 million in 1999 to $708 million in 2013
Created 3,000 jobs and implemented 41 projects worth $270 million in Moc Bai border economic zone
Sources: ADB 2016, ADB and CAREC 2014, CAREC 2016.
between Cambodia and Viet Nam. Challenges remain in strengthening the institutional framework and improving coordination among stakeholders.
Thus far, projects pursued under the GMS program have yielded positive results. At key border crossings, new infrastructure and greater border efficiency cut travel time between Bavet (Cambodia) and Moc Bai (Viet Nam) in half—from about 10 hours in 1999 to 5 hours in 2013. Cross-border trade increased from $10 million in 1999 to $708 million in 2013. In the Moc Bai border economic zone, 41 projects totaling $270 million were implemented and nearly 3,000 jobs created (Table 3).
South Asia Subregional Economic Cooperation Program
Overview
The South Asia Subregional Economic Cooperation (SASEC) includes Bangladesh, Bhutan, India, the Maldives, Nepal, Sri Lanka, and (since March 2017)

Status and Progress of Trade Facilitation in Asia and the Pacific 13
Figure 8. South Asia Subregional Economic Cooperation Economic Corridors
Source: ADB.
Myanmar. Started in 2001, SASEC has been helping members improve cross-border connectivity and increase trade using a pragmatic, results-oriented framework focused on transport, trade facilitation, and energy. Priority areas include (i) improving international corridors to expand trade and commerce; (ii) modernizing customs operations, improving border facilities, and facilitating trade through transport; and (iii) improving cross-border power transmission to boost energy security and reliability (Figure 8). Changing global economic and trade landscapes prompted SASEC to develop a new vision to meet the subregion’s collective growth and development objectives.
SASEC was created with the understanding that regional cooperation can help address members’ constraints of size, geography, and institutional capacity. SASEC economies individually lack the factors that typically drive faster integration while facing high costs to trade, inadequate infrastructure—smaller Bhutan and Nepal are also landlocked. ADB is SASEC’s lead financier, provides the Secretariat,
and generally acts as development partner. ADB support covers (i) capacity building and institutional strengthening, (ii) various regional initiatives, and (iii) financing for projects and technical assistance (ADB, 2016).
Trade Facilitation in South Asia Subregional Economic Cooperation
SASEC’s Trade Facilitation Strategic Framework 2014–2018 covers national and subregional projects in five priority areas: (i) customs modernization and harmonization; (ii) standards and conformity assessments focusing on SPS measures; (iii) improving cross-border facilities, (iv) transport facilitation, and (v) institutional capacity building. It provides support to Bangladesh, Bhutan, the Maldives, and Nepal for policy-based and regulatory reforms, streamlining processes and procedures, and planning institutional arrangements to establish national single windows (ADB and CAREC 2014). The Trade Facilitation Strategic Framework (through the SASEC Customs

Trade Facilitation for a More Inclusive and Connected Asia and Pacific Region 14
Subgroup) oversees subregional and national projects, including document exchange at major border crossings and transit process automation.
At the SASEC trade facilitation and transport working group (TFTWG) meetings in 2010–2012, the governments of Bangladesh, Bhutan, India, and Nepal requested ADB to continue its support for SASEC trade facilitation. ADB approved SASEC Trade Facilitation Program loans and grants to Bangladesh, Bhutan, and Nepal in November 2012 to help develop modern customs administrations, streamline regulations and procedures, and provide improved services and information to traders. In addition, at the TFTWG meeting held in Thimphu, Bhutan, in November 2012, SASEC delegations (i) agreed to expand assistance to trade facilitation further through additional technical assistance (TA) and (ii) requested ADB to explore the possibility of providing TAs to help cover specific trade facilitation needs of SASEC members. The TA supports more efficient, transparent, secure, and service-oriented processing of cross-border trade across South Asia.
Through 2025, SASEC’s agenda will be framed within wider integration processes taking place in Asia. This means enhancing economic linkages with East and Southeast Asia, among others. SASEC’s connectivity agenda will be better aligned within the frameworks of the South Asian Association for Regional Cooperation (SAARC) and the Bengal Initiative for Multi-Sectoral Technical and Economic Cooperation (BIMSTEC) to create greater synergy with these other subregional initiatives. The SASEC Operational Plan for 2016–2025 underscores these priorities, with the current project pipeline reflecting those identified by SAARC and BIMSTEC studies—supplemented with projects that will meet the subregion’s emerging needs.
To establish a trade and transport facilitation monitoring mechanism (TTFMM), Bangladesh, Bhutan, and Nepal conducted baseline studies in 2016/17.16 They review trade and transport procedures, report relevant indicators, analyze
16 The first set of the study reports for Bangladesh have been published (https://www.adb.org/publications/ttfmm-baseline-study-bangladesh). The other two set of reports for Bhutan and Nepal, respectively, will be released in 2017.
bottlenecks, and recommend options going forward. The TTFMM baseline data will be used as the basis for benchmarking trade and transport facilitation performance over time.
The Pacific
Overview and Trade Facilitation
ADB has 14 developing member countries in the Pacific.17 Geographically, the Pacific island countries are more remote from major markets (using GDP-weighted distance) than other small island countries in the Caribbean, for example. Many Pacific island countries are also internally dispersed, with small populations spread out over vastly distant islands.
Small, remote, and dispersed populations contribute to high trade costs that undermine economic competitiveness. Summary indicators on the time and cost required for compliance with border and documentary procedures suggest that the Pacific island countries’ trade facilitation performance is broadly comparable with countries at similar income levels. However, as shown in Figure 3 and Figure 4 above, developing countries in the Pacific lag behind the rest of Asia in implementing trade facilitation reforms. Six of ADB’s 14 Pacific developing member countries are full WTO members and a seventh has observer status. However, none of these countries has yet submitted a protocol of acceptance for the WTO TFA.
Improving connectivity is a key pillar of ADB’s Pacific Approach 2016-2020 and ADB Country Partnership Strategies for Fiji, Papua New Guinea, and Timor-Leste. ADB has been one of the leading supporters of investments that improve transport connectivity through shipping, aviation, and road transport. ADB has also financed undersea telecommunications cables. It is currently implementing a regional TA on trade and transport facilitation to identify and prioritize investments that support improved transport and trade
17 The Cook Islands, the Federated States of Micronesia, Fiji, Kiribati, the Marshall Islands, Nauru, Papua New Guinea, Palau, Samoa, Solomon Islands, Timor-Leste, Tonga, Tuvalu, and Vanuatu.

Status and Progress of Trade Facilitation in Asia and the Pacific 15
linkages, both physical and “soft”. The project includes creating trade forecasts, assessing transport demand and existing bottlenecks, and implementing a trade and transport monitoring mechanism in selected countries. Trade facilitation assessments are done using a participatory approach to build national capacity. Where relevant, they also align with country level TA programs.
Given the natural disadvantages of small and remote markets, it is essential Pacific members minimize policy-induced constraints to trade. UNESCAP’s analysis suggests that Pacific island countries can significantly reduce trade costs through better trade facilitation. ADB’s current TA will help develop a richer baseline on trade facilitation performance in the Pacific and prioritize the investments that improve connectivity. Moving forward, ADB has an important role to play in helping access the financing and technical expertise needed to strengthen trade facilitation across the subregion. Given the significant economic benefits from improved trade facilitation, there may be scope for ADB to provide financing support for trade facilitation through policy based lending operations (ADB 2017b).
3.3 Digital Trade and Small and Medium-sized Enterprises
Digital trade offers a major opportunity for SMEs to better access international markets and global supply chains, giving them the chance to grow both quickly and sustainably.
Benefits from digital trade are numerous for SMEs. The main one is that it can strongly reduce transaction costs. Recent studies have shown that e-commerce reduces the costs associated with physical distance between sellers and consumers by providing both trust and information at a very low cost (Lendle et al., 2016). E-commerce can also reduce costs associated to marketing and commercial canvassing (sellers do not need to attend networking events, travel overseas, or make international calls, as they can sell their goods
online). Moreover, digital tools and the use of ICTs make it possible to offer integrated fulfilment, hosting, translation, customer services and data analytics at a low cost, and make SMEs more productive and efficient. For instance, a study conducted by Duval and Utoktham (2014) found that SMEs using emails were 13 per cent more likely to be involved in exports or international production networks (IPN), highlighting the impact of communication costs reduction.
Apart from transaction costs, e-trade trade allows an easier access to legal information, but also to financial services (for instance, development of microfinance institutions). It improves contact with suppliers and buyers (thanks to the easier communication). Digital trade also reduces costs of intermediate goods, as SMEs have access to a wider market, and so a larger number of suppliers. Lastly, digital trade leads to paper-based practices being abandoned, meaning first a reduction of direct costs linked to fulfilling and exchanging these paper-based documents, and second the possibility to develop harmonized procedures across country. This interoperability of systems and procedures would represent a real gain of time and cost reduction.
Currently, SME participation in trade is often limited by fixed market entry costs, differences in regulation and standards, or access to information, among others. Helping them apply digital trade techniques allow SMEs to reach customers with lower costs, simplified payments, or better data protection, for example. Facilitating SME integration into global markets through digital trade is needed to make them more productive and competitive, and to promote growth.
The following Initiatives have already been taken in Asia and the Pacific to support the participation of SMEs in digital trade.
The ESCAP Framework Agreement on Facilitation of Cross-border Paperless Trade in Asia and the Pacific
In May 2016, after four years of negotiations, the Framework Agreement on Facilitation of Cross-
Trade Facilitation for a More Inclusive and Connected Asia and Pacific Region 16
border Paperless Trade in Asia and the Pacific18 (FA-PT) was adopted, with the aim to facilitate the implementation of cross-border paperless trade among willing ESCAP members States by providing a dedicated intergovernmental framework to develop legal and technical solutions. This agreement is open for signature by ESCAP member States until 30 September 2017, and will enter into force after five member States have ratified it. Entirely dedicated to facilitation of cross-border paperless trade, the FA-TP is complementary to the WTO TFA, which focuses on conventional trade facilitation measures, but does not specifically features paperless trade. Indeed, implementing the framework agreement is expected to help ESCAP member States to meet the Single Window requirements of the WTO TFA.
Benefits from the Framework Agreement are numerous, especially for SMEs. First, it is expected
18 Full text available here: https://treaties.un.org/doc/Treaties/2016/05/20160519%2012-16%20PM/Ch_X-20.pdf
to allow for a strong reduction of paperwork thanks to the electronic exchange of data and documents, leading to communication cost reduction and time saving. Secondly, it should give SMEs from States that will ratify the FA-PT access to a wider market. Thirdly, systems interoperability and norms harmonization are expected, simplifying greatly procedures.
The ASEAN Strategic Action Plan for SME Development 2016–2025
Recognizing the fact that SMEs are key actors of ASEAN economic integration, and that they face many obstacles in terms of access to finance, technology and markets, ASEAN State members developed the Strategic Action Plan for SME Development 2016-2025. Digital integration is at the heart of the Action Plan, with two of the five strategic goals being “promote productivity, technology, and innovation” and “enhance market access and internationalization”.
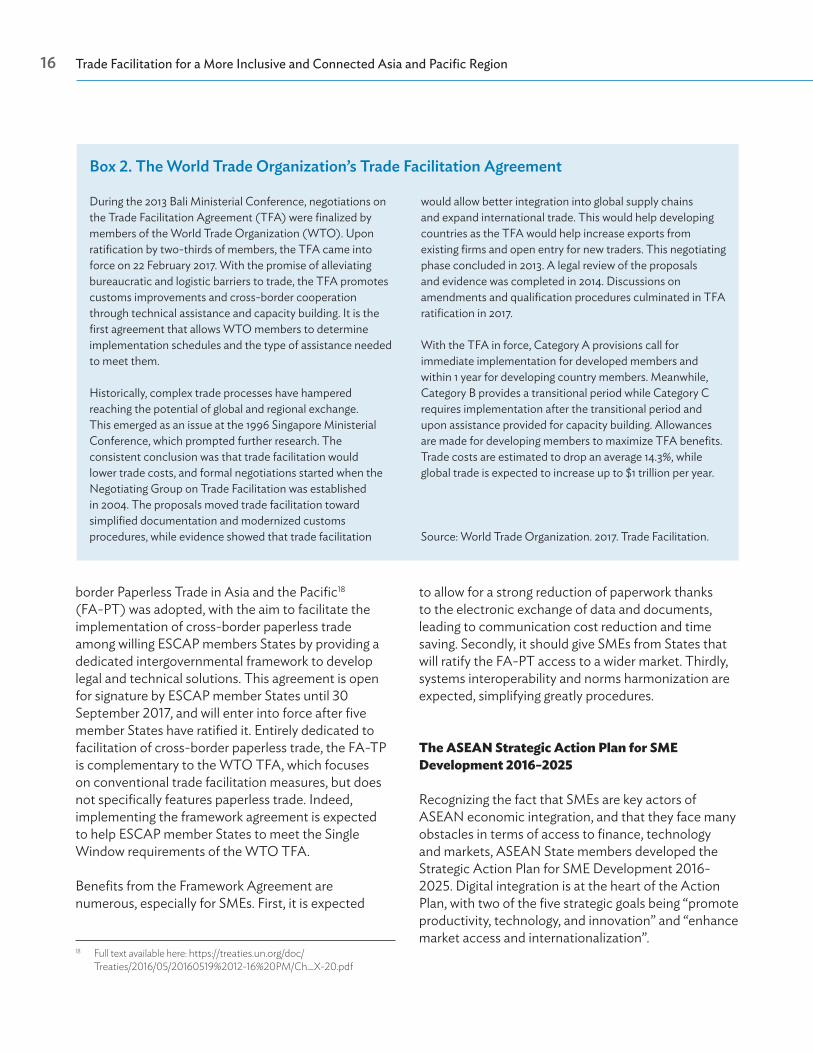
Box 2. The World Trade Organization’s Trade Facilitation Agreement
During the 2013 Bali Ministerial Conference, negotiations on the Trade Facilitation Agreement (TFA) were finalized by members of the World Trade Organization (WTO). Upon ratification by two-thirds of members, the TFA came into force on 22 February 2017. With the promise of alleviating bureaucratic and logistic barriers to trade, the TFA promotes customs improvements and cross-border cooperation through technical assistance and capacity building. It is the first agreement that allows WTO members to determine implementation schedules and the type of assistance needed to meet them.
Historically, complex trade processes have hampered reaching the potential of global and regional exchange. This emerged as an issue at the 1996 Singapore Ministerial Conference, which prompted further research. The consistent conclusion was that trade facilitation would lower trade costs, and formal negotiations started when the Negotiating Group on Trade Facilitation was established in 2004. The proposals moved trade facilitation toward simplified documentation and modernized customs procedures, while evidence showed that trade facilitation
would allow better integration into global supply chains and expand international trade. This would help developing countries as the TFA would help increase exports from existing firms and open entry for new traders. This negotiating phase concluded in 2013. A legal review of the proposals and evidence was completed in 2014. Discussions on amendments and qualification procedures culminated in TFA ratification in 2017.
With the TFA in force, Category A provisions call for immediate implementation for developed members and within 1 year for developing country members. Meanwhile, Category B provides a transitional period while Category C requires implementation after the transitional period and upon assistance provided for capacity building. Allowances are made for developing members to maximize TFA benefits. Trade costs are estimated to drop an average 14.3%, while global trade is expected to increase up to $1 trillion per year.
Source: World Trade Organization. 2017. Trade Facilitation.

Status and Progress of Trade Facilitation in Asia and the Pacific 17
In order to achieve the agreed goals, the Plan is based on a precise roadmap, ASEAN partners dialogue, and periodic monitoring of the plan thanks to ten key policy indicators. For instance, the action “promoting the development and utilization of e-platforms to encourage expansion of SMEs” should be achieved by 2020.19
The APEC SME Working Group Strategic Plan 2017–2020
With the aim to foster the development of SMEs, the Small and Medium Enterprises Working Group (SMEWG) was created in 2000. Aware of the fact that SMEs were facing many trade barriers, the APEC incorporated precise objectives – in terms of digital trade facilitation – into the SMEWG Strategic Plan 2017-2020.20 In particular, the APEC SME Working Group on Digital Transformation was launched, aiming at examining “the nature of digital transformation and its implications for SMEs”.
19 See the whole roadmap: http://asean.org/storage/2015/12/SAP-SMED-Final.pdf
20 One of the four priority areas of the Strategic Plan supporting the growth of SMEs in Asia and the Pacific is “Entrepreneurship, innovation and the internet and digital economy”.

Trade Facilitation for a More Inclusive and Connected Asia and Pacific Region 18

4. Challenges and Way Forward
With the entry into force of the WTO TFA, which focuses on conventional trade facilitation measures, the challenge
is putting the Agreement into practice (see Box 2). Developing and least developed countries are at various stages of setting up trade facilitation measures with the cost of implementation differing in accordance with the measure being considered and the country circumstances. For trade facilitation to successfully drive inclusive growth and poverty reduction, it must enable not only countries in different stages of development, but also different types of industries and enterprises.
Implementing facilitation measures is by nature more challenging than implementing physical infrastructure projects. For example, the impact of delays is greatest on routes crossing multiple borders. But the measures that reduce delays are complex and difficult to implement due to multiple layers of agents and countries. A key challenge going forward is thus to adopt a more integrated approach to transport and trade facilitation that improves efficiency in tandem with new physical infrastructure.
The success of subregional programs—that serve as mutually beneficial platforms for formulating reform policies (similar to the one vessel scheme of the Pacific)—rests exclusively with the group’s member countries. Institutional coordination is essential for successful trade facilitation given its multidimensional and complex components. Commitment and consistency are required—for all stakeholders on policies, systems, and institutions. Improving the business climate and governance are critical prerequisite to maximize trade facilitation results. Sustaining institutional changes requires a long-term
commitment from all national governments involved with subregional programs.21
The assessment from the 2017 global survey on trade facilitation and paperless trade confirms that most countries in the region are actively engaged in implementing measures to improve transparency, enhance inter-agency coordination and cooperation, and streamline fees and formalities associated with trade. While customs services in virtually all countries have been actively developing paperless systems to speed up clearance while improving control, nearly 40% of these economies are also working on more advanced national multi-agency paperless systems, such as national electronic single windows.
However, implementing cross-border (bilateral, subregional or regional) paperless trade systems remains mostly at the pilot stage. This is not surprising given that, on one hand, many developing countries are at an early stage of developing paperless systems and that, on the other hand, more advanced countries have paperless systems not sufficiently harmonized with each other. Given the large potential benefits associated with implementing “next generation” trade facilitation measures,22 countries from all groups must work together to develop the legal and technical protocols needed for the seamless exchange of regulatory and commercial data and documents. Some bilateral work has been done as well as cooperative efforts in several Asian subregions (in ASEAN as part of ASEAN Single Window initiative, for example).
21 In CAREC, for instance, there is a need for countries to revitalize and strengthen their national joint transport and trade facilitation committees. These are considered critical for the effective coordination and implementation of CAREC transport and trade trade-facilitation initiatives at the national level.
22 See ESCAP (2014) at http://www.unescap.org/resources/estimating-benefits-cross-border-paperless-trade

Trade Facilitation for a More Inclusive and Connected Asia and Pacific Region 20
The Framework Agreement on Facilitation of Cross-Border Paperless Trade in Asia and the Pacific, as a UN treaty, provides a unique opportunity for members States to boost their trade and investment competitiveness and actively support the growth of their digital economy. Negotiated as an inclusive and flexible intergovernmental platform to enable the electronic exchange of trade-related data and documents across borders among Parties, the Framework Agreement is set to benefit all parties regardless of their current state of implementation of paperless trade. Therefore, all countries in the Asian-Pacific regional are encouraged to become a party of the treaty as soon as possible to take advantage of being a party, especially in terms of access to capacity building and technical assistance associated with the treaty.
Remarkably, the only trade facilitation performance “monitoring” measure included in the survey (Establishment and publication of average release times) remains one of the least implemented measures across the region. This is important, as what ultimately matters is not how many measures one implements, but how effective they are in reducing the time and cost of trade transactions. Thus, countries should be encouraged to establish a sustainable trade and transport facilitation monitoring mechanism (TTFMM) using UN/CEFACT Recommendation 42 as reference.23 Experience and success stories from TTFMM baseline studies in Bangladesh, Bhutan and Nepal are useful references for others in conducting similar studies.
23 https://www.unece.org/fileadmin/DAM/cefact/recommendations/rec42/ECE_TRADE_C_CEFACT_2017_8E_R1_Rec42.pdf

References
Asian Development Bank (ADB) and ADB Institute. 2015. Pacific Opportunities: Leveraging Asia’s Growth. Manila.
ADB. 2011. The Greater Mekong Subregion Economic Cooperation Program Strategic Framework 2012–2022. Manila.
ADB. 2012. CAREC 2020: A Strategic Framework for the Central Asia Regional Economic Cooperation Program 2011–2020. Manila: Asian Development Bank.
ADB. 2013. GMS Regional Investment Framework 2013–2022. Manila.
ADB and ESCAP. 2013. Designing and Implementing Trade Facilitation in Asia and the Pacific: 2013 update. https://aric.adb.org/pdf/Trade_Facilitation_Reference_Book.pdf
ADB and CAREC. 2014. CAREC Transport and Trade Facilitation Strategy 2020. Manila.
ADB. 2014. SASEC Trade Facilitation Strategic Framework 2014–2018. Manila.
ADB. 2015a. Energy Strategy and Work Plan (2016–2020) for Regional Cooperation in the Energy Sector of CAREC Countries. Background paper for the CAREC Senior Officials’ Meeting. Ulaanbaatar. 23–25 September 2015.
ADB. 2015b. TTF Newsletter. https://www.adb.org/sites/default/files/publication/179782/ttf-01.pdf
ADB. 2016. Asian Economic Integration Report 2016. Manila
ADB. 2017a. Meeting Asia’s Infrastructure Needs. Manila
ADB. 2017b. Presentation summary for trade facilitation in the Pacific at the Regional Workshop on Promoting Connectivity through Trade Facilitation and Aid for Trade (March, 2017)
Central Asia Regional Economic Cooperation. 2016. CPMM Annual Report 2015. http://cfcfa.net/images/downloads/CPMM_AR20_15_%20ENG.pdf
Duval, Y. and C. Utoktham. 2014. Enabling Participation of SMEs in International Trade and Production Networks: Trade Facilitation, Trade Finance and Communication Technology, ARTNeT Working Paper Series No. 146, June 2014, Bangkok, ESCAP.
Lendle, A., M. Olarreaga, S. Schropp and P.L. Vézina. 2016. There goes gravity: eBay and the Death of Distance. Economic Journal, Royal Economic Society, vol. 126(591): 406–441
Lim, A.H., P. Apaza and A. Horj. 2017. Trade and Sustainable Development Goals (SDGs): How can Trade in Education Services Contribute to the SDGs? ADBI Working paper series no. 697. https://www.adb.org/sites/default/files/publication/234541/adbi-wp697.pdf
Organisation for Economic Co-operation and Development [OECD]. 2003. Quantitative Assessment of the Benefits of Trade Facilitation. http://www.oecd.org/officialdocuments/publicdisplaydocumentpdf/?cote=TD/TC/WP(2003)31/FINAL&docLanguage=En
OECD. 2005a. The Costs and Benefits of Trade Facilitation. OECD Policy Brief, October 2005. http://www.oecd.org/trade/facilitation/35459690.pdf
OECD. 2005b. The Economic Impact of Trade Facilitation. http://www.oecd.org/officialdocuments/publicdisplaydocumentpdf/?cote=TD/TC/WP(2005)12/FINAL&docLanguage=En
South Asia Subregional Economic Cooperation (SASEC) Program. http://sasec.asia/
SASEC Secretariat. 2016. SASEC Program: Operational Plan 2016–2025. Manila.

References22
United Nations Economic Commission for Europe [UNECE]. 2012. Trade facilitation - principles and benefits. http://tfig.unece.org/details.html
United Nations Economic and Social Commission for Asia and the Pacific (UNESCAP). 2014. “Estimating the Benefits of Cross-Border Paperless Trade.” http://www.unescap.org/sites/default/files/Benefits%20of%20Cross-Border%20Paperless%20Trade.pdf
UNESCAP. 2015. “Trade Facilitation and Paperless Trade: State of Play and the Way Forward for Asia and the Pacific” http://www.unescap.org/resources/trade-facilitation-and-paperless-trade-state-play-and-way-forward-asia-and-pacific.
UNESCAP. 2016. “Asia-Pacific Trade and Investment Report 2016: Recent Trends and Developments”. http://www.unescap.org/publications/asia-pacific-trade-and-investment-report-2016-recent-trends-and-developments
UNNExT. 2011. “Towards a Single Window Trading Environment: Japan’s Development of a Single Window – Case of NACCS.” http://www.unescap.org/sites/default/files/brief6.pdf
UNNExT. 2012. “Towards a Single Window Trading Environment: Developing a National Single Window for Import, Export, and Logistics in Thailand.” http://www.unescap.org/tid/UNNExT/pub/brief8.pdfWorld Trade Organization. 2016. World Trade Report 2016: Levelling the trading field for SMEs. pp. 108-123 https://www.wto.org/english/res_e/booksp_e/world_trade_report16_e.pdf
World Trade Organization [WTO]. 2017. Trade Facilitation. https://www.wto.org/english/tratop_e/tradfa_e/tradfa_e.htm

ASIAN DEVELOPMENT BANK
Trade Facilitation for a More Inclusive and Connected Asia and Pacific Region Progress and Way Forward
Trade facilitation increases trade flows, lowers trade cost, and ultimately contributes to sustainable and inclusive growth. This publication, jointly prepared by the Asian Development Bank and the United Nations Economic and Social Commission for Asia and the Pacific, provides an overview of assessments from the 2017 global survey on trade facilitation and paperless trade in the region. The progress and challenges in the regional and subregional trade facilitation efforts being made to streamline trade procedures are also presented.
About the Asian Development Bank
ADB’s vision is an Asia and Pacific region free of poverty. Its mission is to help its developing member countries reduce poverty and improve the quality of life of their people. Despite the region’s many successes, it remains home to a large share of the world’s poor. ADB is committed to reducing poverty through inclusive economic growth, environmentally sustainable growth, and regional integration.
Based in Manila, ADB is owned by 67 members, including 48 from the region. Its main instruments for helping its developing member countries are policy dialogue, loans, equity investments, guarantees, grants, and technical assistance.
About the United Nations Economic and Social Commission for Asia and the Pacific
ESCAP is the regional development arm of the United Nations and serves as the main economic and social development center for the United Nations in Asia and the Pacific. Its mandate is to foster cooperation between its 53 members and 9 associate members. ESCAP provides the strategic link between global and country-level programs and issues. It supports governments of countries in the region in consolidating regional positions and advocates regional approaches to meeting the region’s unique socioeconomic challenges in a globalizing world. The ESCAP office is located in Bangkok, Thailand. Please visit the ESCAP website at www.unescap.org for further information.
ASIAN DEVELOPMENT BANK6 ADB Avenue, Mandaluyong City1550 Metro Manila, Philippineswww.adb.org
TRADE FACILITATION FOR A MORE INCLUSIVE AND CONNECTED ASIA AND PACIFIC REGIONProgress and Way Forward
9 789292 578718
ISBN 978-929257871-8