progress and achievement test (pat) - … · progress and achievement test ... pat reading...
TRANSCRIPT

PG. 1
Waikanae School
Progress and Achievement Test (PAT)
Reading Comprehension 2017
Achievement Results with Student Performance being compared to National Norms,
with Progress Measures for Target Groups,
Indicative National Standard Results for Years 6, 7 and 8 and
Equivalent End of Year Performances for Years 4,5,6,7 and 8

PG. 2
About this Assessment
PAT Reading Comprehension Stanines enable a student’s achievement to be compared against National Norms. They also enable teachers and parents to compare
student performance across cohort groups.
Stanines and their associated test scores have been scaled and ‘normed’ to fit the ‘Bell Curve of Normal Distribution’.
This test became available in its current form to schools in 2008.
This test assesses a student’s level of reading comprehension. This is the tenth time that this test has been used at Waikanae School and it provides excellent insights
into the next steps for learning and teaching.
As the NZCER have supplied the Scaled Score match to National Standards we are able provide the Indicative National Standards grades of Well Below, Below, At,
and Above for Years 6 to 8. This has been treated as an end of year (EOY) summative assessment for 2017 due to the fact that students still have 10 months of learning
to undertake in their relevant Year Group.
As a result of these NZCER Scaled Score Matches we are also able to supply Comparisons to Equivalent Year Group End of Year Performance. It is important to note
with this graphs that students still have 10 months of learning to get to the appropriate Year Level Performance
NZCER have now provided schools with an expected (National Average) rate pf progress from one year to the next as measured by scaled scores. This enables us to
track the progress of cohorts of students against both the national expectation as well as other cohorts of interest within our school. Importantly in order for this to
happen students must have undertaken the assessment twice so that the differential can be calculated and progress of individuals and cohorts can then be analysed.
N.B. NZCER = New Zealand Council for Educational Research (The developers of this assessment tool)

PG. 3
2017 PAT Reading Comprehension Achievement Summary
1. Overall performance across the school is above National Norms. We have 66% of our students at or above Stanine 5. (Norm =60%). This performance is 6% above
the National Norm.
2. This year our overall performance trends up over the five year groups, beginning at 60% in Year 4 and finishing at 80% by year 8.
3. The Year 8 Cohort is a real area of strength with 82% of students at or above Stanine 5 (Norm =60%).
4. In comparison to National Norms our ‘tail’ remains very small. The tail being the 16% students with Stanine Result 1, 2, or 3 (Norm= 23%). This performance is 7%
better than the National Norm.
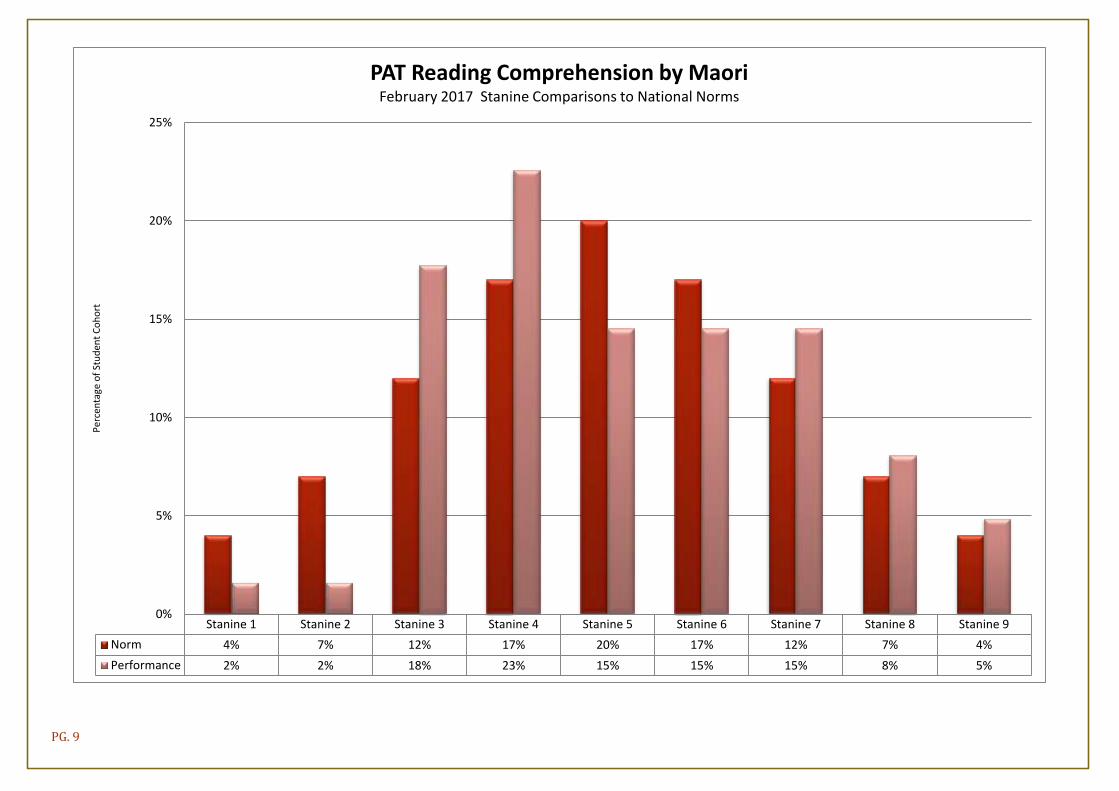
5. In 2014 Maori Performance dropped below National Norms. This trend has plateaued in through 2015, 2016 and 2017. We have 56% of our Maori students at or
above Stanine 5 (Norm =60%). This performance is 4% below the National Norm for all ethnicities. Interestingly 42% of this group are in Stanine 3 and Stanine 4. This
student group will feature in our School Targets for 2017 (see 2017 Charter). Hopefully their achievement will rise in 2017-18 as a result of this.
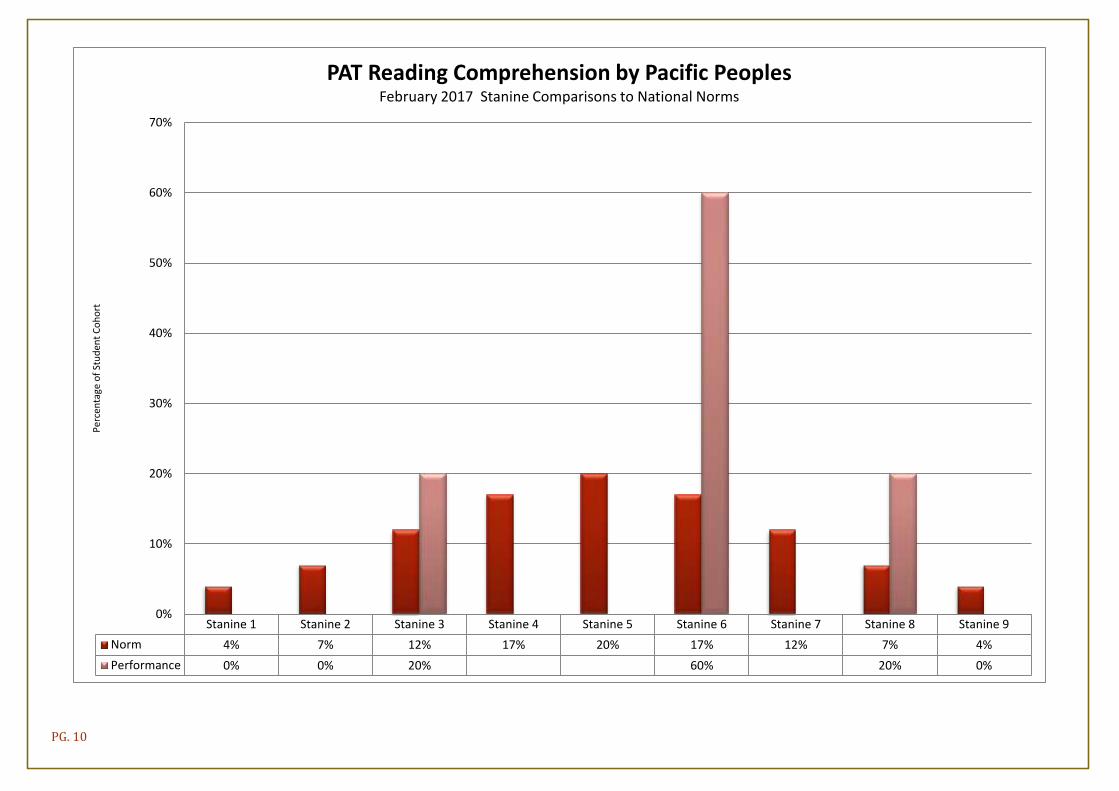
6. For the first time in 6 years Pacific Peoples are above National Norms with 80% of students at or above Stanine 5 (Norm =60%) This performance is 20% above the
National Norm.
It is important to note that this group contains only 5 students or 2% of the test population and due this fact it is hard to place too much emphasis on this seemingly
spectacular improvement. The improvement has more to do with students moving into and out of this cohort rather than improvements from within the cohort.
Furthermore, it is important to note that this cohort is a National Focus Cohort and as such we will continue to report on it even if it is statically unreliable. Therefore,
this student cohort will feature in our School Targets for 2017 (see 2017 Charter)
7. Indicative National Standards results show that 86% of students in Year 6, 7 and 8 are ‘At or Above the Standard’ when the results are interpreted as summative
assessment for 2017. See page 21.
8. Results over time remain consistent for the ‘All’. The plateauing in results for Maori as seen in the last two years continues. There has been a dramatic rise in the
performance for Pacific Peoples when compared to 2016 results.
9. All cohorts have made pleasing progress from one year to the next. See Equivalent Year Group Graphs on pages 16-20.
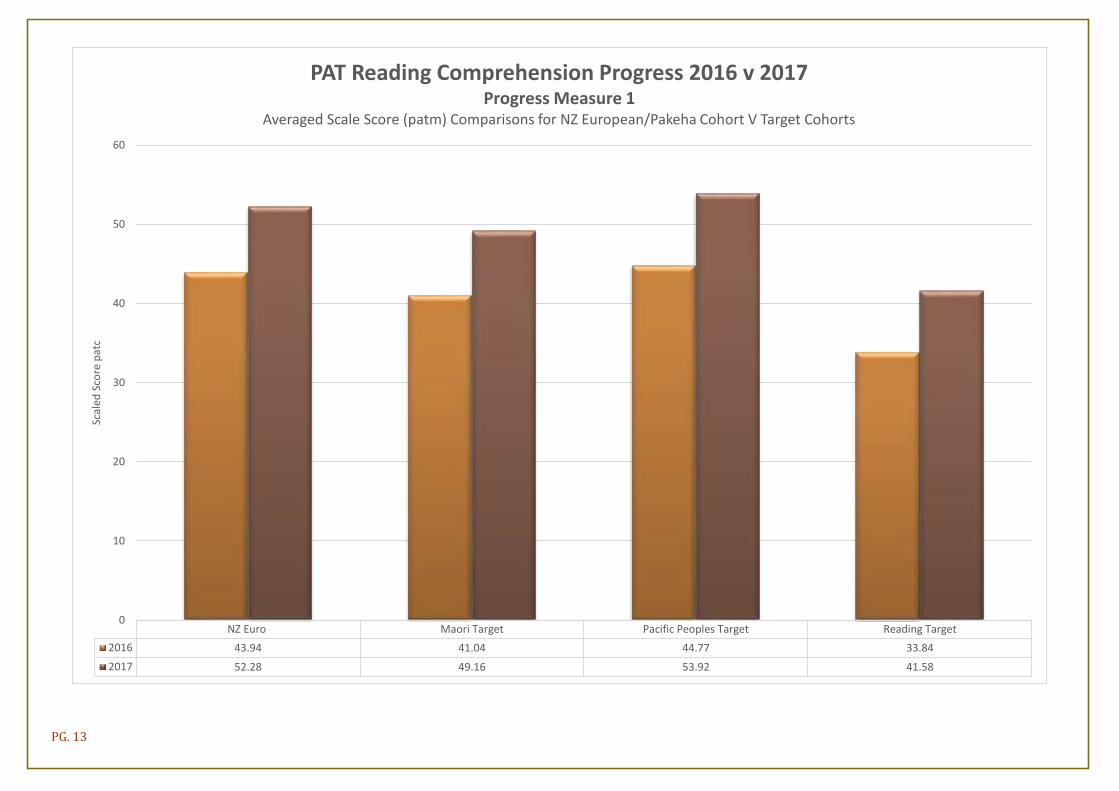
10. The rates of progress as measured by Scale Score show that Maori, Pacific Peoples and NZ European are very similar. There is no apparent ethnic achievement
deficit. Pacific Peoples have made the most progress in 12 months (9.15patc) while Maori made the least at (8.12patc).

PG. 4
11. When looking at progress as measured against a percentage of expectation (100% being 1 year’s progress in 1 calendar year) Maori exceed NZ European by 2%
points
12. When looking at our Reading Target Group it appears the Progress Scores are very low, however one must take into account that every student in this group was either
Well Below or Below the National Standard in Reading on 31 December 2015.
a. There were 28 students who undertook both assessments in (PATs in March 2016 and March 2017). Of this group the following statements can be made
i. 15 Students have made accelerated progress
ii. 6 students have made accelerated progress at more than a rate of 150% (18 months’ progress in 12 calendar months)
iii. This improvement is also reflected in OTJs for Reading with 10 of the 28 students now reading at the National Standard (31 December 2016)

PG. 5
Asian Maori MELAA NZ Euro Other Pacific Peoples
Series1 10 62 10 163 29 5
0
20
40
60
80
100
120
140
160
180
Cp
un
t o
f St
ud
ents
PAT Reading Comprehension 2017Count of Students by Ethnic Group 2017

PG. 6
Stanine 1 Stanine 2 Stanine 3 Stanine 4 Stanine 5 Stanine 6 Stanine 7 Stanine 8 Stanine 9
Norm 4% 7% 12% 17% 20% 17% 12% 7% 4%
Performance 3% 1% 12% 18% 20% 18% 14% 10% 4%
0%
5%
10%
15%
20%
25%
Per
cen
tage
of
Stu
den
t C
oh
ort
PAT Reading Comprehension for AllFebruary 2017 Stanine Comparisons to National Norms

PG. 7
Year 4 Year 5 Year 6 Year 7 Year 8 All
Norm 60% 60% 60% 60% 60% 60%
Performance 60% 60% 65% 64% 82% 66%
0%
10%
20%
30%
40%
50%
60%
70%
80%
90%
Per
cen
tage
of
Stu
den
t C
oh
ort
PAT Reading Comprehension by Year GroupFebruary 2017 Comparison to National Norms Percentage of Students at or Above Stanine 5

PG. 8
Asian Maori MELAA NZ Euro Other Pacific Peoples All
Norm 60% 60% 60% 60% 60% 60% 60%
Performance 70% 56% 80% 69% 62% 80% 66%
0%
10%
20%
30%
40%
50%
60%
70%
80%
90%
Per
cen
tage
of
Stu
den
t C
oh
ort
PAT Reading Comprehension by EthnicityFebruary 2017 Comparison to National Norms Percentage of Students at or Above Stanine 5
PG. 9
Stanine 1 Stanine 2 Stanine 3 Stanine 4 Stanine 5 Stanine 6 Stanine 7 Stanine 8 Stanine 9
Norm 4% 7% 12% 17% 20% 17% 12% 7% 4%
Performance 2% 2% 18% 23% 15% 15% 15% 8% 5%
0%
5%
10%
15%
20%
25%
Per
cen
tage
of
Stu
den
t C
oh
ort
PAT Reading Comprehension by MaoriFebruary 2017 Stanine Comparisons to National Norms
PG. 10
Stanine 1 Stanine 2 Stanine 3 Stanine 4 Stanine 5 Stanine 6 Stanine 7 Stanine 8 Stanine 9
Norm 4% 7% 12% 17% 20% 17% 12% 7% 4%
Performance 0% 0% 20% 60% 20% 0%
0%
10%
20%
30%
40%
50%
60%
70%
Per
cen
tage
of
Stu
den
t C
oh
ort
PAT Reading Comprehension by Pacific PeoplesFebruary 2017 Stanine Comparisons to National Norms

PG. 11
Stanine 1 Stanine 2 Stanine 3 Stanine 4 Stanine 5 Stanine 6 Stanine 7 Stanine 8 Stanine 9
Norm 4% 7% 12% 17% 20% 17% 12% 7% 4%
Performance Girls 2% 3% 10% 13% 21% 19% 14% 13% 5%
Performance Boys 4% 1% 13% 21% 20% 17% 14% 7% 2%
0%
5%
10%
15%
20%
25%
Per
cen
tage
of
Stu
den
t C
oh
ort
PAT Reading Comprehension by GenderFebruary 2017 Stanine Comparisons to National Norms

PG. 12
2012 2013 2014 2015 2016 2017
Norm 60% 60% 60% 60% 60% 60%
All 67% 72% 70% 71% 65% 66%
Maori 69% 73% 57% 58% 57% 56%
Pacific Peoples 35% 40% 27% 43% 28% 80%
0%
10%
20%
30%
40%
50%
60%
70%
80%
90%
Per
cen
tage
of
Stu
den
t C
oh
ort
PAT Reading Comprehension Over Time2012, 2013, 2014, 2015, 2016 and 2017
Comparison to National Norms Percentage of Students at or Above Stanine 5
PG. 13
NZ Euro Maori Target Pacific Peoples Target Reading Target
2016 43.94 41.04 44.77 33.84
2017 52.28 49.16 53.92 41.58
0
10
20
30
40
50
60
Scal
ed S
core
pat
c
PAT Reading Comprehension Progress 2016 v 2017 Progress Measure 1
Averaged Scale Score (patm) Comparisons for NZ European/Pakeha Cohort V Target Cohorts

PG. 14
NZ Euro Maori Target Pacific Peoples Target Reading Target
2017 8.34 8.12 9.15 7.74
7
7.5
8
8.5
9
9.5
Scal
ed S
core
pat
c
PAT Reading Comprehension Progress 2016 v 2017 Progress Measure 2
A measure of progress made in 12 months by averaged Scale Score (patm). Comparisons for NZ European/Pakeha Cohort V Target Cohorts

PG. 15
NZ Euro Maori Target Pacific Peoples Target Reading Target
2017 99.2% 101.3% 97.8% 84.8%
75.0%
80.0%
85.0%
90.0%
95.0%
100.0%
105.0%
% o
f ex
pec
tati
on
rea
ched
PAT Reading Comprehension Progress 2016 v 2017 Progress Measure 3
A measure of progress made in 12 months by percentage of expectation. Comparisons for NZ European/Pakeha Cohort V Target Cohorts

PG. 16
EYG 3 and Below Year 4 EYG 5 EYG 6 EYG 7 EYG 8 EYG 9 EYG 10 and above
2013 31% 13% 37% 6% 8% 2% 4% 0%
2014 16% 12% 35% 20% 16% 0% 0% 2%
2015 0% 6% 24% 37% 16% 6% 10% 2%
2016 5% 4% 4% 13% 34% 18% 18% 5%
2017 0% 2% 4% 4% 21% 33% 19% 18%
0%
5%
10%
15%
20%
25%
30%
35%
40%
Per
cen
tage
of
Stu
den
t C
oh
ort
PAT Reading Comprehension Year 8 Cohort 2017Comparisons to the Equivalent Year Group Performance for 2013, 2014, 2015, 2016 and 2017

PG. 17
EYG 3 and Below Year 4 EYG 5 EYG 6 EYG 7 EYG 8 EYG 9 EYG 10 and above
2104 52% 9% 14% 11% 3% 8% 3% 0%
2015 20% 16% 25% 28% 8% 2% 2% 0%
2016 4% 11% 18% 35% 14% 7% 8% 1%
2017 1% 0% 15% 27% 15% 20% 11% 11%
0%
10%
20%
30%
40%
50%
60%
Per
cen
tage
of
Stu
den
t C
oh
ort
PAT Reading Comprehension Year 7 Cohort 2017Comparisons to the Equivalent Year Group Performance for 2014, 2015, 2016 and 2017

PG. 18
EYG 3 and Below Year 4 EYG 5 EYG 6 EYG 7 EYG 8 EYG 9 EYG 10 and above
2015 51% 14% 23% 9% 2% 0% 0% 0%
2016 35% 17% 20% 22% 7% 0% 0% 0%
2017 6% 10% 21% 33% 8% 15% 2% 4%
0%
10%
20%
30%
40%
50%
60%
Per
cen
tage
of
Stu
den
t C
oh
ort
PAT Reading Comprehension Year 6 Cohort 2017Comparisons to the Equivalent Year Group Performance for 2015, 2016 and 2017

PG. 19
EYG 3 and Below Year 4 EYG 5 EYG 6 EYG 7 EYG 8 EYG 9 EYG 10 and above
2016 56% 12% 16% 8% 2% 2% 4% 0%
2017 32% 19% 25% 11% 9% 4% 0% 0%
0%
10%
20%
30%
40%
50%
60%
Per
cen
tage
of
Stu
den
t C
oh
ort
PAT Reading Comprehension Year 5 Cohort 2017Comparisons to the Equivalent Year Group Performance for 2016 and 2017
PG. 20
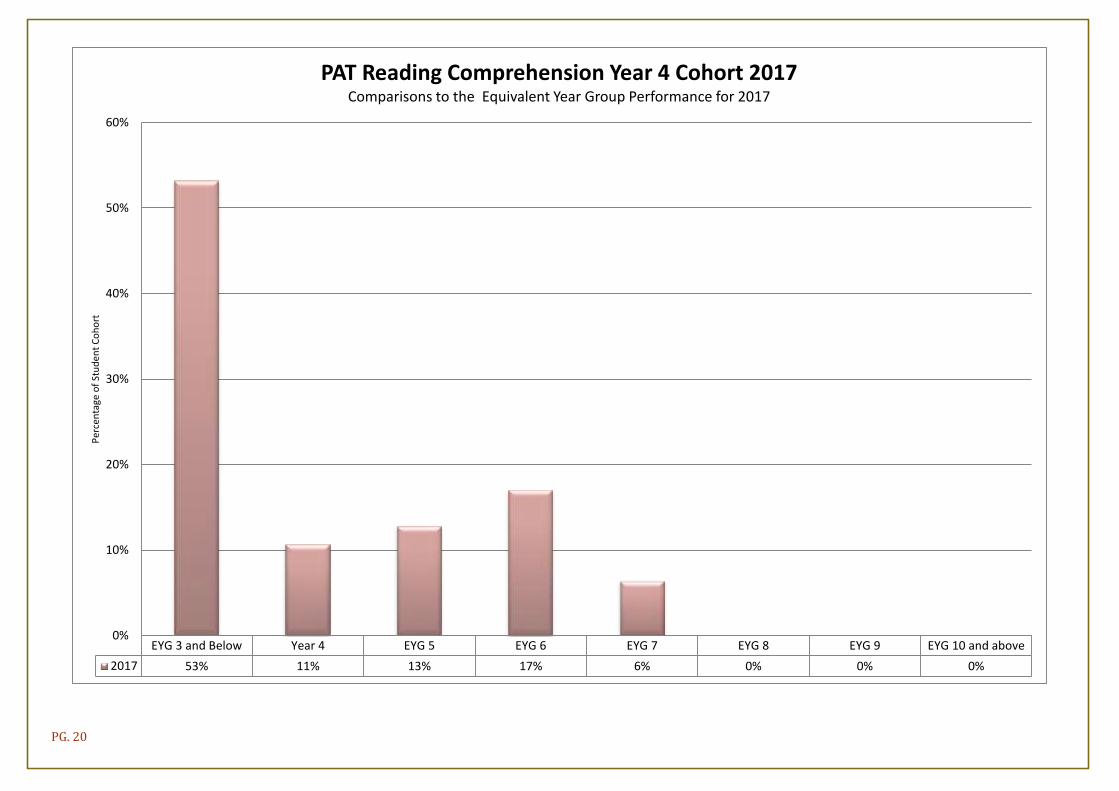
EYG 3 and Below Year 4 EYG 5 EYG 6 EYG 7 EYG 8 EYG 9 EYG 10 and above
2017 53% 11% 13% 17% 6% 0% 0% 0%
0%
10%
20%
30%
40%
50%
60%
Per
cen
tage
of
Stu
den
t C
oh
ort
PAT Reading Comprehension Year 4 Cohort 2017Comparisons to the Equivalent Year Group Performance for 2017

PG. 21
Well Below Below At Above
Year 6 6% 10% 21% 63%
Year 7 1% 15% 27% 57%
Year 8 5% 4% 21% 70%
All 4% 10% 23% 63%
0%
10%
20%
30%
40%
50%
60%
70%
80%
Per
cen
tage
of
Stu
den
t C
oh
ort
PAT Reading Comprehension by YearIndicative Performance against the National Standards as an
EOY Summative for 2017 for Year 6, 7, and 8 Students only

PG. 22
Well Below Below At Above
Boys 4% 11% 30% 55%
Girls 4% 8% 15% 73%
0%
10%
20%
30%
40%
50%
60%
70%
80%
Per
cen
tage
of
Stu
den
t C
oh
ort
PAT Reading Comprehension by GenderIndicative Performance against the National Standards as an
EOY Summative for 2017 for Year 6, 7, and 8 Students only

PG. 23
All Asian Maori MELAA NZ Euro Other Pacific Peoples
Well Below 4% 0% 5% 0% 4% 5%
Below 10% 14% 14% 0% 8% 16%
At 23% 29% 27% 0% 26% 11%
Above 63% 57% 54% 100% 62% 68% 100%
0%
20%
40%
60%
80%
100%
120%
Per
cen
tage
of
Stu
den
t C
oh
ort
PAT Reading Comprehension by EthnicityIndicative Performance against the National Standards as an
EOY Summative for 2017 for Year 6, 7, and 8 Students only
PG. 24
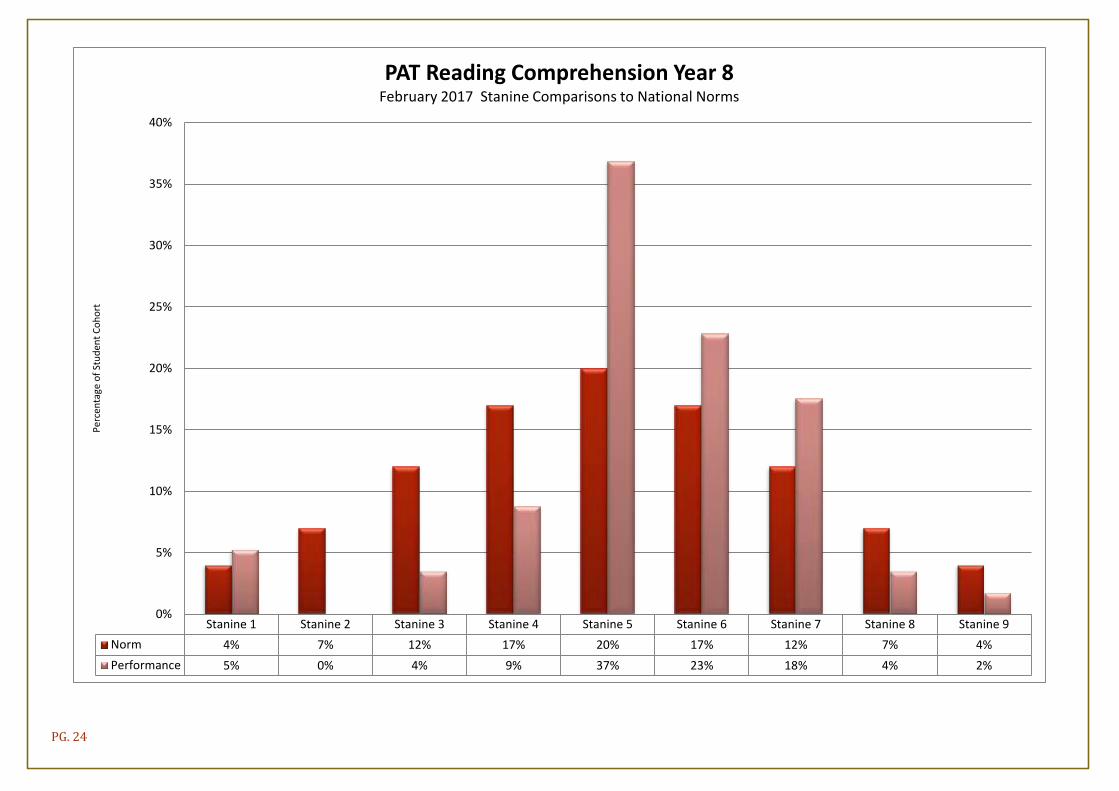
Stanine 1 Stanine 2 Stanine 3 Stanine 4 Stanine 5 Stanine 6 Stanine 7 Stanine 8 Stanine 9
Norm 4% 7% 12% 17% 20% 17% 12% 7% 4%
Performance 5% 0% 4% 9% 37% 23% 18% 4% 2%
0%
5%
10%
15%
20%
25%
30%
35%
40%
Per
cen
tage
of
Stu
den
t C
oh
ort
PAT Reading Comprehension Year 8February 2017 Stanine Comparisons to National Norms

PG. 25
Stanine 1 Stanine 2 Stanine 3 Stanine 4 Stanine 5 Stanine 6 Stanine 7 Stanine 8 Stanine 9
Norm 4% 7% 12% 17% 20% 17% 12% 7% 4%
Performance 1% 0% 11% 24% 14% 15% 22% 7% 7%
0%
5%
10%
15%
20%
25%
30%
Per
cen
tage
of
Stu
den
t C
oh
ort
PAT Reading Comprehension Year 7February 2017 Stanine Comparisons to National Norms

PG. 26
Stanine 1 Stanine 2 Stanine 3 Stanine 4 Stanine 5 Stanine 6 Stanine 7 Stanine 8 Stanine 9
Norm 4% 7% 12% 17% 20% 17% 12% 7% 4%
Performance 2% 4% 10% 19% 13% 23% 8% 17% 4%
0%
5%
10%
15%
20%
25%
Per
cen
tage
of
Stu
den
t C
oh
ort
PAT Reading Comprehension Year 6February 2017 Stanine Comparisons to National Norms

PG. 27
Stanine 1 Stanine 2 Stanine 3 Stanine 4 Stanine 5 Stanine 6 Stanine 7 Stanine 8 Stanine 9
Norm 4% 7% 12% 17% 20% 17% 12% 7% 4%
Performance 2% 2% 19% 17% 21% 21% 6% 9% 4%
0%
5%
10%
15%
20%
25%
Per
cen
tage
of
Stu
den
t C
oh
ort
PAT Reading Comprehension Year 5February 2017 Stanine Comparisons to National Norms

PG. 28
Stanine 1 Stanine 2 Stanine 3 Stanine 4 Stanine 5 Stanine 6 Stanine 7 Stanine 8 Stanine 9
Norm 4% 7% 12% 17% 20% 17% 12% 7% 4%
Performance 4% 2% 17% 17% 19% 11% 15% 15% 0%
0%
5%
10%
15%
20%
25%
Per
cen
tage
of
Stu
den
t C
oh
ort
PAT Reading Comprehension Year 4February 2017 Stanine Comparisons to National Norms