programmatic sustainable remediation …€¦ · · 2017-03-24current pg&e sustainable...
TRANSCRIPT

© Pacific Gas and Electric Company, 2012
by
Haley & Aldrich, Inc. San Diego, California
and
Endpoint Consulting, Inc. San Francisco, California
for
Pacific Gas and Electric Company San Ramon, California
July 2012
PROGRAMMATIC SUSTAINABLE REMEDIATION GUIDANCE (Revision 1)

© Pacific Gas and Electric Company, 2012 i
EXECUTIVE SUMMARY Sustainable remediation enables the integration of sustainable practices across environmental remediation projects in order to enhance environmental, social, and economic benefits. Sustainable practices include those that are least disruptive to the environment, emit minimal atmospheric emissions, reduce social and economic impacts, consider impacts beyond site boundaries, and are endpoint focused. Sustainability has become a core element of Pacific Gas and Electric Company’s (PG&E’s) corporate culture. PG&E has therefore developed this programmatic sustainable remediation guidance (herein referred to as “Guidance”) in consultation with representatives of the California Department of Toxic Substances Control (DTSC) to assist in the integration of sustainability principles and practices into PG&E’s environmental remediation program. This Guidance reflects the collaboration between different stakeholders, including but not limited to representatives from various PG&E and DTSC departments. The Guidance is intended to provide an ongoing, iterative thought process for the application of sustainability at any point during the remediation project life cycle, from project planning through to site closure and post-remediation site conditions, where applicable, and provides a standardized process for the integration of sustainable practices across PG&E remediation projects. The Guidance presents a framework which enables the identification/evaluation, implementation and benefit quantification of sustainable practices. The framework combines an activity-specific sustainability approach with the inherent interaction between overarching project activities, including Project Planning, Remediation Investigation, Feasibility Study, Remedial Design and Implementation, and Operation and Maintenance/Site Closure activities. In doing so, implementation of sustainable best management practices is evaluated through estimation of sustainability benefits and an overall project sustainability rating. A consistent approach is provided for the different project activities to:
Identify sustainability stressors (defined as physical, chemical or biological parameters with the potential to produce environmental, economic and/or social impacts);
Identify sustainability best management practices (BMPs) to address each stressor;
Perform a sustainability evaluation to assess the benefits of the implemented BMPs; and
Designate a resulting activity-specific sustainability rating.
Once sustainability ratings have been provided for the project-specific activities, the activity-specific ratings are combined to provide an overall project sustainability rating. The project sustainability rating enables the project team to benchmark the sustainability benefits of different projects across various PG&E projects and over time. In addition, the cumulative benefits of sustainable BMP application are evaluated across the entire project lifecycle for seven key sustainability elements, contributing to PG&E’s programmatic cumulative compilation of such benefits across its entire environmental remediation portfolio. These cumulative benefits are updated on a quarterly basis and to date reflect contributions of BMP benefits from more than 70 remediation sites. Specifically, through the end of First Quarter 2012, implementation of the sustainable practices outlined in this Guidance have resulted in significant benefits highlighted by reductions in greenhouse gas emissions by more than 6,000 metric tons of carbon

© Pacific Gas and Electric Company, 2012 ii
dioxide equivalents, reductions in liquid Investigation Derived Waste (IDW) by more than 7 million gallons, boosts to economies local to remediation sites in excess of $13M, and stakeholder satisfaction approximating 99%. The Guidance is intended to be a dynamic, living document that can be updated as the sustainable remediation practice evolves, both globally and at PG&E-specific remediation project sites. The Guidance is aligned with the DTSC Interim Advisory for Green Remediation, allowing the results and lessons learned from this Guidance to be integrated into future versions of the DTSC Interim Advisory, if applicable.

© Pacific Gas and Electric Company, 2012 iii
TABLE OF CONTENTS Page EXECUTIVE SUMMARY i LIST OF TABLES vi LIST OF FIGURES vi GLOSSARY vii
1. INTRODUCTION 1
1.1 Guidance Overview 2 1.2 Guidance Layout 3
2. CURRENT PG&E SUSTAINABLE REMEDIATION ACHIEVEMENTS 5
3. GUIDANCE IMPLEMENTATION 7
4. SUSTAINABILITY FRAMEWORK 10
4.1 Introduction to the Sustainability Framework 10 4.2 Components of the Framework 10
4.2.1 Life Cycle Approach 10 4.2.2 Activity-specific Sustainability Evaluation 12 4.2.3 Project Sustainability Rating 12 4.2.4 Cumulative Sustainability Benefits 13
5. GREEN REMEDIATION EVALUATION MATRIX DESCRIPTION 14
5.1 Overview 14 5.2 Sustainability Stressors 17
5.2.1 Stressor Identification 17 5.2.2 Stressor Applicability 20
5.3 Sustainability Best Management Practices 20 5.4 Sustainability Impact Evaluation 21
5.4.1 Types of Evaluation 21 5.4.2 Metrics 21 5.4.3 Evaluation Result 22 5.4.4 Result Standardization 22
5.5 Recommendations for Additional Sustainability Best Management Practices 26 5.6 Activity-Specific Rating System 26 5.7 Data Management and Reporting 27
6. PROJECT PLANNING AND OFFICE-BASED TASKS 29
6.1 Key Elements of Project Planning and Office Based Tasks 29 6.2 Sustainability Approach 29
6.2.1 Stressor Identification and Applicability Evaluation 30 6.2.2 Sustainability Best Management Practices 30 6.2.3 Sustainability Impact Evaluation 32
6.3 Project Planning and Office-Based Tasks Sustainability Rating System 32 6.4 Recommendations for Additional Sustainability Best Management Practices 32 6.5 Data Management and Reporting 32

© Pacific Gas and Electric Company, 2012 iv
7. REMEDIAL INVESTIGATION 34
7.1 Key Elements of Remedial Investigation 34 7.2 Sustainability Approach 34
7.2.1 Stressor Identification and Applicability 34 7.2.2 Sustainability Best Management Practices 36 7.2.3 Sustainability Impact Evaluation 37
7.3 RI Activity-Specific Sustainability Rating System 37 7.4 Recommendations for Additional Sustainability Best Management Practices 37 7.5 Data Management and Reporting 37
8. FEASIBILITY STUDY 39
8.1 Key Elements of the Feasibility Study 39 8.2 Sustainability Approach 39
8.2.1 Stressor Identification and Applicability 42 8.2.2 Sustainability Best Management Practices 42 8.2.3 Sustainability Impact Evaluation 42
8.3 FS Activity-Specific Sustainability Rating System 43 8.3.1 Remedial Alternative Rating System 43 8.3.2 FS Activity-Specific Rating System 44
8.4 Recommendations for Additional Sustainability Best Management Practices 44 8.5 Data Management and Reporting 44
9. REMEDIAL DESIGN AND IMPLEMENTATION 45
9.1 Key Elements of Remedy Design and Implementation 45 9.2 Sustainability Approach 45
9.2.1 Stressor Identification and Applicability 45 9.2.2 Sustainability Best Management Practices 47 9.2.3 Sustainability Impact Evaluation 47
9.3 RDI-Activity Specific Sustainability Rating System 48 9.4 Recommendations for Additional Sustainable Practices 48 9.5 Data Management and Reporting 48
10. OPERATION AND MAINTENANCE AND CLOSURE (INCLUDING POST-REMEDIATION SITE CONDITIONS) 49
10.1 Key Elements of Operation and Maintenance/Closure 49 10.2 Sustainability Approach 49
10.2.1 Stressor Identification and Applicability 50 10.2.2 Sustainability Best Management Practices 50 10.2.3 Sustainability Impact Evaluation 52
10.3 Operation and Maintenance, and Closure Sustainability Rating System 52 10.4 Recommendations for Additional Sustainability Best Management Practices 52 10.5 Data Management and Reporting 52
11. PROJECT SUSTAINABILITY RATING 54
11.1 Recording of Results 56

© Pacific Gas and Electric Company, 2012 v
12. CUMULATIVE SUSTAINABILITY BENEFITS 57
12.1 Recording of Results 58 REFERENCES 59 TABLES FIGURES APPENDIX A – Data Collection Templates APPENDIX B – Publicly Available Sustainable Remediation Tools APPENDIX C – Example Sustainable Best Management Practices APPENDIX D – Stressor Fact Sheets APPENDIX E – PG&E Remediation Projects Cumulative Sustainability Benefits
through March 30, 2012

© Pacific Gas and Electric Company, 2012 vi
LIST OF TABLES Table No. Title Page I Example Green Remediation Evaluation Matrix ........................................... 15-16 II Sustainability Evaluation Results Standardization ....................................... 23-25 III Green Remediation Evaluation Matrix for Project Planning
and Office-Based Tasks ........................................................................................... 31 IV Green Remediation Evaluation Matrix for Remedial Investigation
Activities .................................................................................................................... 35 V Green Remediation Evaluation Matrix for Feasibility Study Activities ..... 40-41 VI Green Remediation Evaluation Matrix for Remedial Design
and Implementation Activities .............................................................................. 46 VII Green Remediation Evaluation Matrix for Operation and Maintenance/
Closure (Including Post-Remediation Site Conditions) Activities .................... 51 LIST OF FIGURES Figure No. Title Page 1 Programmatic Sustainability Framework ............................................................ 10

© Pacific Gas and Electric Company, 2012 vii
GLOSSARY BMP Best Management Practice
CAP Corrective Action Plan
CSM Conceptual Site Model
DTSC Department of Toxic Substances Control
ESA Environmental Site Assessment
GHG greenhouse gas
GREM Green Remediation Evaluation Matrix
FS Feasibility Study
IDW investigation-derived waste
O&M Operation & Maintenance
PG&E Pacific Gas & Electric Company
RDI Remedial Design and Implementation
RAP Remedial action plan
RAW Remedial action workplan
RI Remedial Investigation
SURF Sustainable Remediation Forum
USEPA United States Environmental Protection Agency
VCA Voluntary Cleanup Agreement

© Pacific Gas and Electric Company, 2012 1
The Guidance is intended to provide a living, iterative thought process for the
application of sustainability at any point throughout the remediation project life cycle.
The Guidance complies with requirements provided by the various regulatory agencies in California, and emphasizes
protection of human health and the environment at all times.
1. INTRODUCTION Sustainable remediation enables the integration of sustainable practices across environmental remediation projects in order to enhance environmental, social, and economic benefits. Sustainable practices include those that are least disruptive to the environment, emit minimal atmospheric emissions, reduce social and economic impacts, consider impacts beyond site boundaries, and are endpoint focused. Significant breakthroughs have occurred in the sustainable remediation field over the last few years, resulting in the publication of guidance, strategies, and policies by regulators, government entities, and industry (e.g. United States Environmental Protection Agency [EPA], 2008, California Department of Toxic Substances Control [DTSC], 2009). In line with these breakthroughs and with a commitment toward sustainability, Pacific Gas and Electric Company (PG&E) has developed this programmatic sustainable remediation guidance (herein referred to as “Guidance”) in consultation with representatives of the DTSC to assist the project team to integrate sustainability principles and practices across PG&E remediation projects.
The Guidance is intended to provide a living, iterative thought process for the application of sustainability at any point throughout the remediation project life cycle. It provides a comprehensive and user-friendly resource for the project team with a range of sustainability experience. It outlines an overarching framework for implementing sustainability, but empowers the project team to draw upon a wide range of resources and project-specific considerations in customizing
the framework to their sites. The Guidance further emphasizes incorporation of sustainable decision-making in an efficient manner, with minimal imposition on typical project life cycles and budgets. The Guidance complies with requirements provided by the various regulatory agencies in California, and emphasizes protection of human health and the environment at all times. The Guidance provides a step-by-step, standardized process for the integration of sustainability principles and practices across all PG&E remediation projects. It is intended to be a dynamic, evolving document that may be updated as the sustainable remediation practice evolves. The Guidance is currently being applied to over 70 PG&E remediation sites, with the goal of application across the entire PG&E remediation portfolio. The lessons learned, high-value sustainability results and solutions from the application of the Guidance to these sites may be included in future versions of the Guidance. The Guidance is also aligned with the DTSC Interim Advisory for Green Remediation (DTSC, 2009) and the results and lessons learned from implementation of the Guidance may also be integrated into future versions of DTSC’s advisory, if applicable.
© Pacific Gas and Electric Company, 2012 2
The Guidance recognizes that each project is unique and thereby requires the
implementation of different activities to reach project completion.
1.1 Guidance Overview The Guidance is designed so that sustainability can be applied consistently throughout the remediation project life cycle, from project planning through site closure and post-remediation site conditions. It presents a framework for illustrating the relationship between:
The project’s overarching activities;
The activity-specific sustainability approach; and
The project’s overall sustainability approach.
The project activities covered by the Guidance include:
Project Planning;
Remedial Investigation (RI);
Feasibility Study (FS);
Remedial Design and implementation (RDI); and
Operation and Maintenance (O&M)/Closure.
Because office-based tasks are required to support project activities, they are included as part of Project Planning. Post-remediation site conditions are also covered in the Guidance, as some projects may identify opportunities to incorporate sustainable practices during and following site closure. Post-remediation site conditions are included within the O&M/Closure activities. The Guidance recognizes that each project is unique and thereby requires the implementation of
different activities to reach project completion. For example, certain projects do not necessitate FS activities, and instead proceed directly from RI activities to RDI activities. Additionally, certain projects activities are often streamlined. The Guidance is therefore inherently flexible and can be applied to different PG&E projects regardless of their overall structure. For ease of use however, the Guidance is divided into sections that cover the activities most frequently encountered during PG&E projects. The framework enables sustainable practices to be incorporated into the different project activities using a consistent approach that includes the following elements:
Description of the project activities;
Identification and selection of stressors that may have a potential sustainability impact as a result of the project activities. Stressors are defined as physical, chemical or biological parameters with the potential to produce environmental, economic and/or social impacts;
Identification of sustainability Best Management Practices (BMPs) that will be implemented to address each stressor;

© Pacific Gas and Electric Company, 2012 3
Description of the sustainability impact evaluations to be performed for each stressor, detailing:
– The type of impact evaluation required (for example whether the evaluation is quantitative or qualitative);
– The impact evaluation methodology;
– Appropriate metrics;
– Tools available to assist with the sustainability evaluation;
– A standardization process to assess sustainability impacts caused by each stressor. Standardization will be achieved by assigning a qualitative (“Low”, “Moderate”, “High”) sustainability impact score for each stressor;
– Recommendations for additional sustainable practices; and
Provision of an activity-specific rating. This activity-specific sustainability rating is achieved by combining the stressor-specific sustainability impact scores.
Once sustainability ratings have been developed for the project-specific activities, the activity-specific ratings will be combined to provide an overall project sustainability rating. The rating system is simple and easy to use. A project will achieve a “Platinum”, “Gold” or “Silver” project rating, corresponding to the overall sustainability of the project. These ratings enable different project teams to benchmark the sustainability benefits of PG&E projects and sites against each other and over time. In addition, cumulative benefits of BMP application across the entire lifecycle will be estimated for seven key sustainability elements for each project, and combined to provide a cumulative benefits roll-up of benefits across the entire PG&E remediation portfolio.
1.2 Guidance Layout The Guidance is divided according to activities that may be performed as part of a typical PG&E remediation project in order to be granted site closure (including Project Planning, RI, FS, RDI and O&M/Closure). As mentioned above, each remediation project is unique and thereby requires the implementation of different activities to reach project completion. Furthermore, many PG&E projects are already underway (for example, some projects are currently undertaking FS activities) and therefore may not be able to implement sustainable practices for previous project activities (for example RI activities). The layout of the Guidance enables project teams to implement only those sections applicable to their projects. The Guidance includes the following sections:
Section 1 – Introduction;
Section 2 – Examples of current PG&E sustainable remediation achievements;
Section 3 – Guidance implementation;
Section 4 – Sustainability framework;
Section 5 – Green Remediation Evaluation Matrix (GREM) description;

© Pacific Gas and Electric Company, 2012 4
Section 6 – Project Planning and Office-Based Tasks;
Section 7 – Remedial Investigation (RI);
Section 8 – Feasibility Study (FS);
Section 9 – Remedial Design and Implementation (RDI);
Section 10 – Operation and Maintenance (O&M), and Closure (including post-remediation site conditions);
Section 11 – Project Sustainability Rating; and
Section 12 – Cumulative Benefits of Sustainable BMPs.

© Pacific Gas and Electric Company, 2012 5
2. CURRENT PG&E SUSTAINABLE REMEDIATION ACHIEVEMENTS While this guidance was under preparation, PG&E deployed an interim approach to implement and track cumulative sustainable benefits across its portfolio of remediation projects; an approach which has been transitioned into this Guidance. The seven key sustainable elements subject to this cumulative benefits tracking include:
Reductions in greenhouse gas (GHG) emissions;
Savings in energy consumption through the utilization of renewable energy sources;
Reductions in offsite disposal of solid wastes (i.e. recycled wastes);
Reductions in soil investigation derived wastes (IDW);
Reductions in liquid IDW;
Boosts to the local economy; and
Stakeholder satisfaction. Relative to these elements, examples of successful BMPs implemented to date during remediation activities have included:
Employment of construction equipment compliant with Tier 3 Federal Emissions Standards;
Elimination of all portable equipment such as diesel generators and pumps;
Employment of an idling reduction plan for all trucks;
Implementation of a vehicle reduction and car pooling plan;
Implementation of a recycling plan for demolition waste;
Implementation of a local economy boost plan;
Employment of remote sensing technology for subsurface investigations;
Segregation and stockpiling of waste materials to reduce the number of waste trips off-site;
In-place management of impacted media and utilization of Coremat to reduce excavation depth and volume of solid waste; and
Returning of dewatering aqueous stream to surface water thereby eliminating liquid IDW.
Implemented since the First Quarter of 2011, each passing quarter has resulted in contributions from an increasing number of remediation sites, allowing for the cumulative roll-up on a quarterly basis of sustainable benefits across more than 70 participating sites. Implementation of BMPs such as those summarized above have already resulted in significant sustainability improvements across different PG&E sites. Some of the benefits date back to prior years, wherein project teams have reviewed historical practices and captured the associated benefits. The most recent compilation of the cumulative sustainability benefits corresponds to the benefits of BMP implementation through the First Quarter of 2012. Through this time frame,
© Pacific Gas and Electric Company, 2012 6
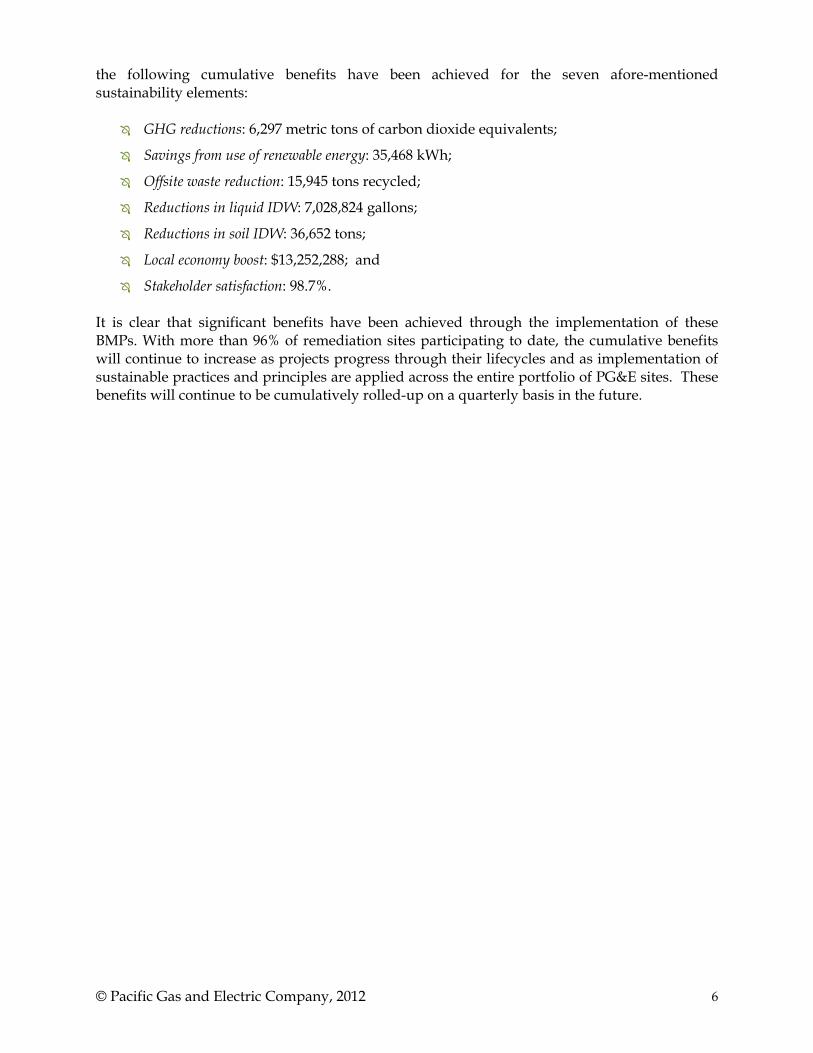
the following cumulative benefits have been achieved for the seven afore-mentioned sustainability elements:
GHG reductions: 6,297 metric tons of carbon dioxide equivalents;
Savings from use of renewable energy: 35,468 kWh;
Offsite waste reduction: 15,945 tons recycled;
Reductions in liquid IDW: 7,028,824 gallons;
Reductions in soil IDW: 36,652 tons;
Local economy boost: $13,252,288; and
Stakeholder satisfaction: 98.7%. It is clear that significant benefits have been achieved through the implementation of these BMPs. With more than 96% of remediation sites participating to date, the cumulative benefits will continue to increase as projects progress through their lifecycles and as implementation of sustainable practices and principles are applied across the entire portfolio of PG&E sites. These benefits will continue to be cumulatively rolled-up on a quarterly basis in the future.

© Pacific Gas and Electric Company, 2012 7
The Guidance is not designed to replace any
other requirements related to the project.
The need for teamwork for the implementation of the
Guidance cannot be overstated.
The project team is responsible for ensuring
that all persons involved in the project understand how the Guidance will tie in to their work and that they implement applicable
sustainable practices to the extent possible.
3. GUIDANCE IMPLEMENTATION
The Guidance outlines an approach for identifying opportunities to incorporate sustainability throughout the remediation project life cycle. The approach describes how the project team should identify and implement potential sustainability BMPs and subsequently perform a sustainability evaluation to quantify the benefits achieved from implementation of these BMPs. The
Guidance is not designed to replace any other requirements related to the project. It is therefore necessary that the project meets the requirements imposed by the regulatory agency. The BMPs outlined in the Guidance, particularly those potentially impacting field investigation and remediation tasks, are subject to regulatory review and approval through the workplan process. This Guidance will not be utilized in emergency situations requiring urgent responses. The approach places significant emphasis on key sustainability decisions to be made by the project team throughout the different project activities, with many decisions being unique and activity-specific. To this end, the need for teamwork for the implementation of the Guidance cannot be overstated. The Guidance encourages formal recognition of a project team at the inception of each project, with routine and comprehensive collaboration throughout the project life cycle in support of sustainable decision-making. At a minimum, the project team will typically comprise of:
PG&E project managers;
Environmental consultants and contractors;
Regulators; and
PG&E’s environmental counsel, where applicable.
While additional support staff, including those from PG&E, material and waste haulers, laboratories and other stakeholders may also be involved on the project, the team members bulleted above will have the primary responsibility for implementing the Guidance and for making decisions relating to sustainability. The Guidance however also recognizes that changes in team members may take place over time and different team members may become involved as the project progresses. The project team is responsible for ensuring that all persons involved in the project understand how the Guidance will tie in to their work and that they implement applicable sustainable practices to the
extent possible.

© Pacific Gas and Electric Company, 2012 8
The sustainability concepts introduced in the Guidance are not expected to impose a significant level of effort on projects, but instead to become a routine
component of remediation projects at PG&E. The project team should
already be incorporating sustainability into their projects.
It is the responsibility of the project team to make decisions related to identification and
implementation of key, project‐specific BMPs that will provide the greatest
sustainability benefits on a given project.
The approach for tracking sustainability data should not result in an increase in paperwork relating to the
project.
The Guidance encourages the project team to be creative and
innovative.
This team is responsible for developing, integrating and implementing in partnership the sustainability approach and practices introduced in this Guidance. The specific roles and responsibilities within the team as they relate to implementation of the various sustainable concepts outlined in the Guidance will be defined by the team as the team is formed. In line with PG&E sustainable corporate culture, the project team is also responsible for developing a clear, practical, and achievable vision for sustainability throughout the project life cycle. The sustainability concepts introduced herein are intended to be integrated in such a way that projects remain streamlined in their implementation and level of effort. These sustainability concepts are not expected to impose a significant level of effort on projects, but instead to
become a routine component of remediation projects at PG&E. The project team should already be incorporating sustainability BMPs into their projects. It is the responsibility of the project team to make decisions related to identification and implementation of key, project-specific BMPs that will provide the greatest sustainability benefits on a given project. This includes making decisions among select BMPs that may have benefits along certain elements (e.g., reduction in GHG emissions), but not others (e.g., increase in costs). The Guidance encourages the project team to be creative and innovative.
Data collection and management are important for effective tracking of BMP implementation and evaluation. As activity-specific BMPs are identified by the project team, it is critical that the team also identify specific data and information needs required for tracking. These needs include the nature, frequency, and magnitude of the data to be collected, and those members of the project team responsible for data collection. Templates for data collection are provided in Appendix A. Moreover, as the data are gathered and analyzed in accordance with the Guidance, it is important that the information and related documentation
be updated as necessary. The project team is therefore encouraged to document the sustainability data collection and evaluation process as recommended herein, including systematic utilization of the GREM (described in Section 5) as the central data management system for the different project activities. The approach for tracking sustainability data has been designed to be streamlined and easy to use and should not result in an increase
in paperwork relating to the project.

© Pacific Gas and Electric Company, 2012 9
The frequency at which sustainability evaluations are performed is at the project team’s discretion and should not create a burden on the project team. In general, events warranting updates to the GREM are those that result in the implementation of additional BMPs within given project activities. However, as a good practice, in the absence of an obvious qualifying event, the GREM and cumulative sustainable benefits should be updated by the project team on a quarterly basis.

© Pacific Gas and Electric Company, 2012 10
4. SUSTAINABILITY FRAMEWORK 4.1 Introduction to the Sustainability Framework The Guidance describes a framework that provides a road map enabling the project team to apply sustainable practices throughout the remediation project life cycle, regardless of the project activities being implemented. As previously indicated, a consistent sustainability approach is included for different project activities. This approach is summarized in Figure 1 below and detailed in Section 5.
4.2 Components of the Framework 4.2.1 Life Cycle Approach
This Guidance covers the overarching activities of a typical PG&E remediation project in order to be granted site closure, regardless of when within the project the activities take place. For example, RI activities may occur within a traditional RI phase, but may be retriggered later in the project lifecycle. In such a case, all RI activities, regardless of when they occur, should follow the approach outlined herein for RI activities. The various project activities addressed in this Guidance include:

© Pacific Gas and Electric Company, 2012 11
All project activities require a planning
component and/or a field component. Additionally, regardless of the project activities, office‐based
tasks are required as part of the planning process.
Project Planning: These activities include the preliminary tasks related to:
– Performing site due diligence;
– Site acquisition and/or obtaining site access agreements;
– Phase I Environmental Site Assessments (ESAs); and/or
– Entering into voluntary cleanup agreement (VCA) with the lead regulatory agency.
All project activities require a planning component and/or a field component. Additionally, regardless of the project activities, office-based tasks are required as part of the planning process. Since office-based tasks are likely to be similar for the different project activities, an office-based component is included in the Project Planning activities, as illustrated on Figure 1. Although office-based tasks take place during different project activities, the integration of sustainability
into office-based tasks are captured within the Project Planning and Office-Based Tasks activities. Office-based tasks include a wide range of administrative tasks required to support project implementation.
RI: These activities relate to designing and performing field investigations, related analyses, and reporting.
FS: These activities relate to identifying remedial action objectives, evaluating remedial alternatives and selecting preferred remedial alternative(s).
RDI: These activities include implementing preferred remedial alternative(s) such as pilot studies, interim measures and/or full-scale remediation. Tasks may include:
– Preparing remedy selection documents, including remedial action plans (RAPs), remedial action workplans (RAWs), and corrective action plans (CAPs);
– Performing remedial design and construction tasks in accordance to the remedy selection documents; and
– Performing remedial implementation and optimization as necessary.
O&M/Closure: These activities include O&M tasks associated with ongoing remediation systems and/or long-term monitoring. They include tasks related to site closure, including implementation of deed restrictions, land use covenants, and related documentation. These activities also consider post-remediation site conditions that may result in beneficial use of the site for the local community following the completion of the project.

© Pacific Gas and Electric Company, 2012 12
The framework allows for additional BMPs to be integrated into
existing project activities or during future project activities.
4.2.2 Activity‐specific Sustainability Evaluation
The Guidance provides a consistent approach for a sustainability evaluation for each of the project activities listed above and in Figure 1. For the various project activities, the project team should:
Identify stressors with potential sustainability impacts;
Identify sustainability BMPs applicable to each stressor; and
Perform a sustainability impact evaluation for each respective stressor.
A variety of tools are available to perform the evaluations. Tools may enable quantitative and/or qualitative evaluations. Examples of publicly available tools and a description of their specific features are provided in Appendix B. It is recommended that the project team employs publicly available tools where feasible to ensure consistency across remediation projects. Should the team prefer to utilize alternative tools, they will need to demonstrate that the alternative tools provide the same level of robustness and credibility as publicly available tools. Once the sustainability evaluation has been completed, the project team assigns a sustainability rating for the project activities. To determine the activity-specific rating, each stressor’s sustainability impact is standardized into a sustainability impact score, as described in Sections 6 through 10. The stressor-specific sustainability score is then combined with the other stressor-specific scores to provide the activity-specific rating.
As project activities progress, additional opportunities for incorporating sustainability BMPs may be identified by the project team. The framework allows for additional BMPs to be integrated into existing project activities or during future project activities. To the extent feasible, after new sustainability BMPs are identified, the project team is encouraged to revisit the sustainability evaluation to determine whether the new sustainability BMPs further increase the sustainability of the project activities. The
activity-specific rating may also be revised, based on the results of the sustainability evaluation.
4.2.3 Project Sustainability Rating
The activity-specific ratings of a project will be combined to provide an overall project sustainability rating. This methodology is described in Section 11. The project sustainability rating enables different project teams to benchmark the sustainability benefits of different projects and sites against each other, and over time. Project-level ratings may also be used to assess the sustainability performance within a remediation project portfolio.

© Pacific Gas and Electric Company, 2012 13
4.2.4 Cumulative Sustainability Benefits
The cumulative benefits of sustainable BMPs implemented across seven key sustainability elements will be tracked for the entire project lifecycle. This methodology is described in Section 12. As benefits across the seven key elements are reported for each site on a quarterly basis, this allows for an estimation and roll-up of the cumulative benefits relative to each element across the entire portfolio of PG&E remediation projects and marks quantifiable benefits achieved through PG&E’s commitment to sustainable remediation.

© Pacific Gas and Electric Company, 2012 14
The project team should complete and update activity‐specific GREMs
throughout the implementation of the
different project activities.
5. GREEN REMEDIATION EVALUATION MATRIX DESCRIPTION 5.1 Overview The GREM (Table I) is an Excel spreadsheet that serves as the centralized data management system for the various project activities. The project team should complete and update activity-specific GREMs throughout the implementation of the different project activities. The objective of the activity-specific GREMs is to help the project team employ a consistent approach to:
Identify sustainability stressors;
Identify sustainability BMPs to be implemented; and
Evaluate the sustainability impacts for each respective stressor.
The GREM concept was first developed by the DTSC and predominantly included environmental considerations. PG&E has subsequently expanded the scope of the GREM, in consultation with representatives of the DTSC to:
Cover additional environmental considerations, as well as social and economic considerations to promote a more holistic approach to sustainable remediation; and
Customize the original GREM to meet the needs of the activities identified in the framework (Section 4).
GREMs specific to the activities identified in Section 4 and Figure 1 are provided in Sections 6 through 10. The following subsections summarize the components of a typical GREM; a hypothetical GREM is also provided in Table I for illustrative purposes.
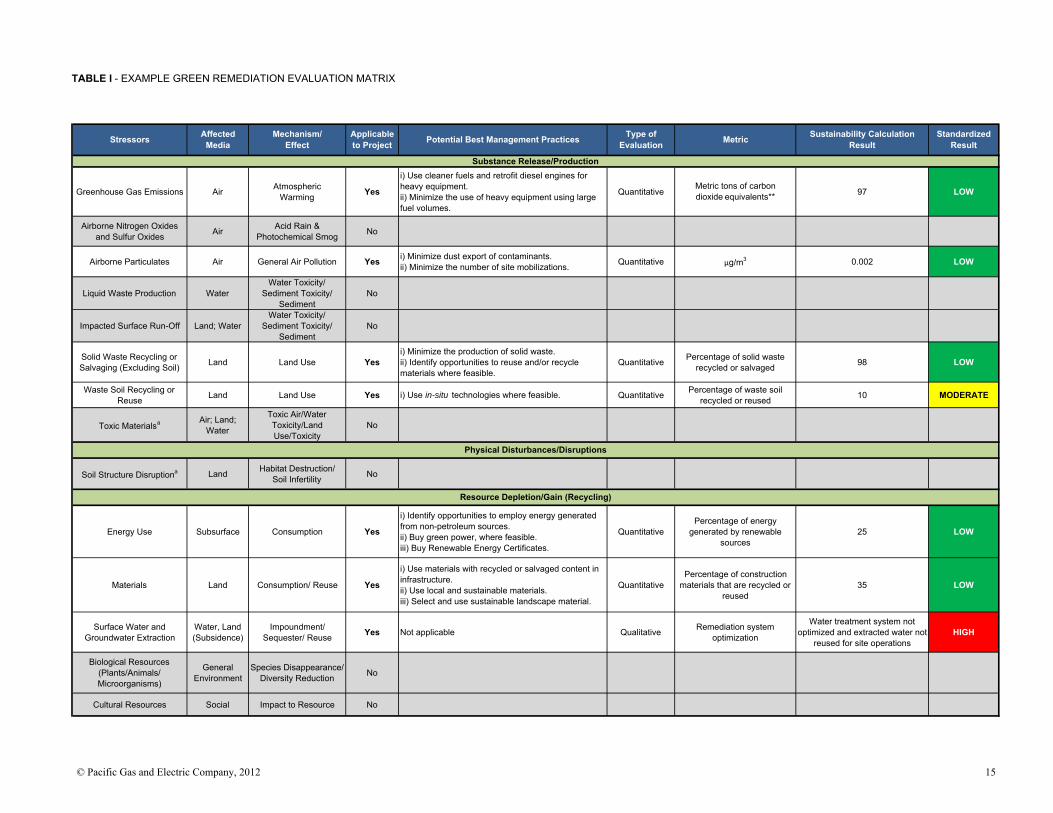
TABLE I - EXAMPLE GREEN REMEDIATION EVALUATION MATRIX
Greenhouse Gas Emissions Air Atmospheric Warming Yes
i) Use cleaner fuels and retrofit diesel engines for heavy equipment.ii) Minimize the use of heavy equipment using large fuel volumes.
QuantitativeMetric tons of carbon dioxide equivalents** 97 LOW
Airborne Nitrogen Oxides and Sulfur Oxides Air Acid Rain &
Photochemical Smog No
Airborne Particulates Air General Air Pollution Yes i) Minimize dust export of contaminants.ii) Minimize the number of site mobilizations. Quantitative µg/m3 0.002 LOW
Liquid Waste Production WaterWater Toxicity/
Sediment Toxicity/ Sediment
No
Impacted Surface Run-Off Land; WaterWater Toxicity/
Sediment Toxicity/ Sediment
No
Solid Waste Recycling or Salvaging (Excluding Soil) Land Land Use Yes
i) Minimize the production of solid waste. ii) Identify opportunities to reuse and/or recycle materials where feasible.
Quantitative Percentage of solid waste recycled or salvaged 98 LOW
Waste Soil Recycling or Reuse Land Land Use Yes i) Use in-situ technologies where feasible. Quantitative Percentage of waste soil
recycled or reused 10 MODERATE
Toxic Materialsa Air; Land; Water
Toxic Air/Water Toxicity/Land Use/Toxicity
No
Soil Structure Disruptiona Land Habitat Destruction/Soil Infertility No
Energy Use Subsurface Consumption Yes
i) Identify opportunities to employ energy generated from non-petroleum sources. ii) Buy green power, where feasible.iii) Buy Renewable Energy Certificates.
QuantitativePercentage of energy
generated by renewable sources
25 LOW
Materials Land Consumption/ Reuse Yes
i) Use materials with recycled or salvaged content in infrastructure.ii) Use local and sustainable materials.iii) Select and use sustainable landscape material.
QuantitativePercentage of construction
materials that are recycled or reused
35 LOW
Surface Water andGroundwater Extraction
Water, Land (Subsidence)
Impoundment/Sequester/ Reuse Yes Not applicable Qualitative Remediation system
optimization
Water treatment system not optimized and extracted water not
reused for site operationsHIGH
Biological Resources (Plants/Animals/ Microorganisms)
General Environment
Species Disappearance/Diversity Reduction No
Cultural Resources Social Impact to Resource No
Type of EvaluationPotential Best Management Practices MetricStressors Sustainability Calculation
Result
Substance Release/Production
Physical Disturbances/Disruptions
Resource Depletion/Gain (Recycling)
Mechanism/Effect
AffectedMedia
Standardized Result
Applicable to Project
© Pacific Gas and Electric Company, 2012 15

TABLE I - EXAMPLE GREEN REMEDIATION EVALUATION MATRIX
Type of EvaluationPotential Best Management Practices MetricStressors Sustainability Calculation
ResultMechanism/
EffectAffected
MediaStandardized
ResultApplicable to Project
Stakeholder Satisfaction Social Public Participation No
Local Economy Boost Social Employment/ Income/ Training No
Occupational Health and Safety Social Health and Safety Yes i) Employ measures to protect workers from hazards. Quantitative Accidents requiring treatment
beyond first aid 0 LOW
Efficiencyb Economic Efficiency No
Future Land Use Social and Economic Land Use No
Green Buildingb Air; Land; Water; Social General Environment No
Post-Remediation Site Conditionsc Social Stewardship No
LOW
Notes:µg/m3 = micrograms per cubic meter COC = Chemicals of ConcernImpacts based on a hypothetical project scenario* Examples of available tools that may be employed to estimate different impacts are provided in Appendix B.
a The stressor is only applicable to Feasibility Study activitiesb The stressor is only applicable to Project Planning/Office Based Tasks activitiesc The stressor is only applicable to Operation & Maintenance/Closure activities
Land Use
** The unitization in terms of metrics divided by the total estimated volume of COCs is necessary in order to maintain consistency in the calculation, accounting for the fact that some sites will have a greater volume of impacted soil and/or groundwater.
Rating:
Stakeholder Considerations
Human Health and Safety
Efficiency
© Pacific Gas and Electric Company, 2012 16

© Pacific Gas and Electric Company, 2012 17
The project team is not expected to address each stressor, but to consider only those most relevant
to their project.
5.2 Sustainability Stressors 5.2.1 Stressor Identification
A stressor is a physical, chemical or biological parameter that has the potential to produce environmental, economic and/or social impacts (DTSC, 2009). The categories of potential stressors are based on the DTSC Interim Advisory for Green Remediation (DTSC, 2009) and are identified below. The list of stressors is exhaustive. The project team is not expected to address each stressor, but
to consider only those most relevant to their project. A goal of the project team is to reduce impacts to each of the considered sustainability stressors. Substance release/production: This category includes the following stressors:
Greenhouse emissions: These gases trap heat in the atmosphere, causing global warming. GHG emissions are emitted during energy production and transportation. This stressor considers the quantity of GHGs emitted as part of project activities.
Airborne nitrogen oxides and sulfur oxides: These gases form quickly from vehicle emissions, off-road equipment and power plants (which produce energy required for office- and field-based tasks relating to the project). These gases are known to contribute to the formation of ground-level ozone and fine particle pollution, and/or to having a number of adverse health effects on the human respiratory system. This stressor relates to the amount of airborne nitrogen oxides and sulfur oxides generated as part of project activities.
Airborne particulates: Particulate matter is a complex mixture of extremely small particles and liquid droplets emitted directly from construction sites, unpaved roads, fields, smokestacks or fires, or indirectly through reactions in the atmosphere between chemicals such as sulfur dioxides and nitrogen oxides. Particles less than 10 micrometers in diameter tend to pose the greatest health concern because they can be inhaled and accumulate in the respiratory system. Toxic vapors may be produced during off-gassing of treatment streams, causing similar health challenges as a result of potential inhalation exposure. This stressor considers the quantity of airborne particulates produced as part of project activities.
Liquid waste production: Liquid waste may be produced as a result of the investigation and/or treatment of impacted media (soil, groundwater and/or sediments), or through decontamination processes. Liquid waste may cause an impact on the environment if not treated or properly disposed. This stressor focuses on liquid waste produced as part of project activities.
Impacted surface run-off: Surface run-off is the flow of water that occurs when soil is infiltrated to full capacity and excess water flows overland, or where the slope of the ground surface causes preferential flow along this ground surface.

© Pacific Gas and Electric Company, 2012 18
Surface water may become impacted with contaminants and may therefore cause a potential impact to human health and the environment. This stressor considers impacted surface run-off generated as part of project activities.
Solid waste recycling or salvaging (excluding soil): Projects may generate solid waste, such as construction debris and protective equipment. Solid waste is often treated and disposed off-site at a landfill. Control measures are needed to prevent solid waste impacting human health (for example via dermal contact or accidental ingestion) and/or the environment. This stressor relates to solid waste that is recycled or salvaged as part of project activities.
Waste soil recycling or reuse: Projects may generate hazardous and non-hazardous waste soil requiring off-site disposal at a landfill. This stressor considers waste soil that is recycled or reused as part of project activities.
Toxic materials: Materials sometimes contain solid and liquid components that may be hazardous to human health and/or the environment due to carcinogenic or mutagenic effects. This stressor is only applicable to FS activities and focuses on the requirement for toxic materials for different remedial alternatives.
Physical disturbances/disruptions:
Soil structure disruption: Soil structure is determined by how individual soil granules aggregate and the arrangement of soil pores between them. Soil structure has a major influence on water and air movement in soil, biological activity, root growth and seedling emergence. Disturbance to soil structure may impact each of these processes. This stressor is only applicable to FS activities and considers the extent of soil disturbance anticipated for different remedial alternatives.
Resources: This category includes the following stressors:
Energy use: This stressor focuses on the proportion of non-renewable and renewable energy used to perform project activities. Non-renewable energy cannot be produced, grown, generated, or used on a scale that can sustain its consumption rate, and includes the energy generated by fossil fuels (such as coal, petroleum and natural gas) and nuclear power. Renewable energy comes from sources that are not depleted by use, such as energy from the sun, wind, geothermal, and wave and tidal systems.
Materials: This stressor considers material requirements to perform project activities, for example the construction of temporary and/or permanent infrastructure associated with a project.
Surface water and groundwater extraction: Surface water includes water collecting on the ground or in a stream, river, lake, wetland, or ocean. Groundwater is located beneath the ground surface in soil pore spaces and in the fractures within rock formations. This stressor encompasses the extraction of surface and/or groundwater as part of remediation and is therefore only applicable to FS, RDI and O&M/Closure activities.

© Pacific Gas and Electric Company, 2012 19
Biological resources (plants/animals/microorganisms): Biological resources form the living components of an ecosystem and include sensitive animal and plant species. This stressor refers to disturbance to biological resources as part of project activities.
Cultural resources: This stressor considers traditional, archaeological and historic features of value to stakeholders and with the potential to be impacted by project activities.
Stakeholder considerations: This category includes the following stressors:
Stakeholder satisfaction: This stressor includes the extent to which any issues of importance to a person, group or organization affected by the site are considered within the project. A key component of stakeholder satisfaction is the number of complaints relating to project activities and the extent of stakeholder involvement throughout the project.
Local economy boost: This stressor focuses on enhancing the revenue to the local community as a result of the project, for example through the purchase of materials extracted, manufactured and sold locally; or through the utilization of local services, such as restaurant and lodging facilities. It is the responsibility of the project team to define the boundary of the local community by considering the proximity of each project location to available resources.
Human Health and Safety:
Occupational health and safety: Occupational health and safety includes all aspects of health and safety in the workplace and has a strong focus on primary prevention of hazards. The health of the workers has several determinants, including risk factors at the workplace This stressor considers occupational risks to persons performing project activities.
Efficiency:
Efficiency: This stressor relates to how the budget and schedule requirements of the project are met as the project progresses. This stressor is only evaluated for Project Planning and Office-Based Tasks activities. As discussed in Section 4, the Project Planning and Office-Based Tasks activities takes place throughout the project life cycle.
Land Use:
Future land use: This stressor considers the anticipated future land use of the site
following project completion, for example unrestricted/residential or commercial land use. The stressor also considers whether institutional controls are required following project activities.
Green building: This stressor refers to a structure that is environmentally responsible and resource-efficient. Examples of green buildings include

© Pacific Gas and Electric Company, 2012 20
Care is to be taken to avoid double‐counting
the effect of different stressors.
The remediation project team is responsible for selecting stressors.
The example BMPs provided are project‐ and activity‐specific; they are not exhaustive and the
project team is encouraged to identify additional BMPs specific to their projects and
their sites.
buildings that are certified to the U.S. Green Building Council Leadership in Energy and Environmental Design (LEED) scheme and those with Energy Star certification. This stressor is only applicable to Project Planning and Office-Based Tasks activities.
Post-remediation site conditions: This stressor focuses on opportunities to increase the beneficial use of the site for the local community following the completion of the project. This stressor is only applicable to O&M/Closure activities.
For each relevant stressor, the GREMs also identify:
The type of medium that may be impacted by the various stressors, for example air, land or water); and
The impact mechanism/effect, for example atmospheric warming, habitat destruction, consumption, for each impacted medium.
5.2.2 Stressor Applicability
Some stressors may not be applicable to a particular project. A “Yes/No” check box in the GREMs enables the project team to screen each stressor, permitting only the most relevant stressors to be considered for activity-specific evaluation. A focused evaluation of these stressors for the various project activities will streamline the use of the GREMs for a particular project. The screening process is illustrated in Table I.
Care is to be taken by the project team in selecting stressors to avoid double-counting the effect of different stressors. It is also recommended that the project team selects a useful and practical number of stressors to enable a comprehensive sustainability evaluation while not causing a
disproportionately complex and resource-intensive effort. The number and type of sustainability stressors selected will be based on site-specific conditions. The remediation project team is responsible for selecting the stressors that warrant evaluation for the different project activities.
5.3 Sustainability Best Management Practices Examples of BMPs are provided in Sections 6 through 10 and in Appendix C. These BMPs are designed to help reduce potential negative sustainability impacts and to enhance positive sustainability impacts. The example BMPs provided are project- and activity-specific; they are not exhaustive and the project team is encouraged to identify additional BMPs specific to their projects and their sites. The project team will select sustainability BMPs that can be applied during the various

© Pacific Gas and Electric Company, 2012 21
The nature of sustainability impact
evaluations will depend on the characteristics
of the stressors selected in the activity‐ specific GREMs.
Metrics are a unit of measure for different sustainability stressors.
Care is to be taken to ensure that the level of
complexity of the sustainability evaluation
is proportionate to the complexity of the project activities.
project activities and will plan to implement them before they perform the sustainability impact evaluation. The sustainability impact evaluation will therefore take into account the sustainability benefits achieved through BMP implementation. 5.4 Sustainability Impact Evaluation Once the project team has identified and implemented applicable sustainability BMPs, they will perform a sustainability impact evaluation for each stressor. The nature of sustainability impact evaluations performed by the project team will depend on the characteristics of the stressors selected in the activity-specific GREMs. Each GREM (Sections 6 through 10) presents the following sustainability evaluation components for each stressor:
Type of evaluation;
Appropriate metric;
Evaluation result; and
Result standardization process. These components are illustrated in Table I. Methodologies to be considered by the project team for evaluating different stressors, for example GHGs, are provided in Appendix D. 5.4.1 Types of Evaluation
Quantitative evaluations will be performed where feasible and when data are readily available. When quantitative analyses are not practical, for example for evaluating biological resources, qualitative evaluations will be implemented. Appendix B provides a selection of tools that may be employed to assist the project team perform different types of sustainability impact evaluation. Care is to be taken to ensure that the level of complexity of the sustainability evaluation is proportionate to
the complexity of the project activities. 5.4.2 Metrics
The various GREMs identify metrics associated with the respective stressor, where applicable. Metrics are a unit of measure for different sustainability stressors (for example metric tons of carbon dioxide equivalents for GHG emissions, or dollars for estimated cost of remediation).
Metrics enable stressor impacts to be more easily understood by the project team and to be standardized throughout the project life cycle and across different sites.

© Pacific Gas and Electric Company, 2012 22
Certain stressor‐specific metrics are unitized in terms
of the total volume of chemicals of concern in impacted media
for certain project activities.
Standardization of the sustainability evaluation
results is necessary to combine the
sustainability results pertaining to each stressor.
The basis for standardization is intended to be a living process and may be updated in future versions of
this Guidance.
A “Low” score is the best score.
To assist in the standardization of certain stressors (described in additional detail below), certain stressor-specific metrics are unitized in terms of the total volume of chemicals of concern (COC) in impacted media for certain project activities. For example, the metric for GHGs for RDI activities may be “metric tons/cubic yards COC-impacted soil” or “metric tons/gallons COC-impacted groundwater”. By presenting metrics in this form, potential biases in calculations stemming from variables such as the size of a given site or sites with a larger number of chemical source areas and greater volume releases are reduced. Other stressor-specific metrics do not require this approach for standardization as they are not affected by site-specific variables (for example, the metric for biological resources is “species”). Stressor-specific metrics warranting unitization are identified in Tables I and II, and within the activity-specific GREMs.
5.4.3 Evaluation Result
Based on the selected type of sustainability evaluation, the evaluation methodology and the metric, the project team can calculate stressor-specific impacts. The project team will then record evaluation results in the GREMs.
5.4.4 Result Standardization
As described above, the sustainability calculations associated with the various stressors are measured or calculated in variable units. Standardization of the sustainability evaluation results is therefore necessary to combine the sustainability results pertaining to each stressor. To this end, each stressor-specific evaluation result is standardized into “Low”, “Moderate” and “High” sustainability impact scores, as shown in Table I. A “Low” score is
the best score. The basis for the standardization of each stressor-specific sustainability evaluation result is provided in Table II. The stressor-specific standardization processes are based on:
Existing standards;
Regulatory requirements;
Previous experience; and/or
Professional judgment.
The basis for standardization is intended to be a living process. Therefore, Table II may be updated in future versions of this Guidance and as relevant data from sustainable practices at PG&E facilities become available.
The project team should include the standardized score in each activity-specific GREM, as illustrated in Table I.

TABLE II - SUSTAINABILITY EVALUATION RESULTS STANDARDIZATION
Greenhouse Gas Emissions
Metric tons CO2
equivalents/ft2 and % of sustainable transportation
LOW = < 15 metric tons/ft 2 and 20% team members carpool or use sustainable means of transportation
MODERATE = ≥ 15 and < 25 metric tons and >0 and ≤ 20 % team members carpool or use sustainable means of
transportationHIGH = ≥ 25 metric tons and no carpooling carpool or use
sustainable means of transportation by team members
Metric tons of CO2 equivalents / total volume of COCs in relevant
media
Low = ≤ 0.005 MODERATE = >0.005 and ≤ 0.01
HIGH = >0.01
Input from data from PG&E sites, professional experience
and judgment
Airborne Nitrogen Oxides
and Sulfur Oxides Not applicable Not applicable µg/m3
LOW = <10.0 µg/m 3 (NO2) and <8.0 µg/m3 (SO2) annual arithmetic mean and <33.8 µg/m3 (NO2) and <65.5 µg/m3 (SO2) for a 1-hour period
MODERATE = ≥10.0 µg/m3 and ≤100 µg/m3 (NO2) and >8.0 µg/m3 and ≤80 µg/m3 (SO2) annual arithmetic mean
and ≥33.8 µg/m3 and ≤338 µg/m3 (NO2) and >65.5 µg/m3 and ≤655 µg/m3 (SO2) for a 1-hour period
HIGH = >100 µg/m3 (NO2) for annual mean and >80 µg/m 3 (SO2) annual arithmetic mean and >338 µg/m3 (NO2) for annual mean and >655 µg/m3 (SO2) for a 1-hour period
In line with typical thresholds in California
Airborne Particulates Not applicable Not applicable µg/m3
LOW = < 2.0 µg/m 3 for annual mean and < 5.0 µg/m3 for a 24-hour period for PM-10MODERATE = ≥ 2.0 µg/m3 and ≤ 20 µg/m3 for annual mean and > 5.0 µg/m3 and ≤ 50
µg/m3 for a 24-hour period for PM-10HIGH = > 20 µg/m3 for annual mean and > 50 µg/m 3 for a 24-hour period for PM-10
In line with typical thresholds in California
Liquid Waste Production
Not applicable Not applicable Percentage reduction in liquid waste production
LOW > 10% reduction in liquid waste production MODERATE = 1-10% reduction liquid waste production
HIGH = no change in liquid waste production
Input from data from PG&E sites, professional experience
and judgment
Impacted Surface Run-Off
Not applicable Not applicable Percentage increase in impacted surface run-off
LOW = no increase in run-off as a result of project activitiesMODERATE = 1-10% increase in run-off as a result of project activitiesHIGH = 10% increase or above in run-off as a result of project activities
Input from data from PG&E sites, professional experience
and judgment
Solid Waste Recycling and Salvaging
(Excluding Soil) --
LOW = waste audit performed AND recycling and reuse measures in place
MODERATE = waste audit performed but no recycling and reuse measures in place
HIGH = waste audit not performed and no recycling and reuse
Percentage of solid waste recycled or salvaged
For solid waste that can be recycled or salvaged:LOW = ≥ 95% waste recycled or salvaged
MODERATE = < 95% and ≥ 75% recycled or salvagedHIGH = < 75% recycled or salvaged
Professional experience and judgment
Waste Soil Recycling and Reuse
Not applicable Not applicable Percentage of waste soil recycled or reused
For waste soil that has been excavated:LOW = ≥ 25% waste soil recycled
MODERATE = < 0% and ≥ 25% waste soil recycledHIGH = no waste soil recycled
Professional experience and judgment
Toxic Materials* Not applicable Not applicable -- LOW = toxic materials not usedHIGH = toxic materials used
Professional experience and judgment
Soil Structure Disruption*
Not applicable Not applicable cubic yards
Comparison of the different remedial alternatives based on volume of soil disturbed:LOW = remedial alternative with lowest volume of soil disturbed
HIGH = remedial alternative with highest volume of soil disturbedMODERATE = other remedial alternatives
Stressors Basis of Standardization
Substance Release/Production
Project Planning/Office Based Tasks
Metric Result Standardization
Other Activities
Metric Result Standardization
Physical Disturbances/Disruptions
© Pacific Gas and Electric Company, 2012 23

TABLE II - SUSTAINABILITY EVALUATION RESULTS STANDARDIZATION
Stressors Basis of Standardization
Project Planning/Office Based Tasks
Metric Result Standardization
Other Activities
Metric Result Standardization
Energy Use Not applicable Not applicable Percentage of energy generated by renewable sources
LOW = ≥ 20% of on-site energy generated by renewable sources and/or by purchasing green power and/or by purchasing Renewable Energy Certificates
MODERATE = < 20% and ≥ 0% of on-site energy generated with renewable energy and/or by purchasing green power and/or by purchasing Renewable Energy Certificates
HIGH = no on-site energy generated with renewable energy and/or by purchasing green power and/or by purchasing Renewable Energy Certificates
Professional experience and judgment
Materials Not applicable Not applicable Percentage of materials recycled or reused
LOW = ≥ 25% of materials that are recycled or reused MODERATE = < 25% and ≥ 5% of materials that are recycled or reused
HIGH = < 5% of materials that are recycled or reused
Professional experience and judgment
Surface Water andGroundwater Extraction
Not applicable Not applicable Remediation system optimization
LOW = water treatment system optimized to reduce impacts on water (surface water/groundwater) with beneficial uses and water reuse measures implemented
MODERATE = water treatment system optimized to reduce non-impacted water extractionHIGH = water treatment system not optimized to reduce non-impacted water extraction
Professional experience and judgment
Biological Resources (Plants/Animals/ Microorganisms)
Not applicable Not applicable Sensitive species
LOW = sensitive plant or animal species not disturbedMODERATE = sensitive plant or animal species are disturbed but mitigation measures are
implementedHIGH = sensitive plant or animal species are disturbed and mitigation measures are not
implemented
In line with CEQA requirements
Cultural Resources Not applicable Not applicable Cultural resources LOW = cultural resources not disturbed
MODERATE = cultural resources disturbed and mitigation measures are implementedHIGH = cultural resources are disturbed and mitigation measures are not implemented
Aligned with DTSC practices
Stakeholder Satisfaction
Stakeholder involved LOW = Stakeholders involved during planning activities HIGH = Stakeholders not involved during planning activities Number of unresolved complaints
LOW = 0MODERATE = 1
HIGH = >1PG&E public participation goals
Local Economy Boost Not applicable Not applicable Percentage of project expenditure providing local economy boost
LOW = ≥ 10% of project expenditure provided to local economyMODERATE = < 10% and ≥ 5% of project expenditure provided to local economy
HIGH = < 5% of project expenditure provided to local economy
Professional experience and judgment
Occupational Health and Safety
Accidents requiring treatment beyond first aid
LOW = 0HIGH = ≥1
Accidents requiring treatment beyond first aid
LOW = 0HIGH = ≥1 PG&E Health & Safety goals
Efficiency (Based on Budget and Schedule)
Dollars
LOW = remediation project meets or supersedes budget and schedule goals defined in the Strategic Plan
HIGH = remediation project exceeds budget and schedule defined in the Strategic Plan
Not applicable Not applicable Professional experience and judgment
Stakeholder Considerations
Efficiency
Human Health & Safety
Resource Depletion/Gain (Recycling)
© Pacific Gas and Electric Company, 2012 24
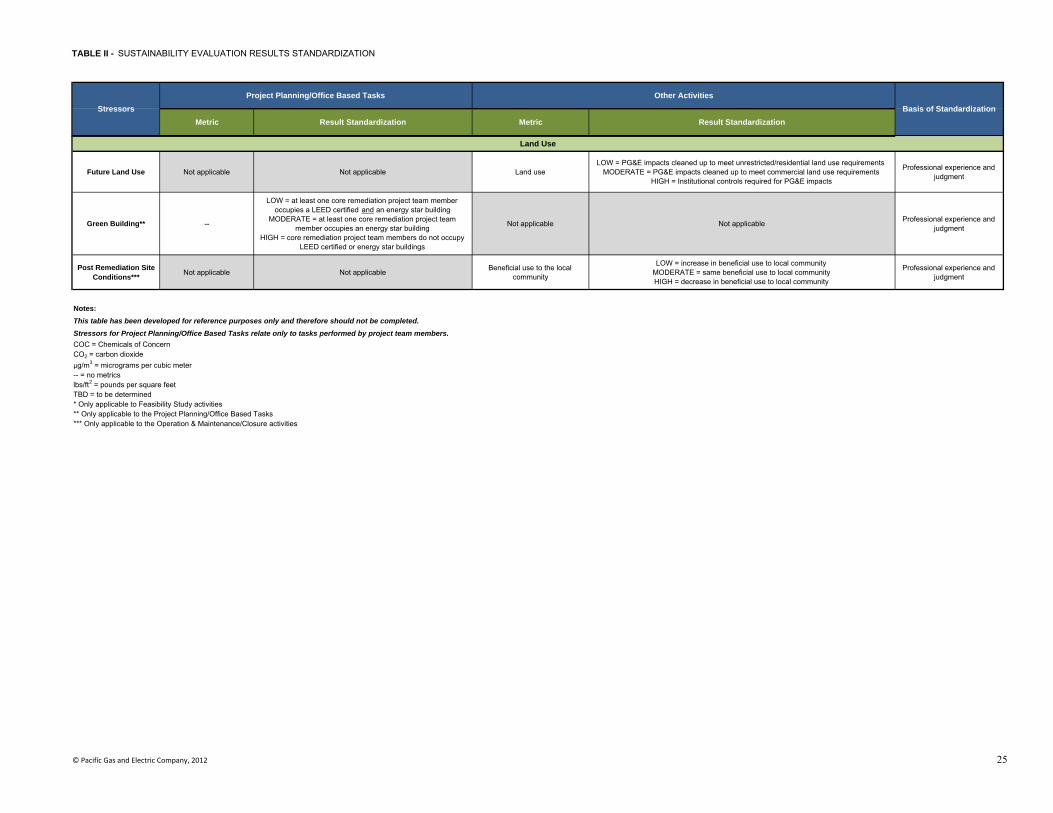
TABLE II - SUSTAINABILITY EVALUATION RESULTS STANDARDIZATION
Stressors Basis of Standardization
Project Planning/Office Based Tasks
Metric Result Standardization
Other Activities
Metric Result Standardization
Future Land Use Not applicable Not applicable Land useLOW = PG&E impacts cleaned up to meet unrestricted/residential land use requirements
MODERATE = PG&E impacts cleaned up to meet commercial land use requirementsHIGH = Institutional controls required for PG&E impacts
Professional experience and judgment
Green Building** --
LOW = at least one core remediation project team member occupies a LEED certified and an energy star building
MODERATE = at least one core remediation project team member occupies an energy star building
HIGH = core remediation project team members do not occupy LEED certified or energy star buildings
Not applicable Not applicable Professional experience and judgment
Post Remediation Site Conditions***
Not applicable Not applicable Beneficial use to the local community
LOW = increase in beneficial use to local communityMODERATE = same beneficial use to local communityHIGH = decrease in beneficial use to local community
Professional experience and judgment
Notes:
This table has been developed for reference purposes only and therefore should not be completed. Stressors for Project Planning/Office Based Tasks relate only to tasks performed by project team members.COC = Chemicals of ConcernCO2 = carbon dioxideµg/m3 = micrograms per cubic meter -- = no metricslbs/ft2 = pounds per square feetTBD = to be determined* Only applicable to Feasibility Study activities** Only applicable to the Project Planning/Office Based Tasks*** Only applicable to the Operation & Maintenance/Closure activities
Land Use
© Pacific Gas and Electric Company, 2012 25

© Pacific Gas and Electric Company, 2012 26
A fundamental element of the sustainability framework is the ability for the project team to generate recommendations for additional sustainability BMPs for future tasks both within existing project activities and
during future activities.
Project activities with the greatest proportion of “Low” stressor‐specific sustainability
impact scores will be assigned a “Low” sustainability impact rating.
5.5 Recommendations for Additional Sustainability Best Management Practices
A fundamental element of the sustainability framework (Section 4) is the ability for the project team to generate recommendations for additional sustainability BMPs for future tasks both within existing project activities and during future activities. Following implementation of preliminary sustainability BMPs, the project team will evaluate their effectiveness, and will also identify new BMPs that could be implemented. Revised and new sustainability BMPs will be implemented and evaluated in the activity-specific GREMs via the same process as summarized above. The GREMs will be updated accordingly.
5.6 Activity‐Specific Rating System For each activity-specific GREM, with the exception of the FS-specific GREM, the stressor-specific sustainability impact scores will be combined by the project team to provide an activity-specific sustainability rating. This rating is based on the proportion of “Low”, “Moderate” and “High” sustainability impact scores determined for each of the stressor-specific sustainability impacts. Project activities with the greatest proportion of “Low” stressor-specific sustainability impact scores will therefore be assigned a “Low” sustainability impact rating. In the hypothetical example provided in Table I, six “Low”, one “Moderate” and one “High” sustainability impact scores were provided; an overall “Low” sustainability impact rating was therefore awarded for these project activities. With the most common sustainability impact score governing the activity-specific rating, in cases where an even number of sustainability impact scores occur, the activity-specific rating will default to the higher of the “Low”, “Moderate”, or “High”. Examples of additional combination of sustainability impact scores and resulting activity-specific ratings are included in Box 1 below:
BOX 1
Combination of Sustainability Impact Scores Sustainability Evaluation Rating
2 High’s and 2 Low’s Moderate
2 High’s and 2 Moderate’s High
2 Moderate’s and 2 Low’s Moderate
2 Low’s, 2 Moderate’s, and 1 High Moderate

© Pacific Gas and Electric Company, 2012 27
The project team will input each element of the BMP identification and sustainability evaluation into the activity‐specific GREMs in real time as the project activities progress.
As shown, an equal combination of “Low” and “High” scores yields a “Moderate” rating, while an equal combination of “Low” and “Moderate” scores also yield a “Moderate” rating. Other combinations may be correspondingly evaluated.
The project team will utilize two rating systems for evaluating sustainability for FS activities:
A total sustainability rating will be calculated in the FS-specific GREM for each remedial alternative evaluated in the FS evaluation using the methodology described above. This will enable the project team to rank the sustainability of each of the remedial alternatives.
A second rating, analogous to the activity-specific scoring for all other project activities, will also be generated by the project team to assess the extent to which sustainability is incorporated into the FS process, regardless of the remedial alternatives considered. For example, a “Low” sustainability impact rating will be awarded for FS activities if significant effort to incorporate sustainability into the remedy selection process was demonstrated and the FS-specific GREM was employed by the project team for the sustainability evaluation.
For additional details relating to the FS-specific ranking system, please refer to Section 8. As previously indicated, after sustainability ratings are developed for the different project-specific activities, the project team will combine activity-specific ratings with each of the other activity-specific ratings to provide an overall project sustainability rating; this methodology is described in Section 11. 5.7 Data Management and Reporting The GREMs have been designed so that the project team can record in a centralized location each step taken to identify BMPs and to conduct the sustainability evaluation for various project activities. The project team will therefore input each element of the BMP identification and sustainability evaluation into the activity-specific GREMs in real time as the project activities progress. Data that can be recorded into the GREMs includes:
Selected stressors;
BMPs implemented to address each selected stressor;
Sustainability evaluation results for each stressor;
Stressor-specific scores; and
Activity-specific sustainability rating.

© Pacific Gas and Electric Company, 2012 28
The project team is responsible for
designating a team member who will take
ownership of the GREMs, and complete and update
them as necessary.
The project team is responsible for designating a team member who will take ownership of the GREMs, and complete and update them as necessary. At a minimum, updates should be performed on a quarterly basis. As discussed in Sections 6 through 10, the project team should report sustainability results during various project activities. The GREMs will constitute significant components of sustainability reports produced.

© Pacific Gas and Electric Company, 2012 29
The strategic components of the planning activities and the day‐to‐day office‐based tasks associated with all project activities are combined under Project Planning and Office‐Based Tasks
activities.
Project Planning includes streamlining
the project life cycle and expediting site closure
where feasible.
6. PROJECT PLANNING AND OFFICE‐BASED TASKS 6.1 Key Elements of Project Planning and Office Based Tasks The Guidance defines Project Planning activities as tasks related to the following:
Performing site due diligence;
Site acquisition and/or obtaining site access agreements;
Entering into a VCA with the lead regulatory agency;
Performing Phase I ESAs;
Strategic planning, which includes conceptualization of the various project activities to be implemented throughout the project life cycle, and strategies that may help streamline the overall project life cycle; and/or
Performing budgeting, invoicing and other administrative tasks. Office-based tasks involve a wide range of administrative tasks necessary to support other project activities (for example RI, FS, RDI, O&M/Closure). Day-to-day tasks to be performed by the project team may include the following:
Documenting data and information (for example, recording field notes, performing data assessment and report preparation);
Participating in meetings and corresponding with stakeholders such as the regulatory agency and the local community; and
Preparing and submitting documents to regulatory agencies (for example, the submittal of an FS) and addressing stakeholder comments relating to this documentation.
Although office-based tasks take place during different project activities, the strategic components of the planning activities and the day-to-day office-based tasks associated with all project activities are combined under Project Planning and Office-Based Tasks activities. 6.2 Sustainability Approach
Project Planning includes streamlining the project life cycle and expediting site closure where feasible. For example, in cases where the remedial alternative(s) are known, FS activities may be eliminated in favor of transition from RI activities to remediation activities. In addition, project planning may include the development of a strategic plan for the project, encompassing
alignment of project endpoints, strength/weakness/opportunity/

© Pacific Gas and Electric Company, 2012 30
The Project Planning and Office‐Based Tasks‐specific GREM guides the sustainability effort for project planning and
office‐based tasks.
threat analyses, and related business planning. This strategic planning maximizes the efficiency of project budgets, costs, and schedules. Many of the tasks related to Project Planning are associated with office-based tasks. The application of sustainable practices related to project planning is included under the overarching office-based activities described in this section. Office-based tasks are to be performed in a sustainable manner wherever possible, not only during Project Planning, but throughout the project life cycle. The Project Planning and Office-Based Tasks-specific GREM will therefore be updated by the project team during the implementation of the other project activities outlined in this Guidance. The Project Planning and Office-Based Tasks-specific GREM guides the sustainability effort for project planning and office-based tasks, as described below and illustrated in Table III. The project team is responsible for ensuring that all persons involved in Project Planning and Office-Based Tasks understand how the Guidance will tie in to their work and that they implement applicable sustainable practices to the extent possible. 6.2.1 Stressor Identification and Applicability Evaluation
The Project Planning and Office-Based Tasks-specific GREM (Table III) provides a list of potential stressors associated with project planning and ongoing office-based tasks. The types of impacts caused by different stressors related to office-based tasks are expected to be generally consistent across different PG&E remediation projects. However, it is anticipated that the degree to which sustainability is integrated into Project Planning might differ from project to project. The project team will determine the stressors to be evaluated for Project Planning and Office-Based Tasks activities.
6.2.2 Sustainability Best Management Practices
For each stressor, the project team will identify sustainability BMPs that will be implemented to address sustainability impacts. Examples of key BMPs for Office-Based Tasks are:
Producing and circulating electronic documents, instead of hard copies;
Occupying green buildings, where feasible; and
Switching off office equipment, such as computers when not in use.
For Project Planning, critical BMPs may include:
Preparing a site strategic plan and enhancing project planning to streamline the project life cycle; and
Limiting face-to-face meetings and substituting them with conference calls.
Success Story: For a particular PG&E project, BMPs related to minimizing the use of paper have yielded reductions in GHG emissions by as much as 4.8 metric tons of carbon dioxide equivalents.

TABLE III - GREEN REMEDIATION EVALUATION MATRIX FOR PROJECT PLANNING AND OFFICE-BASED TASKS
Stressors AffectedMedia
Mechanism/Effect
Applicable to Project (Y/N)
Potential Best Management
Practices
Type of Evaluation Metric
Sustainability Calculation
Result
Standardized Result
Greenhouse Gas Emissions Air Atmospheric warming Quantitative
metric tons CO2 equivalents/ft2
and % of sustainable transportation*
Solid Waste Recycling or Salvaging (Excluding Soil) Land Land use/toxicity Qualitative --
Stakeholder Satisfaction Social Public participation Qualitative Stakeholders involved
Occupational Health and Safety Social Health and safety Quantitative Accidents requiring treatment beyond first aid**
Efficiency Social Efficiency Quantitative Dollars
Green Building Air; Land; Water; Social
General Environment Qualitative --
Notes:CO2 = carbon dioxidelbs/ft2 = pounds per square feet
Substance Release/Production
Human Health & Safety
Efficiency
Stakeholder Considerations
** Only accidents that were caused by project-related activities are to be taken into account during the sustainability evaluation. Accidents taking place during general office-based activities are to be excluded.
* Only greenhouse gas emissions associated with project-related activities are to be taken into account during the sustainability evaluation. Greenhouse gas emissions generated as part of general office-based activities are to be excluded.
Project Planning and Office-Based Tasks-specific rating:
© Pacific Gas and Electric Company, 2012 31

© Pacific Gas and Electric Company, 2012 32
Appendix C provides a comprehensive list of sustainability BMPs relating to each of the stressors for Project Planning and Office-Based Tasks activities. The list of BMPs is not exhaustive. The project team may therefore identify and implement additional project-specific BMPs.
6.2.3 Sustainability Impact Evaluation
The project team will perform a focused sustainability impact evaluation for the significant stressors relating to Project Planning and Office-Based Tasks. As discussed in Section 5, the project team will provide the type of evaluation and the appropriate metric for each of the respective stressors in the Project Planning and Office-Based Tasks-specific GREM. The methodology presented in Appendix D may be followed to evaluate sustainability impacts. Sustainability impacts associated with significant stressors will be evaluated and recorded in this GREM.
6.3 Project Planning and Office‐Based Tasks Sustainability Rating System As described in Section 5, a rating system is provided to assess the benefits of sustainability BMPs identified and implemented during Project Planning and Office-Based Tasks. The sustainability rating focuses on the degree to which sustainability was accounted for during the project planning process and during the office-based tasks required during subsequent project activities, and takes into account sustainability BMPs implemented for these activities. The project team will determine their Project Planning and Office-Based Tasks-specific sustainability rating. 6.4 Recommendations for Additional Sustainability Best Management Practices A fundamental element of the sustainability framework (Section 4) is the ability for the project team to generate recommendations for additional sustainability BMPs for future tasks both within Project Planning and Office-Based Tasks activities and during future activities. Following implementation of preliminary sustainability BMPs, the project team will evaluate their effectiveness. Recommendations for future or revised sustainability BMPs will also be assessed throughout the implementation of Project Planning and Office-Based Tasks activities. Revised sustainability BMPs will be implemented and evaluated in the Project Planning and Office-Based Tasks specific-GREM via the same process as summarized above. 6.5 Data Management and Reporting
Each step of the sustainability evaluation will be recorded in the Project Planning and Office-Based Tasks-specific GREM, as discussed in Sections 3 and 5, and above. The project team is responsible for designating a team member who will take ownership of the GREM, and complete and update it as necessary. At a minimum, updates should be performed on a quarterly basis. The sustainability evaluation may be discussed in project-related documentation, for example in correspondence submitted to the regulatory agency or in site-specific technical memoranda following project completion. Interim versions of the memoranda will be prepared as

© Pacific Gas and Electric Company, 2012 33
necessary, for example following the implementation of additional sustainability BMPs. Supporting sustainability information collected throughout the project, including the assumptions and data utilized to perform the sustainability evaluations, will also be documented. For example, minutes of both internal and external sustainability meetings will be recorded and stored electronically in the same location as the Project Planning and Office-Based Tasks-specific GREM.

© Pacific Gas and Electric Company, 2012 34
The RI‐specific GREM guides the sustainability
effort for RI activities. This GREM should be
completed and updated during each cycle of
investigation, including investigations that may be necessary as part of FS, RDI, and O&M/ Closure activities.
7. REMEDIAL INVESTIGATION 7.1 Key Elements of Remedial Investigation As defined in this Guidance, RI activities correspond to field investigation tasks that define the nature and extent of chemicals in various media at a site. RI activities often involve multiple tiers of investigation. Occasionally, additional investigations will be necessary during subsequent project activities, for example as part of FS, RDI, and O&M/Closure activities. RI tasks in these later project activities are often triggered by additional data needs for RDI, responses to newly collected monitoring data, and/or changes in the conceptual site model. All RI activities, regardless of when they occur, should follow the approach outlined in this section. Building decommissioning and/or demolition tasks performed in support of an RI are also included within RI activities.
7.2 Sustainability Approach
This section focuses on the identification and evaluation of sustainability BMPs to be implemented as part of field investigation tasks during of the RI process, regardless of the timing of the field investigations within the overall project life cycle. RI activities are important in terms of the applicability of sustainable practices. RI tasks are field-intensive, often requiring multiple site mobilizations and thereby increasing the potential for GHG emissions, airborne particulates, IDW, disturbance to the local community, and technology costs and related project expenditures. Certain precautions are also needed during investigations to ensure RI tasks address stakeholder concerns, together with human health and safety. The project team is responsible for ensuring that all persons involved in RI activities understand how the Guidance will tie in to their work and that they implement applicable sustainable practices to the extent possible. The RI-specific GREM guides the sustainability effort for RI activities, as described below and as illustrated in Table IV. This GREM should be completed and updated during each cycle of investigation, including investigations that may be necessary as part of FS, RDI, and O&M/Closure activities. Each of the RI-specific GREM components will be implemented by the project team according to the guidelines set forth in Section 5. 7.2.1 Stressor Identification and Applicability
The RI-specific GREM provides a comprehensive list of stressors associated with one or more of the proposed RI tasks (Table IV). As indicated in Section 5, the significance of different stressors to an RI task is site-specific. The project team will select stressors that pose a significant sustainability impact and record these in the RI-specific GREM. The impacted media and the impact mechanism/effect will also be identified for each stressor in the GREM.

TABLE IV - GREEN REMEDIATION EVALUATION MATRIX FOR REMEDIAL INVESTIGATION ACTIVITIES
Stressors AffectedMedia
Mechanism/Effect
Applicable to Project
(Y/N)
Potential Best Management
Practices
Type of Evaluation Metric
Sustainability Calculation
Result
Standardized Result
Greenhouse Gas Emissions Air Atmospheric Warming QuantitativeMetric tons of CO2 equivalents / total
volume of COCs
Airborne Nitrogen Oxidesand Sulfur Oxides Air Acid Rain &
Photochemical Smog Quantitative µg/m3
Airborne Particulates Air General Air Pollution/Toxic Air/Humidity Increase Quantitative µg/m3
Liquid Waste production Water Water Toxicity/ Sediment Toxicity/ Sediment Quantitative Percentage reduction in liquid waste
production
Impacted Surface Run-Off Land; Water Water Toxicity/ Sediment Toxicity/ Sediment Quantitative Percentage increase in impacted
surface run-off
Solid Waste Recycling or Salvaging (Excluding Soil) Land Land Use/Toxicity Quantitative Percentage of solid waste recycled or
salvaged
Waste Soil Recycling or Reuse Land Land Use/Toxicity Quantitative Percentage of waste soil recycled or reused
Energy Use Subsurface Consumption Quantitative Percentage of energy generated by renewable sources
Materials Land Consumption/ Reuse Quantitative Percentage of materials that are recycled or reused
Surface Water andGroundwater Extraction
Water, Land (subsidence)
Impoundment/Sequester/ Reuse No Remediation system optimization
Biological Resources (Plants/Animals/ Microorganisms)
General Environment
Species Disappearance/Diversity Reduction Quantitative Sensitive species
Cultural Resources Social Impact to Resource Quantitative Cultural resources
Stakeholder Satisfaction Social Public Participation Quantitative Number of unresolved complaints
Local Economy Boost Social Employment/ Income/Training Quantitative Percentage of project expenditure
providing local economy boost
Occupational Health and Safety Social Health and Safety Quantitative Accidents requiring treatment beyond first aid
Future Land Use Economic Economic Performance Qualitative Land Use
Notes:µg/m3 = micrograms per cubic meter CO2 = carbon dioxide
COC = Chemicals of Concern
RI-specific rating:
Substance Release/Production
Resource Depletion/Gain (Recycling)
Land Use
Stakeholder Considerations
Human Health & Safety
© Pacific Gas and Electric Company, 2012 35

© Pacific Gas and Electric Company, 2012 36
7.2.2 Sustainability Best Management Practices
For each stressor, the project team will identify sustainability BMPs that will be implemented to address sustainability impacts. Sustainability BMPs associated with RI activities are generally related to field investigations. Key sustainability BMPs for RI activities include:
Employing vehicles with cleaner fuels and retrofit diesel engines;
Developing a vehicle reduction plan that includes provisions for carpooling;
Reducing field mobilizations, for example through the reduction of site investigation tiers;
Using investigation results to reduce the extent of excavation (i.e., telescoping excavation);
Expanded soil stockpile management to minimize the volume of hazardous waste and to maximize the potential for onsite reuse of soils, where feasible;
Employing investigation technologies that reduce the generation of IDW;
Implementing recycling practices, for example for demolition waste;
Implementing protective measures to reduce noise and odor during investigations;
Maximizing the use of local vendors;
Utilizing mobile, on-site laboratories where feasible;
Implementing a stakeholder management plan to ensure stakeholder concerns are met;
Implementing TRIAD (USEPA, 2001). Triad is an integrated approach using rapid sampling techniques coupled with onsite analysis and data displays to direct streamline investigations and related decision-making. TRIAD significantly compresses the time to perform RIs and interpret collected data, reduces site mobilizations, and enables the project team to reduce uncertainty while expediting site investigation and reducing project costs; and
In line with the goals of Triad, ensuring efficiency and streamlining of decision-making in the field. For example, BMPs that help establish clear and quantitative sampling and investigation objectives and a clear decision logic in advance of the investigation activities can help streamline field efforts and minimize investigation tiers.
Success Story: At one of PG&E’s sites, BMPs related to RI activities have yielded GHG emission reductions as high as 89 metric tons of carbon dioxide equivalents and reductions in liquid waste disposal by approximately 350,000 gallons.
Success Story: At another PG&E site, RI‐related BMPs resulted in recycling of 75 percent of available waste generated from building demolition activities.

© Pacific Gas and Electric Company, 2012 37
Appendix C provides a comprehensive list of sustainability BMPs relating to each of the stressors for RI activities. The list is not necessarily exhaustive and the project team may identify and implement additional BMPs.
7.2.3 Sustainability Impact Evaluation
The project team will perform a focused sustainability impact evaluation for the relevant stressors for each remedial alternative being considered at the RI stage. As discussed in Section 5, the type of evaluation and the appropriate metric, the evaluation result and the result standardization process will be provided for each of the respective stressors in the RI-specific GREM. Sustainability impacts associated with significant stressors will be evaluated for each remedial scenario requiring an RI and will be recorded in the GREM. The evaluation methodology described in Appendix D may be followed to perform the sustainability evaluations. Care is to be taken to ensure that the level of complexity of the sustainability evaluation is proportionate to the complexity and rigor of the proposed RI.
7.3 RI Activity‐Specific Sustainability Rating System As described in Section 5, a rating system is provided to assess the benefits of sustainability BMPs identified and implemented during RI activities. The sustainability rating focuses on the degree to which sustainability was accounted for during RI activities, and takes into account sustainability BMPs implemented during the RI process. The project team will determine their RI-specific sustainability rating. While the rating system provides the project team with a mechanism for assessing the sustainability of RI tasks, there may be overriding factors on a project that may lead to implementing approaches that might not be the most sustainable option. Such issues will be taken into account during the sustainability rating process, and may be summarized as an attachment to the GREM. 7.4 Recommendations for Additional Sustainability Best Management Practices A fundamental element of the sustainability framework (Section 4) is for the project team to identify opportunities for additional sustainable practices, including revised BMPs, for future tasks both within RI activities and during future activities. Following implementation of preliminary sustainability BMPs, their effectiveness will be evaluated by the project team. Recommendations for future or revised sustainability BMPs will be assessed throughout the implementation of RI activities. Revised sustainability BMPs will be implemented and evaluated in the GREM via the same process summarized above. 7.5 Data Management and Reporting
Each step of the sustainability evaluation will be recorded in the RI-specific GREM, as discussed in Sections 3 and 5, and above. The project team is responsible for designating a team member who will take ownership of the RI-specific GREM, and complete and update it as necessary. At a minimum, updates should be performed on a quarterly basis.

© Pacific Gas and Electric Company, 2012 38
It is recommended that the sustainability approach be summarized in the RI Workplan. The GREM and supporting attachments (that for example discuss assumptions and/or calculations in support of the GREM) will be included as an appendix. Sustainability BMPs proposed for field tasks will be highlighted in the workplan and approved by the regulatory agency prior to implementation. Once the regulatory-approved BMPs are implemented and the benefits tracked in the GREM, it is recommended that a summary of the sustainability evaluation results be documented in the RI report and that the RI-specific GREM be included as an appendix to this report. The RI-specific sustainability evaluation will be updated as needed, for example through the implementation of additional sustainability BMPs following initial RI tasks. Interim versions of the RI report will be prepared as necessary to record additional sustainability BMPs following initial RI tasks.

© Pacific Gas and Electric Company, 2012 39
The FS‐specific GREM guides the sustainability effort for FS activities.
This section focuses on the identification and
evaluation of sustainable practices to be implemented by the project team as part of the technical evaluation of remedial alternatives within the FS process.
8. FEASIBILITY STUDY 8.1 Key Elements of the Feasibility Study FS activities are performed to identify and evaluate potential remedial alternatives. The FS sets forth one or more preferred alternatives to be incorporated in RDI activities. 8.2 Sustainability Approach
Sustainable practices relating to the FS stage of a project are typically incorporated into:
Office-based tasks, for example for the submittal of FS-related documentation;
The technical evaluation of remedial alternatives within the FS process;
Tasks that reflect whether sustainability was incorporated into the overall FS stage of the project regardless of the remedial alternative(s) selected; and
In select cases, field tasks, for example FS-related tasks such as pilot testing, bench-scale testing, and/or interim measures.
Sustainable practices and their related evaluation for office-based project tasks are summarized in Section 6. For the purposes of this Guidance, sustainable practices related to FS field tasks are
accounted for under the RDI section (Section 9). This section therefore focuses on the identification and evaluation of sustainable practices to be implemented by the project team as part of the technical
evaluation of remedial alternatives within the FS process. The project team is responsible for ensuring that all persons involved in FS activities understand how the Guidance will tie in to their work and that they implement applicable sustainable practices to the extent possible. This Guidance recommends that sustainability constitute an additional consideration alongside the traditional criteria (including overall protection of human health and the environment; compliance with Federal and State statutes; long-term effectiveness and permanence; reduction of toxicity, mobility or volume through treatment; short-term effectiveness; ability to implement; cost; state acceptance; and community acceptance) commonly used to evaluate remedial alternatives within the FS process. For projects where a RAW process is implemented instead of a formal FS, sustainability will constitute an additional consideration alongside the typical criteria (including effectiveness, implementability and cost). The FS-specific GREM guides the sustainability effort for FS activities, as described below and as illustrated in Table V. Each of the FS-specific GREM components will be implemented according to the guidelines set forth in Section 5.

TABLE V - GREEN REMEDIATION EVALUATION MATRIX FOR FEASIBILITY STUDY ACTIVITIES
Stressors AffectedMedia
Mechanism/Effect
Applicable to Project
(Y/N)
Potential Best Management
Practices
Type of Evaluation Metric
Sustainability Calculation
Result
Standardized Result
Sustainability Calculation
Result
Standardized Result
Sustainability Calculation
Result
Standardized Result
Greenhouse Gas Emissions Air Atmospheric Warming QuantitativeMetric tons of CO2
equivalents / total volume of COCs
Airborne Nitrogen Oxides and Sulfur Oxides Air Acid Rain &
Photochemical Smog Quantitative µg/m3
Airborne Particulates AirGeneral Air
Pollution/Toxic Air/Humidity Increase
Quantitative µg/m3
Liquid Waste production WaterWater Toxicity/
Sediment Toxicity/ Sediment
QuantitativePercentage reduction
in liquid waste production
Impacted Surface Run-Off Land; WaterWater Toxicity/
Sediment Toxicity/ Sediment
QuantitativePercentage increase in impacted surface
run-off
Solid Waste Recycling or Salvaging (Excluding Soil) Land Land Use/Toxicity Quantitative
Percentage of solid waste recycled or
salvaged
Waste Soil Recycling or Reuse Land Land Use/Toxicity Quantitative Percentage of waste
soil recycled or reused
Toxic Materials Air; Land; Water
Toxic Air/Water Toxicity/Land Use/Toxicity
Qualitative --
Soil Structure Disruption Land Habitat Destruction/Soil Infertility Quantitative Cubic yards
Energy Use Subsurface Consumption QuantitativePercentage of energy
generated by renewable sources
Materials Land Consumption/ Reuse QuantitativePercentage of
materials that are recycled or reused
Surface Water andGroundwater Extraction
Water, Land (Subsidence)
Impoundment/Sequester/ Reuse Quantitative Remediation system
optimization
Biological Resources (Plants/Animals/ Microorganisms)
General Environment
Species Disappearance/
Diversity ReductionQuantitative Sensitive species
Cultural Resources Social Impact to Resource Quantitative Cultural resources
Remedial Alternative 1 Remedial Alternative 2 Remedial Alternative 3*
Substance Release/Production
Physical Disturbances/Disruptions
Resource Depletion/Gain (Recycling)
© Pacific Gas and Electric Company, 2012 40

TABLE V - GREEN REMEDIATION EVALUATION MATRIX FOR FEASIBILITY STUDY ACTIVITIES
Stressors AffectedMedia
Mechanism/Effect
Applicable to Project
(Y/N)
Potential Best Management
Practices
Type of Evaluation Metric
Sustainability Calculation
Result
Standardized Result
Sustainability Calculation
Result
Standardized Result
Sustainability Calculation
Result
Standardized Result
Remedial Alternative 1 Remedial Alternative 2 Remedial Alternative 3*
Stakeholder Satisfaction Social Public Participation Quantitative Number of unresolved complaints
Local Economy Boost Social Employment/ Income/ Training Quantitative
Percentage of project expenditure providing local economy boost
Occupational Health and Safety Social Health and Safety Quantitative
Accidents requiring treatment beyond first
aid
Future Land Use Economic Economic Performance Qualitative Land use
Notes:µg/m3 = micrograms per cubic meter CO2 = carbon dioxideCOC = Chemicals of Concern* Additional remedial alternatives may be added to this table, if required.
FS-specific rating:
Land Use
Stakeholder Considerations
Human Health & Safety
Remedial alternative rating:
© Pacific Gas and Electric Company, 2012© Pacific Gas and Electric Company, 2012 41

© Pacific Gas and Electric Company, 2012 42
8.2.1 Stressor Identification and Applicability
The FS-specific GREM provides a comprehensive list of potential stressors that may be associated with one or more of the proposed remedial alternatives (Table V). The project team will determine the stressors to be evaluated for FS activities. As indicated in Section 5, the significance of different stressors to a project (or remedial alternative) is site-specific. Only those stressors that will pose the greatest sustainability impact will be selected and recorded by the project team in the FS-specific GREM, others will be screened out. The impacted media and the impact mechanism/effect will also be identified for each stressor.
8.2.2 Sustainability Best Management Practices
For each stressor, the project team will identify sustainability BMPs that will be implemented to address sustainability impacts. Key sustainability BMPs for FS activities include:
Selecting remedies that destroy chemicals on-site;
Reducing off-site transport of waste;
Employing low-emitting technologies;
Identifying opportunities to reduce energy requirements for remedies;
Reducing soil structure disruption;
Incorporating renewable energy into the project, where feasible;
Reusing and recycling materials; and
Reducing disturbance to affected and/or disadvantaged communities.
Appendix C provides a comprehensive list of sustainability BMPs relating to each of the stressors for FS activities. The list is not exhaustive and the project team may identify additional BMPs.
8.2.3 Sustainability Impact Evaluation
The project team will perform a focused sustainability impact evaluation for the pertinent stressors relating to each remedial alternative being considered at the FS stage. As discussed in Section 5, the project team will provide the type of evaluation, the appropriate metric, the evaluation result and the result standardization process for each of the respective stressors in the FS-specific GREM. Sustainability impacts associated with significant stressors will be evaluated for each remedial alternative being considered for the project-specific FS and will be recorded in the GREM. The evaluation
Success Story: At a PG&E site, sustainability criteria have been fully implemented into the FS process, aiding in the comprehensive evaluation and selection of preferred remedial alternatives.

© Pacific Gas and Electric Company, 2012 43
The project team will determine an overall sustainability impact
rating for each remedial alternative being
evaluated within the FS.
The sustainability rating for different remedial alternatives enables project team to rank each of the remedial alternatives evaluated
with respect to sustainability.
methodology described in Appendix D may be followed to perform the sustainability evaluations. Care is to be taken to ensure that the level of complexity of the sustainability evaluation is proportionate to the complexity and rigor of the proposed remedial alternatives.
8.3 FS Activity‐Specific Sustainability Rating System 8.3.1 Remedial Alternative Rating System
The project team will determine an overall sustainability impact rating in the GREM for each remedial alternative being evaluated within the FS. As described in Section 5 and illustrated in Table V, for each remedial alternative, each of the stressor-specific impacts will be evaluated to yield a stressor-specific sustainability result. The result will then be standardized to yield “Low”, “Moderate” and “High” sustainability impact scores. Each of the stressor-specific
sustainability impact scores will be combined to provide an overall sustainability rating for the different remedial alternatives evaluated in the GREM. This rating is based on the proportion of “Low”, “Moderate” and “High” sustainability impact scores provided for each of the stressor-specific impacts. Therefore, remedial alternatives with the greatest proportion of “Low” stressor-specific scores will be assigned a “Low” sustainability impact rating. The sustainability rating for different remedial alternatives enables project team to rank each of the remedial alternatives evaluated with respect to sustainability. Importantly, the sustainability rating is not intended to serve as the basis for remedial alternatives selection. Instead, the score serves as one consideration, that when combined with the various standard criteria typically used to evaluate remedial alternatives within an FS process, allows for a comprehensive approach to remedial alternative evaluation that takes into account sustainability. Moreover, while the GREM provides the project team with a mechanism for comparing the relative sustainability of different remedial options, there may be overriding factors on a project that may lead to selecting a remedial alternative that might not be as sustainable as other options. Such issues will be recorded during the FS-specific sustainability rating process, and may be summarized as an attachment to the GREM.

© Pacific Gas and Electric Company, 2012 44
The project team will determine a rating that assesses the extent to which sustainability is incorporated into the FS process, regardless of
the remedial alternative considered.
8.3.2 FS Activity‐Specific Rating System
As described in Section 5, the project team will also determine a separate rating that assesses the extent to which sustainability is incorporated into the FS process, regardless of the remedial alternative considered. The sustainability rating focuses on the degree to which sustainability was accounted for during the assessment of remedial alternatives, as follows:
A “Low” sustainability impact rating is awarded if
significant effort to incorporate sustainability into the remedy selection process was demonstrated and the FS-specific GREM was employed by the remediation project team for the sustainability evaluation.
A “Moderate” sustainability impact rating is awarded if sustainability was considered during the remedy selection process but the FS-specific GREM was not employed by the remediation project team for the sustainability evaluation.
A “High” sustainability impact rating is awarded if sustainability was not considered during the remedy selection process.
This rating system enables the project team to benchmark the sustainability of their project against other PG&E remediation projects for FS activities.
8.4 Recommendations for Additional Sustainability Best Management Practices A fundamental element of the sustainability framework (Section 4) is for the project team to identify opportunities for additional sustainable practices as FS activities progress and during future activities. Following implementation of preliminary sustainability BMPs, the project team will evaluate their effectiveness. Recommendations for future or revised sustainability BMPs will be assessed throughout the implementation of FS activities. Revised sustainability BMPs will be implemented and evaluated in the GREM via the same process summarized above.
8.5 Data Management and Reporting
Each step of the sustainability evaluation will be recorded in the FS-specific GREM, as discussed in Sections 3 and 5, and above. The GREM enables the project team to compare the sustainability of each remedial alternative evaluated within the FS, as well as the extent to which sustainability was taken into account during FS activities. The project team is responsible for designating a team member who will take ownership of the GREM, and complete and update it as necessary. At a minimum, updates should be performed on a quarterly basis. It is recommended that the results of the sustainability evaluation be summarized within the text of the FS submitted to the oversight agency and that the FS-specific GREM and supporting attachments be included as an appendix to the FS.

© Pacific Gas and Electric Company, 2012 45
The RDI‐specific GREM guides the sustainability effort for RDI activities.
9. REMEDIAL DESIGN AND IMPLEMENTATION 9.1 Key Elements of Remedy Design and Implementation RDI activities include designing and performing the proposed remedial action(s) for the remedial alternative(s) selected during FS activities, such as related pilot studies, interim measures and/or full-scale remediation. Tasks may include developing remedy selection documents, remedial design and construction, and remedial implementation and optimization as necessary. 9.2 Sustainability Approach
Sustainable practices within the RDI activities of the project include those that may be integrated into remedy conceptualization and design, and those that may be incorporated as part of field tasks required for remedy implementation, such as pilot studies, interim measures and/or full-scale remediation. Pilot studies often promote the incorporation of sustainability during a project. For example, they assist the project team in selecting equipment of suitable size, which ensures optimal energy use. They might also identify opportunities for reductions in electricity and water consumption, volumes of material purchased, and off-site disposal volumes, resulting in major efficiency gains to an operating system. Building decommissioning and/or demolition tasks performed as part of RDI tasks are also included within RDI activities. Sustainable practices and their related evaluation for office-based project tasks are summarized in Section 6. This section therefore focuses on the identification and evaluation of sustainable practices to be implemented by the project team as part of field tasks, including those required for pilot studies, interim measures and/or full-scale remediation. Remedy optimization, which includes the continuous improvement and optimization of remediation technologies and techniques (Interstate Technology and Regulatory Council, 2004), forms an integral part of RDI activities and plays an important role in promoting sustainability during this activities. The project team is responsible for ensuring that all persons involved in RDI activities understand how the Guidance will tie in to their work and that they implement applicable sustainable practices to the extent possible.
The RDI-specific GREM guides the sustainability effort for RDI activities, as described below and as illustrated in Table VI. Each of the RDI-specific GREM components will be implemented according to the guidelines set forth in Section 5.
9.2.1 Stressor Identification and Applicability The RDI-specific GREM provides a comprehensive list of potential stressors that may be associated with RDI activities (Table VI). As indicated in Section 5, the significance of stressors to a project (or remedial alternative) is site-specific. The project team will determine the stressors to be evaluated for RDI activities. Only those stressors that will pose the most significant sustainability impact will be selected within the RDI-specific GREM, others will be screened out. The impacted media and the impact mechanism/effect will also be identified for each stressor.

TABLE VI - GREEN REMEDIATION EVALUATION MATRIX FOR REMEDIAL DESIGN AND IMPLEMENTATION ACTIVITIES
Stressors AffectedMedia
Mechanism/Effect
Applicable to Project
(Y/N)
Potential Best Management
Practices
Type of Evaluation Metric Sustainability
Calculation ResultStandardized
Result
Greenhouse Gas Emissions Air Atmospheric Warming Quantitative Metric tons of CO2 equivalents / total volume of COCs
Airborne Nitrogen Oxides and Sulfur Oxides Air Acid Rain &
Photochemical Smog Quantitative µg/m3
Airborne Particulates Air General Air Pollution/Toxic Air/Humidity Increase Quantitative µg/m3
Liquid Waste production Water Water Toxicity/ Sediment Toxicity/ Sediment Quantitative Percentage reduction in liquid waste production
Impacted Surface Run-Off Land; Water Water Toxicity/ Sediment Toxicity/ Sediment Quantitative Percentage increase in impacted surface run-off
Solid Waste Recycling or Salvaging (Excluding Soil) Land Land Use/Toxicity Quantitative Percentage of solid waste recycled or salvaged
Waste Soil Recycling or Reuse Land Land Use/Toxicity Quantitative Percentage of waste soil recycled or reused
Energy Use Subsurface Consumption Quantitative Percentage of energy generated by renewable sources
Materials Land Consumption/ Reuse Quantitative Percentage of materials that are recycled or reused
Surface Water andGroundwater Extraction
Water, Land (subsidence)
Impoundment/Sequester/Reuse Quantitative Remediation system optimization
Biological Resources (Plants/Animals/ Microorganisms)
General Environment
Species Disappearance/Diversity Reduction Quantitative Sensitive species
Cultural Resources Social Impact to Resource Quantitative Cultural resources
Stakeholder Satisfaction Social Public Participation Quantitative Number of unresolved complaints
Local Economy Boost Social Employment/ Income/Training Quantitative Percentage of project expenditure providing local economy boost
Occupational Health and Safety Social Health and Safety Quantitative Accidents requiring treatment beyond first aid
Future Land Use Economic Economic Performance Qualitative Land Use
Notes:µg/m3 = micrograms per cubic meter CO2 = carbon dioxideCOC = Chemicals of Concern
RDI-specific rating:
Substance Release/Production
Resource Depletion/Gain (Recycling)
Land Use
Stakeholder Considerations
Human Health & Safety
© Pacific Gas and Electric Company, 2012 46

© Pacific Gas and Electric Company, 2012 47
9.2.2 Sustainability Best Management Practices
For each stressor, the project team will identify sustainability BMPs that will be implemented to address sustainability impacts caused by RDI activities. Key sustainability BMPs for RDI activities include:
Reducing the number of site mobilizations;
Utilizing more sustainable remediation technologies, for example low-emitting technologies;
Optimizing/retrofitting equipment;
Employing local labor to perform site tasks; and
Reducing community disturbance.
Appendix C provides a comprehensive list of sustainability BMPs relating to each stressor for RDI activities. The list is not necessarily exhaustive and the project team may identify additional BMPs.
9.2.3 Sustainability Impact Evaluation
During RDI activities, the project team will perform a focused evaluation for the relevant stressors. As discussed in Section 5, the type of evaluation, the appropriate metric, the evaluation result and the result standardization process will be provided for each of the respective stressors in the RDI-specific GREM. Sustainability impacts associated with significant stressors will be evaluated and recorded in the GREM. The evaluation methodology described in Appendix D may be followed to perform the sustainability evaluations. Care is to be taken to ensure that the level of complexity of the sustainability evaluation is proportionate to the complexity and rigor of the remediation approach implemented for the project.
Success Story: For a particular PG&E project, sustainable BMPs have been implemented into RDI activities, maximizing the potential for sustainable benefits during remedial implementation.
Success Story: BMPs implemented during pilot testing activities at one site have resulted in reductions in the utilization of energy by as much as 15,000 kWh.

© Pacific Gas and Electric Company, 2012 48
9.3 RDI‐Activity Specific Sustainability Rating System
As described in Section 5, a rating system is provided to assess the extent to which sustainability is incorporated into the RDI process. The project team will determine their RDI-specific sustainability rating. The rating focuses on the degree to which sustainability was accounted for during RDI activities and takes into account sustainability BMPs implemented during the RDI process. While the rating system provides the project team with a mechanism for assessing the sustainability of RDI tasks, there may be overriding factors on a project that may lead to implementing approaches that might not be the most sustainable option. Such issues will be taken into account during the sustainability rating process, and may be summarized as an attachment to the GREM. 9.4 Recommendations for Additional Sustainable Practices A fundamental element of the sustainability framework (Section 4) is for the project team to identify opportunities for additional sustainable practices as RDI activities progress and during future activities. Following implementation of preliminary sustainability BMPs, their effectiveness will be evaluated by the project team. Recommendations for future or revised sustainability BMPs will be assessed throughout the implementation of RDI activities. Revised sustainability BMPs will be implemented and evaluated in the GREM via the same process summarized above. 9.5 Data Management and Reporting
Each step of the sustainability evaluation will be recorded in the RDI-specific GREM, as discussed in Sections 3 and 5, and above. The project team is responsible for designating a team member who will take ownership of the GREM, and complete and update it as necessary. At a minimum, updates should be performed on a quarterly basis. It is recommended that the sustainability approach be summarized in site-specific and remedy-specific documents submitted to the oversight agency during RDI activities, for example in reports relating to remedial design. The RDI-specific GREM and supporting attachments may constitute a supporting appendix. Interim versions of documentation will be prepared as necessary to record additional sustainability BMPs following initial RDI tasks.
Success Story: At one of PG&E’s sites, BMPs implemented during remedial activities resulted in a boost in the local economy in excess of one million dollars.
Success Story: During a particular PG&E project, BMPs related to remediation activities resulted in reductions in GHG emissions by as much as 131 metric tons of carbon dioxide equivalents, a 225,000 dollar boost to the local economy, and a stakeholder satisfaction rating of 100 percent.

© Pacific Gas and Electric Company, 2012 49
10. OPERATION AND MAINTENANCE AND CLOSURE (INCLUDING POST‐REMEDIATION SITE CONDITIONS)
10.1 Key Elements of Operation and Maintenance/Closure O&M activities include tasks required to maintain the effectiveness and integrity of the remedial alternative(s) implemented during RDI activities and to demonstrate that remedial objectives have been achieved. Once completed, O&M activities are followed by Closure activities. These activities focus on obtaining and documenting site closure, including tasks related to well abandonment/destruction, system demobilization, and/or implementation of institutional controls/deed restrictions. In some cases, tasks within these two activities occur in parallel, such as where deed restrictions are implemented while O&M tasks may remain active. Due to the synergy between these two activities, implementation and related evaluation of sustainable practices for O&M and Closure activities have been combined. Some projects may result in beneficial use of the site for the local community following the completion of the project. Therefore, post-remediation site conditions are also covered within O&M/Closure activities.
10.2 Sustainability Approach
This section focuses on the identification and evaluation of sustainable practices to be implemented by the project team as part of field tasks associated with the O&M/Closure process. This Guidance recognizes that the significance of O&M activities in terms of the application of sustainable practices may be variable according to the nature of the project. Specifically, projects with significant levels of O&M for active remediation systems may prove field intensive, often requiring multiple site mobilizations, thereby increasing the potential for GHG emissions, airborne particulates, IDW, disturbance to the local community, and technology costs and related project expenditures. In addition, O&M tasks will include steps to ensure acceptable human health risks and safety. Conversely, on projects where remediation efforts comprehensively address chemical impacts and do not warrant follow-up O&M tasks, the O&M activities may prove less significant from a sustainability standpoint. Similarly, field tasks required as part of site closure may vary in terms of significance, depending on the extent of system demobilization, well abandonment, and whether deed restrictions, institutional controls, and related soil management and risk management plans are warranted. Hence, the approach to the sustainability evaluation for O&M/Closure will account for this potential variability and be accordingly defined for each project. Sustainability BMPs will be taken into account to improve post-remediation site conditions, where feasible. The sustainability approach for post-remediation site conditions will be documented, as described below.
© Pacific Gas and Electric Company, 2012 50
The O&M/Closure‐specific GREM guides the
sustainability effort for O&M/Closure activities.
The project team is responsible for ensuring that all persons involved in the O&M/Closure activities understand how the Guidance will tie in to their work and that they implement applicable sustainable practices to the extent possible. The O&M/Closure-specific GREM guides the sustainability effort for O&M/Closure activities, as described below and as illustrated in Table VII. Each of the O&M/Closure-specific GREM components will be implemented according to the guidelines set forth in Section 5. 10.2.1 Stressor Identification and Applicability
The O&M/Closure-specific GREM provides a comprehensive list of potential stressors that may be associated with O&M/Closure-specific tasks (Table VII). As indicated in Section 5, the significance of stressors during O&M/Closure activities is site-specific. The project team will select stressors that pose a significant sustainability impact and record these in the O&M/Closure-specific GREM, other stressors will be screened out. The impacted media and the impact mechanism/effect will also be identified for each stressor by the project team in the GREM.
10.2.2 Sustainability Best Management Practices
For each stressor, the project team will identify sustainability BMPs that will be implemented to address sustainability impacts. Key sustainability BMPs for O&M/Closure activities include:
Implementing vehicle reduction plans to reduce the number of site mobilizations;
Utilizing vehicles with cleaner fuels and retrofitted diesel engines;
Utilizing passive sampling technologies and those reducing IDW; and
Utilizing optimized equipment.
Important sustainability BMPs for post-remediation site conditions include:
Ensuring long-term stewardship and beneficial reuse of the site;
Reusing remaining buildings at the site and incorporating sustainable practices into existing and new buildings, where feasible;
Recycling demolition waste; and
Considering stakeholder opinions and their stated needs relating to redevelopment.
Appendix C provides a comprehensive list of sustainability BMPs relating to each stressor for O&M/Closure activities. The list is not necessarily exhaustive and the project team might identify additional BMPs.

TABLE VII - GREEN REMEDIATION EVALUATION MATRIX FOR OPERATION AND MAINTENANCE/CLOSURE (INCLUDING POST-REMEDIATION SITE CONDITIONS) ACTIVITIES
Stressors AffectedMedia
Mechanism/Effect
Applicable to Project
(Y/N)
Potential Best Management
Practices
Type of Evaluation Metric
Sustainability Calculation
Result
Standardized Result
Greenhouse Gas Emissions Air Atmospheric Warming QuantitativeMetric tons of CO2 equivalents /
total volume of COCs
Airborne Nitrogen Oxides and Sulfur Oxides Air Acid Rain & Photochemical Smog Quantitative µg/m3
Airborne Particulates Air General Air Pollution/ToxicAir/Humidity Increase Quantitative µg/m3
Liquid Waste Production Water Water Toxicity/ Sediment Toxicity/ Sediment Quantitative Percentage reduction in liquid
waste production
Impacted Surface Run-Off Land; Water Water Toxicity/ Sediment Toxicity/ Sediment Quantitative Percentage increase in impacted
surface run-offSolid Waste Recycling or Salvaging (Excluding
Soil) Land Land use/ Toxicity Quantitative Percentage of solid waste recycled or salvaged
Waste Soil Recycling or Reuse Land Land use/ Toxicity Quantitative Percentage of waste soil recycled or reused
Energy Use Subsurface Consumption Quantitative Percentage of energy generated by renewable sources
Materials Land Consumption/ Reuse Quantitative Percentage of materials recycled or reused
Surface Water andGroundwater Extraction
Water, Land (Subsidence)
Impoundment/Sequester/ Reuse Quantitative Remediation system optimization
Biological Resources (Plants/Animals/Microorganisms)
General Environment
Species Disappearance/Diversity Reduction Quantitative Sensitive species
Cultural Resources Social Impact to Resource Quantitative Cultural resources
Stakeholder Satisfaction Social Public Participation Quantitative Number of unresolved complaints
Local Economy Boost Social Employment/ Income/Training
Quantitative Percentage of project expenditure providing local
Occupational Health and Safety Social Health and Safety Health and Safety Quantitative Accidents requiring treatment
beyond first aid
Future Land Use Economic Economic Performance Quantitative Land Use
Post-Remediation Site Conditions Social Stewardship Qualitative Beneficial use to local community
Notes:µg/m3 = micrograms per cubic meter CO2 = carbon dioxideCOC = Chemicals of ConcernLEED: Leadership in Energy and Environmental Design
Substance Release/Production
Resource Depletion/Gain (Recycling)
Land Use
Stakeholder Considerations
O&M/Closure-specific rating:
Human Health & Safety
© Pacific Gas and Electric Company, 2012 51

© Pacific Gas and Electric Company, 2012 52
10.2.3 Sustainability Impact Evaluation
During O&M/Closure activities, the project team will perform a focused evaluation for the relevant stressors, including stressors for post-remediation site conditions, where applicable. As discussed in Section 5, the project team should provide the type of evaluation, the appropriate metric, the evaluation result and the result standardization process for each of the respective stressors in the O&M/Closure-specific GREM. Sustainability impacts associated with significant stressors will be evaluated and recorded in the GREM. The evaluation methodology described in Appendix D may be followed to perform the sustainability evaluations. Care is to be taken to ensure that the level of complexity of the sustainability evaluation is proportionate to the complexity and rigor of the O&M/Closure approach.
10.3 Operation and Maintenance, and Closure Sustainability Rating System A rating system is provided to assess the extent to which sustainability is incorporated into the O&M/Closure process (including post-remediation site conditions, where applicable). The project team will determine their O&M/Closure-specific sustainability rating. The sustainability rating focuses on the degree to which sustainability was accounted for during O&M/Closure tasks. Importantly, the sustainability rating is not intended to serve as the basis for the O&M/Closure processes. While the rating system provides the project team with a mechanism for assessing the sustainability of O&M/Closure tasks, there may be overriding factors on a project that may lead to implementing approaches that might not be the most sustainable option. Such issues will be taken into account during the sustainability rating process, and may be summarized as an attachment to the GREM. 10.4 Recommendations for Additional Sustainability Best Management Practices A fundamental element of the sustainability framework (Section 4) is the ability for the project team to generate recommendations for additional BMPs for future O&M (and possibly Closure) tasks. Following implementation of preliminary sustainability BMPs, their effectiveness will be evaluated and recommendations for future or revised sustainability BMPs will be assessed throughout the implementation of O&M/Closure activities. Revised sustainability BMPs will be implemented and evaluated in the O&M/Closure-specific GREM via the same process summarized above. 10.5 Data Management and Reporting Each step of the sustainability evaluation will be recorded in the O&M/Closure-specific GREM, as discussed in Sections 3 and 5, and above. The project team is responsible for designating a team member who will take ownership of the GREM, and complete and update it as necessary. At a minimum, updates should be performed on a quarterly basis.
Success Story: At one site, BMPs focused on groundwater monitoring activities have yielded a reduction in liquid waste generation by as much as 35,000 gallons.

© Pacific Gas and Electric Company, 2012 53
It is recommended that the O&M/Closure-specific sustainability evaluation results be summarized in appropriate documents submitted to the oversight agency, for example O&M Plans or status updates requiring approval by the oversight agency. The O&M/Closure-specific GREM and supporting attachments may constitute an appendix to this documentation. Interim versions of the plans will be prepared as necessary to record additional sustainability BMPs implemented following initial O&M/Closure tasks. BMPs implemented to improve post-remediation site conditions will also be documented and incorporated into applicable O&M/Closure reports.

© Pacific Gas and Electric Company, 2012 54
Once sustainability ratings have been developed for the different project‐specific activities, the
project team will combine activity‐specific ratings to provide an overall project sustainability rating. The project sustainability
rating is based on the proportion of “Low”
activity‐specific ratings for the project activities
covered by the sustainability framework.
11. PROJECT SUSTAINABILITY RATING
As mentioned in Sections 6 through 10, once sustainability ratings have been developed for the different project-specific activities, the project team will combine activity-specific ratings to provide an overall project sustainability rating. The project sustainability rating enables the project team to benchmark the sustainability benefits of different PG&E projects and sites against each other and over time. The proposed project sustainability rating is straightforward and easy
to use. It is based on the proportion of “Low” activity-specific ratings for the project activities (i.e. Project Planning and Office-Based Tasks, RI, FS, RDI, and O&M/Closure) covered by the sustainability framework in Section 4. A project can therefore start at any point in the remediation project life cycle and still achieve an overall project sustainability rating. Additional opportunities to incorporate sustainable practices exist during certain activities. Therefore, the Guidance utilizes a weighting system for calculating the proportion of “Low” activity-specific ratings. The weighting system was agreed upon by PG&E and representatives of the DTSC. The weighting of the different activities is as follows:
Project Planning (including office-based tasks) weighting: 1;
RI weighting: 1.25;
FS weighting: 1;
RDI weighting: 1.25; and
O&M/Closure (including post-remediation site conditions) weighting: 1. Based on the proportion of “Low” activity-specific ratings, a project will achieve a “Platinum”, “Gold”, “Silver” or “No Rating” project sustainability rating. The proportion of “Low” activity-specific ratings required for each category of rating is as follows:
Platinum: greater than 70 percent “Low” activity-specific ratings;
Gold: between 55 and 70 percent “Low” activity-specific ratings;
Silver: between 45 and 55 percent “Low” activity-specific ratings;
No Rating: less than 45 percent “Low” activity-specific ratings.
A hypothetical project example providing the calculation steps for evaluating the project sustainability rating is provided below in Box 2.

© Pacific Gas and Electric Company, 2012 55
Project Sustainability Rating Calculation Steps for a Hypothetical ProjectA hypothetical project started incorporating sustainability for RI activities. The activity‐specific sustainability ratings were as follows:
RI: Moderate FS: Low RDI: Low O&M/Closure: Low
Applying the weighting system described above for the various project activities, activity‐specific scores are calculated according to equation 1 below:
Equation 1: Activity‐specific score = activity‐specific rating x weighting
Where:“Low” activity‐specific rating = 1; and “Moderate” or “High” activity‐specific rating = 0
Therefore, the following activity‐specific scores were achieved for the remediation activities covered by the hypothetical project:
RI: 0 x 1.25 = 0 FS: 1 x 1 = 1 RDI: 1 x 1.25 = 1.25 O&M/Closure: (including post‐remediation site conditions): 1 x 1 = 1
The project sustainability rating is calculated according to equation 2:
Equation 2: Project sustainability rating = sum of activity‐specific ratings for remediation activities covered by the project
In this example, the project sustainability rating equals:
Project sustainability rating = 0 + 1 +1.25 + 1 = 3.25
The maximum sustainability rating available for the project (i.e. if each of the activity‐specific ratings achieved a “Low” rating) score is calculated according to equation 3:
Equation 3: Maximum project = sum of maximum activity‐specific scoressustainability rating available for each activity covered by the project
In this example, the maximum sustainability rating equals:
Maximum sustainability rating = 1.25 + 1 +1.25 + 1 = 4.5
The proportion of “Low” scores throughout the project life cycle is calculated according to Equation 4:
Equation 4: Proportion of “Low scores” = project sustainability rating
maximum sustainability rating
In this example, the proportion of “Low” scores is:
Proportion of “Low’ scores” = 3.25 / 4.5 = 0.72 or 72 percent
Therefore the project sustainability rating of this hypothetical example is “Platinum”.
BOX 2

© Pacific Gas and Electric Company, 2012 56
11.1 Recording of Results
The project sustainability rating will be recorded and stored electronically in the project folder, alongside the activity-specific GREMs and supporting attachments. The project team is responsible for designating a team member to evaluate the project sustainability rating and to record results on a quarterly basis.

© Pacific Gas and Electric Company, 2012 57
12. CUMULATIVE SUSTAINABILITY BENEFITS In parallel with the provision of sustainability ratings discussed in Section 11, sustainability benefits will be evaluated across seven key sustainability elements throughout the lifecycle of each project. These benefits will be updated on a quarterly basis, resulting in a cumulative reporting for each element as a project progresses through each project activity and until the site is closed. In turn, this cumulative compilation for each project allows for a programmatic roll-up of cumulative benefits across the entire PG&E remediation portfolio. The seven key elements across which cumulative sustainable benefits will be tracked include:
Reductions in GHG emissions;
Savings in energy consumption through the utilization of renewable energy sources;
Reductions in offsite disposal of solid wastes (i.e. recycled wastes);
Reductions in soil IDW;
Reductions in liquid IDW;
Boosts to the local economy; and
Stakeholder satisfaction The first five elements listed above quantify reductions or savings (e.g., GHG emissions). Two values should be evaluated to quantify these elements:
1) Impact of each element (e.g., GHG emission) without BMPs; and
2) Impact of each element with BMPs. The difference between the two estimates above correspond to the reduction or savings achieved from BMP implementation relative to each of these elements. These reduction/savings will be summed cumulatively for each element as the project progresses through its lifecycle, with reporting of such cumulative benefits to date occurring on a quarterly basis. For the local economy boost element, the cumulative benefit is merely the sum of the expenditures occurring within the area identified by the project team as local to the site. Again, these expenditures will be summed cumulatively as the project progresses through its lifecycle, with reporting of cumulative benefits to date occurring on a quarterly basis. For the stakeholder satisfaction element, the project team will track all issues and/or concerns raised by stakeholders throughout the project lifecycle. As the team responds to such issues/concerns, the team will track the number of unresolved issues/concerns, if any. This allows the evaluation of stakeholder satisfaction, reported as a percentage, as the ratio between the number of resolved concerns/issues related to the total number of concerns/issues. Importantly, if no concerns/issues are raised, the reporting for this element corresponds to “not applicable”.

© Pacific Gas and Electric Company, 2012 58
12.1 Recording of Results
The cumulative sustainability benefits, including supporting calculations, will be recorded and stored electronically in the project folder, alongside the activity-specific GREMs and supporting attachments. The project team is responsible for designating a team member to evaluate the cumulative sustainability benefits and to record results on a quarterly basis. As discussed in Section 2, to date, the cumulative sustainability benefits have been compiled since the First Quarter of 2011, with an increasing number of participating sites with each passing quarter. Appendix E includes a detailed summary of cumulative sustainable benefit for each participating site through the First Quarter of 2012, including the cumulative roll-up of these benefits across the entire portfolio of sites.

© Pacific Gas and Electric Company, 2012 59
REFERENCES 1. Department of Toxic Substances Control (2009). Interim Advisory for Green
Remediation. December
2. Interstate Technology and Regulatory Council (2004). Remediation Process Optimization: Identifying Opportunities for Enhanced and More Efficient Site Remediation. September.
3. United States Environmental Protection Agency, 2001. Improving Sampling, Analysis, and Data Management for Site Investigation and Cleanup. EPA-542-F-01-030a. April.
4. United States Environmental Protection Agency, 2008. Green Remediation: Incorporating Sustainable Environmental Practices into Remediation of Contaminated Sites. April

© Pacific Gas and Electric Company, 2012
APPENDIX A: Data Collection Templates

Examples of Data to be Collected during BMP Implementation
Stressor
Data Needs for Tracking BMPs
Greenhouse gas emissions
‐Track vehicle types and fuel types ‐Track distance traveled ‐Track number of mobilizations ‐Track number of passengers per vehicle trip
Airborne particulates ‐Same as (1) ‐Track air quality measurements
Investigation‐derived waste
Demolition of structures and features
‐Track drums of soil generated ‐Track drums of water generated ‐Calculate volume of recyclable materials by waste category ‐Calculate ratio of recycled materials vs. total materials
Noise and odor ‐Track protective measures implemented (noise reduction mufflers, etc.) ‐Track related stakeholder concerns
Traffic ‐Track number of mobilizations ‐Track traffic management measures ‐Track traffic‐related concerns
Renewable Energy ‐Track sources of renewable energy used ‐Track resulting reduction in energy usage (kWh)
Cost ‐Track actual costs
Local economy boost
‐Track reliance on local vendors ‐Track location (distance to site) of all contractors ‐Develop economic zones in proximity of site ‐Track revenues for all contractors
Stakeholder/community involvement
‐Track all public participation meetings and discussions ‐Track specific concerns raised by stakeholders ‐Track status of solutions to each concern raised by stakeholders
Health and safety
‐Track implementation of HSP ‐Track occurrence of field incidents, accidents, emergencies ‐Track potential exposure by onsite workers and community members
Support sustainable movement ‐Track formal sustainable programs implemented by contractors
© Pacific Gas and Electric Company, 2012

Field Form for Tracking Vehicle Use and Mileage
Date Trip DescriptionMiles Traveled
During Trip
Nmber of
Passangers
During Trip
Prepared by
Week day/Area of activity
Project Name
Client
Project Address
MPG for each truck
Gasoline or diesel
carbon per gallon
(grams)based on
EPA reports
Total CO2 emission
(MT of CO2 Equiv)
during trip
Activity
Project No
Date
Truck
type(Gas/Diesel)
Total CO2 emission this week
© Pacific Gas and Electric Company, 2012

© Pacific Gas and Electric Company, 2012
APPENDIX B: Publicly Available Sustainability Tools

PUBLICLY AVAILABLE SUSTAINABLE REMEDIATION TOOLS Various publicly available and proprietary tools have been developed specifically for the remediation community for evaluating sustainable impacts associated with a remediation project. Two publicly available tools have been developed by the Department of Defense, including: The Sustainable Remediation Tool (SRT), developed by the Air Force Center for
Engineering and the Environment (AFCEE); and
SiteWiseTM, developed by the Army Corps of Engineers, The Navy and Battelle. These two tools are described below. Sustainable Remediation Tool: The SRT is an Excel-based tool designed to enable users to: Plan for the future implementation of remediation technologies at a particular
site;
Compare remediation approaches on the basis of sustainability metrics; and
Provide a means to evaluate optimization of remediation technology systems already in place.
The SRT allows users to evaluate the sustainability impacts associated with various remediation technologies for soil and groundwater. The technologies include: Excavation; Soil vapor extraction; In-situ thermal; Pump and treat; Enhanced bioremediation; Permeable reactive barriers; In-situ chemical oxidation; and Long-term monitoring/monitored natural attenuation.
The impacts associated with the following stressors may be evaluated for each technology listed above: Carbon dioxide emissions;
Nitrogen oxide emissions;
Sulfur oxide emissions;
© Pacific Gas and Electric Company, 2012

Particulate matter (as PM10);
Total energy consumed;
Change in resource service;
Technology cost; and
Safety/accident risk.
The tool is structured into two tiers:
Tier 1, the simplest tier, comprises calculations that are based on rules-of-thumb that are widely used in the environmental remediation industry.
Tier 2 comprises calculations that are more detailed and incorporate site-specific factors.
The SRT is designed to be user friendly with menu-driven work flows and on-screen help topics. The tool is available for download from AFCEE’s sustainable remediation website: http://www.afcee.af.mil/resources/technologytransfer/programsandinitiatives/sustainableremediation/srt SiteWiseTM: SiteWiseTM includes a number of Excel spreadsheets that are designed to evaluate sustainability impacts associated with different remediation projects. The remediation project is broken down in four phases in the tool: RI;
Remedial action construction;
Remedial action operation; and
Long-term monitoring. Six different remedial alternatives may be considered at one time, enabling SiteWiseTM to be employed during the remedy selection process as well. Each phase is further broken down into various activities, including:
Material production;
Transportation – personnel;
Transportation – equipment;
Equipment used – earthwork;
Equipment used – pumps;
© Pacific Gas and Electric Company, 2012

Equipment used – other electric;
Equipment used – other; and
Residual handling. A number of stressors may be evaluated in SiteWiseTM, including: GHG emissions;
Energy use;
Criteria pollutants emissions, including oxides of nitrogen, sulfur oxides and particulate matter;
Water consumption; and
Worker safety. SiteWiseTM can be downloaded from the Navy’s sustainable remediation website: http://www.ert2.org/t2gsrportal/SiteWise.aspx.
© Pacific Gas and Electric Company, 2012

© Pacific Gas and Electric Company, 2012
APPENDIX C: Example Sustainable Best Management Practices

Stressors Potential Sustainable Best Management Practices
Greenhouse Gas Emissions
i) Store documentation relating to site activities (e.g. field notes) electronically, for example in an electronic database.ii) Store sustainability meeting minutes electronically.iii) Submit project-related reports electronically.iv) Promote electronic correspondence where feasible, including correspondence between PG&E personnel and other stakeholders (for example regulatory agencies).v) Streamline the content of reports, where feasible.vi) Switch off equipment, for example computers and printers, when not in use. vii) Encourage the remediation project team to employ sustainable forms of transportation when traveling to the office, e.g. public transportation, carpooling, bicycles and hybrid vehicles.viii) Meet virtually instead of in person, where feasible, e.g. via conference call.ix) Set up a fleet preventative maintenance program to ensure that PG&E owned-vehicles operate as efficiently as possible.
Solid Waste Recycling and Salvaging (Excluding Soil)
i) Use recycled materials where feasible, e.g. recycled paper for printing and recycled notebooks.ii) If a hard copy of a report is requested by a stakeholder, ensure that printing is double-sided.iii) Implement a recycling program for office consumables and office equipment.
Stakeholder Satisfaction
i) Involve stakeholders from the beginning of the project.ii) Establish clear lines of communication with the local community. Prepare a plan for addressing community concerns in a consistent manner. iii) Identify potential conflicts with the local community as soon as possible and resolve these issues.iv) Ensure that all documentation relating to sustainability are recorded adequately.
Occupational Health and Safety
i) Ensure worker health and safety requirements are adhered to.
Efficiency (Based on Budget and Schedule)
i) Prepare a strategic plan, aligning project goals and endpoints. ii) Identify opportunities to streamline project.iii) Track budget frequently.iv) Identify potential issues early and resolve these issues as soon as possible.v) Have a contingency plan in place.
Green Building i) Lease buildings that are LEED and/or Energy Star certified.
Human Health & Safety
Land Use
Project Planning and Office‐Based Tasks
Examples of Sustainable Best Management Practices
Stakeholder Considerations
Efficiency
Substance Release/Production
© Pacific Gas and Electric Company, 2012

Stressors Potential Sustainable Best Management Practices
Greenhouse Gas Emissions
i) Encourage the use of cleaner fuels for on-site equipment and vehicles.ii) Minimize the use of heavy equipment. iii) Minimize the number of mobilizations required for project activities through enhanced planning. iv) Implement a carpooling plan.v) Consider use of Triad methodologies to streamline and minimize investigation tiers and site mobilizations. vi) Minimize the distances traveled by waste generated at the site.
Airborne Nitrogen Oxides and Sulfur Oxidesi) Ensure that emissions remain below air quality standards.
Certain impact reduction strategies recommended to address the GHG stressor are also applicable to the airborne NOx & SOx stressor.
Airborne Particulates
i) Provide recommendations to minimize the generation of dust and particulates (e.g. by covering stockpiles, or spraying vehicle tires and roads).ii) Secure and cover materials in trucks hauling materials.
Certain impact reduction strategies recommended to address the GHG stressor are also applicable to the airborne particulates stressor.
Liquid Waste Productioni) Minimize the bioavailability of contaminants through source and plume controls, where feasible.ii) Ensure that the closest wastewater infrastructure to the site is identified and selected for wastewater treatment.
Impacted Surface Run-Offi) Describe procedures to avoid sedimentation in surface water run-off.ii) Avoid nutrient loading in surface water run-off.
Solid Waste Recycling and Salvaging (Excluding Soil)
i) Use drilling and investigation techniques that minimize the production of solid waste.ii) Identify opportunities to reuse or recycle materials where feasible.
Waste Soil Recycling and Reuse i) Minimize the generation of waste soil, in particular hazardous waste soil.ii) Implement opportunities to reuse or recycle waste soil where feasible.
Energy Usei) Identify opportunities to employ energy generated from non-petroleum sources. ii) Buy green power, where feasible.iii) Buy Renewable Energy Certificates.
Materials
i) Specify minimum reused/recycled content, e.g. in infrastructure.ii) Specify the use of a minimum percentage of local materials to use in the project. iii) Specify the use of a minimum percentage of rapidly renewable materials in the project.iv) Establish project goals for natural resource consumption and conservation.
Biological Resources (Plants/Animals/ Microorganisms)
i) Purchase of biodegradable products, where feasible.ii) Ensure that site activities will not impact sensitive species and habitats. iii) Require that sensitive or threatened species are rescued and relocated.iv) On appropriate sites, encourage ecological land reuse (e.g., constructed wetlands, woodlands, etc.).
Cultural Resources i) Prepare a procedure to protect cultural resources that may be impacted by remediation activities.
Remedial Investigation
Examples of Sustainable Best Management Practices
Resource Depletion/Gain (Recycling)
Substance Release/Production
© Pacific Gas and Electric Company, 2012

Stressors Potential Sustainable Best Management Practices
Remedial Investigation
Examples of Sustainable Best Management Practices
Stakeholder Satisfaction
i) Determine the community profile (i.e. what the local issues, events and who the players are).ii) Prepare a Stakeholder Management Plan for public comment. iii) Solicit community involvement to increase public awareness and acceptance. Communicate public participation requirements set out in different regulatory programs to stakeholders. Ensure that stakeholders are comfortable with the extent and processes for public participation. iv) Establish clear lines of communication with the local community.v) Select activities with minimum impacts to local communities and disadvantaged or vulnerable groups, where feasible.vi) Ensure risk is communicated in a non-technical fashion so that the community understands the issues at hand.vii) Identify potential conflicts with the local community as soon as possible and resolve these.viii) Obtain buy-in and trust from the local community. Ensure community questions, concerns, and needs are addressed quickly and effectively.ix) Identify potential sources of nuisance and employ mitigation measures.
Local Economy Boosti) Use local providers for field operations, where feasible.ii) Purchase of materials extracted and manufactured locally, where feasible.iii) Encourage the use of local hotels when overnight stays are required at the site.
Occupational Health and Safety i) Address worker safety issues via a site-specific Health and Safety Plan.ii) Ensure that activities adhere to all safety requirements and regulations.
Future Land Use i) Prepare disaster preparedness and response plans.
Land Use
Stakeholder Considerations
Human Health & Safety
© Pacific Gas and Electric Company, 2012

Stressors Potential Sustainable Best Management Practices
Greenhouse Gas Emissions
For each remedial alternative:i) Encourage the use of cleaner fuels for on-site equipment and vehicles.ii) Minimize the use of heavy equipment. iii) Minimize the number of mobilizations required for project activities.iv) Minimize the distances traveled by waste generated at the site.v) Identify on-site or nearby sources of backfill material for excavated areas where applicable.vi) Evaluate in-situ and on-site remedial alternatives, where feasible.
Airborne Nitrogen Oxides and Sulfur Oxides
For each remedial alternative:i) Ensure that the selected remedy remains below air quality standards.
Certain impact reduction strategies recommended to address the GHG stressor are also applicable to the airborne NOx & SOx stressor.
Airborne Particulates
For each remedial alternative:i) Provide recommendations to minimize the generation of dust and particulates (e.g. by covering stockpiles, or spraying vehicle tires and roads).
Certain impact reduction strategies recommended to address the GHG stressor are also applicable to the airborne particulates stressor.
Liquid Waste Production
For each remedial alternative:i) Identify how best to minimize the bioavailability of contaminants through source and plume controls.ii) Identify opportunities for managing and treating site impacts sustainably.iii) Ensure that the closest wastewater infrastructure to the site is identified and selected for wastewater treatment.
Impacted Surface Run-OffFor each remedial alternative:i) Describe procedures to avoid sedimentation in surface water run-off.ii) Avoid nutrient loading in surface water run-off.
Solid Waste Recycling and Salvaging (Excluding Soil)
For each remedial alternative:i) Minimize the production of solid waste (including impacted soil).ii) Identify opportunities to reuse or recycle materials, where feasible.
Waste Soil Recycling and Reuse For each remedial alternative:i) Minimize the generation of waste soil, in particular hazardous waste soil.ii) Describe opportunities to reuse or recycle waste soil, where feasible.
Toxic Materialsi) For each remedial alternative, describe opportunities to avoid the use of pollutants, chemicals or soil amendments that can harm human and ecological health.
Feasibility Study
Examples of Sustainable Best Management Practices
Substance Release/Production
© Pacific Gas and Electric Company, 2012

Stressors Potential Sustainable Best Management Practices
Feasibility Study
Examples of Sustainable Best Management Practices
Soil Structure Disruption
For each remedial alternative:i) Ensure that specific areas for different activities such as material mixing or waste sorting are maintained.ii) Require that ground surfaces of work areas be covered with mulch to prevent soil compaction caused by heavy equipment.iii) Require that quick-growth seedlings are planted and geotextile placements used to stabilize soil in staging areas.iv) Minimize the construction of impervious surfaces.v) Use minimally invasive in situ technologies.vi) Minimize demolition and earth-moving activities.vii) Prevent loss of soil by stormwater runoff or wind erosion, e.g. by stockpiling of topsoil for reuse, temporary and permanent seeding, mulching, earth dikes, silt fencing, straw-bale barriers, sediment basins, and mesh sheeting for ground cover.viii) Maximize the use of existing wells and boreholes.ix) Should construction activities be required, create and implement an erosion and sedimentation plan.
Energy Use
For each remedial alternative:i) Identify opportunities to employ energy generated from non-petroleum sources. ii) Buy green power, where feasible.iii) Buy Renewable Energy Certificates.
Materials
For each remedial alternative:i) Specify minimum reused/recycled content, e.g. in infrastructure.ii) Specify the use of a minimum percentage of local materials to use in the project. iii) Specify the use of a minimum percentage of rapidly renewable materials in the project.iv) Establish project goals for natural resource consumption and conservation.
Surface Water and Groundwater Extraction
For each remedial alternative:i) Identify opportunities for reclaiming treated water for beneficial reuse.ii) Promote water quality and healthy aquatic habitats.iii) Maintain or regenerate healthy hydraulic processes.iv) Identify opportunities to reduce demand for freshwater.v) If surface water has been impacted, set provisions to restore water health.vi) Require the use of native vegetation requiring little or no irrigation.
Biological Resources (Plants/Animals/Microorganisms)
For each remedial alternative:i) Require biodegradable products, where feasible.ii) Ensure that site activities do not impact sensitive species and habitats. iii) Require that sensitive or threatened species are rescued and relocated.iv) On appropriate sites, encourage ecological land reuse (e.g., constructed wetlands, woodlands, etc).
Cultural Resources i) For each remedial alternative, prepare a procedure to protect cultural resources that may be impacted by remediation activities.
Physical Disturbances/Disruptions
Resource Depletion/Gain (Recycling)
© Pacific Gas and Electric Company, 2012

Stressors Potential Sustainable Best Management Practices
Feasibility Study
Examples of Sustainable Best Management Practices
Stakeholder Satisfaction
For each remedial alternative:i) Determine the community profile (i.e. what the local issues, events, and who the players are).ii) Prepare a plan for public comment that describes the remedial alternatives presented in the Feasibility Study and the rationale for the preferred alternative. Publish a notice of the plan. Hold a public meeting and prepare a written response to community comments. iii) Solicit community involvement to increase public awareness and acceptance. Communicate public participation requirements set out in different regulatory programs to stakeholders. Ensure that stakeholders are comfortable with the extent and processes for public participation. iv) Establish clear lines of communication with the local community.v) Select a remedial alternative with minimum impacts to local communities, and disadvantaged or vulnerable groups, where feasible.vi) Communicate risk in a non-technical fashion to ensure community understands the issues at hand.vii) Identify potential conflicts with the local community as soon as possible and resolve these.viii) Obtain buy-in and trust from the local community. Write a procedure to ensure that community questions, concerns, and needs are addressed quickly and effectively.ix) Identify potential sources of nuisance and recommend mitigation measures.
Local Economy Boost
For each remedial alternative:i) Use local providers for field operations, where feasible.ii) Encourage the purchase of materials extracted and manufactured locally, where feasible.iii) Encourage the use of local hotels when overnight stays are required at the site.
Occupational Health and Safety i) Address worker safety issues in the Feasibility Study.ii) Ensure that project activities adheres to all safety requirements and regulations.
Future Land Use
i) Select a remedial alternative that will result in a future land use with the maximum economic benefit.
For each remedial alternative:ii) Identify land revitalization opportunities.
Land Use
Stakeholder Considerations
Human Health & Safety
© Pacific Gas and Electric Company, 2012

Stressors Potential Sustainable Best Management Practices
Greenhouse Gas Emissions
i) Perform an assessment of baseline environmental conditions.ii) Use cleaner fuels for on-site equipment and vehicles.iii) Retrofit engines for cleaner engine exhausts, e.g. use diesel oxidation catalysts.iv) Reduce idling (e.g. by using automatic idle-shutdown devices).v) Select vacuum pumps and blowers that accommodate changes in operating requirements as treatment progresses. vi) Design treatment systems with optimum efficiency. Maintain equipment at peak performance.vii) Use variable frequency drive motors to automatically adjust energy use to meet system demand. viii) Minimize the size of above-ground treatment systems and equipment housing. ix) Minimize the use of heavy equipment. x) Minimize the number of site mobilizations.xi) Minimize the distance traveled by waste. xii) Transport raw materials and/or waste by rail instead of trucks.xiii) Perform bench-scale treatability studies prior to full-scale remediation. xiv) Use field kits whenever possible and select the nearest qualified lab for confirmatory samples.xv) Use screening methods for a preliminary assessment of contamination.xvi) Evaluate if a remediation system could be protective with an intermittent energy supply. xvii) Establish decision points that would enable changes in remediation approach if necessary. xviii) Incorporate the Triad decision-making approach to site cleanup.xix) Design remote monitoring features into long treatment systems.xx) Insulate pipes and equipment associated with treatment processes requiring heat.xxi) Encourage carpooling. xxii) Use energy efficient equipment and maintain at peak performance.xxiii) Select suitable sized and typed equipment.xxiv) Optimize use of passive-energy technologies.xxv) Encourage the use of hybrid vehicles.xxvi) Use gravity flow where feasible to reduce number of pumps for water transfer after subsurface extraction. xxvii) Design adaptable systems (e.g., systems that use less energy as the site cleans up). xxviii) Ensure proper inflation and maintenance of tires at all times.
Airborne Nitrogen Oxides and Sulfur
Oxides
i) Use ultra low sulfur diesel, where feasible.
Certain impact reduction strategies recommended to address the GHG stressor are also applicable to the airborne NOx & SOx stressor.
Airborne Particulates
i) Secure and cover materials in open trucks hauling materials (and reuse covers).ii) Revegetate excavated areas as soon as possible.iii) Cover soils with biodegradable tarps and mats rather than spraying with water.iv) Minimize dust export of contaminants.v) Employ rumble gates with a closed-loop gray water washing system or a self contained wheel-washing system. Certain impact reduction strategies recommended to address the GHG stressor are also applicable to the airborne particulates/toxic vapors/gases/water vapor/thermal release stressor.
Remedial Design and Implementation
Examples of Sustainable Best Management Practices
Substance Release/Production
© Pacific Gas and Electric Company, 2012

Stressors Potential Sustainable Best Management Practices
Remedial Design and Implementation
Examples of Sustainable Best Management Practices
Liquid Waste Production
i) Minimize bioavailability of contaminants through source and plume controls.ii) Identify the closest wastewater infrastructure and divert wastewater there.iii) Explore options for reusing operational gray water, capturing rainwater and returning unused water to surface bodies instead of discharging it to a public sewer system.iv) Use high efficiency water fixtures, valves, and piping.
Impacted Surface Run-Off
i) Avoid sedimentation in wastewater streams.ii) Avoid nutrient loading in wastewater streams.iii) Construct a retention pond with a bermed treatment area to store, treat, use or release diverted stormwater. Evaluate the potential for excavated areas to serve as retention basins in final stormwater control plans.iv) Prepare a stormwater management plan. Ensure that the plan includes measures that will prevent or minimize the transfer of sediments with run-off from any portion of the project area (e.g., access road, parking area) to adjacent properties.v) Integrate conservation designs for minimizing run-off generation through open-space preservation methods such as cluster development, reduced pavement widths, shared transportation access, reduced property setbacks, and site fingerprinting during construction.vi) Engineer structures or landscape features that help to capture and infiltrate run-off, such as basins or trenches, porous pavement, disconnected downspouts, and rain gardens or other vegetated treatment systems. vii) Store captured run-off in rain barrels or cisterns, green (vegetated) roofs, and natural depressions such as landscape islands.viii) Construct conveyance systems to route excess run-off through and off the site, such as grassed swales or channels, terraces or check dams, and elimination of curbs and gutters.ix) Design storm water management or cover systems to recharge aquifers and minimize the creation or replacement of impervious surfaces. x) Install silt fences and basins to capture sediment run-off along sloped areas.
Solid Waste Recycling and Salvaging
(Excluding Soil)
i) Minimize the production of solid waste, such as demolition waste.ii) Reuse or recycle materials, where feasible.iii) Provide a solid waste collection and disposal service to ensure work site remains free of workers’ litter and trash.iv) Ensure that a convenient and suitably sized area is designated onsite for recyclable collection and storage.v) Prepare a site management plan that include wastes planning practices that apply to all remediation and support activities.
Waste Soil Recycling and Reuse
i) Use in-situ technologies, where feasible.ii) Minimize the production of impacted soil and drilling waste.iii) Use direct push technology, where feasible.iv) Perform waste soil dewatering prior to hauling off-site if applicable.v) Identify on-site treatment and containment approaches.
© Pacific Gas and Electric Company, 2012

Stressors Potential Sustainable Best Management Practices
Remedial Design and Implementation
Examples of Sustainable Best Management Practices
Energy Use
i) Use energy generated from non-petroleum sources where possible, such as solar or wind energy resources instead of diesel.ii) Use alternative fuels, e.g. biodiesel, where feasible.iii) Buy green power, where feasible.iv) Buy Renewable Energy Certificates.
Certain impact reduction strategies recommended to address the GHG stressor are also applicable to the petroleum (energy) stressor.
Materials
i) Require recycled materials in infrastructure.ii) Require a minimum percentage of local materials. iii) Require a minimum percentage of rapidly renewable materials in the project.iv) Select and use sustainable landscape material.v) Buy materials in bulk, where feasible.vi) Purchase products, packaging materials and disposable equipment with reuse or recycling potential.vii) Salvage uncontaminated objects with potential recycle, resale, donation, or on-site infrastructure value such as steel, concrete, granite and storage containers.viii) Locate treatment equipment in an existing building within existing utilities/infrastructure, where feasible. ix) Reuse existing buildings and infrastructure to reduce waste produced by associated demolition.
Surface Water and
Groundwater Extraction
i) Reclaim treated water for beneficial reuse.ii) Maintain or regenerate healthy hydraulic processes.iii) Value all water on site.iv) Estimate the anticipated demands for potable and non-potable water and substitute potable with non-potable water whenever possible.v) Reclaim uncontaminated, treated groundwater for on-site use, such as dust control, vegetation irrigation or process input. vi) Use dewatering processes that maximize water recycling.vii) Reinject treated groundwater to the subsurface where possible.
Biological Resources (Plants/Animals/Microorganisms)
i) Buy biodegradable products.ii) Establish minimally intrusive roadways.iii) Establish well-designed traffic patterns for onsite activities and plans to reduce the requirements for on-site roadways.iv) Rescue and relocate sensitive or threatened species.
Cultural Resources i) Identify and protect cultural resources potentially present at the site.
Resource Depletion/Gain (Recycling)
© Pacific Gas and Electric Company, 2012

Stressors Potential Sustainable Best Management Practices
Remedial Design and Implementation
Examples of Sustainable Best Management Practices
Stakeholder Satisfaction
i) Promote positive social dynamics.ii) Solicit community involvement to increase public awareness and acceptance.iii) Reduce impacts to affected communities, and disadvantaged or vulnerable groups.iv) Renew or form new partnerships among organizations and individuals with common environmental, economic, and social concerns, including energy dependence.v) Identify optimal methods that stakeholders can use to influence the direction of remediation and revitalization and to maintain an active voice throughout a project.vi) Ensure close coordination of cleanup and reuse planning.vii) Engage community leaders in design meetings to obtain input on configurations and timing of site work.viii) Communicate the site remediation plan, including short-term community impacts and long-term risk reduction, to interested stakeholders.ix) Conduct community meetings to communicate project progress.x) Provide fact sheets relating to the remediation activities at the site and the technologies used. Include information on how the technology works, its advantages and disadvantages, and why the technology was selected. The fact sheets should address site-specific and stakeholder needs.xi) Consider clean-up technologies that are favorable to each of the different stakeholders identified. Provide information on the advantages and disadvantages of technologies and the potential for collateral damage associated with the implementation of technologies to stakeholders. xii) Ensure that the project fits into local landscape.xiii) Integrate aboveground equipment housing with soundproofing material. xiv) Use acoustic barriers. xv) Limit the removal of trees that obstruct construction of the remediation system, and transplant shrubs to other locations.xvi) Limit on-site vehicle speeds.xvii) Reduce the potential for light disturbance to site neighbors. Maximize the use of skylights for direct and indirect natural lighting of work areas.xviii) Avoid or minimize working at night if the task generates noise or other public nuisance. If nighttime work is required, utilize the minimal level of lighting to safely conduct the work.
Local Economy Boost
i) Select local providers for field operations.ii) Purchase products locally.iii) Encourage workers and contractor to consider utilizing local motels, trailer parks, rentals, restaurants, grocery stores, etc. to the maximum extent practical.
Stakeholder Considerations
© Pacific Gas and Electric Company, 2012

Stressors Potential Sustainable Best Management Practices
Remedial Design and Implementation
Examples of Sustainable Best Management Practices
Occupational Health and Safety
i) Ensure that activities adhere to all safety requirements and regulations. ii) Ensure adequate sanitary facilities for workers.iii) Solicit and evaluate each potential contractor’s proposed health and safety plans, practices, and safety record before or during the contractor selection process.iv) Consider each potential contractor and supplier’s social responsibility to its employees (wages, benefits, etc.) before or during the contractor and supplier selection process.v) Provide suitable training for the local workforce.vi) Provide employee rest areas in shaded locations.
Future Land Usei) Use adaptive site-reuse approach incorporating existing structures into site reuse options.ii) Identify and implement land revitalization opportunities.iii) Consider surrounding land use as a factor in the evaluation of the best land reuse of the site.
Land Use
Human Health & Safety
© Pacific Gas and Electric Company, 2012

Stressors Potential Sustainable Best Management Practices
Greenhouse Gas Emissions
i) Use cleaner fuels for on-site equipment and vehicles.ii) Retrofit engines for cleaner engine exhausts.iii) Reduce equipment/vehicle idling. iv) Minimize use of heavy equipment. v) Minimize number of site mobilizations.vi) Perform periodic remedial system evaluations.vii) Conduct full and manufacturer-recommended engine maintenance.viii) Automate mechanical and electrical equipment as much as possible.ix) Encourage fewer, longer days for O&M activities rather than more frequent, shorter days.x) Identify suitable uses for equipment no longer needed.xi) Maximize use of real-time measurement technologies. xii) Have a preference for remote data collection.xiii) Encourage carpooling and/or the use of public transportation. xiv) Use energy-efficient equipment and maintain at peak performance. xv) Select suitably-sized and typed equipment.xvi) Optimize use of passive-energy technologies.xvii) Ensure efficient delivery of energy.xviii) Encourage the use of hybrid vehicles.xix) Perform routine, on-time maintenance, such as oil changes to improve fuel efficiency.xx) Routinely check for and correct leaks in compressed air lines or inefficient use of compressed air.
Airborne Nitrogen Oxides and Sulfur Oxides
i) Increase automation by using equipment such as electronic pressure transducers and thermo-couples with an automatic data-logger (rather than manual readings) to record data at frequent intervals. ii) Reduce monitoring frequency and intensity once the system is optimized.iii) Use field test kits or analyze for only indicator compounds whenever possible.iv) Ensure appropriate maintenance of equipment and vehicles.v) Use ultra low sulfur diesel, where feasible.
Certain impact reduction strategies recommended to address the GHG stressor are also applicable to the airborne NOx and SOx stressor.
Airborne Particulates
i) Install and properly maintain surface seals around all wells and monitoring points. ii) Maintain flow rates of O&M equipment. iii) Ensure that the zone of influence of vapor extraction wells completely cover the treatment area for soil vapor extraction systems (SVE).
Certain impact reduction strategies recommended to address the GHG stressor are also applicable to the airborne particulates stressor.
Operation and Maintenance/Closure
Examples of Sustainable Best Management Practices
Substance Release/Production
© Pacific Gas and Electric Company, 2012

Stressors Potential Sustainable Best Management Practices
Operation and Maintenance/Closure
Examples of Sustainable Best Management Practices
Liquid Waste Production
i) Minimize the bioavailability of contaminants through source and plume controls.ii) Identify the closest wastewater infrastructure and divert wastewater there.iii) Explore options for reusing operational gray water, capturing rainwater and returning unused water to surface bodies instead of discharging it to a public sewer system.iv) Use high-efficiency water fixtures, valves, and piping.
Impacted Surface Run-Off
i) Prepare a stormwater management plan. Ensure that the plan includes measures that will prevent or minimize the transfer of sediments with run-off from any portion of the project area (e.g., access road, parking area) to adjacent properties.ii) Store captured run-off in rain barrels or cisterns, green (vegetated) roofs, and natural depressions such as landscape islands.iii) Construct conveyance systems to route excess run-off through and off-site, such as grassed swales or channels, terraces or check dams.iv) Design storm water management or cover systems to recharge aquifers and minimize the creation or replacement of impervious surfaces. v) Avoid sedimentation in wastewater streams.vi) Avoid nutrient loading in wastewater streams.
Solid Waste Recycling and Salvaging
(Excluding Soil)
i) Minimize the production of waste.ii) Reuse or recycle materials, where feasible.iii) Provide a solid waste collection and disposal service to ensure the site remains free of workers’ litter and trash.iv) Ensure that a convenient and suitably sized area is designated on-site for recyclable collection and storage.v) Prepare a site management plan that include wastes planning practices that apply to all O&M activities.
Waste Soil Recycling and Reuse
i) Minimize the production of impacted soil.ii) Identify opportunities to reuse or recycle soil.
Energy Use
i) Use energy generated from non-petroleum sources, where possible. Explore opportunities to install renewable energy sources at the site, e.g. solar panels on site buildings. ii) Use alternative fuels, e.g. biodiesel, where feasible.iii) Participate in power generation or purchasing partnerships offering electricity from renewable resources.iv) Employ portable units or trailers equipped with photovoltaic panels to generate electricity or direct power. v) Purchase Renewable Energy Certificates.
Resource Depletion/Gain (Recycling)
© Pacific Gas and Electric Company, 2012

Stressors Potential Sustainable Best Management Practices
Operation and Maintenance/Closure
Examples of Sustainable Best Management Practices
Materials
i) Minimize the use of soil, concrete, plastic and other materials. ii) Reuse mobile treatment or monitoring equipment at other sites.iii) Require recycled materials, e.g. for project infrastructure, where feasible.iv) Require minimum percentage of local materials. v) Require minimum percentage of rapidly renewable materials in the project.vi) Select and use sustainable landscape material.vii) Buy materials in bulk, where feasible.viii) Purchase products, packaging materials and disposable equipment with reuse or recycling potential.ix) Salvage uncontaminated objects with potential recycle, resale, donation, or onsite infrastructure value such as steel, concrete, granite and storage containers.x) Reuse existing buildings and infrastructure to reduce waste.
Surface Water and
Extraction
i) Reclaim uncontaminated, treated groundwater for on-site use, such as dust control, vegetation irrigation or process input. ii) Maintain or regenerate healthy hydraulic processes.iii) Reduce demand for freshwater.iv) Use native vegetation requiring little or no irrigation.
Biological Resources (Plants/Animals/Microorganisms)
i) Buy biodegradable products.ii) Establish minimally intrusive roadways.iii) Establish well-designed traffic patterns for on-site activities and plans to reduce the requirements for on-site roadways.iv) Rescue and relocate sensitive or threatened species.v) Identify opportunities for restoring/creating native habitats at the site. vi) Maximize open space at the site to promote biodiversity.
Cultural Resources i) Identify and protect cultural resources potentially present at the site.
Stakeholder Satisfaction
i) Promote positive social dynamics.ii) Solicit community involvement to increase public awareness and acceptance and awareness of long-term activities and restrictions. iii) Reduce impacts to affected communities, and disadvantaged or vulnerable groups.iv) Respond quickly to community questions, concerns, and needs.v) Be available and accessible to the local community.vi) Engage community leaders in design meetings to obtain input on configurations and timing of site work.vii) Communicate site O&M plan including short-term community impacts and long-term risk reduction to stakeholders. viii) If applicable, explore opportunities to obtain LEED certification for buildings remaining at the site following closure.ix) Ensure that the site fits into local landscape.x) Ensure O&M activities do not generate excessive noise beyond the site boundary.xi) Prevent light disturbance beyond the site boundary.xii) Avoid after-hours activities. If such activities are necessary, implement procedures to prevent disturbance to the local community, e.g. noise or lighting disturbance.
Stakeholder Considerations
© Pacific Gas and Electric Company, 2012
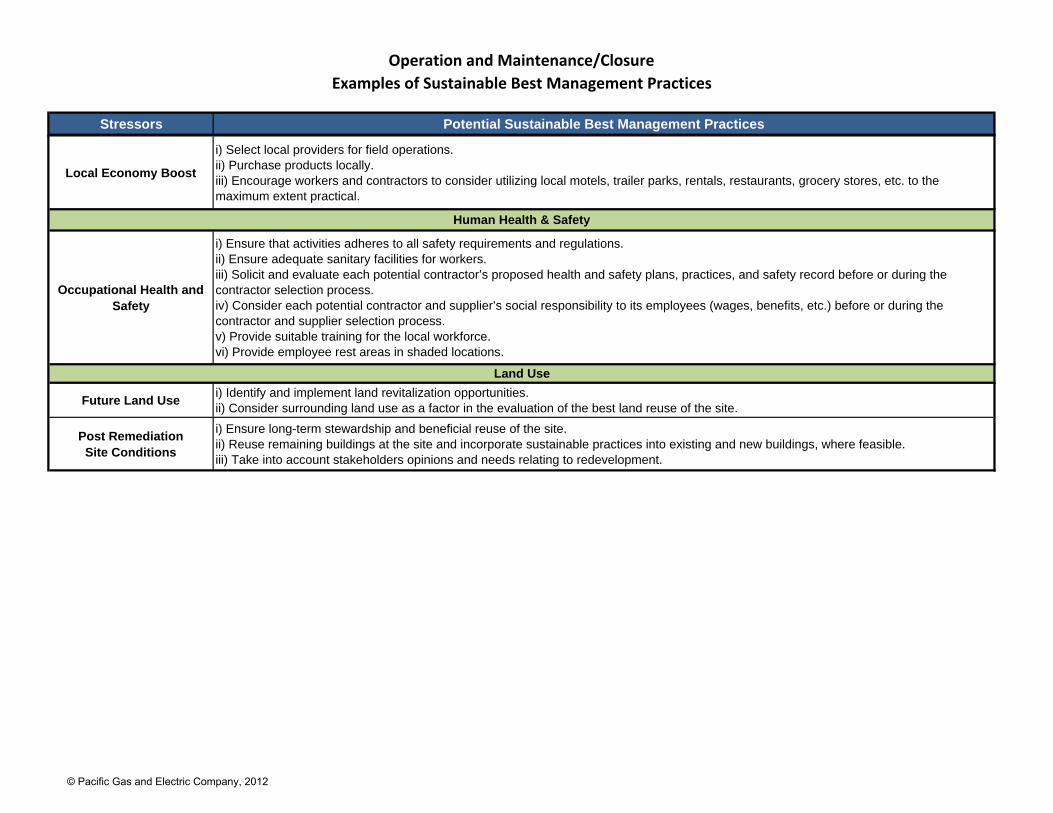
Stressors Potential Sustainable Best Management Practices
Operation and Maintenance/Closure
Examples of Sustainable Best Management Practices
Local Economy Boost
i) Select local providers for field operations. ii) Purchase products locally.iii) Encourage workers and contractors to consider utilizing local motels, trailer parks, rentals, restaurants, grocery stores, etc. to the maximum extent practical.
Occupational Health and Safety
i) Ensure that activities adheres to all safety requirements and regulations. ii) Ensure adequate sanitary facilities for workers.iii) Solicit and evaluate each potential contractor’s proposed health and safety plans, practices, and safety record before or during the contractor selection process.iv) Consider each potential contractor and supplier’s social responsibility to its employees (wages, benefits, etc.) before or during the contractor and supplier selection process.v) Provide suitable training for the local workforce.vi) Provide employee rest areas in shaded locations.
Future Land Usei) Identify and implement land revitalization opportunities.ii) Consider surrounding land use as a factor in the evaluation of the best land reuse of the site.
Post Remediation Site Conditions
i) Ensure long-term stewardship and beneficial reuse of the site.ii) Reuse remaining buildings at the site and incorporate sustainable practices into existing and new buildings, where feasible.iii) Take into account stakeholders opinions and needs relating to redevelopment.
Land Use
Human Health & Safety
© Pacific Gas and Electric Company, 2012

© Pacific Gas and Electric Company, 2012
APPENDIX D: Stressor Fact Sheets

GREENHOUSE GAS EMISSIONS EVALUATION FACT SHEET This fact sheet provides guidance on how to evaluate greenhouse gas (GHG) emissions generated during project activities. The metric for GHG emissions is generally “metric tons/cubic yards COC‐impacted soil” or “metric tons/gallons COC‐impacted groundwater” for project activities, excluding Project Planning/Office‐Based Tasks activities. For Project Planning/Office‐Based Tasks activities, the metric is “metric tons/square foot”. The six GHGs listed in the 1997 Kyoto Protocol to the United Nations Framework Convention on Climate Change will be considered initially, including: Carbon dioxide (CO2);
Methane (CH4)
Nitrous oxide;
Sulfur hexafluoride;
Hydrofluocarbons (HFCs); and
Perfluorocarbons (PFCs).
CO2 is likely to be the primary contributor to GHG emissions at the majority of PG&E remediation sites; therefore this fact sheet only provides guidance to evaluate CO2 emissions. Although CH4 is generated in certain types of landfills, the types of waste produced at PG&E remediation sites are non‐petrucible and are not expected to produce significant quantities of CH4 (also known as landfill gas). The GHG emissions evaluation may include both direct and indirect GHG emissions. Direct GHG emissions are emissions from sources owned or controlled by a particular party (World Business Council for Sustainable Development [WBCSD]/World Resources Institute [WRI], 2004; The Climate registry [TCR], 2008). Indirect emissions are GHG emissions that are a consequence of the party but occur at sources owned or controlled by another party, such as electricity use (WBCSD/WRI, 2004; TCR, 2008). Evaluation approach: The remediation project team identifies sources of direct and indirect emissions and associated emission factors in order to perform the GHG emissions evaluation. An emission factor is a factor allowing GHG emissions to be estimated from a unit of available activity data and absolute GHG emissions (WRI/WBCSD, 2004; TRC, 2008). A description of the GHG emission evaluations for different types of emission sources is described below.
© Pacific Gas and Electric Company, 2012

1. Direct stationary emissions:
Stationary combustion sources are direct, non‐mobile sources of GHGs emissions from fuel combustion. Emissions released from stationary combustion sources may be calculated taking into account the types of fuels used to power combustion and their associated emission factors. The following steps may be followed to calculate CO2 emissions for each stationary combustion source:
Identify the different types of fuels used;
Calculate the total consumption of each fuel;
Select the appropriate emission factor for each fuel;
Calculate each fuel’s CO2 emissions in metric tons, according to equation 1: Equation 1:
Total GHG emissions = emission factor x fuel consumed x 0.001 (metric tons of CO2) (kg CO2/MMBTU) (MMBTU) (metric tons) Where, MMBTU = million British Thermal Units
CO2 emission factors for stationary combustion sources may be provided by The General Reporting Protocol, Version 1.1 (TRC, 2008). The CO2 emissions associated with each source of stationary combustion are then summed to provide the total greenhouse gas emissions from stationary combustion.
2. Indirect emissions: Indirect emissions are associated with the purchase and use of energy produced off‐site, such as electricity. Indirect emissions may be calculated, taking into account off‐site energy (electricity) consumption and its associated emission factor. The following steps may be followed to calculate indirect CO2 emissions for each off‐site electricity source:
Estimate indirect electricity uses;
Select the appropriate emission factor for electricity;
Calculate CO2 emissions in metric tons, according to equation 2:
© Pacific Gas and Electric Company, 2012

Equation 2:
Total GHG emissions = electricity use x electricity emission factor / 2,204.62 (metric tons of CO2) (kWh) (lbs CO2/kWh) (lbs/metric ton) Where, kWh = kilowatts hour lbs = pounds Electricity grid emission factors represent the amount of GHGs emitted per unit of electricity consumed from the electricity transmission and distribution systems and are reported in pound per kilowatt‐hour (lbs/kWh). CO2 emission factors for electricity transmission and distribution may be provided by the eGrid Emissions and Generated Resource Integrated Database (eGRID2010), Version 1.0. The CO2 emissions associated with each source of indirect combustion are then summed to provide the total GHG emissions from indirect combustion. 3. Mobile emissions: Mobile combustion sources are non‐stationary emitters of GHGs. On‐site mobile emissions may be generated by excavators, forklift trucks, and other construction equipment. Off‐site mobile emissions may be generated by passenger vehicles, light‐duty trucks, heavy‐duty trucks, trains or airplanes transporting workers and materials to the site, and waste off‐site. Emissions from mobile sources may either be calculated based on fuel use or distance traveled. To calculate CO2 emissions from each mobile source, the following steps may be followed:
Estimate the total fuel consumption or total distanced traveled;
Select the appropriate emission factors;
Calculate the CO2 emissions in metric tons, according to Equation 3. Equation 3: Total CO2 emissions = fuel consumed x emission factor x 0.001 (metric tons) (gallons) (kg CO2 /gallon) (metric ton/kg)
If fuel consumption is unknown but total mileage may be provided, appropriate fuel efficiencies may be used to calculate fuel consumption, according to equation 4:
© Pacific Gas and Electric Company, 2012

Equation 4:
Total fuel use = mileage / fuel economy (gallons) (miles) (mpg)
Where, mpg = miles per gallon
For travel by train or airplane, CO2 emissions may be calculated directly based on distance traveled, according to equation 5: Equation 5:
Total CO2 emissions = distance traveled x emission factor x 0.001 (metric tons of CO2) (miles) (kg CO2 /miles) (metric ton/kg) Fuel economy data for passenger vehicles and trucks may be provided by the U.S. Department of Energy, Transportation Energy Data Book, Ed. 29, 2010 and by The General Reporting Protocol, Version 1.1 (TRC, 2008). The CO2 emission factors for different fuels for passenger vehicles, trucks and on‐site mobile equipment may be obtained from the General Reporting Protocol, Version 1.1 (TCR, 2008). CO2 emission factors for train and airplane travel may be provided by the United States Environmental Protection Agency (EPA) Climate Leaders’ Commuting, Business Travel and Product Transport Guidance (EPA, 2008). The CO2 emissions associated with each source of mobile combustion are then summed to provide the total greenhouse gas emissions from mobile combustion. 4. Physical or chemical processing emissions:
Physical or chemical processing emissions result from the manufacturing and processing of raw materials, as well as the processing of waste. Physical or chemical processing emission evaluations vary for different types of raw materials and waste. Emission factors and evaluations for the manufacturing and processing for a variety of raw materials can be found in the Air Force Center for Engineering and the Environment’s Sustainable Remediation Tool (http://www.afcee.af.mil/resources/technologytransfer/programsandinitiatives/sustainableremediation/srt/index.asp), and the Army Corps of Engineers, the United States Navy, and Battelle’s SiteWiseTM (http://www.ert2.org/t2gsrportal/SiteWise.aspx). The CO2 emissions associated with each source of processing emissions are then summed to provide the total greenhouse gas emissions from processing emissions.
© Pacific Gas and Electric Company, 2012

5. De minimis emissions De minimis emissions are those from one or more sources or from one or more gases, which when summed, are equal to or less than five percent of the remedial alternative’s total GHG emissions (California Climate Action Registry, 2009). A number of GHGs and sources may be considered de minimis. Emissions associated with these gases or sources are not included in the GHG evaluation. Emissions of CH4, nitrous oxide, sulfur hexafluoride, HFCs and PFCs are considered to represent less than five percent of the typical PG&E’s remediation projects’ overall emissions and are therefore assumed to be de minimis. Fugitive emissions result from intentional or unintentional releases, such as equipment leaks, venting, seals, packing and gaskets. Fugitive emissions are assumed to be de minimis. 6. Total emissions: The total GHG emissions associated with project activities are evaluated by summing the emissions generated from the different sources (subsections 1 through 4 above), according to equation 6: Equation 6:
Total GHG = ∑direct stationary + ∑ indirect + ∑ mobile + ∑ physical or chemical emissions combustion emissions emissions emissions processing emissions All units are in metric tons of CO2. Where, ∑ = sum of With the exception of Project Planning/Office‐Based Tasks activities, once the total GHG emissions are estimated for project activities, the result is divided by the estimated total volume of Contaminants of Concern (COCs)‐impacted soil and groundwater. This step assists in the standardization of stressors and reduces potential biases in calculations stemming from variables such as the size of a given site or sites with a larger number of chemical source areas and greater volume releases. The metric for GHG emissions is metric tons/cubic yards COC‐impacted soil” or “metric tons/gallons COC‐impacted groundwater” For Project Planning/Office‐Based Tasks activities, once the total GHG emissions are estimated, the result is divided by the estimated square footage of the buildings occupied by the remediation project team. This step reduces potential biases in calculations stemming from offices of different sizes. The metric for GHG emissions is “metric tons/square foot”.
© Pacific Gas and Electric Company, 2012

References:
1. Air Force Center for Engineering and the Environment Sustainable Remediation Tool, http://www.afcee.af.mil/resources/technologytransfer/programsandinitiatives/sustainableremediation/srt/index.asp
2. Army Corps of Engineers, the United States Navy, and Battelle’s SiteWiseTM,
http://www.ert2.org/t2gsrportal/SiteWise.aspx 3. California Climate Action Registry, 2009. General Reporting Protocol, Version 3, January. 4. eGrid Emissions and Generated Resource Integrated Database, Version 1.1.
http://www.epa.gov/cleanenergy/energy‐resources/egrid/index.html 5. The Climate Registry, 2008. General Reporting Protocol, Version 1.1, May. 6. United States Department of Energy, 2010. Transportation Energy Data Book, Edition
29, July. 7. United States Environmental Protection Agency Climate Leaders, 2008. Commuting,
Business Travel and Product Transport Guidance, May. 8. World Business Council for Sustainable Development/World Resources Institute, 2004.
The Greenhouse Gas Protocol, a Corporate Accounting and Reporting Standard, Revised Edition, March.
© Pacific Gas and Electric Company, 2012

AIRBORNE NITROGEN OXIDES AND SULFUR OXIDES AIRBORNE PARTICULATES EVALUATION FACT SHEET
This fact sheet provides guidance on how to evaluate airborne nitrogen oxides (NOx) and sulfur oxides (SOx) generated during project activities. These gases form quickly from vehicle emissions, off‐road equipment and power plants (which produce energy required for office‐ and field‐based tasks relating to PG&E projects). The approach provided in this fact sheet may also be applied to evaluate airborne particulates. Particulate matter is a complex mixture of extremely small particles and liquid droplets emitted directly from construction sites, unpaved roads, fields, smokestacks or fires, or indirectly through reactions in the atmosphere between chemicals such as sulfur dioxides and nitrogen oxides. The metric for airborne NOx and SOx and for airborne particulates is micrograms per cubic meter (µg/m3). Evaluation approach: The remediation project team identifies all tasks that release NOx and SOx during project activities. The team determines the concentrations of NOx and SOx released for different project activities in micrograms per cubic meter (µg/m3), for example by direct measurement, or by obtaining the information from equipment or vehicle manufacturers. The concentrations of NOx and SOx for the various project activities are then compared to the NOx and SOx concentrations specified in Table II of the Guidance.
© Pacific Gas and Electric Company, 2012

LIQUID WASTE PRODUCTION EVALUATION FACT SHEET This fact sheet provides guidance on how to evaluate the quantity of liquid waste generated during project activities. Liquid waste may be produced as a result of the treatment of impacted media (soil, groundwater and/or sediments), or through decontamination processes. The metric for liquid waste production is percentage decrease in liquid waste production. Evaluation approach: The following steps are followed to evaluate the quantity of liquid waste produced during different project activities: Identify each task producing liquid waste;
Identify the quantity of liquid waste which would be produced in the absence of BMPs for each task;
Identify the quantity of liquid waste which will be produced following the implementation of the BMPs for each task;
Evaluate the percentage reduction in liquid waste production as a result of BMP implementation, according to equation 1.
Equation 1:
% reduction ∑ liquid waste ∑ liquid waste ∑ liquid waste
in liquid waste = ( produced for each ‐ produced for each ) / produced for each x 100 production task (no BMPs) task (with BMPs) task (no BMPs)
(gallons) (gallons) (gallons) Where, ∑ = sum of % = percentage
© Pacific Gas and Electric Company, 2012

IMPACTED SURFACE RUN‐OFF EVALUATION FACT SHEET This fact sheet provides guidance on how to evaluate the quantity of impacted surface run‐off produced during project activities. Surface run‐off is the flow of water that occurs when soil is infiltrated to full capacity and excess water flows overland, or where the slope of the ground surface causes preferential flow along the ground surface. Surface water may become impacted with contaminants and may therefore cause a potential impact to human health and the environment. The metric for impacted surface run‐off is percentage increase in impacted surface run‐off. Evaluation approach: The following steps are followed to evaluate the quantity of impacted surface run‐off produced during different project activities: Identify each task generating impacted surface run‐off;
Identify the quantity of impacted surface run‐off produced for each task;
Sum the quantity of impacted surface run‐off produced by each task to estimate the total quantity of impacted surface run‐off produced during project activities, according to equation 1:
Equation 1:
Total impacted run‐off production = ∑ impacted run‐off generated for each task (gallons) (gallons) Where, ∑ = sum of Once total impacted run‐off generation is evaluated for project activities, the result is compared to the volume of run‐off that would take place in the absence of the remediation project. The volume of run‐off that that would take place in the absence of the remediation project can be evaluated following the approach described above. The percentage increase in impacted surface run‐off is then evaluated, according to equation 2: Equation 2:
% increase in impacted impacted run‐off impacted run‐off in absence run‐off production = generated during activities / of remediation project x 100 (gallons) (gallons) Where, % = percentage
© Pacific Gas and Electric Company, 2012

SOLID WASTE (AND WASTE SOIL) RECYCLING OR SALVAGING/REUSE EVALUATION FACT SHEET
This fact sheet provides guidance on how to evaluate the quantity of solid waste generated during project activities that can be recycled or salvaged. Solid waste includes construction debris and protective equipment. Solid waste is often treated and disposed off‐site at a landfill instead of being recycled or salvaged. The evaluation approach for waste soil recycling or reuse is similar to the evaluation approach described below for solid waste recycling or salvaging. Projects may generate hazardous and non‐hazardous waste soil requiring off‐site treatment or disposal. The metric for solid waste (excluding waste soil) recycling or salvaging is percentage of solid waste recycled or salvaged. The metric for waste soil recycling or reuse is percentage of waste soil recycled or reused. Evaluation approach: The following steps are followed to evaluate the quantity of solid waste generated during project activities: Identify each task generating solid waste;
Identify the quantity of solid waste generated as part of each task that can be recycled or salvaged;
Identify the quantity of solid waste that will be recycled or salvaged for each waste‐generating task;
Evaluate the overall percentage of solid waste that will be recycled or reused for project activities, according to equation 1.
Equation 1:
% Solid waste ∑ solid waste generated ∑ solid waste generated that will be recycled = for each task that will / for each task that can x 100 or salvaged be recycled or salvaged be recycled or salvaged (tons) (tons) Where, % = percentage ∑ = sum of
© Pacific Gas and Electric Company, 2012

USE OF TOXIC MATERIALS FACT SHEET This fact sheet provides guidance on how to evaluate toxic materials that may be utilized during project activities. Toxic materials may be hazardous to human health and/or the environment due to carcinogenic or mutagenic effects. This stressor is only applicable to FS activities. The toxic material stressor does not have an associated metric. Evaluation approach: The remediation project team determines whether toxic materials are required during project activities. If so, the team records the type and quantity of toxic materials required.
SOIL STRUCTURE DISRUPTION EVALUATION FACT SHEET This fact sheet provides guidance on how to evaluate the volume of soil whose structure may be impacted by tasks taking place during different project activities. Soil structure is determined by how individual soil granules aggregate and the arrangement of soil pores between them. Soil structure has a major influence on water and air movement in soil, biological processes, root growth and seedling emergence. Disturbance to soil structure may impact each of these processes. The soil structure disruption stressor is only applicable to FS activities. The metric for soil structure disruption is cubic yards. Evaluation approach: The following steps are followed to evaluate the volume of soil structure disrupted for each remedial alternative during the FS: Identify each task with a potential to cause soil structure disturbance;
Identify the volume of soil that will be disrupted as part of each task;
Sum the volume of soil that will be disrupted as part of each task to estimate the total volume of soil that will be disrupted during the implementation of each remedial alternative, according to equation 1:
Equation 1:
Total volume of disrupted soil = ∑ volume of disrupted soil for each task (cubic yard) (cubic yard) Where, ∑ = sum of
© Pacific Gas and Electric Company, 2012

ENERGY USE EVALUATION FACT SHEET This fact sheet provides guidance on how to evaluate the percentage of non‐renewable and renewable energy consumed during project activities that originates from a renewable source. Non‐renewable energy cannot be produced, grown, generated, or used on a scale which can sustain its consumption rate, and includes the energy generated by fossil fuels (such as coal, petroleum and natural gas) and nuclear power. Renewable energy comes from sources that are not depleted by use, such as energy from the sun, wind, geothermal, and wave and tidal systems. The metric for renewable energy is percentage of energy generated by renewable sources. Evaluation approach: The following steps are followed to evaluate percentage of energy consumed that originates from a renewable source during project activities: Identify each task requiring energy;
Identify the total quantity of energy required as part of each task;
Identify the quantity of renewable energy consumed for each task;
Evaluate the percentage of renewable energy consumed during different project activities, according to equation 1.
Equation 1:
% renewable ∑ renewable energy ∑ total energy energy = consumed for each task / required for each task x 100 (KWh) (KWh) Where, % = percentage ∑ = sum of KWh = kilowatt hours
© Pacific Gas and Electric Company, 2012

MATERIALS EVALUATION FACT SHEET This fact sheet provides guidance on how to evaluate the quantity of recycled or reused material that will be utilized during project activities, for example during the construction of temporary and/or permanent infrastructure associated with a project. It is recommended that the team reduce the use of virgin materials where feasible, and instead identify opportunities to incorporate reused or recycled materials into the project. The metric for materials is percentage of materials that are recycled/reused. Evaluation approach: The following steps are followed to evaluate the quantity of recycled or reused materials utilized during project activities: Identify each task requiring materials (e.g. housing for equipment, piping, etc.);
Identify the quantity of materials required for each task;
Identify the quantity of recycled or reused materials utilized for each task;
Evaluate the percentage of recycled or reused materials utilized during different project activities, according to equation 1:
Equation 1:
% recycled or ∑ recycled or reused materials ∑ materials reused materials = utilized for each task / required for each task x 100 (tons) (tons) Where, ∑ = sum of % = percentage
© Pacific Gas and Electric Company, 2012

SURFACE WATER AND GROUNDWATER EXTRACTION EVALUATION FACT SHEET
This fact sheet provides guidance on how to evaluate the volume of surface water and/or groundwater that will be extracted as part of activities taking place during project activities. The metric for surface water and groundwater extraction is remediation system optimization.
Evaluation approach:
The remediation project team determines whether the water treatment system(s) in place to treat COCs is optimized to reduce non‐impacted water extraction. Optimization of extraction rates can be achieved thorough accurate well placement and selecting an appropriate number of extraction wells. A widely used tool for optimization of groundwater remediation systems is the use of groundwater flow and solute transport modeling. Use of groundwater models, once calibrated, is encouraged to help define extraction well capture zones, injection well zones of influence, and the spatial and temporal distribution of injection and extraction activities so that the removal of groundwater is minimized and the protection of uncontaminated groundwater within the aquifer system is maximized. Renewable energy may also be employed to operate groundwater extraction systems.1 The team also implements measures for reusing extracted water, where feasible. Treated groundwater can be re‐injected into the aquifer or beneficially reused at the site. Beneficial reuses include irrigation, dust control or a substitute for potable water in plant operations, such as for process cooling. The remediation project team records the details of the water treatment optimization system, as well as the measures taken to reuse extracted and treated water.
1 Additional best management practices for the optimization of groundwater extraction are provided in the US EPA Office of Solid Waste and Emergency Response’s Green Remediation Best Management Practices for Pump and treat technologies, published in December 2009 (http://www.clu‐in.org/greenremediation/).
© Pacific Gas and Electric Company, 2012

BIOLOGICAL RESOURCES EVALUATION FACT SHEET This fact sheet provides guidance on how to evaluate the disturbance to biological resources that might be caused by tasks taking place during project activities. Biological resources form the living components of an ecosystem, and include sensitive animal and plant species. The metric for biological resources is sensitive species. Evaluation approach:
The following steps may be followed to evaluate the disturbance to biological resources during different project activities: Identify each sensitive animal and plant species that has a potential to be disturbed;
Identify and implement mitigation measures to prevent disturbance to sensitive species. The objective is that mitigation measures be implemented for each sensitive species that might be affected by project activities;
Following the implementation of mitigation measures, sum the number of sensitive species that have a potential for being disturbed and for which mitigation measures have not been provided during different project activities, according to equation 1:
Equation 1:
Total number of sensitive species disturbed for = ∑ sensitive species for which mitigation which mitigation measures have not been provided measures have not been provided
Where, ∑ = sum of
© Pacific Gas and Electric Company, 2012

CULTURAL RESOURCES EVALUATION FACT SHEET This fact sheet provides guidance on how to evaluate the potential disturbance to cultural resources caused by project activities. This stressor considers traditional, archaeological, and historic features of value to stakeholders and with the potential to be impacted by the project. The metric for cultural resources is cultural resources. Evaluation approach: The following steps are followed to evaluate the disturbance to cultural resources during different project activities: Identify each cultural resource that will be disturbed as a result of tasks required by
project activities;
Sum each cultural resource to estimate the total number of disturbed cultural resources that may be impacted by project activities, according to equation 1:
Equation 1:
Total number of disturbed cultural resources = ∑ disturbed cultural resources Where, ∑ = sum of
© Pacific Gas and Electric Company, 2012

STAKEHOLDER SATISFACTION FACT SHEET This fact sheet provides guidance on how to evaluate stakeholder satisfaction relating to tasks taking place during different project activities. Stakeholder satisfaction considers the extent to which any issues of importance to a person, group or organization affected by site activities are considered within the project. A key component of stakeholder satisfaction is the number of complaints relating to project activities and the extent of stakeholder involvement throughout the project. The metric for stakeholder satisfaction is number of unresolved complaints. Evaluation approach: The remediation project team first identifies each project stakeholder, including regulatory agencies, the local community and anyone else with an interest in the project. The team then records:
The number of comments/complaints received from different project stakeholders during different project activities. Information relating to the person(s) making the complaint and the cause(s) of the complaint must be provided for each record; and
The actions completed to resolve the problem leading to the complaint. Resolved complaint will be closed out.
The remediation project team sums the unresolved complaints remaining at the end of the various project activities to determine the total number of unresolved complaints for these activities.
© Pacific Gas and Electric Company, 2012

LOCAL ECONOMY BOOST EVALUATION FACT SHEET
This fact sheet provides guidance on how to evaluate the local economy boost that results from tasks taking place during project activities. Local economy boost focuses on enhancing the revenue to the local community as a result of the project, for example through the purchase of materials extracted, manufactured and sold locally; or through the utilization of local services, such as restaurant and lodging facilities. The metric for local economy boost is percentage of project expenditure providing local economy boost. Evaluation approach: The remediation project team first defines the boundary of the local community by considering the proximity of each project location to available resources. The remediation project team then identifies the beneficial contributions to the local community during project activities, which may include:
1. Number of jobs created and the estimated salary for each job;
2. Resources, including raw materials and equipment extracted, manufactured and/or purchased locally and associated monetary value of each resource;
3. Number of nights spent at local hotels and the associated nightly cost for the hotel stay;
4. Number of meals bought at local restaurants and the associated cost of these meals; and
5. Additional source of expenditure providing revenue to the local community.
The monetary value generated for each local economy expenditure is then summed to provide the total local economy expenditure for project activities, according to equation 1: Equation 1:
Total local economy expenditure = ∑ local economy expenditures Where, ∑ = sum of Next, the remediation project team evaluates total project activity expenditures. Finally, the remediation project team evaluates the percentage of total project expenditure that contributes to boosting the local economy, according to equation 2: Equation 2:
% project expenditure = local economy / total expenditure x 100 boosting local economy expenditure for project activities (dollars) (dollars) Where, % = percentage
© Pacific Gas and Electric Company, 2012

OCCUPATIONAL HEALTH AND SAFETY EVALUATION FACT SHEET This fact sheet provides guidance on how to evaluate occupational health and safety associated with tasks performed during project activities. The metric for occupational health and safety is accidents requiring treatment beyond first aid. Evaluation approach: The remediation project team reports each health and safety incident that required attention beyond first aid to PG&E management.
EFFICIENCY FACT SHEET This fact sheet provides guidance on how to evaluate the efficiency of a remediation project. Efficiency relates to how the budget and schedule requirements of the project are met throughout the project, relative to estimates provided in the Strategic Plan for the project. This stressor is only applicable to the Project Planning and Office‐Based Tasks activities. However, efficiency should be considered throughout the project life cycle. The metric for efficiency is dollars. Evaluation approach: The remediation project team tracks budget and schedule as the project progresses. At the end of the different project activities and following project completion, the team compares the actual expended budget and the schedule of the project with the anticipated budget and schedule provided in the strategic plan. The goal of the remediation project team is to meet or supersede budget and schedule goals defined in the Strategic Plan.
FUTURE LAND USE This fact sheet provides guidance on how to evaluate the future land use of a remediation project. This stressor considers the anticipated future land use of the site following project completion, for example unrestricted/residential or commercial land use. The stressor also considers whether institutional controls are required following project activities. The metric for future land use is land use. Evaluation approach: Throughout the project, the remediation project team seeks to obtain the least restrictive land use for the site following remediation. Actual land use to which the site is cleaned up, including related institutional controls and land use covenants is recorded.
© Pacific Gas and Electric Company, 2012

GREEN BUILDING This fact sheet provides guidance on how to evaluate whether green buildings are occupied by the remediation project team. A green building is a structure that is environmentally responsible and resource‐efficient. Examples of green buildings include buildings that are certified to the U.S. Green Building Council LEED scheme and those with Energy Star certification. This stressor is only applicable to Project Planning and Office‐Based Tasks activities. The green building stressor does not have a metric. Evaluation approach: The remediation project team determines whether buildings occupied by team members are certified to the LEED, Energy Star or to other green building certifications.
POST‐REMEDIATION SITE CONDITIONS This fact sheet provides guidance on how to evaluate the benefit of post‐remediation site conditions for a remediation project. Post‐remediation site conditions reflect those that provide a benefit the local community. This stressor is only applicable to O&M/Closure activities. The metric for post remediation site conditions is beneficial use to the local community. Evaluation approach: The remediation project team identifies and implements opportunities to increase the local community’s beneficial use of the site.
© Pacific Gas and Electric Company, 2012

© Pacific Gas and Electric Company, 2012
APPENDIX E: PG&E Remediation Projects Cumulative Sustainability Benefits Through March 30, 2012

Project Number Project Phase StatusGHG Reductions to Date (Metric tons of
CO2 equivalent)
Savings from use of Renewable Energy
(kWh)
Offsite Waste Reduction (Tons
Recycled)
Reductions in Liquid IDW (Gallons)
Reductions in Soil IDW (Tons)
Local Economy Boost ($)
Stakeholder Satisfaction (%)
1 Pilot Testing 0.1 NA NA NA NA $2,075.00 NA
2 Remedial Investigation NA NA NA NA NA NA NA
3 Remedial Investigation NA NA NA NA NA NA NA
Cumulative Sustainability BenefitsPG&E Environmental Remediation Program
Cumulative Sustainability Benefits- Through March 30, 2012
4 Groundwater Monitoring 0.54 NA NA 639.5 NA $3,742.17 NA
5 Groundwater Monitoring 16.0 NA 1.39 69.5 2,250 $11,770.04 100%
6 Remedial Investigation 0.47 NA NA NA NA NA NA
7 Pilot Testing 0.3 NA 4.5 NA NA $65,972.41 NA
8 Remedial Investigation 6.0 NA NA NA NA $143,669.68 NA
9 Remedial Investigation 2.0 NA NA NA NA $3,670.00 NA
10 Design Investigation 1.5 NA NA NA 35 $34,505.67 100%
11 Remedial Investigation 2.4 NA NA NA NA $14,153.78 NA
12Remedial Action
Workplan45.5 NA NA NA NA NA 100%
13Remedial Investigation,
Monitoring2.7 NA NA NA NA $21,662.50 100%
14Operation & Maintenance
17.6 NA 55.5 450 3.85 $136,366.57 100%
15Remedial Design and
Implementation2.0 NA NA NA NA $34,444.53 NA
16 Remediation In Progress In Progress In Progress In Progress In Progress In Progress In Progress
17 Remedial Investigation 0.4 NA NA NA NA NA NA
18Remedial Investigation,
Remedial Design/Implementation
NA NA 4666 30 5016 $4,980.00 NA
19 Remediation 92.0 NA NA NA 225 $620,000.00 NA
20 Remediation 2,789 NA 6,965 304,687 NA $2,770,488.00 100%
21Remedial Investigation,
0 33 NA NA NA NA $29 661 02 NA21Pilot Testing
0.33 NA NA NA NA $29,661.02 NA
22Phase I and Phase II
ESAs41.2 NA NA NA NA $38,293.29 100%
23Remedial Design and
Implementation0.1 NA NA NA NA 482.8 NA
24 Remediation 12.4 468.0 460.0 NA 14,819 $374,099.40 NA
25Post-remediation
Monitoring0.3 NA NA 291.80 NA $522.17 NA
26Operation & Maintenance
1.8 NA 255 NA NA $45,795.00 100%
27 Remediation 5.0 NA NA 18 NA $26,789.00 90%
28Groundwater
Monitoring, Feasibility Study
16.3 NA 1.11 378 NA $7,739.83 NA
29Remedial Design and
Implementation12.6 NA 41 NA NA $567,829.73 NA
30 Remedial Investigation 5.3 NA NA NA NA $28,591.00 NA
31Remedial Investigation,
Monitoring1.1 NA NA NA NA $1,660.00 NA
32 Remedial Investigation 0.8 NA NA NA NA $5,913.00 NA
33 Groundwater Monitoring 21.0 NA NA 240 55 $5,800.00 80%
34 Groundwater Monitoring 38.1 NA NA 46,080 NA $46,106.71 NA
35 Remedial Investigation 2.0 NA NA NA NA $5,250.00 NA
36Remedial Design and
Implementation1.41 NA NA NA NA $24,170.00 NA
37 Project Planning 0.037 NA NA NA NA NA NA
38Remedial Investigation, Groundwater Monitoring
NA NA NA 1,562 NA $651,695.24 100%
39 Project Planning NA NA NA NA NA NA NA
40Removal Action,
Groundwater MonitoringNA NA 42.2 978 19.9 NA 100%
41 Remedial Investigation NA NA 2.7 NA NA $155,625.16 100%

Project Number Project Phase StatusGHG Reductions to Date (Metric tons of
CO2 equivalent)
Savings from use of Renewable Energy
(kWh)
Offsite Waste Reduction (Tons
Recycled)
Reductions in Liquid IDW (Gallons)
Reductions in Soil IDW (Tons)
Local Economy Boost ($)
Stakeholder Satisfaction (%)
Cumulative Sustainability BenefitsPG&E Environmental Remediation Program
Cumulative Sustainability Benefits- Through March 30, 2012
42Operation & Maintenance
0.027 NA NA NA NA NA 100%
43 Pilot Testing 0.61 NA 0.5 NA NA $273,081.00 NA
44 Remedial Investigation 2.0 NA NA NA NA $22,117.08 NA
45 Site Closed 4.9 NA 1,093 2 11 $3,200.00 95%
46 Remedial Investigation 99.7 NA 5.4 349,652 1,716.1 $840,376.00 100%
47 Remediation 1.6 NA 328.4 33 NA $407,400.00 NA
48Post-remediation
Monitoring0.77 NA NA 744.7 NA $3,885.51 NA
49 Remedial Investigation 0.43 NA NA NA NA $3,337.00 NA
50 Remediation 0.4 35,000 NA NA NA $8,599.66 NA
R d51
Remedy Implementation and
O&M1,300 NA NA NA 2,700 $11,059.00 NA
52 NA NA NA NA NA NA NA NA
53 Remediation 133.3 NA 218 8 0.07 $235,530.78 100%
54 Remedial Investigation 9.7 NA NA 5 2.8 $61,415.37 100%
55 Remedial Investigation 3.3 NA NA NA NA $38,191.00 100%
56Remediation &
Groundwater Monitoring2.2 NA 23.6 5,336 NA $27,663.56 100%
57 Groundwater Monitoring 0.38 NA NA NA 1.1 $21,098.94 100%
58 Remediation 147.9 NA NA NA NA $2,540,093.02 100%
59 Project Planning NA NA NA NA NA NA NA
60 Groundwater Monitoring 13.7 NA 252 NA 58.8 $43,747.15 100%
61 Remediation NA NA NA NA NA NA NA
62Remedial Design and
Implementation1,185 NA 4.5 NA 8,225 $436,147.09 98%
63Operation & M i
57.9 NA 1.0 1,740,380 NA $2,951.33 100%63Maintenance
57.9 NA 1.0 1,740,380 NA $2,951.33 100%
64 Investigation NA NA NA NA NA $11,956.52 NA
65 Remediation 0.3 NA NA NA NA $19,868.00 NA
66O&M and Remediation
Design & Implementation
4.0 NA 11.4 4,495,340 NA $533,100.00 NA
67 Remedial Investigation 48.4 NA 799 NA NA $542,384.11 NA
68 Remedial Investigation 1.1 NA NA 1786.1 12.9 $18,432.00 NA
69 Remedial Investigation 0.02 NA NA NA NA NA NA
70Remedial Design and
I l t ti7.5 NA NA NA NA $57,929.68 100%
Implementation$ ,
71 Remediation 131.8 NA 714 80,000 1,500 $1,204,572.00 100%
72Post-remediation
Monitoring0.3 NA NA 113 NA $198.50 100%
73 Project Planning 1.4 NA 0.45 NA NA $430.00 100%
6,297 35,468 15,945 7,028,824 36,652 $13,252,288 98.7%
In Progress: Estimation of benefits are in progressStakeholder Satisfaction total defined as mean of project‐specific satisfaction ratingsNA: Not Applicable, i.e.. BMPS have not yet been identified or have not yet been implemented