programmatic 2015 - hoppex
TRANSCRIPT

1
Programmatic 2015 The Path Forward
May 2015
Luke Stillman [email protected]
Vincent Letang [email protected]

2
Table of Contents
New Challenges Streamlining Ad Tech Streamlining Data Programmatic Television
Privacy Viewability
CPMs by Country CPMs by Market Development CPMs by Vertical
About this Document The MAGNA GLOBAL Programmatic Intelligence series is published twice a year. The spring publication covers the most important trends & drivers of the global programmatic market and how MAGNA expects those themes to play out. The fall publication gives an update on the global size and growth of the programmatic market by country and media format.

3
Key Findings
Appe
ndix
K
ey F
indi
ngs
N
ew D
river
s Pr
ogra
mm
atic
CPM
s R
etur
ning
Tre
nds
New programmatic drivers in 2015 focus on process simplification:
1) The programmatic ecosystem will be streamlined as fewer, but more comprehensive, ad tech partners are used. The largest consolidated ad tech majors will thrive in this environment, as will small start-ups that handle new ancillary service offerings. Mid-sized specialized firms will struggle.
2) The most valuable data will become that which can be used to both identify and target consumers. The broadest pervasive login data (Social, Email, dominant services) at one end and the narrowest customized data sets (CRM, EDW, website visits, pixel conversion data) at the other will thrive. Data brokers and other aggregators that extrapolate narrow sets will struggle.
3) Services that support the greatest number of formats and devices will be prioritized. As programmatic campaigns operate across multiple devices, digital formats and ultimately all media formats, companies that assist in unifying these operations will thrive. Single-device/format offerings will struggle.
Early Evolution of Programmatic TV:
MAGNA expects that Audience Buying and Household Addressable programmatic television in combination will represent 4% of TV budgets this year, increasing to 17% of TV budgets by 2019.
Programmatic inventory is increasing in quality:
Programmatic CPMs increased in 2014 as average inventory quality increases. This trend will continue as publishers grow more comfortable offering inventory programmatically. As an increasing volume of brand advertising is done programmatically, this CPM change is expected to accelerate.
Cadr
eon’
s Pe
rspe
ctiv
e
0%
5%
10%
15%
20%
2015 2016 2017 2018 2019
US Programmatic Television Penetration
Audience Buying Household Addressable
23%
8%
-2%
-10%
0%
10%
20%
30%
Desktop Banner Mobile Banner Video
CPM Change by Format 2014

4
Programmatic Evolution Programmatic trading has come a long way in a very short period of time, even relative to the history of digital media. Brands and publishers have moved from testing and experimentation to mature programmatic strategies in under five years.
While many of the important programmatic trends of the past few years continue to be relevant in 2015, participants in the programmatic ecosystem have an additional challenge to tackle this year: streamlining the exponentially more complex programmatic process.
CONSOLIDATE & STREAMLINE
EXPERIMENT
FEASIBILITY STUDIES
DEVELOP OPERATIONS
2012
2013
2014
2015 • Streamlining Services • Comprehensive Targeting • Format / Device Bridging
• Private Transactions • Measurement & Attribution • Fraud & Viewability
• Tech Platform Trials • Programmatic
Premium • Programmatic Beyond
DR
• Bundling vs. Targeting • Dynamic Insertion vs. Simultaneous Consumption • Audience vs. Outcomes • Creativity vs. Production Efficiency
Key
Find
ings
N
ew D
rive
rs
Prog
ram
mat
ic C
PMs
Ret
urni
ng T
rend
s Ap
pend
ix
Cadr
eon’
s Pe
rspe
ctiv
e
5
Programmatic Expectations
Brands Trading Desks
DSPs Exchanges Publishers
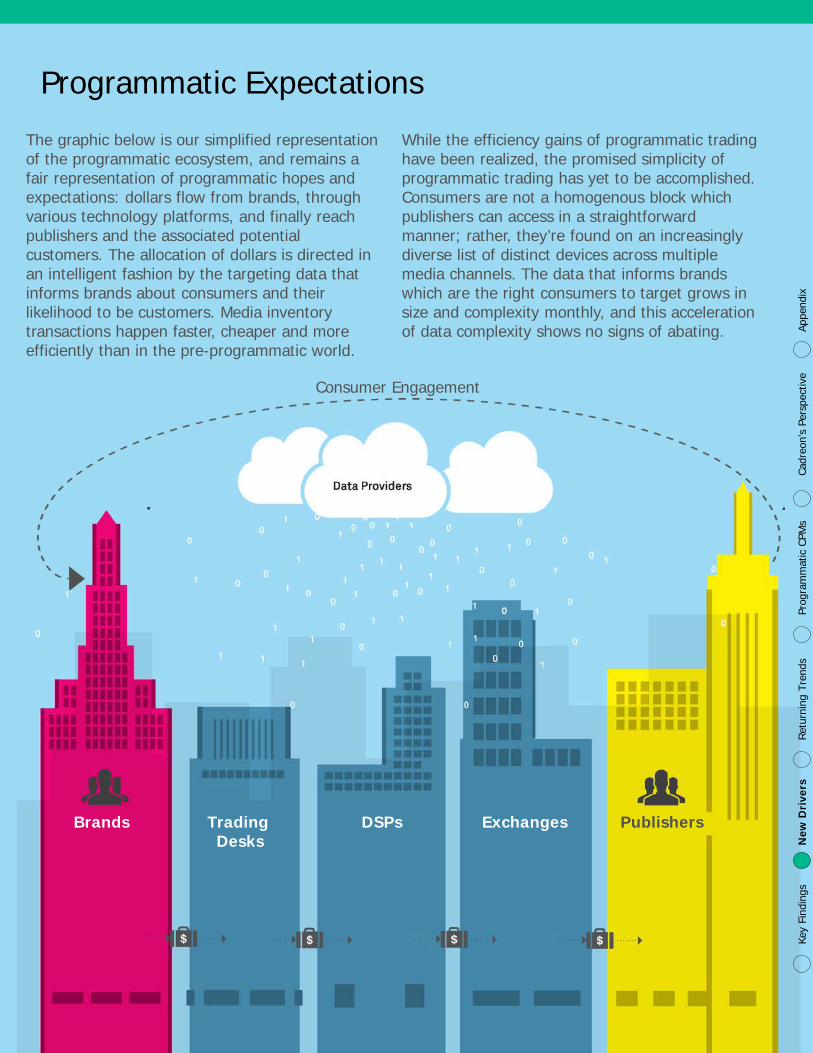
The graphic below is our simplified representation of the programmatic ecosystem, and remains a fair representation of programmatic hopes and expectations: dollars flow from brands, through various technology platforms, and finally reach publishers and the associated potential customers. The allocation of dollars is directed in an intelligent fashion by the targeting data that informs brands about consumers and their likelihood to be customers. Media inventory transactions happen faster, cheaper and more efficiently than in the pre-programmatic world.
While the efficiency gains of programmatic trading have been realized, the promised simplicity of programmatic trading has yet to be accomplished. Consumers are not a homogenous block which publishers can access in a straightforward manner; rather, they’re found on an increasingly diverse list of distinct devices across multiple media channels. The data that informs brands which are the right consumers to target grows in size and complexity monthly, and this acceleration of data complexity shows no signs of abating.
Key
Find
ings
N
ew D
rive
rs
Prog
ram
mat
ic C
PMs
Ret
urni
ng T
rend
s Ap
pend
ix
Cadr
eon’
s Pe
rspe
ctiv
e
Consumer Engagement
6
Programmatic Challenges and Solutions
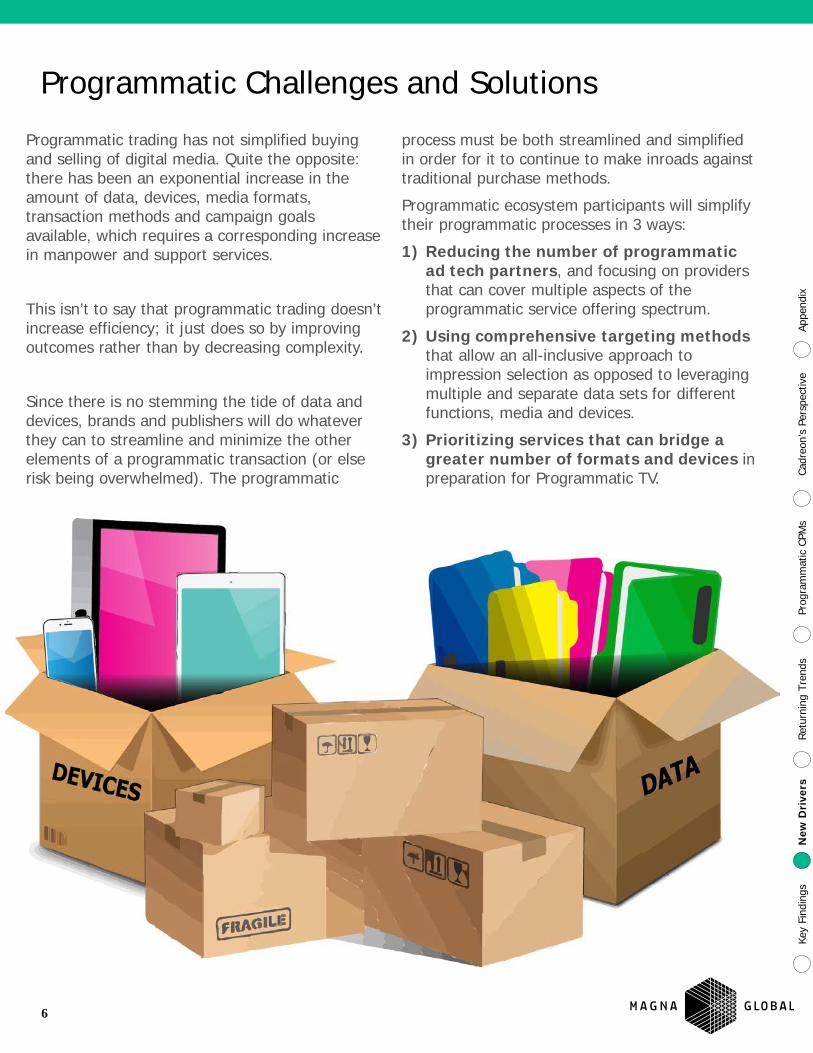
Programmatic trading has not simplified buying and selling of digital media. Quite the opposite: there has been an exponential increase in the amount of data, devices, media formats, transaction methods and campaign goals available, which requires a corresponding increase in manpower and support services.
This isn’t to say that programmatic trading doesn’t increase efficiency; it just does so by improving outcomes rather than by decreasing complexity.
Since there is no stemming the tide of data and devices, brands and publishers will do whatever they can to streamline and minimize the other elements of a programmatic transaction (or else risk being overwhelmed). The programmatic
process must be both streamlined and simplified in order for it to continue to make inroads against traditional purchase methods.
Programmatic ecosystem participants will simplify their programmatic processes in 3 ways:
1) Reducing the number of programmatic ad tech partners, and focusing on providers that can cover multiple aspects of the programmatic service offering spectrum.
2) Using comprehensive targeting methods that allow an all-inclusive approach to impression selection as opposed to leveraging multiple and separate data sets for different functions, media and devices.
3) Prioritizing services that can bridge a greater number of formats and devices in preparation for Programmatic TV.
Key
Find
ings
N
ew D
rive
rs
Prog
ram
mat
ic C
PMs
Ret
urni
ng T
rend
s Ap
pend
ix
Cadr
eon’
s Pe
rspe
ctiv
e

7
Streamlining the Programmatic Ecosystem
The first way in which buyers and sellers will streamline their programmatic experience will be to use fewer, but more comprehensive, ad tech partners.
In our September report, we made the point that new company formation in the ad tech ecosystem would keep pace with M&A, and therefore the landscape would not become significantly simpler.
While this is still likely to be the case, we also expect more of a barbell structure to the ad tech landscape in years to come, with expansion of multi-service conglomerates on one end and a proliferation of small new service startups on the other. The middle of the spectrum – large companies with limited scope – will flounder.
The integrated ad tech majors will use the startup landscape as an incubator after all the mid-sized ad tech companies have been purchased or squeezed out. For the small startups, it is in the ad tech majors’ best interest to avoid immediate competition with them. Each year there will be additional service offerings required for a programmatic campaign and as soon as the front-runners in a new service silo establish themselves, they will be purchased and integrated into consolidated service platforms (as were Adometry, mDialog and Spider.io).
The days of a dominant single-service offering ad tech company are in the past.
Key
Find
ings
N
ew D
rive
rs
Prog
ram
mat
ic C
PMs
Ret
urni
ng T
rend
s Ap
pend
ix
Cadr
eon’
s Pe
rspe
ctiv
e

8
MoPub
Rubicon
LiveRail
Pubmatic
Streamlining: Landscape Consolidation
OpenX
SpotXchange
AppNexus
Yahoo
AOL
Microsoft
Exch
ange
s/SS
Ps
Tech
Maj
ors
Services Media Handled For? Platform
Millennial Media
The bifurcation between ad tech majors and startups will occur because customers - whether brands or publishers - are increasingly willing to sacrifice individual service efficiency in return for unified service platform efficiencies through a full-service offering.
The bottleneck for the programmatic ecosystem is no longer having the technology to connect to the right inventory, or having the ability to see where and how ads are performing. Rather, the greatest hurdle now is in making dozens of services and data sources and negotiated terms to function seamlessly together.
In light of that challenge, who are the winners and losers in this future for the ad tech ecosystem? The winners will be those who offer the greatest coverage of the service spectrum.
On the next several pages, we see various participants in the programmatic ecosystem (major programmatic tech hubs, exchanges, DSPs and SSPs, and all the ancillary services that accompany programmatic campaigns) and the broad buckets of services that they offer. The more business lines an ad tech company provides, the more attractive they will appear to customers trying to streamline their business process. In addition, mid-size companies with few overlapping service offerings are ripe for M&A activity.
Key
Find
ings
N
ew D
rive
rs
Prog
ram
mat
ic C
PMs
Ret
urni
ng T
rend
s Ap
pend
ix
Cadr
eon’
s Pe
rspe
ctiv
e
The companies selected represent a non-comprehensive sample of programmatic ecosystem participants based on publicly available information. Company capabilities have been compiled from information on each company’s corporate website and other publicly available information. Companies are ordered alphabetically in each sub-section and not by MAGNA's opinions regarding any company's ranking or proficiency. Column labels indicate broad service buckets; all marked companies in each column do not necessarily have comparable business offerings in that service bucket. This chart represents a snapshot in time and is not reflective of the developing business of many of these companies.

9
Triggit
BrightRoll
Altitude Digital
Tremor Video
TubeMogul
Videology
Simpli.fi
Rocketfuel
Turn
Adobe
SiteScout
The Trade Desk
MediaMath
DataXu
DSP
s/N
etw
orks
Services Media Handled For? Platform
Streamlining: Landscape Consolidation
While all the DSPs and SSPs offer the ability to buy and sell media through exchange infrastructure, they are rapidly broadening their offerings to include analytics, data management, fraud and viewability analysis and, in some cases, even cross platform/format capabilities.
For both buyers and sellers, the ability to handle a greater portion of their programmatic workflow through a single provider whose platforms function seamlessly together is a vital value proposition.
Key
Find
ings
N
ew D
rive
rs
Prog
ram
mat
ic C
PMs
Ret
urni
ng T
rend
s Ap
pend
ix
Cadr
eon’
s Pe
rspe
ctiv
e
The companies selected represent a non-comprehensive sample of programmatic ecosystem participants based on publicly available information. Company capabilities have been compiled from information on each company’s corporate website and other publicly available information. Companies are ordered alphabetically in each sub-section and not by MAGNA's opinions regarding any company's ranking or proficiency. Column labels indicate broad service buckets; all marked companies in each column do not necessarily have comparable business offerings in that service bucket. This chart represents a snapshot in time and is not reflective of the developing business of many of these companies.
10
AdTruth
Drawbridge
Cross Pixel
Rentrak
Moat
Integral Ad Sci.
TapAd
QuantCast
Visible Measures
Lotame
BlueKai
ComScore
Services Media Handled For? Platform
Oth
er R
esou
rces
Dbl. Verify
Insight Express
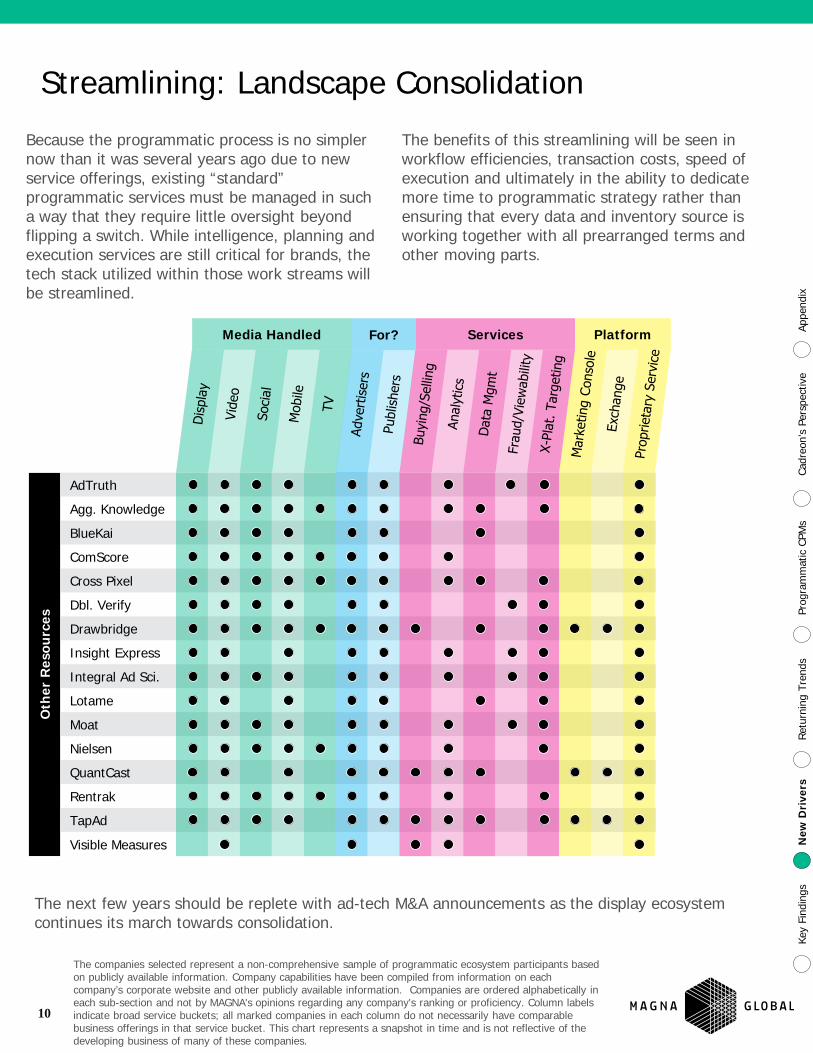
The next few years should be replete with ad-tech M&A announcements as the display ecosystem continues its march towards consolidation.
Nielsen
Streamlining: Landscape Consolidation
Because the programmatic process is no simpler now than it was several years ago due to new service offerings, existing “standard” programmatic services must be managed in such a way that they require little oversight beyond flipping a switch. While intelligence, planning and execution services are still critical for brands, the tech stack utilized within those work streams will be streamlined.
The benefits of this streamlining will be seen in workflow efficiencies, transaction costs, speed of execution and ultimately in the ability to dedicate more time to programmatic strategy rather than ensuring that every data and inventory source is working together with all prearranged terms and other moving parts.
Key
Find
ings
N
ew D
rive
rs
Prog
ram
mat
ic C
PMs
Ret
urni
ng T
rend
s
Agg. Knowledge
Appe
ndix
Ca
dreo
n’s
Pers
pect
ive
The companies selected represent a non-comprehensive sample of programmatic ecosystem participants based on publicly available information. Company capabilities have been compiled from information on each company’s corporate website and other publicly available information. Companies are ordered alphabetically in each sub-section and not by MAGNA's opinions regarding any company's ranking or proficiency. Column labels indicate broad service buckets; all marked companies in each column do not necessarily have comparable business offerings in that service bucket. This chart represents a snapshot in time and is not reflective of the developing business of many of these companies.

11
Targeting & Data Consolidation
The second way in which companies will streamline their programmatic experience will be to use comprehensive targeting methods and to consolidate data sources.
There are two forms of data usage in the programmatic ecosystem: data used for identification, and data used for targeting.
Identification data is used to figure out which consumer corresponds with which impression, regardless of how they’re accessing content.
Targeting data is used to decide whether that consumer is worth bidding on, and if so, what the price should be.
Below is a representation of how each type of data is used in a campaign, and a brief overview of the most common sources for each type of data. The subsequent slides detail those data sources including their strengths and weaknesses, something that programmatic ecosystem participants will be looking at closely as they try to consolidate data sources to simplify their programmatic operations.
1
2
3
Identify
Target
Deliver
DETERMINISTIC & PROBABILISTIC IDENTIFICATION
BEHAVIOR PROFILING, PERFORMANCE ANALYSIS
CREATIVE CUSTOMIZATION
Social data & other pervasive login sources, device info, and
location & telecom data are some of the more popular sources used to ID users
across their various devices.
Social data, data broker databases, information & measurement company databases, location data and 1st party
databases are the common sources for tracking & targeting user behavior.
Once a user (in the form of an impression) is identified, valued, and ultimately purchased, the appropriate creative content must still be
delivered. Machine-based creative optimization is likely a 2016 story.
CROSS-DEVICE USER ID
BEHAVIOR TRACKING
OPTIMIZING CONTENT
Programmatic Data Funnel
Key
Find
ings
N
ew D
rive
rs
Prog
ram
mat
ic C
PMs
Ret
urni
ng T
rend
s Ap
pend
ix
Cadr
eon’
s Pe
rspe
ctiv
e
12
Targeting: Cross-Device User Selection
Social Data
Pervasive Login
Device Info
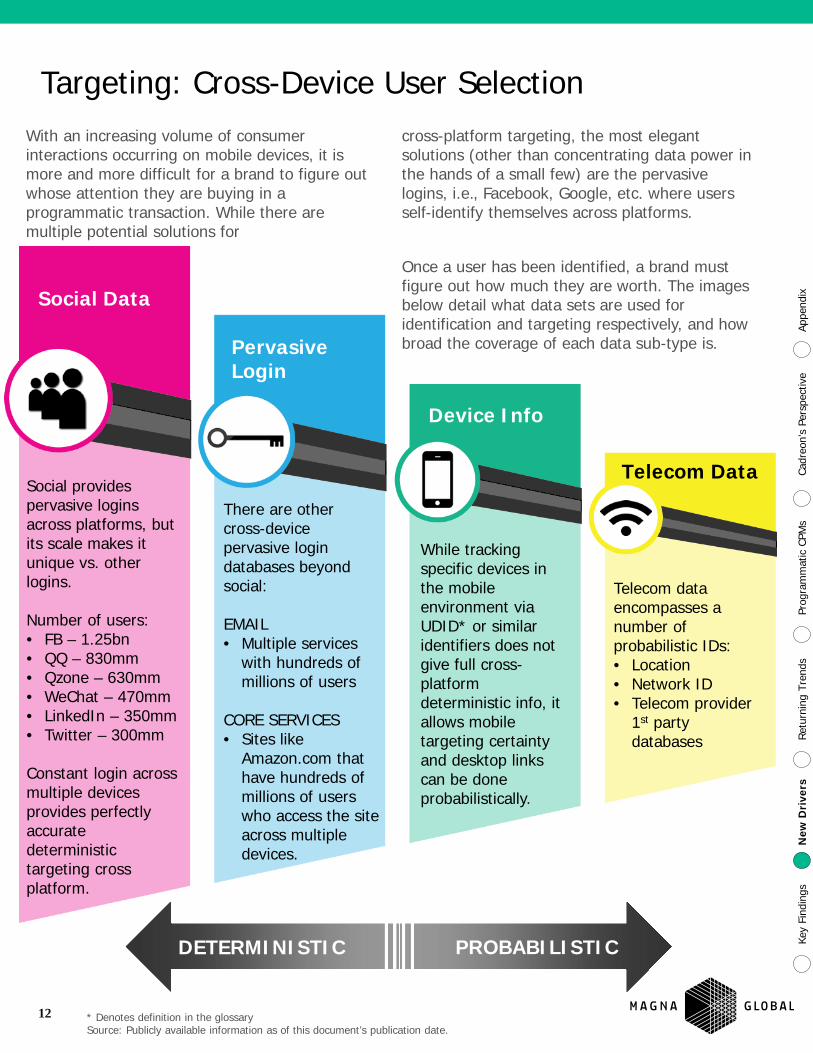
Telecom Data Social provides pervasive logins across platforms, but its scale makes it unique vs. other logins. Number of users: • FB – 1.25bn • QQ – 830mm • Qzone – 630mm • WeChat – 470mm • LinkedIn – 350mm • Twitter – 300mm
Constant login across multiple devices provides perfectly accurate deterministic targeting cross platform.
DETERMINISTIC PROBABILISTIC
There are other cross-device pervasive login databases beyond social: EMAIL • Multiple services
with hundreds of millions of users
CORE SERVICES • Sites like
Amazon.com that have hundreds of millions of users who access the site across multiple devices.
While tracking specific devices in the mobile environment via UDID* or similar identifiers does not give full cross-platform deterministic info, it allows mobile targeting certainty and desktop links can be done probabilistically.
Telecom data encompasses a number of probabilistic IDs: • Location • Network ID • Telecom provider
1st party databases
With an increasing volume of consumer interactions occurring on mobile devices, it is more and more difficult for a brand to figure out whose attention they are buying in a programmatic transaction. While there are multiple potential solutions for
cross-platform targeting, the most elegant solutions (other than concentrating data power in the hands of a small few) are the pervasive logins, i.e., Facebook, Google, etc. where users self-identify themselves across platforms.
Once a user has been identified, a brand must figure out how much they are worth. The images below detail what data sets are used for identification and targeting respectively, and how broad the coverage of each data sub-type is.
Key
Find
ings
N
ew D
rive
rs
Prog
ram
mat
ic C
PMs
Ret
urni
ng T
rend
s Ap
pend
ix
Cadr
eon’
s Pe
rspe
ctiv
e
* Denotes definition in the glossary Source: Publicly available information as of this document’s publication date.

13
Targeting: Behavior Tracking
Social Data
Data Brokers
Info & Measure
Location Data
1st Party Data
NA
RR
OW
ER
BR
OA
DER
Because it has the highest number of users and those users are voluntarily sharing information about their behavior and preferences, social can deliver insights for brands on both a broad (reach) and narrow (1:1 insights) basis. Facebook Atlas will only further distance social data from the rest of the pack in terms of value to advertisers.
There are many data brokers: Acxiom, Experian, Epsilon, Equifax, Datalogix, etc. aggregating consumer data and reselling it in profile buckets. While their coverage is extremely broad, there is still some modeling at work in terms of translating the data they’re purchasing into useful profile groupings for brands.
Companies like Nielsen and Comscore are covering multiple elements of campaigns: not only do they have planning tools to link lifestyle with behavior, but they also provide measurement on the back end. Finally, there is increasing value in consolidating digital & TV targeting and measurement (OCR, VCE).
Telecom providers can now track consumer movement extremely accurately. On the other hand, the fragmentation of providers compared to social means that even though localized data is 1:1, it’s more difficult for brands to track the entire consumer base from a single data provider.
1st party databases (both CRM and EDW data) are integral to any digital campaign, and will do much of the heavy lifting in terms of defining what a consumer will look like in order to know who to target within broader data sets.
Key
Find
ings
N
ew D
rive
rs
Prog
ram
mat
ic C
PMs
Ret
urni
ng T
rend
s Ap
pend
ix
Cadr
eon’
s Pe
rspe
ctiv
e

14
Targeting: People-Based Marketing
It is no coincidence that the top data sources for both identification and behavior targeting are the broadest persistent log-in services in which consumers provide information about themselves. While this isn’t quite the intention-economy we envisioned several years ago, it does point toward a simplified data landscape in which programmatic ecosystem participants pare down the increasingly complex data landscape into a few essentials:
• The broadest persistent logins (Facebook, Google)
• 1st party databases for specific needs
• Location-based data to augment targeting and creative
This shift towards the broadest and narrowest data sets will mirror the first big trend discussed (streamlining) in that it will create a barbell data structure. The very broadest and the most specific data resources will increasingly be in demand, while the middle of the pack extrapolated data sets that offer neither the scale to identify consumers on a 1:1 basis nor the specificity provided by a specific CRM* database will be pushed to the fringes of the programmatic ecosystem.
While there are many names for the broadest data (Facebook Atlas’ people-based marketing comes to mind) and what it allows advertisers to do, there is no question that the barriers to entry to compete in this space in terms of required scale exclude all but a few main digital advertising players.
In addition, the fact that the most valuable data sets are held captive by a few elite ad-tech majors suggests that much of the war for supremacy in terms of providing this data will reside in the dynamic between consumer privacy concerns and those who hold the data, rather than between the ad tech players themselves. Whichever pervasive login company unlocks the key to gaining consumer trust will have a significant competitive advantage.
Key
Find
ings
N
ew D
rive
rs
Prog
ram
mat
ic C
PMs
Ret
urni
ng T
rend
s Ap
pend
ix
Cadr
eon’
s Pe
rspe
ctiv
e
* Denotes definition in the glossary
15
Programmatic TV Data
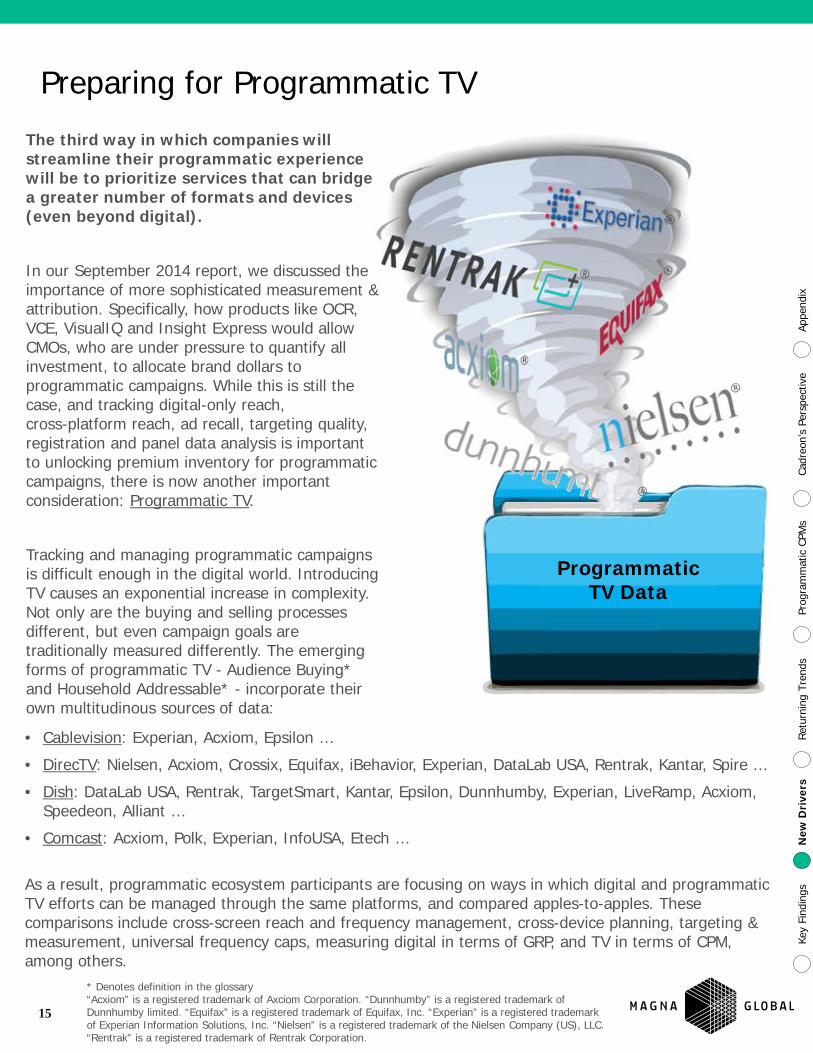
Preparing for Programmatic TV
The third way in which companies will streamline their programmatic experience will be to prioritize services that can bridge a greater number of formats and devices (even beyond digital).
In our September 2014 report, we discussed the importance of more sophisticated measurement & attribution. Specifically, how products like OCR, VCE, VisualIQ and Insight Express would allow CMOs, who are under pressure to quantify all investment, to allocate brand dollars to programmatic campaigns. While this is still the case, and tracking digital-only reach, cross-platform reach, ad recall, targeting quality, registration and panel data analysis is important to unlocking premium inventory for programmatic campaigns, there is now another important consideration: Programmatic TV.
Tracking and managing programmatic campaigns is difficult enough in the digital world. Introducing TV causes an exponential increase in complexity. Not only are the buying and selling processes different, but even campaign goals are traditionally measured differently. The emerging forms of programmatic TV - Audience Buying* and Household Addressable* - incorporate their own multitudinous sources of data:
• Cablevision: Experian, Acxiom, Epsilon …
• DirecTV: Nielsen, Acxiom, Crossix, Equifax, iBehavior, Experian, DataLab USA, Rentrak, Kantar, Spire …
• Dish: DataLab USA, Rentrak, TargetSmart, Kantar, Epsilon, Dunnhumby, Experian, LiveRamp, Acxiom, Speedeon, Alliant …
• Comcast: Acxiom, Polk, Experian, InfoUSA, Etech …
As a result, programmatic ecosystem participants are focusing on ways in which digital and programmatic TV efforts can be managed through the same platforms, and compared apples-to-apples. These comparisons include cross-screen reach and frequency management, cross-device planning, targeting & measurement, universal frequency caps, measuring digital in terms of GRP, and TV in terms of CPM, among others.
Key
Find
ings
N
ew D
rive
rs
Prog
ram
mat
ic C
PMs
Ret
urni
ng T
rend
s Ap
pend
ix
Cadr
eon’
s Pe
rspe
ctiv
e
* Denotes definition in the glossary “Acxiom” is a registered trademark of Axciom Corporation. “Dunnhumby” is a registered trademark of Dunnhumby limited. “Equifax” is a registered trademark of Equifax, Inc. “Experian” is a registered trademark of Experian Information Solutions, Inc. “Nielsen” is a registered trademark of the Nielsen Company (US), LLC. “Rentrak” is a registered trademark of Rentrak Corporation.

16
The Programmatic TV Opportunity
The size of the TV opportunity makes it critical for ecosystem participants to aggressively explore programmatic TV opportunities and streamline the way that their operations can accommodate programmatic TV.
For context, programmatic video is already approaching 1/3 of total digital video spend in the US, and will represent over 2/3 of total spend by 2019. The proliferation of programmatic methods has been rapid across all digital media formats.
This rapid expansion of programmatic spend within video is large in percentage, but this year translates to ~$1.5bn. To say the size of the traditional linear TV market as a whole is a larger opportunity in the US would be an understatement. In 2015, TV will be ~10x the size of the digital video market ($6bn vs. $65bn), and although the gap is closing, even small programmatic penetration into TV is significant.
66 64 68 65 68 65
4 6 9 12
16 20
0
10
20
30
40
50
60
70
80
90
2014 2015 2016 2017 2018 2019
Total United States Video Spend ($bn)
Video
TV
Source: MAGNA GLOBAL Feb. 2015 US Model; MAGNA GLOBAL Sept. 2014 Programmatic Model
Key
Find
ings
N
ew D
rive
rs
Prog
ram
mat
ic C
PMs
Ret
urni
ng T
rend
s Ap
pend
ix
Cadr
eon’
s Pe
rspe
ctiv
e
The penetration of programmatic within linear TV will remain far below that of digital even five years from now due to several advantages that digital had during its growth phase:
1) Search advertising was already 100% RTB and provided a blueprint for the magnitude of potential RTB efficiencies, justifying aggressive ad spend
2) Digital tech infrastructure was already set up for individual impression delivery and a 1:1 user:publisher experience. Much of TV is linear in nature and not receptive to dynamic insertion
3) Digital advertising had far fewer incumbent purchase methods and long-term deals compared to TV
4) TV suffers from the same headwinds that exist in digital video: there is far less unsold inventory than exists in banner display and social, and therefore less incentive for media owners to transition to a new transaction method
Because of these differences, it is safe to assume that programmatic TV will not penetrate the TV market at the pace that was seen in digital, but even these lower penetration levels result in significant spend.

17
The Outlook for Programmatic TV
While the US programmatic TV market, where most of the experimentation and development is happening, is still very small (2-3% of TV budgets in 2014), it is expanding. MAGNA estimates that in 2015, programmatic TV will represent ~4% of total TV budgets, and this will increase to 17% by 2019.
Five percent penetration in 2015 of the TV market translates to ~$2.5 billion in total programmatic television spend of which Household Addressable will represent ~$375mm. This total will grow to over $10 billion by 2019.
While the majority is Audience Buying right now, Household Addressable is rapidly increasing and will become a significant portion of the total in the near future (as can be seen in the chart above).
Over 95 million households are currently available through Audience Buying, and over 30 million are available to Household Addressable methods, with both numbers increasing. The sell side of the programmatic TV equation will not fall behind the curve as was seen by digital publishers when programmatic first emerged.
Source: MAGNA GLOBAL Spring 2015 Programmatic Forecast, 4A’s Data Driven Video Report
Key
Find
ings
N
ew D
rive
rs
Prog
ram
mat
ic C
PMs
Ret
urni
ng T
rend
s Ap
pend
ix
Cadr
eon’
s Pe
rspe
ctiv
e
0%2%4%6%8%
10%12%14%16%18%
2015 2016 2017 2018 2019
US Programmatic Television Penetration
Audience Buying Household Addressable
Current HH Addressable Availability
Cablevision: 2.8mm households addressable, 56 networks DirecTV: 12mm households addressable, 50+ networks Dish: 8mm households addressable, 78+ networks
Comcast: 19mm households addressable (VOD), 5-10mm addressable local cable Time Warner: VOD available, local cable rollout pending post-M&A plans

18
Privacy
While the aforementioned trends of streamlining and consolidation are the most important new trends for the programmatic industry in 2015, they’re not the most important drivers. That honor remains with the two most important carryovers from previous years: privacy and viewability.
While it has only been six months since we last gave an update on these trends, both have seen significant steps forward.
In September, we said that the biggest risk to the flow of programmatic data was the risk of losing consumer trust, rather than a legal / regulatory risk. In response, the largest players in ad tech are being more open with the way they’re using data and include dedicated easily accessible privacy policy pages on their sites.
Those same companies are making a conscious effort to educate their users not only about the steps being taken to protect their privacy, but also about what users are getting in return in the form of services. While consumers aren’t sympathetic to the need to make advertising more efficient and lucrative through targeting, it is likely because they are not connecting minor perceived privacy intrusions to tangible value that they’re receiving, whether in the form of product development or lack of subscription fees.
Providing consumers the information required to make the above mentioned value judgment will smooth the transition to the inevitable future of near-complete programmatic penetration and widespread universal targeting.
Key
Find
ings
N
ew D
river
s Pr
ogra
mm
atic
CPM
s R
etu
rnin
g Tr
ends
Ap
pend
ix
Cadr
eon’
s Pe
rspe
ctiv
e

19
Viewability
The second most important trend in the programmatic ecosystem is that of viewability. Concern about low viewability has pushed many towards private marketplaces and DealID transactions faster than might have happened otherwise (due to brand confidence that known inventory equals higher viewability).
We are seeing that in the numbers; viewability rates have increased lately due primarily to brand behavior. Shifting up the value pyramid improves overall viewability stats as there should be at least a loose correlation between price and viewability. We see the evidence from this in some of the available viewability stats:
• Viewability in the US in Q4 increased by 14% y/y for video (TubeMogul)
• Viewability for display impressions via networks & exchanges increased by 17% q/q in Q4 in the US (Integral Ad Science)
• Viewability for video ads in the US increased by 30% q/q in Q4 (Integral Ad Science)
• Viewability in the UK in Q4 increased by 16% y/y for video (TubeMogul)
• Viewability in Australia for programmatic direct increased by 24% y/y for video (TubeMogul)
Key
Find
ings
N
ew D
river
s Pr
ogra
mm
atic
CPM
s R
etu
rnin
g Tr
ends
Ap
pend
ix
Cadr
eon’
s Pe
rspe
ctiv
e
Source: Integral Ad Science http://integralads.com/resources/reports/ TubeMogul http://more.tubemogul.com/q4_2014_quarterly_report Rocketfuel http://rocketfuel.com/blog/ad-viewability-guide
Ads must be on screen Standard Banners 50% of the banner pixels must be on screen for at least 1 second
In-Browser Video 50% of the pixels must be on screen for at least 2 seconds
Large Banners 30% of the pixels must be on screen for at least 1 second
IAB Viewability Recommendations

20
Key
Find
ings
N
ew D
river
s Pr
ogra
mm
atic
CPM
s R
etu
rnin
g Tr
ends
Ap
pend
ix
Cadr
eon’
s Pe
rspe
ctiv
e
Viewability
While the previously quoted changes in viewability rates are just samples from the total population, it is clear that the trend is up. This doesn’t necessarily imply that programmatic CPMs are up on an apples-to-apples comparison basis, however. It is instead likely that much of the y/y shift in viewability is as a result of higher quality inventory pouring into the ecosystem as publishers grow more and more comfortable offering their inventory programmatically.
While viewability rates are a very important current point of discussion in the programmatic ecosystem, this is an interim situation. Over time, viewable impressions will become increasingly measured and therefore brands will be able to compare their campaign efficiency regardless of the viewability rate of different inventory sources. In addition, as the programmatic ecosystem increasingly tackles low viewability rates (through better algorithms on the ad tech side, and through better strategy and more experience on the execution side), viewability rates will improve. At some point, the gap between actual viewability rates and theoretical maximum viewability will shrink to the point that it won’t be worthy of as much discussion.
Some things that MAGNA believes will become more prominent in the viewability conversation this year are the relationship between ad placement and viewability. Integral Ad Science found in Q4 that viewability of skyscraper ads was 26% higher than that of leaderboards, but that’s potentially only because of the format and the natural likelihood that it will fit the MRC viewability guidelines during normal content consumption patterns.
Finally, Rocketfuel’s findings that viewable impressions are commanding a slowly increasing premium over non-viewable impressions corroborates the MAGNA opinion that the upward shift in price as a result of reducing supply (as non-viewable impressions leave the available pool) will occur gradually rather than in a large step when new viewability standards are introduced.
Source: Integral Ad Science http://integralads.com/resources/reports/ TubeMogul http://more.tubemogul.com/q4_2014_quarterly_report Rocketfuel http://rocketfuel.com/blog/ad-viewability-guide

21
Global Programmatic Development 2014
The previously mentioned trends and drivers will shape how programmatic evolves this year, but it’s also important to look at how programmatic changed in 2014. We are constantly measuring how large programmatic is globally, how fast it’s growing and how large it will become in the future. It’s also useful to look at global cost dynamics.
The difference between looking at programmatic CPMs and digital CPMs is that while overall digital CPMs reflect the changing cost dynamics of the total market from year to year, the programmatic inventory pool is only a portion of the total advertising inventory supply.
MAGNA’s expectation is that most of the incremental changes (increases) in programmatic CPM from year to year are largely due to moving up the inventory quality pyramid (whether because publishers are comfortable offering more premium inventory, brands want to ensure they receive viewable impressions, or any other factor).
Source: MAGNA GLOBAL Spring 2015 Programmatic Forecast
Customized Campaigns
Premium Formats
Mid-Tier Inventory
Remnant Inventory
Below we can see on a global basis that programmatic CPMs largely increased in 2014 (video faces a supply issue rather than a lack of premium inventory). We expect this dynamic to
continue in the coming years as measurement & attribution improve and the programmatic ecosystem unlocks an increasing quantity of premium inventory.
Key
Find
ings
N
ew D
river
s P
rogr
amm
atic
CP
Ms
Ret
urni
ng T
rend
s Ap
pend
ix
Cadr
eon’
s Pe
rspe
ctiv
e
-5%
0%
5%
10%
15%
20%
25%
Desktop Banner Mobile Banner Video
CPM Change by Format 2014
22
Relative CPMs by Country
Source: MAGNA GLOBAL Spring 2015 Programmatic Forecast
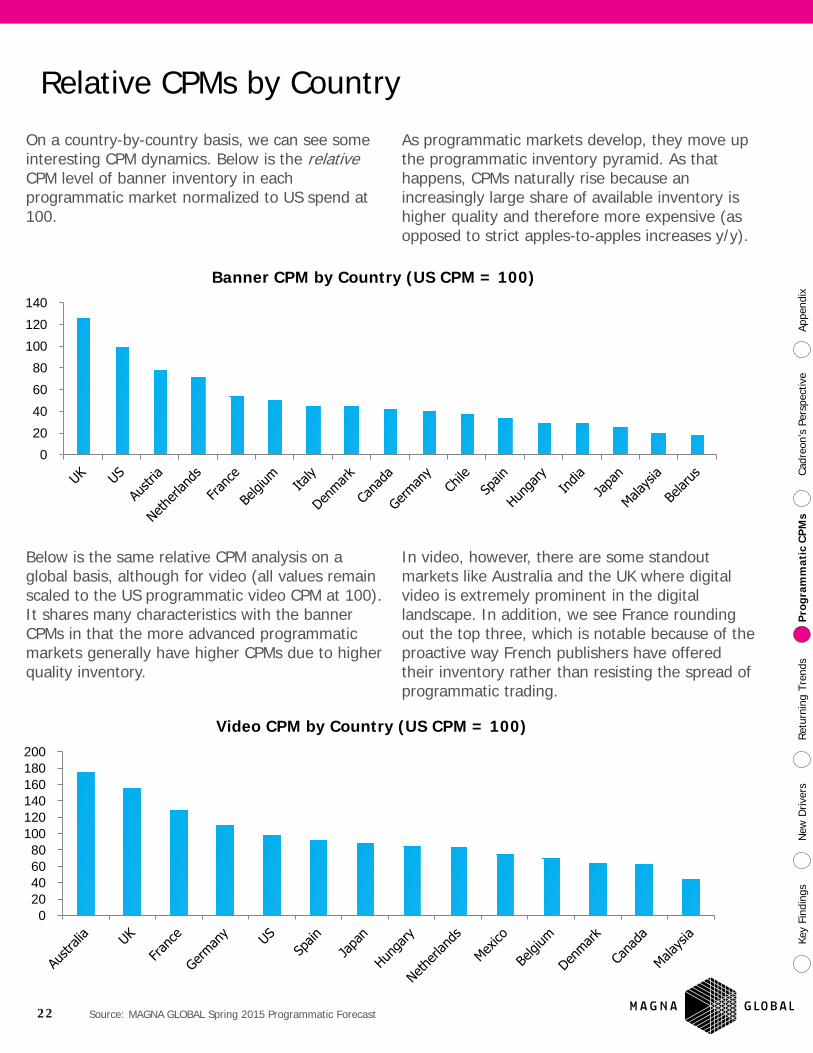
On a country-by-country basis, we can see some interesting CPM dynamics. Below is the relative CPM level of banner inventory in each programmatic market normalized to US spend at 100.
As programmatic markets develop, they move up the programmatic inventory pyramid. As that happens, CPMs naturally rise because an increasingly large share of available inventory is higher quality and therefore more expensive (as opposed to strict apples-to-apples increases y/y).
0
20
40
60
80
100
120
140
Banner CPM by Country (US CPM = 100)
020406080
100120140160180200
Video CPM by Country (US CPM = 100)
Below is the same relative CPM analysis on a global basis, although for video (all values remain scaled to the US programmatic video CPM at 100). It shares many characteristics with the banner CPMs in that the more advanced programmatic markets generally have higher CPMs due to higher quality inventory.
In video, however, there are some standout markets like Australia and the UK where digital video is extremely prominent in the digital landscape. In addition, we see France rounding out the top three, which is notable because of the proactive way French publishers have offered their inventory rather than resisting the spread of programmatic trading.
Key
Find
ings
N
ew D
river
s P
rogr
amm
atic
CP
Ms
Ret
urni
ng T
rend
s Ap
pend
ix
Cadr
eon’
s Pe
rspe
ctiv
e

23
Programmatic CPMs vs. Market Development
Source: MAGNA GLOBAL Spring 2015 Programmatic Forecast
United Kingdom
United States
Netherlands
France
Denmark Canada Germany Chile
Spain Hungary India
Japan Malaysia
0
20
40
60
80
100
120
140
10% 20% 30% 40% 50% 60% 70%
Nor
mal
ized
Ban
ner
CP
M
Programmatic Penetration 2014
Programmatic Market Development vs. CPM
The dynamic between programmatic market development and normalized CPM can be seen below. This is a scatter plot of programmatic penetration in 2014 compared to the normalized CPM, and there is a clear positive relationship.
While it will be difficult over the next few years (as the inventory available to programmatic buyers increases significantly) to lock down the impact that programmatic is having on specific inventory units, it is clear that the CPM increases seen are a result of a shifting cross section of inventory rather than any isolated ‘programmatic transaction’ mechanism.
Key
Find
ings
N
ew D
river
s P
rogr
amm
atic
CP
Ms
Ret
urni
ng T
rend
s Ap
pend
ix
Cadr
eon’
s Pe
rspe
ctiv
e

24
Programmatic CPM by Vertical
Source: MAGNA GLOBAL Spring 2015 Programmatic Forecast
020406080
100120140160180200
Banner CPM by Vertical (Average = 100)
0
50
100
150
200
250
Video CPM by Vertical (Average = 100)
Finally, we can examine CPM by vertical for both banners and video on a global basis. In September we looked at programmatic penetration by vertical in the US, and unsurprisingly found that the verticals that were most likely to retarget in a personalized way had the highest programmatic penetration (Health, Business Services, etc.)
It might not come as a big surprise then, that these are some verticals with low relative CPMs due to a high proportion of DR relative to verticals more likely to see branding activity (Apparel, Autos, Beauty, etc.).
Key
Find
ings
N
ew D
river
s P
rogr
amm
atic
CP
Ms
Ret
urni
ng T
rend
s Ap
pend
ix
Cadr
eon’
s Pe
rspe
ctiv
e

25
Luke Stillman, Associate Director,
Forecasting, MAGNA GLOBAL
Arun Kumar, Global President, Cadreon
Key
Find
ings
N
ew D
river
s Pr
ogra
mm
atic
CPM
s R
etur
ning
Tre
nds
Appe
ndix
C
adre
on’s
Per
spec
tive
The programmatic landscape is becoming increasingly complex; how is Cadreon tackling that complexity?
Cadreon’s philosophy is we simplify a complex world. Cadreon has always worked with multiple partners in order to identify the best in class in the ad tech space – both the companies that are performing today as well as those that are likely to perform tomorrow. The end goal of this multi-pronged approach is to create an intelligence layer that sits above everything and unifies decision making across devices and media, rather than operating in siloed stacks.
How does Cadreon manage open exchanges vs. private transactions?
It’s getting to the point where the boundaries between programmatic and direct buying are blurring. While currently there are still allocations between putting X% of dollars in the programmatic bucket and Y% into direct, there are an increasing number of direct buys which are augmented by data to make them smarter and more targeted. In 3-5 years there won’t be private marketplaces, there will just be marketplaces with both an open exchange and a premium component.
The open exchange will be like a flea market with great bargains to be found with the appropriate knowledge and expertise vs. the premium component which is more akin to a luxury supermarket. Nobody will shop solely at one or the other, but rather the quality of one’s data will determine what type of transaction and inventory source makes the most sense.
What is Cadreon’s approach for combating low viewability and ad fraud?
Cadreon has a four part approach towards combating fraud: set goals to optimize away from fraud, partner with leading software solutions that combat fraud, attempt to categorize available inventory from a fraud risk standpoint, and engage in efforts to avoid paying for impressions suspected to be fraudulent.
With regard to viewability, we are constantly negotiating with inventory owners to improve viewability metrics in our marketplaces. While many brands are still focused on viewability rates rather than the cost of in-view impressions, in the future we expect that cost of viewable impression will be the standard measurement metric.

26
Key
Find
ings
N
ew D
river
s Pr
ogra
mm
atic
CPM
s R
etur
ning
Tre
nds
Appe
ndix
C
adre
on’s
Per
spec
tive
How does Cadreon think about the premium space and brand advertising campaigns?
The definition of premium is changing, so the first step is to recognize what premium means. Premium inventory isn’t solely about the quality of the content; context and audiences are equally important. Cadreon’s expertise is in consolidating publishers into a list of high-functioning, high-viewability sources, and then drilling down within each campaign to ensure spend is hitting the core audience as efficiently as possible.
How does a brand decide between working through an agency or building a programmatic business in house?
Building a programmatic business is like building a home; there are three approaches:
1) Buying a prefabricated home from a builder. This is like outsourcing my intelligence to Google and Facebook with the assumption that if Google is smart enough to know my audience, that’s good enough.
2) Living in a serviced apartment where it feels like my home but when I leave, all the customizations I made are lost. This is like outsourcing the entire business including the data strategy to a third party.
3) Working with an architect to build one’s dream home. Cadreon is the architect and while we work with clients to build out an efficient programmatic business, we believe a client must have a clear understanding of their data strategy and own that part of their business.
Cadreon will craft the best strategy and execute it, but clients still need to structure and build their data practice internally in order to best leverage that data. We believe this is the best solution and is neither entirely agency nor entirely in-house.
What is the future of Programmatic TV, and what is Cadreon’s strategy for it?
One has to be careful using the term programmatic in context of television; it carries lots of baggage with it regarding how programmatic has developed within digital. Cadreon has an Advanced TV practice with three pillars: Programmatic Audience Buying, HH Addressable, and Zip code/DMA targeting.
There is huge potential for growth in Advanced TV, but it will not perfectly mirror programmatic development in digital: rather than focusing on an exchange environment, Advanced TV will focus on adding more granular data sets to TV buying to make it smarter, more measurable and more effective than standard demographic buying.
Cadreon tries to adapt its approach to the TV world rather than imposing a digital structure on an environment not suited to it. TV buying has been stable for a long time; our challenge is figuring out how to take data sets that are digital in nature and create a match in the TV space, using TV measurement metrics and structure.
Looking to the future of Advanced TV, larger networks are starting to understand how they can leverage data with their inventory, but they look at digital programmatic and don’t want to go in that direction. Cadreon’s Advanced TV solutions harness our digital expertise but find solutions that will work for TV networks in a TV world. The end game is thinking about ‘video’ rather than ‘TV’ or ‘digital video.’

27
Glossary Part 1
Audience Buying (Programmatic TV): Method by which ads are served to networks/programs/dayparts with the highest propensity to reach target audience of a campaign. Uses technology and audience data to deliver incremental reach. Automated Guaranteed: Transaction in which inventory is guaranteed and pricing is fixed, with negotiation happening directly between buyer and seller. Transaction processes are automated but otherwise match a traditional I/O transaction.
Automation: Using technology to facilitate media transactions in a way that mirrors traditional transactions in structure. CRM: Customer relationship management – a system for managing a company’s interactions with current and future customers.
Cross-Platform Targeting: Identifying and matching audiences across devices (desktop, tablet, smartphone, TV, OOH, etc.)
Deal ID: Unique identifier that associates a transaction with prearranged agreement details, typically used to increase information in a transaction or change auction outcome from strict price criteria.
Deterministic Identification: Using login details to associate devices with an individual user for the purpose of identifying a user across all devices through which they access content.
Display-Related: Digital media advertising formats, including banners, video and social, i.e. all digital advertising formats except Search. “Display-Related” is the addressable universe for programmatic development. DMP: Data Management Platform, a user data store that is used for the centralization, management and deployment of a brand’s audience data. DSP: Demand-Side Platform, tech solution to allow buyers to access inventory across multiple exchanges and from multiple media owners.
Dynamic Insertion: The ability to show a specific user a specific ad, typically because of the characteristics of that user.
Exchange: Technology platform that facilitates the buying and selling of ad inventory using various methods of purchase other than traditional I/O. First Look: An agreement in which a buyer has priority access to inventory in an auction environment. Hash Linking: Associating an identifying tag with a specific user through a cryptographic function that does not allow reversing that tag back into the identifying characteristics for that user. Current best tracking option for protecting Personally Identifiable Information.
Key
Find
ings
N
ew D
river
s Pr
ogra
mm
atic
CPM
s R
etur
ning
Tre
nds
App
endi
x Ca
dreo
n’s
Pers
pect
ive

28
Glossary Part 2
Household Addressable (Programmatic TV): Method by which ads are served directly to the households in which the target audience resides. Invitation-Only Auction: Auction environment comparable to open exchange, except only a select collection of buyers that have been white-listed by the media owner(s) are allowed to participate. I/O: Insertion Order in a direct buy (agency to publisher). Traditional method of buying media inventory. Media Owner Cooperative: Partnership between media owners through which they offer premium inventory in controlled auction environments; typically affiliated with a supporting tech platform.
Open Auction: Transaction environment in which any brand can bid for offered inventory with few if any controls and little to no transparency.
PMP: Private Marketplace, where either one or a small handful of media owners offer inventory via programmatic methods but with either limited invites for specific brands or pre-arranged pricing.
Private Transaction: Transaction between one buyer and one seller where each is known to the other. Probabilistic Identification: Using an algorithm that combines non-personally identifiable information to associate devices with an individual user for the purpose of identifying a user across all devices through which they access content.
Programmatic Buying: The buying and selling of ad inventory in an automated fashion. In the context of this report, it encompasses both RTB and non-RTB methods.
Programmatic Direct: A generic term for non-RTB programmatic transactions that is being replaced by more specific terms as non-RTB technology matures. RTB: Real-Time Bidding, where an impression is offered through an auction where bid price is the most important (but not only) characteristic used to select a winning buyer. SSP: A tech platform used by web publishers to find the most appropriate available audience and optimize pricing of a publisher’s inventory.
Statistical Identification: The process of identifying devices across sessions based on a series of non-personally identifiable data points and algorithms to narrow these characteristics to a single or small handful of users. Traditional Transaction: Any transaction executed through non-programmatic means.
UDID: Universal Device ID, used to identify specific devices across sessions and apps. Unreserved Fixed-Rate: A transaction in which price has been agreed upon in advance but no guarantees on exact inventory or impression delivery have been made.
Viewability: Whether or not an impression was on screen for long enough to count as being viewable. Viewable impressions are gradually becoming the currency for an increasing number of campaigns. For a standard banner in the US, the requirement is that 50% of the pixels be on screen for at least one second.
Key
Find
ings
N
ew D
river
s Pr
ogra
mm
atic
CPM
s R
etur
ning
Tre
nds
App
endi
x Ca
dreo
n’s
Pers
pect
ive
29
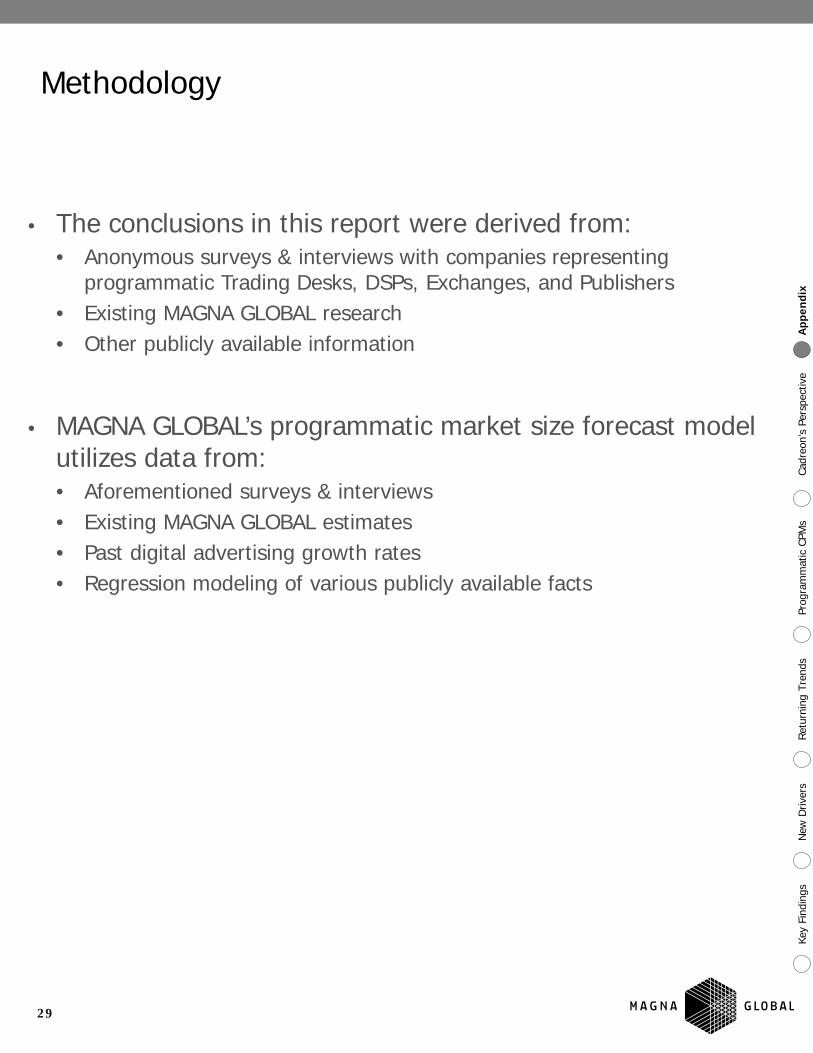
• The conclusions in this report were derived from: • Anonymous surveys & interviews with companies representing
programmatic Trading Desks, DSPs, Exchanges, and Publishers • Existing MAGNA GLOBAL research • Other publicly available information
• MAGNA GLOBAL’s programmatic market size forecast model utilizes data from: • Aforementioned surveys & interviews • Existing MAGNA GLOBAL estimates • Past digital advertising growth rates • Regression modeling of various publicly available facts
Methodology
Key
Find
ings
N
ew D
river
s Pr
ogra
mm
atic
CPM
s R
etur
ning
Tre
nds
App
endi
x Ca
dreo
n’s
Pers
pect
ive

30
MAGNA GLOBAL is the strategic global media unit of IPG Mediabrands, comprised of two key divisions.
MAGNA GLOBAL Investment harnesses the aggregate power of all IPG media investments to create leverage in the market, drive value, and ultimately make smarter, more effective and efficient media investments on behalf of our clients. MAGNA GLOBAL architects the go-to-market investment strategy across digital, programmatic, broadcast and all traditional media platforms on behalf of IPG clients, is dedicated to increasing the use of data and technology to transact media buys and is therefore considered the most comprehensive negotiating unit in the media industry.
MAGNA GLOBAL Intelligence has set the industry standard for more than 65 years by predicting the future of media value. MAGNA GLOBAL Intelligence produces more than 40 annual reports on audience trends, media spend and market demand, and ad effectiveness.
IPG Employees can access and download MAGNA reports from our intranet sharepoint site: http://magna.mbww.com/default.aspx
All work is property of MAGNA GLOBAL and cannot be used or reproduced by any person or company for direct commercial activities without written authorization.
© 2015 Magna Global, New York, NY, USA – All Rights Reserved
About MAGNA GLOBAL
MAGNA GLOBAL Contributors Luke Stillman Associate Director, Forecasting [email protected] Vincent Letang EVP, Director of Forecasting [email protected]
Key
Find
ings
N
ew D
river
s Pr
ogra
mm
atic
CPM
s R
etur
ning
Tre
nds
App
endi
x Ca
dreo
n’s
Pers
pect
ive