program on technology innovation: electricity use in the electric
TRANSCRIPT

2011 TECHNICAL REPORT
Program on Technology Innovation: Electricity Use in the Electric SectorOpportunities to Enhance Electric Energy Effi ciency in the Production and Delivery of Electricity


EPRI Project Manager C. Gellings
3420 Hillview Avenue Palo Alto, CA 94304-1338 USA PO Box 10412 Palo Alto, CA 94303-0813 USA 800.313.3774 650.855.2121
[email protected] 1024651
www.epri.com Final Report, November 2011
Program on Technology Innovation: Electricity Use in
the Electric Sector
Opportunities to Enhance Electric Energy Efficiency in the Production and
Delivery of Electricity

DISCLAIMER OF WARRANTIES AND LIMITATION OF LIABILITIES
THIS DOCUMENT WAS PREPARED BY THE ORGANIZATION(S) NAMED BELOW AS AN ACCOUNT OF WORK SPONSORED OR COSPONSORED BY THE ELECTRIC POWER RESEARCH INSTITUTE, INC. (EPRI). NEITHER EPRI, ANY MEMBER OF EPRI, ANY COSPONSOR, THE ORGANIZATION(S) BELOW, NOR ANY PERSON ACTING ON BEHALF OF ANY OF THEM:
(A) MAKES ANY WARRANTY OR REPRESENTATION WHATSOEVER, EXPRESS OR IMPLIED, (I) WITH RESPECT TO THE USE OF ANY INFORMATION, APPARATUS, METHOD, PROCESS, OR SIMILAR ITEM DISCLOSED IN THIS DOCUMENT, INCLUDING MERCHANTABILITY AND FITNESS FOR A PARTICULAR PURPOSE, OR (II) THAT SUCH USE DOES NOT INFRINGE ON OR INTERFERE WITH PRIVATELY OWNED RIGHTS, INCLUDING ANY PARTY'S INTELLECTUAL PROPERTY, OR (III) THAT THIS DOCUMENT IS SUITABLE TO ANY PARTICULAR USER'S CIRCUMSTANCE; OR
(B) ASSUMES RESPONSIBILITY FOR ANY DAMAGES OR OTHER LIABILITY WHATSOEVER (INCLUDING ANY CONSEQUENTIAL DAMAGES, EVEN IF EPRI OR ANY EPRI REPRESENTATIVE HAS BEEN ADVISED OF THE POSSIBILITY OF SUCH DAMAGES) RESULTING FROM YOUR SELECTION OR USE OF THIS DOCUMENT OR ANY INFORMATION, APPARATUS, METHOD, PROCESS, OR SIMILAR ITEM DISCLOSED IN THIS DOCUMENT.
REFERENCE HEREIN TO ANY SPECIFIC COMMERCIAL PRODUCT, PROCESS, OR SERVICE BY ITS TRADE NAME, TRADEMARK, MANUFACTURER, OR OTHERWISE, DOES NOT NECESSARILY CONSTITUTE OR IMPLY ITS ENDORSEMENT, RECOMMENDATION, OR FAVORING BY EPRI.
THE FOLLOWING ORGANIZATION PREPARED THIS REPORT:
Electric Power Research Institute (EPRI)
NOTE
For further information about EPRI, call the EPRI Customer Assistance Center at 800.313.3774 or e-mail [email protected].
Electric Power Research Institute, EPRI, and TOGETHER…SHAPING THE FUTURE OF ELECTRICITY are registered service marks of the Electric Power Research Institute, Inc.
Copyright © 2011 Electric Power Research Institute, Inc. All rights reserved.

iii
Acknowledgments The following organization prepared this report:
Electric Power Research Institute (EPRI) 3420 Hillview Ave. Palo Alto, CA 94304
Principal Investigator C. Gellings
This report describes research sponsored by EPRI.
The author wishes to thank Erin O’Neill and Lew Rubin of Portal Solutions for their assistance in performing an analysis of parasitic load characteristics of the U.S. generation fleet. EPRI contributors and reviewers include the following individuals:
General: Vic Niemeyer Thom Henneberger Tom Wilson
Nuclear: Timothy Eckert Brozia Clark Ken Caraway Jerry Kernaghan Ken Canavan Neil Wilmshurst
Generation: Dale Grace John Scheibel Jeff Stallings Anthony Facchiano Samuel Korellis
Power Delivery & Utilization: Tom Short Alberto Del Rosso Karen Forsten

This publication is a corporate document that should be cited in the
literature in the following manner:
Program on Technology Innovation: Electricity Use in the Electric Sector:
Opportunities to Enhance Electric Energy Efficiency in the Production
and Delivery of Electricity. EPRI, Palo Alto, CA: 2011.
1024651.
iv
The author wishes to thank the following individuals for their thoughtful review comments: Valerie von Schramm, CPS Energy John Rowe, Duke Energy Anda Andrews Ray, Tennessee Valley Authority Ramesh Shankar, Tennessee Valley Authority Richard Smith, Ameren Donna LeClair, BC Hydro Ian Welch, National Grid

v
Abstract While many utilities are encouraged by regulators to engage in end-use energy efficiency programs, few consider options to reduce energy losses along the electricity value chain, even though the electricity sector is the second largest electricity-consuming industry in the United States. Electricity used to facilitate power production, transmission, and distribution alone consumes approximately 11% of generated electricity. A number of technologies can be applied to reduce this electricity use.
This report addresses the energy currently expended in the form of electricity used for power plant auxiliaries and transmission and distribution losses. The report shows that electricity consumption in electric utilities can be reduced by up to 15% and describes some of the technical options available to lowering power usage, including the increased employment of variable speed drives in power plants and ways of improving transmission and distribution efficiency by reducing transmission and distribution losses. The report sketches out a strategic framework for realizing these opportunities.
Keywords Energy Efficiency Electricity use End-to-end efficiency Electricity value chain Losses Heat rate improvement Transmission efficiency Distribution efficiency


vii
Table of Contents
Section 1: Electricity Used to Produce and Deliver Electricity ................................................ 1-1
Which Improvements Would Be the Most Impactful? ............ 1-2 Summary 1-2 Potential Reduction in Energy Use ...................................... 1-3 Background ..................................................................... 1-4
Section 2: Electricity Use in Power Plants ................. 2-1 How Plant Auxiliaries Effect Heat Rate ................................ 2-3 Detailed Analysis ............................................................. 2-4
Data Sources and Quality, and Statistical Approach ....... 2-5 Results ....................................................................... 2-6 Coal Fleet .................................................................. 2-6 Nuclear Fleet ........................................................... 2-10 Natural Gas Fleet ..................................................... 2-12
Electricity Uses in Renewable Power Production ................. 2-13 Previous Studies ............................................................. 2-14 How Can Auxiliary Power Consumption be Reduced? ........ 2-16 Nuclear House Load Reduction ........................................ 2-19
Section 3: Electricity Use in Electric Transmission and Distribution Systems ......................... 3-1
Historic Transmission and Distribution Use .......................... 3-1 Transmission and Distribution ....................................... 3-2 Distribution ................................................................ 3-2
Analytical Framework ....................................................... 3-4 Reducing Distribution Electricity Use ................................... 3-6 Transmission .................................................................... 3-8 Substation Electricity Use ................................................... 3-8 Improving Transmission Efficiency by Reducing Transmission Losses ........................................................ 3-11
EHV Overlay/Voltage Upgrade (12.4% reduction in transmission losses) ................................................... 3-11 Substation/Transformer Efficiency (1.4% reduction in transmission losses) ................................................... 3-12 Transmission Line Efficiency (4.2% reduction in transmission losses) ................................................... 3-12

viii
System Loss Reduction (2.1% reduction in transmission losses) ................................................... 3-12
Offices and Control Centers ............................................ 3-13 Office Buildings ........................................................ 3-13
Micro-Grid Systems ........................................................ 3-15 Micro-Grid Efficiency ................................................ 3-15
Total Use of Electricity ..................................................... 3-18
Section 4: Next Steps .............................................. 4-1 Development of Strategic Framework to Assess End-to-End Efficiency .................................................................. 4-1 Framework Elements ......................................................... 4-2
Energy Efficiency Measure Profiles ................................ 4-2 Estimation of Potential Savings per Sector ...................... 4-2 Energy Efficiency Accounting Guidelines ....................... 4-2 Integration Guidelines for Project Planning and Prioritization............................................................... 4-2
Section 5: Conclusions ............................................. 5-1
Section 6: References .............................................. 6-1

ix
List of Figures
Figure 1-1 Electricity Use by the Electric Sector ......................... 1-4
Figure 2-1 Steam-Driven Electric Power Plant (Source: Wikimedia.org) (Need better Figure 2 which lists components in order of contribution/use starting with the heat source and ending with the transmission line) ............... 2-2
Figure 2-2 Stealth Heat Rate Penalties That are Controllable by Boiler Combustion and Performance Optimization (Source: EPRI 1017546) ................................................... 2-4
Figure 2-3 Emission Control Options (Source: EPRI 1019003) .... 2-8
Figure 2-4 Auxiliary Power Consumption – Typical Coal-Fired Power Plant (Source: EPRI 1017546) ....................... 2-15
Figure 2-5 Energy Savings Potential of Variable-Speed Drives (VSD) (Source: ABB Medium Voltage Drives) ........... 2-17
Figure 2-6 Load Duty Cycle: Example of Excellent Adjustable Speed Drive Candidate (Source: ABB 2009) ..... 2-18
Figure 2-7 Example Losses In System Elements With Mechanical Control Versus ASD Control at Four Load Levels (Source: ABB 2009) .............................................. 2-18
Figure 3-1 Net-Generation-to-End-Use Flow (Source: EIA 2009) .. 3-1
Figure 3-2 Transmission & Distribution Losses (Source: Energy Information Agency (EIA) Electricity Overview 1948-2009) .................................................................... 3-2
Figure 3-3 General Process for Developing Green Circuits Base-Case Model ............................................................. 3-5
Figure 3-4 U.S. Electricity Sector’s Potential to Reduce CO2 Emissions Based on Deploying a Portfolio of Advanced Technologies (EPRI 2007) ................................................. 3-6
Figure 3-5 Distribution Feeder Annual Energy Use ..................... 3-7
Figure 3-6 Combined Heat and Power Applications for DG are the Best Route to High Efficiency (Source: EPRI 1003973) ..................................................................... 3-17


xi
List of Tables
Table 1-1 Categories of Energy Used to Produce and Deliver Electricity ........................................................................ 1-1
Table 1-2 Technology Improvements and Their Impact ............... 1-2
Table 1-3 Use of Electricity in Producing and Delivering Electricity ........................................................................ 1-2
Table 1-4 Largest Industry Users of Electricity – Annual Billion kWh (Source: EPRI 1022334) .................................. 1-3
Table 2-1 Internal Power Use: Coal Generation ........................ 2-7
Table 2-2 Auxiliary Power for Various Flue Gas Desulfurization (FGD) Processes (EPRI 1019003) ................. 2-9
Table 2-3 Auxiliary Power Consumption of Lime Spray Dryer (LSD) and Circulating Dry Scrubber (CDS) Flue Gas Desulfurization (FDG) on a 500 MP Plant (EPRI 1019003) ..................................................................... 2-10
Table 2-4 Internal Power Use: Nuclear Generation .................. 2-11
Table 2-5 Auxiliary Power Consumption in India Power Plants (Performance 2007) .............................................. 2-14
Table 2-6 Breakdown of Auxiliary Power Consumption (Source: Best Practices for Auxiliary Power Reduction in Thermal Power Stations) .................................................. 2-15
Table 2-7 Applications of Variable Speed Drives in Power Generation .................................................................... 2-19
Table 2-8 EPRI Plant Support Engineering House Loads Reduction Survey ........................................................... 2-20
Table 3-1 Transmission Energy Use .......................................... 3-9
Table 3-2 Typical Substation Auxiliary Loads (Bose 2011) ....... 3-11
Table 3-3 Electricity Used in Electric Sector Buildings ............... 3-14
Table 3-4 Total Use of Electricity1 .......................................... 3-18


1-1
Section 1: Electricity Used to Produce and Deliver Electricity
The world is looking to energy efficiency to help meet the challenges of maintaining reliable and affordable electric service, wisely managing energy resources, and reducing carbon emissions. Fundamental to understanding the potential for energy efficiency in the production and delivery of electricity are estimates of how electricity is currently used. Electricity uses in the value chain of power production and delivery are infrequently discussed. To date, no known comprehensive studies have been published to document these uses so as to encourage debate on what can be done to mitigate them. This report represents one attempt to do so.
Table 1-1 lists the various uses of energy related to producing and delivering electricity to society. This includes the use of electricity itself in the production and delivery of electricity. This also includes two important categories: (1) the electricity power plants use to produce electricity by energizing auxiliary devices; and (2) the electricity losses incurred in the delivery system (the transmission and distribution system). These two categories of electricity use are the subject of this report.
Table 1-1 Categories of Energy Used to Produce and Deliver Electricity
Fuel Extraction Fuel
Transportation & Enrichment
Power Production Power Deliver
• Mining • Drilling
• Uranium enrichment
• Gas production • Gas
compression • Railroads • Shipping • Trucking
• Manufacture of generators*
• Construction • Fuel used in
electricity generation • Electricity used for
power plant auxiliaries
• Manufacture of transmission and distribution equipment
• Transmission losses
• Distribution losses
*Steam, gas, hydroelectric and wind generators, plant switchgear, boilers, photovoltaic cells, etc.
The subject of this report

1-2
In this report, the author refers to both uses and losses as uses. There are other uses of electricity in the categories illustrated in Table 1-1. Electricity is used in mining, drilling for natural gas, uranium enrichment, gas production and compression, transportation, as well as in the manufacture and construction of power production and power delivery facilities themselves. These uses are not addressed in this report. Recently there has been substantial attention paid to increasing end-use energy efficiency, (EPRI 1016987) but less so to increasing electric efficiency in electric technologies used for power production and electric delivery through transmission and distribution systems.
Which Improvements Would Be the Most Impactful?
Table 1-2 summarizes a few of the technology improvements highlighted in this report and offers a range of the impact their implementation may yield.
Table 1-2 Technology Improvements and Their Impact
ASD Applied to Pumps & Fans
Distribution Conservation Voltage Reduction
Distribution Transformer Efficiency
Transmission Extra High-Voltage (EHV) Overlays 12.4% reduction in losses
Substation Auxiliary Power 1.4% reduction in losses
Transmission Line Efficiency 4.2% reduction in losses
Takeaway: This report focuses on three aspects of electricity use in the electricity sector: 1. Electricity used for power plant auxiliaries
2. Transmission losses 3. Distribution losses
Summary
The results of a recent analysis prepared by the author indicate that approximately 11% of electricity produced is consumed in the production and delivery of electricity itself. That use is broken down as depicted in Table 1-3.
Table 1-3 Use of Electricity in Producing and Delivering Electricity
Electricity Use In Percent
Power Production ~4.6
Transmission ~2.8
Distribution ~3.7
Total ~11.0

1-3
Based on 2010 estimates of electricity generation, this represents 450.7 billion kilowatt hours of U.S. electricity generated making the electric sector the second largest electric consuming industry (see Table 1-4).
Takeaway: The electricity sector is the second largest electricity-consuming industry in the U.S. consuming 11% of electricity in production and delivery.
Table 1-4 Largest Industry Users of Electricity – Annual Billion kWh (Source: EPRI 1022334)
Consumption Percent of Total
Manufacturing 898 58
Agriculture 40 3
Mining 76 5
Construction 82 5
Electric Industry 451 29
Total 1547 100
Potential Reduction in Energy Use
Technologies mentioned in this report and elucidated in other references have the potential to reduce electricity use in electric utilities by 10% to 15%. Even a 10% reduction is enough electricity to power 3.9 million homes.1
The motivations for each participant in the electricity sector will vary. For example, independent power producers who participate in wholesale power markets get excellent, timely and direct cost signals from their wholesale markets. Typically, they pay attention to internal usage as it will provide more kWh to sell. However, generation owners who do not participate directly in wholesale markets have little motivation to reduce auxiliary power use.
With regard to transmission and distribution energy use, the costs of “losses” are usually factored into operations and maintenance costs. Improvements subsequently involve capital improvements with long payback periods. Unfortunately, long asset lives don’t usually lend themselves to widespread application of innovations.
Based on recent reports (CEE 2010), $5 billion is being spent annually in the U.S. on end-use energy efficiency. While these efforts are critical to achieving sustainability, expenditures of even a fraction of that amount on electricity use in generation and delivery will have a much broader impact on managing energy than energy efficiency programs do.
1 Based on Energy Information Agency data of 3,950,331 MWh x 103 delivered (2009). A 10% reduction or 1.09% overall reduction is equivalent to 4.3 x 10¹⁰ kWh.

1-4
Takeaway: Electricity consumption in electric utilities can be reduced by 10% to 15%.
Background
As illustrated in Figure 1-1, electricity use by the electric sector as addressed in this report includes electricity use in power plants to produce electricity and provide power to offices and other support facilities, as well as electricity losses
Figure 1-1 Electricity Use by the Electric Sector
Electricity is generated by several different processes, each using different raw resources and each involving different methods which convert falling water, solar energy, geothermal heat, or “fuel” to electricity. Most of the energy use in the generation of electricity occurs in thermal power plants when heat is converted into mechanical energy for turning electric generators. Other uses include power plant use of electricity and losses due to transmission and distribution of electricity from the power plant to the end user. Changes occur from year to year in the mix of inputs used to generate the electricity: coal, natural gas, petroleum products, hydropower, nuclear power, wind, sunlight, biomass, and geothermal heat.
Takeaway: Electricity is generated by a variety of sources whose combined output varies from year to year.
Distribution LossesTransmission LossesPower Plant Auxiliary Use
• Distribution Systems• Offices & Control
Centers
• Transmission Lines• Substations
• Power Plants• Generation Step-Up
Transformers
DistributionTransmissionGeneration
Distribution LossesTransmission LossesPower Plant Auxiliary Use
• Distribution Systems• Offices & Control
Centers
• Transmission Lines• Substations
• Power Plants• Generation Step-Up
Transformers
DistributionTransmissionGeneration
Type
of
Use
Typi
cally
D
escr
ibed
As
Cat
egor
yRaw Energy Source
(coal, gas, uranium,
wind, solar, etc.)
Electricity Delivered to Consumers
Type
of
Use
Typi
cally
D
escr
ibed
As
Cat
egor
yRaw Energy Source
(coal, gas, uranium,
wind, solar, etc.)
Electricity Delivered to Consumers

2-1
Section 2: Electricity Use in Power Plants Electricity is used in power plants to power a variety of types of electric equipment, typically called auxiliaries or “parasitic loads.” In thermal power plants, these devices could include:
Electric motors used to power: - Pumps - Gas booster compressors - Fans - Air compressors - Material handling (conveyors, coal mills, crushers, limestone slurry feed,
etc.) - Gas turbine starters - Soft starters for hydro turbines and synchronous condensers
Electric pre-heaters Environmental controls Building uses sometimes called house uses such as:
- Lighting - Air conditioning - Food service - Domestic water heating - Information technology (computers, monitors, Supervisory Control and
Data Acquisition Systems (SCADA), etc.)
Figure 2-1 illustrates the components of a typical steam-driven electric power plant. These auxiliaries are designed based on maximum economic performance and environmental compliance, not on minimum use of in-house electricity use.

2-2
Figure 2-1 Steam-Driven Electric Power Plant (Source: Wikimedia.org) (Need better Figure 2 which lists components in order of contribution/use starting with the heat source and ending with the transmission line)
Electricity usage in generation is a result of a comprehensive optimization. When utilities design a power plant, there are many design trade-offs between efficiency and cost. After the plant is built, however, fuel and electricity prices may well deviate from initial expectations, and energy use technology may involve creating opportunities for fresh re-optimization.
Auxiliaries are typically oversized by 5 to 20% in order to ensure they can meet design requirements. Many of them operate at full output whenever the plant is operational. Some of them, particularly pumps and fans, are modulated mechanically by the use of valves or dampers, and a few are modulated electronically by adjustable-speed-driven (ASDs) mechanisms. Modulating by mechanical means is generally much less efficient than by using ASDs.

2-3
Power plant engineers do not separately consider electric use in the production of electricity. However, they do monitor it. Generally, there are greater efficiency opportunities from major components such as boilers and turbines. The majority of the opportunities to reduce auxiliary power consumption are often during start-up and low load. Auxiliary uses are considered to be part of the heat rate calculation. Heat rate is a measure of the energy into a power production facility with respect to the electricity output. Overall unit heat rate is calculated by dividing total energy (btu) input by total net generation. Since gross generation is not used in this calculation, the electrical auxiliaries used to operate the plant can affect the heat rate significantly. For example, one study suggests that on the average, electrical auxiliaries affect utility heat rates in coal-fired power plants by 86 btu/kWh (90.8 kJ/kWh) (EPRI 109546).
Takeaway: There are a number of electrical-energy-consuming devices needed in power plants to facilitate the generation of electricity.
How Plant Auxiliaries Effect Heat Rate
Sub-optimal operation of auxiliaries unduly increases heat rate resulting in what is essentially “wasted electricity.” Equipment, such as pulverizers, condensate booster pumps, and hot well pumps, are needed for a specific unit load. Running the proper number of pulverizer mills for a given load can help reduce auxiliary electricity use. In addition, cooling tower fans or circulating pumps depend on unit load and also ambient conditions. Calculations can be developed which compare condenser and auxiliary effects to determine the optimum cooling requirements. The following steps can be taken at some plant when circumstances permit to reduce auxiliary power use. Operate equipment such as service water pumps and air compressors only as
needed. Maintain equipment whose power usage increases with deteriorating
performance such as pulverizers and pumps.
Maintain boiler ducts and expansion joints to prevent air leakage to conserve fan power.
Installation of variable speed drives for fans instead of using dampers for air flow control.
Outdoor lighting controlled by automatic sensors. Maintain heating and air conditioning controls for proper operation.
Turn off personal computers when not in use, especially overnight.
Optimizing steam plant air systems can also have a substantial impact on auxiliary power consumption. For example, STORM® (EPRI 1017546), specialists in combustion and power, have identified 22 heat rate variables, one of which is “Auxiliary Power Consumption/ Optimization,” defined as fan clearances, duct leakage, primary air system optimization, etc. Boiler air in-leakage contributes to wasted fan power and capacity. Several of these variables are illustrated in Figure 2-2.

2-4
Figure 2-2 Stealth Heat Rate Penalties That are Controllable by Boiler Combustion and Performance Optimization (Source: EPRI 1017546)
Takeaway: Power plant auxiliaries have a substantial effect on overall heat rate.
Detailed Analysis
EPRI conducted an evidence-based analysis of auxiliary or parasitic loads (internal plant usage of power) in the U.S. fossil and nuclear generation fleet, as a way of confirming (or not) generally held intuition about such power usage. As a general matter, conventional wisdom has roughly held that internal power need is roughly 5 to 10% of total generation, and that this usage can vary by fuel type. Power need is also thought to vary somewhat across such parameters as age of unit, size of unit, heat rate, and capacity factor/number of starts. Other variants can also include ambient operating temperature and cooling water temperature. EPRI analyzed publicly available data in order to back up (or refute) this fairly widespread professional intuition.

2-5
Using the commercially available Energy Velocity database,2 data was gathered on power generation across the U.S. fleet, for coal plants, nuclear plants and natural gas plants. The analysis strategy was to examine internal power usage (as a percentage of gross generation) across each fuel-specific fleet, and statistically (i.e., through regression analysis) relate such usage to key characteristics across the fleet, including size of unit, age of unit, heat rate, and frequency of unit usage (as embodied in such information as capacity factor and number of annual starts). Regression techniques have been used to help parse the internal power requirement (on average) to each key contributing characteristic.
Data Sources and Quality, and Statistical Approach
Gross generation, a larger number, measured prior to taking auxiliary power for internal usage as well as such conditioning parameters as age, size, heat rate and capacity factor are available by generation unit (from a database section called Unit Generation and Emissions – Annual, assembled from federal form USW EPA CEMS [fossil units]). Net generation, a smaller value than gross generation, measured after taking auxiliary power, essentially at the busbar, the amount that is supplied to the grid is available only at the aggregate plant level (from a database section called Monthly Plant Generation and Consumption, assembled from Federal Form EIA-923). Data were gathered and analyzed for five recent years, 2005 through 2009.
The first task was to match up all unit information, each to its corresponding plant, so a consistent gross- vs. net-generation composite database could be
2 Energy Velocity: Ventyx’s Velocity Suite, also known as Energy Velocity or EV, is a popular commercial source for energy data. It consists of database modules-EV Power with New Entrants, EV Market-Ops, EV Energy Map, EV Fuels, Power Transactions, EV Weather, and Grid Map - run inside the Velocity Suite and share its common interface and data tools. EPRI currently subscribes to EV Power and EV Market Ops.
EV Power combines all the data on the electric industry with complete coverage on IOU's, generation and transmission cooperatives, distribution cooperatives, municipal utilities, non-regulated market participants, and generating assets, and updates it daily with the latest available information. EV Power with New Entrants includes:
• Existing and future generating capacity
• Power station production costs
• Operating statistics for companies and plants
• Market price data
• Regulated financial data
• SEC financial data
• Retail and wholesale power volumes and dollars
EV Market-Ops’ primary components are hourly data for generation, heat rates, emissions (EPA CEMS), loads and prices (FERC and ISO). Unit costs are linked to generation and Locational Marginal Price data to enable EV Market-Ops users to review hourly operating revenue and profit streams for nearly 2,300 of the nation's largest generating units. EV Market-Ops also compiles and formats extensive supply and demand data for use as inputs to most market models. The data is updated daily.

2-6
derived. This first data sanitation task led to some culling of entries3 due to inconsistencies (e.g. data not reported for both data sets, net generation in some cases larger than gross generation, etc.) and imperfect plant-to-unit correspondence. Once a sanitized database was assembled, a variety of regression experiments was run in an effort to test which explanatory variables were most critical in explaining the range of internal usage variation. A summary of the results is presented below.
Results
Across the generation fleet, there are variations in internal power usage. These may be explained in part by variations in parameters that are duty-cycle or efficiency-related including size, age, heat rate, number of starts, and the like. They may also be explained in part by parameters that can be thought of as configuration-related, namely the presence/absence of particular types of pollution control equipment (i.e., scrubber, electrostatic precipitator, etc.).
The analysis did not explain variations through the detailed differences in pollution control equipment. Overall, the variations across plants and units were simply too fine and they were mostly swamped by macro-level indicators such as age and duty cycle. However, macro-level indicators were somewhat useful for the coal and nuclear fleets, and largely conformed to conventional wisdom as suggested above. These results are presented below.
Coal Fleet
Roughly 350 plants were in the data sample after sanitizing as explained above. These data were separately analyzed by individual coal type as well, but that parsing yielded no significant difference in results from the aggregate analysis. The average internal power usage across the sample was 7.6%, with a standard deviation of 2.9%. The summary regression results across all plants for all five years are as presented Table 2-1 below.
3 A small percentage of data was discarded for the coal and nuclear generators, a much larger percentage for the natural gas set (see more discussion about the natural gas fleet below).

2-7
Table 2-1 Internal Power Use: Coal Generation
Percent Internal Power = A + B1 * Capacity + B2 * Heat Rate + B3 * Capacity Factor + B4 * Average # Starts + B5 * Average Age + B6 * Year of Data Point
Estimated Parameter Value
A (equation intercept) -2.75
B1 (plant capacity) -8.07 x 10⁻⁶
B2 (composite heat rate) 5.19 x 10⁻⁶
B3 (capacity factor) -.025
B4 (average annual number starts) .00013
B5 (average age of plant) -5.86 x 10⁻⁵
B6 (year of data point 2005-2009) .0014
R2 Value 18%
Overall Average % Internal Power Usage
7.6%
Standard Deviation % Internal Power Usage
2.9%
In the first instance, there is considerable scatter in these results, as seen by the very low R2 value (a measure of how well the key independent variables can explain the variations in internal power fraction; in this case not very much). In examining the full data set (roughly 1750 data points), the internal power fraction runs from as low as 4% to as high as 12 to 13%. Of the key driving variables tested, plant heat rate seems to be the most sensitive one, but extreme variations in heat rate only seem to capture about 40% of that range. The rest of the variation seems to be noise.4
That said, most of the key estimated coefficients seem to behave in the right way. Larger plants will tend to have larger capacity factors (more base-loaded), and this tends to keep internal power usage down (coefficients B1 and B3 are negative). Similarly, lower heat rate implies better efficiency (also leading to more consistently base-loaded operation), again tending to keep power usage down (coefficient B2 is positive). The other coefficients are harder to reconcile, but happily their influence is much more minor in explaining variation.
In summary, these data do support the underlying premise of internal power usage. Larger plants and more efficient plants tend to run more consistently, and start and stop less frequently; therefore, they tend to use less electrical energy overall internally. The age of the plant, on the other hand, does not appear as relevant as once thought based on this investigation. In part, this is due to the fact that although newer plants are designed to be more efficient, they are
4 Obscure, asystematic characteristics of individual plants, data inconsistencies, and the like.

2-8
required to be fully outfitted with emission controls and often with mechanically driven cooling towers. As such, newer plants do not appear to be made efficient.
Takeaway: Power plant auxiliary electricity use averages 7.5% for coal generation.
Impact of Emission Controls on Coal-Fired Power Plants
There are a number of emission control options that are driving added auxiliary power requirements for coal-fired power plants. Figure 2-3 illustrates the various options for emission controls and their typical location in a modern power plant. To highlight the range of impact which one of these processes can have on auxiliary power requirements, EPRI studied a variety of Flue Gas Desulfurization (FGD) technologies.
Figure 2-3 Emission Control Options (Source: EPRI 1019003)
The effects of applying several alternative FGD techniques on the connected load of a 500 MW coal-fired power plant are listed in Table 2-2 and 2-3.
Legend: SCR – Selective Catalytic ReductionESP/FF – ElectroStatic Precipitator/Fabric FilterPM – Particulate Matter
Legend: SCR – Selective Catalytic ReductionESP/FF – ElectroStatic Precipitator/Fabric FilterPM – Particulate Matter

2-9
Table 2-2 Auxiliary Power for Various Flue Gas Desulfurization (FGD) Processes (EPRI 1019003)
Limestone Forced
Oxidation (LSFO)
Chiyoda Ammonia Wet Mag-Lime
Auxiliary Power at Full Load (kW)
10 Reagent Feed System =
240 240 610 135
20 SO2 Removal System =
4,859 1,144 4,185 1,966
30 Flue Gas System =
2,610 3,636 1,657 1,657
40 Regeneration = 0 0 0 0
50 Byproduct Handling =
0 0 1,106 0
60 Solids Handling =
38 48 76 118
70 General Support Equipment =
49 50 51 47
90 Baghouse/ESP
Subtotal 7,797 5,118 7,687 3,923
Auxiliary Power as % of Gross (500 MW)
1.56 1.02 .154 0.78

2-10
Table 2-3 Auxiliary Power Consumption of Lime Spray Dryer (LSD) and Circulating Dry Scrubber (CDS) Flue Gas Desulfurization (FDG) on a 500 MP Plant (EPRI 1019003)
LSD CDS
Auxiliary Power at Full Load (kW)
10 Reagent Feed System = 134 134
20 SO2 Removal System = 711 522
30 Flue Gas System = 2,840 3,404
40 Regeneration = 0 0
50 Byproduct Handling = 0 0
60 Solids Handling = 101 61
70 General Support Equipment = 40 41
90 Fabric filter/ESP 711 714
Subtotal 4,537 4,875
Auxiliary Power as % of Gross (500 MW)
0.91 0.98
These data suggest that applying FGD to a coal-fired power plant alone can increase auxiliary power usage from between .154% and 1.56%.
Takeaway: Emission controls can substantially impact electricity consumption in coal power plants.
Nuclear Fleet
For the nuclear analysis, 60 plants were represented after data cleanup. Altogether about 280 data points were used across the five-year analysis period. The average internal power usage across the sample was 4.1%, with a narrow standard deviation of 1.3%. The summary results are presented in Table 2-4 below.

2-11
Table 2-4 Internal Power Use: Nuclear Generation
Percent Internal Power = A + B1 * Capacity + B2 * Heat Rate + B3 * Capacity Factor + B4 * Average # Starts + B5 * Average Age + B6 * Year of Data Point
Estimated Parameter Value
A (equation intercept) .965
B1 (plant capacity) 9.03 x 10⁻⁷
B2 (composite heat rate) -3.59 x 10⁻⁶
B3 (capacity factor) -.00998
B4 (average annual number starts) .00013
B5 (average age of plant) -8.21 x 10⁻⁵
B6 (year of data point 2005-2009) -.00045
R2 Value 3.3%
Overall Average % Internal Power Usage
4.1%
Standard Deviation % Internal Power Usage
1.3%
Once again, the R2 value is even lower than for the coal analysis, an indication of a somewhat suspect data set. Among the nuclear plants, the variation in electrical energy usage is even narrower (and lower), between 2% and 6%. This is not surprising in that operational and other variations across the nuclear fleet are narrower as well.5
In this formulation, most of the key driving coefficients seem to have the wrong sign, but this may simply be due to noise once again, as none of these parameters seem to have a large influence on variation across their normal range. In fact, the normal range of internal power usage is itself very narrow in the nuclear space. Further, the key driving parameters also exhibit very narrow variation; capacity is almost always in the 800 to 1000 MW range, capacity factor is almost in the 85 to 95% range, starts per year are always in the 1 to 5 range, and heat rate is very narrow in variation as well. All in all, with so little variation in power usage across the population, the explanatory data does not help in sorting out the key drivers.
The good news in this is that there appears to be pretty small variation across the nuclear fleet in internal power usage. This in itself is unsurprising, given the significant uniformity across this fleet to begin with possibly since the explanatory data cannot support any further discrimination from this starting point.
Takeaway: The average internal power usage in the U.S. nuclear fleet is 4.1%.
5 Due to a very uniform duty cycle, strict regulations as to needed equipment, and similar issues.

2-12
Natural Gas Fleet
There is a great deal of information on natural gas generation available, but little of it is useful for analysis. Generally, it suffers from the same problems as coal and nuclear – gross generation at the unit level, net generation at the plant level – but much more so due to the wide variation in duty cycles among gas generators. EPRI was able to find seemingly consistent data only among the natural gas merchant fleet, as all of this information came from the same source.
There is a wide variety of duty and internal station use. There are units that operate conventionally, sending most of their generation onto the grid and reporting station usage in the expected 1 to 10% range. There are also units that operate quite often in spinning reserve mode,6 and report essentially all generation as internal usage. And there are units that seem to report no internal usage, which could be due to data error or misreporting.
In the natural gas fleet, a key issue is likely data collection and reporting. Small (<25 MW) units don't have to report in CEMS but may or may not be included in the plant-level data. The plant data reported in the EIA Form 923 is for “utility” power plants. Thus, merchant plants may or may not be reported, and this may change across years as the state of regulation changed in particular jurisdictions. Another likely problem could be great heterogeneity in the fleet itself. The gas fleet encompasses older steam plants, combined cycle plants that are used in baseload duty all the way through cycling, two-shifting and even strict seasonal usage, not to mention the gas turbine peakers.
Industry estimates for auxiliary power consumption in combustion turbines varies, but based on engineering estimates, the auxiliary power loads in a simple-cycle plant are about 0.5 to 0.8% of net power after the generator terminals (including step-up transformer losses). This could double if a fuel gas compressor is required.
The auxiliary power loads in a combined-cycle plant can vary from about 1.3% to 2%. One factor is the heat rejection system design used (direct cooling with cold water the lowest, air-cooled condensers the highest). Again, fuel gas compressors can add another 0.5%. For typical CTCC with cooling towers, an estimate of about 1.6% auxiliary load is used, which translates to about a 1% decrease in overall efficiency from gross to net after generator terminals (including step-up transformer losses).
What seems clear at minimum is that many of these conventionally used units do report internal usage in the 1 to 10% range, consistent with the range seen in both coal and nuclear fleets. To test this, the researchers further culled the merchant fleet data to retain only those units that reported capacity factor in the range of 10% to 100% (thus hopefully eliminating majority spinning reserve units 6 Spinning reserve is keeping units on-line and electrically synchronized, but not producing electrical energy so as to have them ready to immediately balance the grid against sudden increases in load or against the loss of other generation or transmission.

2-13
and other anomalies). This left over 3,500 observations, exhibiting a mean internal usage of 3.45% with a standard deviation of 2.8%.
On the one hand, gas plants would be expected to use less internal power as they would be expected in general to have less internal equipment (i.e., cooling and environmental equipment and fuel handling/transport in fossil units) to keep running. On the other hand, they would as a group tend to cycle more and thus end up using more energy relative to output. The aggregate effect is indeterminate, as compared with the coal or nuclear fleets. Beyond this simple observation of internal usage, the researchers were not able to discriminate usage any further by size, capacity factor, or related parameters.
Takeaway: Internal power use in gas generation varies considerably from 1% to 10%.
Electricity Uses in Renewable Power Production
The percentage of hydroelectric power generation, based on 2010 data from EIA, is approximately 4.08%. Electric energy use in hydroelectric power stations is principally due to excitation, with some uses for lighting, house loads, and transformer losses. There is no data available documenting the quantity of this use. One reference to an Indian tariff (India, 1995) suggests that those in hydroelectric plants provided with static excitation an average of 0.3% of the energy generated is consumed. For plants with rotating exciters mounted on the generator shaft, energy consumption is considered “nil.” No energy consumption was considered for hydrogenation in this study.
The percentage of the remainder of renewable power production, excluding hydroelectric power generation, is also small (approximately 4.0% according to Electric Power Monthly data from EIA for 2010). In part due to this small percentage and the absolute lack of significant data, use of electricity in renewable power production is not included in this study. However, it is useful to elucidate the uses of electricity in renewable power generation facilities.
Wind – The use of electricity in wind power production is in the inverter which converts the variable frequency/variable voltage output of the generators to constant frequency/constant voltage.
Solar PV – The use of electricity in solar photovoltaic power production is principally in the inverters which convert the direct current (DC) output of collectors to alternating current (AC) for use in buildings or distribution via the electrical grid.
Solar-Thermal – The use of electricity in solar-thermal power generation would involve energizing technological components similar to those in thermal power plants. However, to date, there are only a handful of these types of power plants in the world.

2-14
Biomass – The production of electricity using biomass is insignificant at present and is currently included in the thermal power analysis included in that section.
Wave and Kinetic – The use of electricity in wave and kinetic energy power production is not well known or understood. At the present, these applications are limited to a few select research efforts.
Takeaway: While there is some internal power use in renewable power production, the total is thought to be small and there is little data available to assess it.
Previous Studies
A number of individual power producers have estimated the auxiliary power requirements of their units. Table 2-5 summarizes an analysis of auxiliary power consumption in India’s power plants. This analysis suggests that consumption ranges between 6.33% and 8.89%.
Table 2-5 Auxiliary Power Consumption in India Power Plants (Performance 2007)
Region Percentage Auxiliary Power Consumption
2005-06 2006-07
Northern 8.89 8.62
Western 8.30 8.16
Southern 8.16 8.02
Eastern 8.39 8.37
Northeastern 6.42 6.33
All India 8.44 8.29
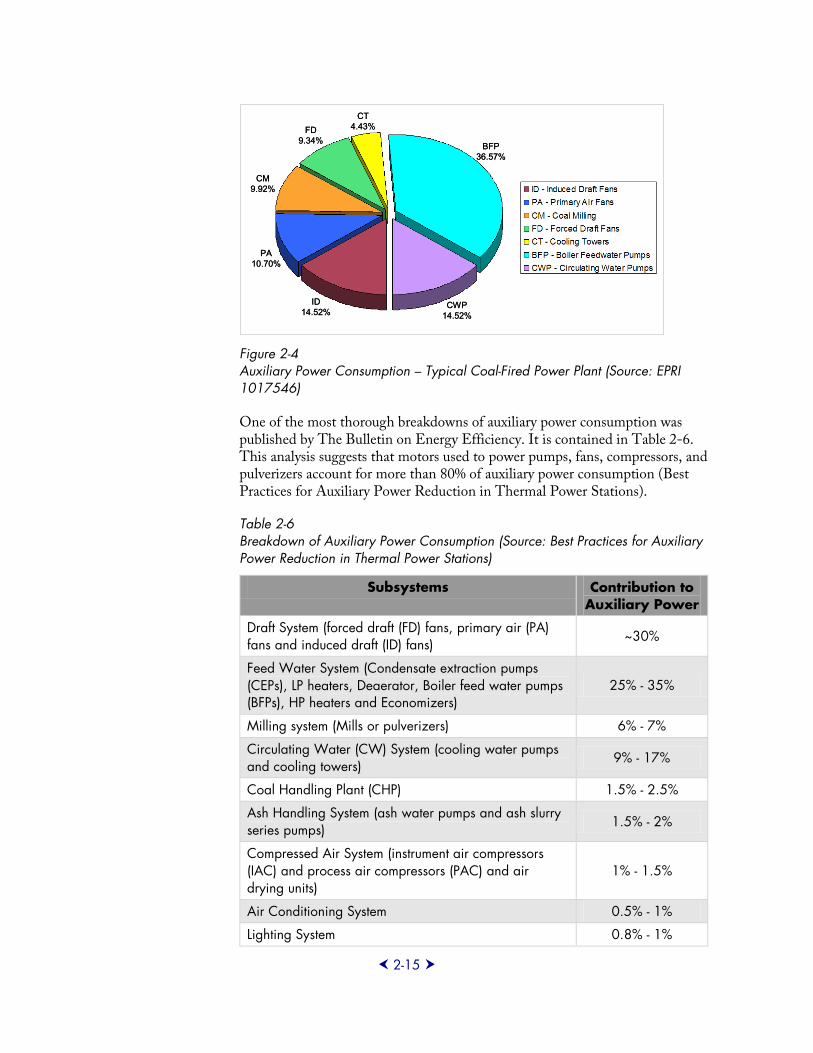
Evonik Energy Services conducted an actual analysis of auxiliary power consumption at a typical power plant. These results are depicted in Figure 2-4. In this case, the total plant auxiliary power requirement was estimated to be between 9.38% and 9.85% of total (EPRI 1017546).
2-15
Figure 2-4 Auxiliary Power Consumption – Typical Coal-Fired Power Plant (Source: EPRI 1017546)
One of the most thorough breakdowns of auxiliary power consumption was published by The Bulletin on Energy Efficiency. It is contained in Table 2-6. This analysis suggests that motors used to power pumps, fans, compressors, and pulverizers account for more than 80% of auxiliary power consumption (Best Practices for Auxiliary Power Reduction in Thermal Power Stations).
Table 2-6 Breakdown of Auxiliary Power Consumption (Source: Best Practices for Auxiliary Power Reduction in Thermal Power Stations)
Subsystems Contribution to Auxiliary Power
Draft System (forced draft (FD) fans, primary air (PA) fans and induced draft (ID) fans)
~30%
Feed Water System (Condensate extraction pumps (CEPs), LP heaters, Deaerator, Boiler feed water pumps (BFPs), HP heaters and Economizers)
25% - 35%
Milling system (Mills or pulverizers) 6% - 7% Circulating Water (CW) System (cooling water pumps and cooling towers)
9% - 17%
Coal Handling Plant (CHP) 1.5% - 2.5% Ash Handling System (ash water pumps and ash slurry series pumps) 1.5% - 2%
Compressed Air System (instrument air compressors (IAC) and process air compressors (PAC) and air drying units)
1% - 1.5%
Air Conditioning System 0.5% - 1% Lighting System 0.8% - 1%
ID14.52%
CWP14.52%
PA10.70%
CM9.92%
BFP36.57%
CT4.43%FD
9.34%
ID14.52%
CWP14.52%
PA10.70%
CM9.92%
BFP36.57%
CT4.43%FD
9.34%

2-16
The share of total plant auxiliary electrical power in the fleet of fossil-fuel steam plants has been increasing due to several factors:
Addition of anti-pollution devices such as precipitators and sulfur dioxide scrubbers which restrict stack flow and require increase in in-plant electric drive power. About 40% of the cost of building a new coal plant is spent on pollution controls, and they use up about 5% of power generated (Masters, 2004).
Additional cooling water pumping demands to satisfy environmental thermal discharge.
A trend away from mechanical (e.g., condensing steam turbine) drives to electrical motors as the prime mover for in-plant auxiliary pump and fan drives.
According to GE Electric Utility Engineering, for pulverized coal (PC) power plants, the auxiliary power requirements are now in the range of 7% to 15% of a generating unit’s gross power output. Older PC plants with mechanical drives and fewer anti-pollution devices had auxiliary power requirements of 5% to 10% (GE Electric Utility Engineering, 1983). The feedwater pump power required to reach the much higher boiler pressure is approximately 50% greater than in drum boiler designs (ABB, 2009).
As shown, the auxiliary power load as a percent of gross can be as high as 1.56. This does not reflect the actual electricity consumption which can vary by mechanical loading and hours used.
Takeaway: EPRI’s analysis is consistent with previous studies.
How Can Auxiliary Power Consumption be Reduced?
The key technology which can be used to reduce auxiliary power consumption in thermal power plants is the incorporation of adjustable-speed-drive mechanisms for plant motors. These mechanisms allow the speed of motors to be varied to match the mechanical load.
Since pumps and fans typically run at partial load, energy savings can be achieved by controlling their speed with variable-speed drives. A small reduction in speed can make a big reduction in the energy consumption. For example, a pump or a fan running at half speed consumes as little as one-eighth of the energy compared to one running at full speed. Figure 2-5 illustrates this.

2-17
Figure 2-5 Energy Savings Potential of Variable-Speed Drives (VSD) (Source: ABB Medium Voltage Drives)
Figure 2-6 illustrates a motor-drive system which is an excellent candidate for an adjustable-speed drive (ASD) mechanism.

2-18
Figure 2-6 Load Duty Cycle: Example of Excellent Adjustable Speed Drive Candidate (Source: ABB 2009)
Figure 2-7 illustrates a comparison of a pump system where mechanical control and ASD control are applied. Systems loaded up to 90% can benefit from the application of ASDs.
Figure 2-7 Example Losses In System Elements With Mechanical Control Versus ASD Control at Four Load Levels (Source: ABB 2009)
30 35 40 45 50 55 60 65 70 75 80 85 90 95 1000
5
10
15
20
25
Percent Rated Flow
PercentOperating
Hours
Example of an Excellent ASD Candidate
30 35 40 45 50 55 60 65 70 75 80 85 90 95 1000
5
10
15
20
25
Percent Rated Flow
PercentOperating
Hours
Example of an Excellent ASD Candidate

2-19
In addition, there are other Benefits of Variable Speed Control including: Soft starting of motor and pump
Reduction in mechanical flow regulator wear Reduction in motor and pump wear Reduction in short circuit duty on auxiliary bus
High power factor operation
There are a number of candidate applications for variable-speed dries in power generation. These include those listed in Table 2-7.
Table 2-7 Applications of Variable Speed Drives in Power Generation
Pumps Fans Other
• Boiler feed-water pump
• Condensate extraction pump
• Cooling water pump • District heating
circulation pump • Limestone slurry feed
and absorbent • Circulation pump
• Primary air fan • Secondary air fan • ID fan • ID booster fan
• Conveyor • Coal mill • Oxidation air
compressor • Gas turbine starter • Fuel gas booster
compressor
Even two-speed motors can offer a significant improvements over simple on/off operation, particularly for air-cooled condensers and perhaps forced draft cooling towers.
Nuclear House Load Reduction
In nuclear power plants, some of the largest house loads (especially those than can sometimes be shed and/or reduced in cold weather) are mechanical draft cooling tower fans and circulating water pumps. Also, some nuclear plants use steam-driven feed pumps which offer reduced house loads over motor-driven feed pumps. Some boiling water reactors (BWRs) have gone to solid-state variable-speed RCP control which is much more efficient than what was replaced. Table 2-8 lists connected load for a sample of nuclear power plants.
Most of the discussion in this document addresses issues related to turbine output and heat rate. However, the bottom line in terms of revenue and O&M costs is net unit output, defined as generator output less the unit electrical loads. Many of the unit’s electrical loads are required to operate the plant. Included are reactor coolant pumps, circulating water pumps, condensate pumps, and motor-driven feedwater pumps. Therefore, only a fraction of the total unit electrical load can be a potential for consideration in improving net unit output. Despite this

2-20
admonition, the performance engineer should have a clear list of the unit’s electrical loads and considerations for reduction of power consumption and power factor improvement. Methods of power reduction include use of more efficient motors and securing some pumps during extended part-power operation or using variable-speed motors. The effects on operating limits and component performance, such as the condenser pressure with reduced cooling flow, must be evaluated.
Table 2-8 EPRI Plant Support Engineering House Loads Reduction Survey
Plant # Units
Ave. Gross Generation
(MWe)
Net Generation
(MWe)
House Loads (MWe)
Robinson 1 752.5 718 34.5
Davis Besse 1 925 881 44
Byron 2 1175 1120 50/unit
Braidwood 2 1175 1142 33/unit
Palisades 1 821 781 40
Waterford 3 1 1147 1100.5 46.5
Grand Gulf 1 1289 1240 49
Oyster Creek 1 660 640 20
TMI-1 1 858 810 48
Clinton 1 970 929 39 winter
43 summer
Peach Bottom 2 1159 1119 winter
1093 summer 30 winter
60 summer
Susquehanna 2 1140 1100 40
Ginna 1 492 468 24
San Onofre 2 2280 2170 113
Kewaunee 1 545 518 27
Wolf Creek 1 1226 1176 50
Average % of Gross
Takeaway: There are a variety of technologies that can be applied which would reduce internal power consumption in power plants.

3-1
Section 3: Electricity Use in Electric Transmission and Distribution Systems
Electric transmission and distribution uses of electricity occur throughout the system. The primary uses include losses in cables and conductors, losses in transformers, powering substations and their auxiliaries, energy used in FACTS (Flexible AC Transmission Systems), and losses in powering and extracting energy from storage. Storage uses include pumping and generation in pumped storage and compressed air energy storage, as well as in converting to DC for battery storage and reconversion to AC upon discharge.
Substation auxiliary use includes electricity to power fans, air conditioning, space heating, lighting, and information technology, as well as cooling for FACTS devices and superconducting cables.
Historic Transmission and Distribution Use
Figure 3-1 depicts the Energy Information Administration’s estimate of 2009 transmission and distribution (T&D) energy use (losses). It includes losses that occur between the point of generation and delivery to the customers as well as collection from differences and non-sampling error.
Figure 3-1 Net-Generation-to-End-Use Flow (Source: EIA 2009)

3-2
Transmission and Distribution
Electric power transmission and distribution (T&D) systems electricity use has averaged 6.3% and ranged between 6 and 7% between 2002 and 2009 (see Figure 3-2). These uses are inherent and necessary in the physics of conductance and transformation of electricity. However, there are opportunities to reduce these uses once they are better understood.
Figure 3-2 Transmission & Distribution Losses (Source: Energy Information Agency (EIA) Electricity Overview 1948-2009)
Naturally, transmission electricity use varies widely. For example, a confidential report by a European utility with a concise service area indicates an average transmission electricity use of only 1.7%.
Takeaway: Transmission and distribution electricity use (losses) average 6.3% in the U.S.
Distribution
The most extensive study of electric distribution system use was performed by EPRI in what is called the Green Circuits Project. The Green Circuits collaborative project was initiated after a series of industry workshops held in late 2007 to 2008, in which more than 30 electric utilities explored issues with distribution system efficiency. Workshop conclusions formed these project objectives:
Develop and demonstrate a consistent method to quantify losses. Compile credible data to quantify the costs, benefits, and risks of using
energy efficiency and loss mitigation as a part of planning.
5.4%5.9%
6.2%6.4% 6.4%
6.0%6.4%6.5%6.7%6.7%
0%
1%
2%
3%
4%
5%
6%
7%
8%
2000 2001 2002 2003 2004 2005 2006 2007 2008 2009
Loss
es
Year

3-3
Demonstrate real-life examples in which options for efficiency improvement have been implemented, and validate realized efficiency gains.
In a project called “Green Circuits,” EPRI worked with more than 24 utilities to characterize 85 circuits across 33 states and 4 countries to identify existing circuit losses, and prioritize potential options to improve efficiency. This effort resulted in a comprehensive database that improves understanding of the technical, economic, and implementation issues with various distribution-system efficiency measures.
In the Green Circuits Project, 65 circuits were modeled. The results are illustrated in Figure 13. They point to the following: Annual energy losses: Total distribution feeder annual energy losses,
excluding the substation transformer losses, averaged 3.5% of total consumption for the feeder and ranged from approximately 1.5% to 8.6%. - Primary line losses: Line losses averaged just under 1.5% of total
consumption. Circuit length is a reasonably good predictor of percentage of line losses.
- Transformer no-load losses: These losses averaged about 1.4% of total energy consumption and ranged from approximately .5% to 3.25%. They were the most consistent across circuits, depending on transformer age and utilization.
- Secondary-line losses: These losses are low, averaging 0.3% of consumption with a maximum of only 0.8%. Because detailed secondary and service drop lines were available for only a few circuits, results to date are largely based on assumptions.
Peak demand losses: At peak load, losses average 4.2% of peak demand and range from approximately 1.5% to 13.5%.
Historically, power delivery electricity uses, especially distribution system uses, have often been a secondary priority because of uncertainties in quantifying improvements and the difficulty in obtaining sufficient return on investment for projects undertaken. Recently, an increased industry and regulatory focus on climate change and energy efficiency has led to a renewed evaluation of power distribution efficiency.
A clear understanding of the magnitude of distribution electricity use losses is the first step in improving system efficiency. Several recent advancements have made it possible to more readily identify options for reducing distribution loss and improving overall system efficiency, including: Improved metering that provides data on end-use patterns and diversity
factor.
Improved communication and control capabilities that allow more precise voltage and reactive power (var) control.

3-4
An overall improvement in modeling capabilities that allows for better loss estimation, targeting of solutions, and ways to test and identify improvements.
While specific utility and circuit characteristics often dictate achievable efficiency levels, the wide variation in distribution losses reported from one utility to another suggests that some utilities or some circuits particularly have significant opportunity for more efficient operation.
In addition to reducing electricity use, electric distribution utilities can increase efficiency through management of end-use customer consumption. Utility voltage control can be used to reduce energy consumption and peak demand. There is still significant work needed to quantify the potential gains through voltage reduction across regions and load types. Existing work in this area may need updating because end-use loads are changing with less use of purely resistive loads and pure motor loads and more use of fluorescent lights, adjustable-speed drives, and electronics.
Analytical Framework
Measuring distribution system electricity use is not a straightforward process because losses are not a quantity that can be explicitly measured at any given point in the system. Rather, measurement of system losses requires netting the energy flowing into the system against the energy flowing out of the system at any point in time. Although significant advances are presently being made in the extent and capabilities of metering on distribution systems, most existing systems do not have sufficient metering to directly measure electricity use. As such, distribution system electricity uses generally have to be calculated.
However, calculating the total electricity use for a distribution system is not a simple process. The electric system electricity uses in a distribution system primarily consist of heating losses in the distribution lines and the heating losses and core losses in the connected transformers. The heating losses vary as a function of the square of the current flowing through line or transformer. Similarly, the transformer no-load losses vary as a function of the square of the excitation voltage. In order to exactly calculate the total energy losses for a distribution system or circuit, one would have to represent all of the system components that contribute to losses and the varying currents and voltages through the system.
However, models of a distribution are typically used to analyze peak-demand power flows to ensure that there is sufficient power-delivery capacity to meet the peak load demand. These models frequently include only the components of the primary distribution system (i.e., the medium-voltage, or MV, system) up to the service transformer and occasionally only the feeder three-phase mains. Some utilities have begun to include service transformers and low-voltage service conductors in their models. Inclusion of the full primary and secondary systems, as well as analysis of more than just the peak period, provide for a more thorough evaluation of electricity uses in a distribution system. Representing the system in

3-5
more detail, however, is more time-consuming both from a model-preparation and analysis-computation standpoint.
For the Green Circuits collaborative project, high-fidelity models of each distribution feeder were developed, which include a representation of all of the electrical components that contribute to losses. As such, each Green Circuits feeder model includes the following: Substation power transformer(s) Primary lines (three-phase mains and single-phase laterals)
All distribution service transformers Secondaries/services (not included on some feeders) Voltage-regulation controls (load tap-changing transformers, regulators,
capacitors)
In addition to representing the full extent of the physical system, temporal variation in the load served from the circuit throughout a full calendar year is also represented. This is accomplished by the following: Individual customer loads are either assigned based on data provided by the
host utility or allocated to each customer point based on the peak demand value at the head of the circuit.
Each individual customer load is assigned an hourly-resolution annual load shape that represents the manner in which that load varies throughout a "typical" year at the point in which the load is electrically interconnected.
The general process of developing the base case model for a given circuit is shown in Figure 3-3. The bulk of the electrical connectivity of a given circuit is obtained by converting a pre-existing model of the circuit either from the utility's own commercial analysis package format or GIS format. The base network is then augmented with additional circuit data that is typically not included in GIS or typical peak power-flow-based models. This information typically includes the circuit voltage-control parameters such as load tap-changing transformer (LTC), regulator, and switched capacitor parameters. Characteristics of line transformer loss and secondary lines are also typically not included in base models but are added in our base-model-development process. Finally, annual load shapes are defined from historical data and are attached to individual loads in the model
Figure 3-3 General Process for Developing Green Circuits Base-Case Model
Convert Native Electrical Model
or GIS data
Add LTC Regulator &
Capacity Control Settings
Add Xfmr Loss Data &
Secondaries/ Services
Allocate Loads & Assign per Phase
Shapes
Convert Native Electrical Model
or GIS data
Add LTC Regulator &
Capacity Control Settings
Add Xfmr Loss Data &
Secondaries/ Services
Allocate Loads & Assign per Phase
Shapes

3-6
Once the base-case model is developed, long-term dynamic simulations of the full electrical model serving all circuit loads through an annual hourly-resolution load cycle are conducted. Various electrical outputs for the year are collected from the simulation and compared with historical measured data to validate the model. Quantities such as active and reactive power flows and voltage at available locations on the circuit are very useful in validating that the modeled circuit is representative of the actual circuit operation.
Once a base-case model is validated, the base case annual simulation for each circuit is used to determine the "base case" losses that are incurred on the circuit. The base-case losses are broken down as to the specific sources of the losses (primary vs. secondary, load vs. no-load, etc.). Losses are normalized to either the total annual energy consumption (energy losses) or the peak demand (peak losses).
Reducing Distribution Electricity Use
An adoption rate for each of the different technologies has been considered in the analysis, based on the cost of implementation and the benefits. The efficiency gains are significant and worthy of inclusion in any cost/benefit analysis. Feedback on the approach and viability of measures is welcome.
Figure 3-4 U.S. Electricity Sector’s Potential to Reduce CO2 Emissions Based on Deploying a Portfolio of Advanced Technologies (EPRI 2007)
In 2007, EPRI released its first Prism analysis (EPRI 2007) providing a technically and economically feasible roadmap for the electricity sector to reduce

3-7
its gas emissions. The Prism analysis provided a comprehensive assessment of potential CO2 reductions in key technology areas of the electricity sector. In 2009, EPRI updated the analysis to reflect new technologies and analysis features.
The analysis evaluates reductions in energy in two main categories: reductions in end-use consumption and reductions of distribution loss. Distribution losses are composed of line losses and transformer losses are estimated to be 4% of the total energy generated in the electricity sector. While this percentage may appear relatively low, the total amount of energy involved is considerable. The percentages equates to about 118 million MWh lost each year, based on a total U.S. annual generation of 3940 billion KWh in 2008. (EIA: Annual Energy Outlook Early Release Overview – December 14, 2009)[EIA2 2009a]
Therefore, the top line of the distribution system efficiency prism shown in Figure 3-5 is based on 4% of the estimated U.S. Energy Information Agency’s (EIA’s) 2009 Annual Energy Outlook [EIA 2009b] base case for CO2 emissions from the U.S. electricity sector. Each color represents the additional reduction in emissions based on the assumption of technically feasible levels of technology performance and deployment. The analysis illustrates the overall reductions achievable using available technologies.
Figure 3-5 Distribution Feeder Annual Energy Use
0
1
2
3
4
5
6
7
8
9
10
1 3 5 7 9 11 13 15 17 19 21 23 25 27 29 31 33 35 37 39 41 43 45 47 49 51 53 55 57 59 61 63 65
Feeder Number
Perc
ent
Average - 3.5%

3-8
The technical measures are stratified into two parallel efforts. The first measure reduces end-use energy consumption with conservation voltage reduction (CVR). Lower voltages to end-use devices reduce consumption. For every 1% reduction in voltage, end-use loads use approximately 0.7% less energy. The second measure captures approaches that will directly reduce distribution system losses. This includes approaches to reduce line losses, including phase balancing, management of reactive power needs, better application of transformers, use of more efficient transformers and conductors, and better system configurations.
There are a number of utilities whose distribution energy consumption tends to be higher than the U.S. industry average.
Takeaway: The electricity use on the average distribution feeder is approximately 3.5%. There are many opportunities to reduce distribution losses.
Transmission
To estimate transmission energy use, the author reviewed 20 studies conducted by various organizations on specific transmission corridors (or lines?). These studies are summarized in Table 3-1. Using demand losses as a surrogate for annual energy losses, the average demand loss for these 20 studies is 2.97%.
Substation Electricity Use
The author found insufficient data to conduct a thorough analysis of substation electricity use. To date, substations have not been designed to enable internal usage to be metered separately. Engineering estimates indicate that there appears to be substantial opportunities for reduction in substation electrical use. A preliminary study conducted by EPRI and Consolidated Edison Company of New York (ConEd) indicates that, based on 100 substation facilities, 683 megawatt hours per year are consumed to power substation auxiliary loads in these 100 substations (Bose 2011).
While ConEd substations may not be the same as all other utilities, they contain many of the typical auxiliary loads which substations have. Table 3-2 lists the equipment and nameplate power ratings found at ConEd substations.
All of the substation auxiliary electricity usage is embedded in transmission electricity use.
A further example, studies performed in Canada (BCTC Transmission System Loses, 2009) cited BC Hydro’s total transmission energy use losses at approximately 6%. This again, due to longer transmission lines.

3-9
Table 3-1 Transmission Energy Use
System/Utility/ Region
Peak Load (MW)
Demand Losses (MW)
Demand Losses (%w.r.t load)
Net Inter-
change (MW)
Net Load
(load + inter-
change)
Demand Losses
(% w.r.t NET
load)
Source
Alliant Energy West (ALTW) 4.792 107 2.2% -15 4.777 2.2%
Midwest ISO Transmission Expansion Planning 07 – for 2013 scenarios
Xcel Energy North (XEL) 12.964 380 2.9% -2.072 10.892 3.5%
Midwest ISO Transmission Expansion Planning 07 – for 2013 scenarios
Great River Energy (GRE) 1.971 100 5.1% 555 2.526 4.0%
Midwest ISO Transmission Expansion Planning 07 – for 2013 scenarios
Hoosier Energy (HE) 855 42 4.9% 788 1.643 2.6% Midwest ISO Transmission Expansion Planning 07 – for 2013 scenarios
Vectren Energy Delivery of Indiana (Vectren)
2.197 37 1.7% -633 1.564 2.4% Midwest ISO Transmission Expansion Planning 07 – for 2013 scenarios
Indianapolis Power & Light Co. (IP&L)
3.593 81 2.3% -437 3.156 2.6% Midwest ISO Transmission Expansion Planning 07 – for 2013 scenarios
Ameren MO 9.879 181 1.8% -1824 8.055 2.2% Midwest ISO Transmission Expansion Planning 07 – for 2013 scenarios
Ameren IL 11.127 268 2.4% 2025 13.152 2.0% Midwest ISO Transmission Expansion Planning 07 – for 2013 scenarios
FirstEnergy 16.203 434 2.7% -1.464 14.739 2.9% Midwest ISO Transmission Expansion Planning 07 – for 2013 scenarios
Indiana Public Service Co. (NIPSCO)
3.935 66 1.7% -208 3.727 1.8% Midwest ISO Transmission Expansion Planning 07 – for 2013 scenarios

3-10
Table 3-1 (continued) Transmission Energy Use
ITC Transmission (ITC)
12.737 295 2.3% -448 12.289 2.4% Midwest ISO Transmission Expansion Planning 07 – for 2013 scenarios
Michigan Electric Transmission Co. (METC)
11.522 466 4.0% 1.528 13.050 3.6% Midwest ISO Transmission Expansion Planning 07 – for 2013 scenarios
British Columbia Transmission Co. (BCTC)
9.806 645 6.6%* 1.010 10.816 5.1% BCTC – Loss Calculation for BCTC Transmission System – Feb. 2004 – values for 2008
A Midwestern Utility 3.385 65.09 1.9%* 5.50% MidWest Utility Loss Analysis – Feb. 2006
Midwest ISO 134.667 4390 3.3% -4570 130.097 3.4 JCSP Study – Eastern Interconnection – Base case reliability scenario corresponding to Summer 2018
New York ISO 36.852 977 2.7% -2738 34.114 2.9% JCSP Study – Eastern Interconnection – Base case reliability scenario corresponding to Summer 2018
PJM 156.542 4428 2.8% 5832 162.374 2.7% JCSP Study – Eastern Interconnection – Base case reliability scenario corresponding to Summer 2018
SPP/ICTE RC 84.839 2261 2.7% 360 85.199 2.7% JCSP Study – Eastern Interconnection – Base case reliability scenario corresponding to Summer 2018
TVA RC 59.903 1519 2.5% 733 60.636 2.5 JCSP Study – Eastern Interconnection – Base case reliability scenario corresponding to Summer 2018
New York ISO 32.432 979.4 3.0%* 2.50% NYISO – Benefits of Reducing Electric System Losses – H. Chao and J. Adams – April 2009
* Actual Annual Loss

3-11
Table 3-2 Typical Substation Auxiliary Loads (Bose 2011)
Auxiliary Equipment Name Plat Power Ratings
Transformer Cooling Fans 1/6 hp – 1/2 hp (per fan)
Transformer Cooling Oil Pumps 3 hp – 7 hp (per pump)
Battery Chargers 10 – 20 KVA
Auxiliary Transformers 50 – 3000 KVA
Lights 35 – 400 Watts (per fixture)
Anti-condensation Resistive Heaters 20 – 200 Watts
Ventilation Fans 1/6 to 1/2 hp (per fan)
Space Heating 750 – 10 KW
Air Conditioners Several tons BTU
Other Motor and Pumps 5 hp – 350 hp
Improving Transmission Efficiency by Reducing Transmission Losses
There are a number of methods by which transmission electricity use can be reduced. These include extra high voltage (EHV) overlay or upgrade; substation/transformer efficiency and transmission line efficiency; and system loss reduction.
EHV Overlay/Voltage Upgrade (12.4% reduction in transmission losses)
The single greatest method to reduce transmission losses is to increase the voltage of the transmission system. If one doubles the voltage of a line, the required current to deliver a unit of power is halved (because power delivered equals the current times the voltage), and the losses are cut by three-quarters (because the losses are a function of the square of the current, as well as inversely proportional to the resistance). As explained above, only 23% of today’s transmission system operates at 345 kV and above. To achieve significant reduction of transmission losses by 2030, the industry will need to move to higher-voltage operation. This analysis assumes that 75% of new lines by 2030 are installed at 345 kV and above. It is also assumed that 15% of existing low-voltage lines can either be upgraded to higher voltage (for example 115 kV to 230 kV) or decommissioned altogether by 2030. Voltage rationalization can also be beneficial – that is, reducing the variations in “standard” voltages. This can reduce the need for additional transformation at interconnections, thus reducing transformation losses.

3-12
Substation/Transformer Efficiency (1.4% reduction in transmission losses)
Auxiliary power. Many approaches exist to substantively reduce consumption in substation control rooms including optimal HVAC units, higher efficiency fans and pumps, and automated control of components in the substation yard. While managing usage through efficiency implementations is not a new concept, many utilities have not viewed system electrical usage in the electrical substation system as a high priority. Capturing and standardizing best practices through industry collaboration will yield dramatic savings. Preliminary analysis suggests potential savings of 30% in auxiliary loss reduction by implementing efficiency measures. Through aggressive industry application, we can reach 50% implementation of existing substations and 80% of new substations by 2030.
Transformer efficiency. Many electricity providers have migrated over time to a lowest-initial-cost approach in procuring transformers. More efficient transformers may cost more initially but can deliver lower life-cycle cost and improve the efficiency of the transmission system. Analysis suggests an efficient transformer can reduce both the load and no-load losses by about 20%. While it would not be cost-effective or prudent to replace a healthy in-service transformer with a more efficient unit, electricity providers are evaluating high-efficiency transformers in new installations or when replacing a failed unit. Approximately 1% to 2% of transformers are replaced each year. It is assumed in this analysis that through aggressive industry application approximately 20% of the existing transformer fleet can be changed to efficient units and 80% of new transformers can be efficient by 2030.
Transmission Line Efficiency (4.2% reduction in transmission losses)
Use of lower-loss conductors (trapezoidal wire). Structural design is driven more by wind and/or ice-loading criteria than by conductor weight. Therefore, a traditional ACSR conductor can be replaced with trapezoidal-stranded conductor (TW) without significantly changing the structure design or cost. Because a trapezoidal wire has more aluminum cross-section, it has approximately 25% lower resistance, with the same or slightly higher diameter as the standard conductor (and a requisite 25% reduction in transmission losses for a given load), and provides additional transmission capacity. The analysis assumes an adoption rate of 10% of existing lines being reconductored to TW, and 80% of new lines being installed as TW by 2030.
Shield-wire losses can be reduced by approximately 50% by transposition or segmentation. The analysis assumes an adoption rate of 20% of existing lines by 2030, and 80% of all new lines employ transposition or segmentation.
System Loss Reduction (2.1% reduction in transmission losses)
Technologies to reduce system losses through the deployment of smart grid systems include Var/Volt control optimization, smart transmission control of

3-13
power flow controllers, and economic dispatch with loss optimization. These technologies can reduce transmission system losses by about 3%. The analysis suggests that we can adapt 95% of the transmission system with some kind of smart control by 2030.
Takeaway: Transmission and substation electricity use averages approximately 3%. There are a range of technology options available to reduce these uses.
Offices and Control Centers
Electricity used by the electricity sector is predominantly office building technologies. Primary uses include lighting, heating, ventilation, and air conditioning as well as being used to power uninterruptible power systems and information technology (IT). Electricity sector offices and control centers typically have a larger use of IT use than conventional office buildings.
Office Buildings
Electric utilities have facilities that can be considered offices or “retail and service buildings” (using EIA’s definitions). They typically consist of the following types: Office buildings including service storefront (customer service), billing, and
administration. Distribution centers including headquarters for regional engineering staff,
storehouse for hardware, service fleet housing, and maintenance.
Control centers housing operations centers, SCADA, EMS, and other IT equipment.
To prepare an estimate of usage, the author broke utilities into type and size and estimated the number of buildings per utilities of each size.
According to the Energy Information Agency (EIA), retail and service buildings use an average of 0.8 billion Btu per building per year or 234,700 kWh per year and have an energy intensity of 76.4 thousand Btu per square foot. Fifty-three percent of use is estimated to be for cooling, office equipment, lighting and other uses. For the purpose of this analysis, it is assumed that all of these uses are electric. This is a conservative estimate, since water heating and space heating in some of these buildings are likely to be based on natural gas or fuel oil (EIA 1995). Hence, the analysis detailed in Table 3-3 was conducted.

3-14
Table 3-3 Electricity Used in Electric Sector Buildings
Small Medium Large
Type of
Utility
Total #
% # Bldgs/ Utility
Total Bldgs
% # Bldgs/ Utility
Total Bldgs
% # Bldgs/ Utility
Total Bldgs
IOU 342 0 --- --- --- 25 86 3 258 75 256 6 1536
Co-op 893 50 446 1 446 40 357 1 357 10 90 3 270
Muni 2118 50 1059 1 1059 45 953 1 953 5 106 2 212
Total 3353 1505 1505 1396 1568 452 2018
Total buildings = 5091 Electricity use/building = 234,700 kWh/year Total electricity use = 1.195 x 10⁹ kWh/year Total electricity produced in 2009 = 3953 x 109 kWh Percent used in utility buildings = .0003%
Takeaway: Not unlike all commercial buildings, utility offices and control centers can benefit from energy efficiency.

3-15
Micro-Grid Systems
Would reconfiguring today’s power system into a combination of micro-grids be more efficient? There are two sides to the distributed generation and micro-grid efficiency argument. If designed properly, distributed generation is extremely efficient compared to the bulk utility system; however, it is often less efficient than a current central-station power plant (EPRI 1003973).
Micro-Grid Efficiency
Today’s micro-grid would be built from a variety of off-the-shelf distributed generation (DG) technologies that have peak electrical efficiencies ranging from about 25% up to more than 42% efficiency. These would include combustion turbine units, internal combustion engine (ICE) technologies, and microturbines. There are also phosphoric acid fuel cells commercially available that are about 38% to 40% efficient. The efficiency of all these DG products are lower than new central-station combined-cycle power plants that can be up to 55% to 60% efficient. However, if heat recovery from the distributed generators is performed and if it is used effectively, then the total energy efficiency of the process can be as great as about 90% in an optimally designed combined heat and power (CHP) application.
CHP system efficiency far exceeds that of a central-station plant that does not have heat recovery. Furthermore, the central-station plant will lose some additional power in the transmission and distribution process. Therefore, for a new combined-cycle plant, the net efficiency (power delivered to load) is perhaps about 50% to 55% in the best case. Most DG applications with properly designed heat recovery have better than 50% to 55% efficiency. Some people also consider that the “fleet” average of utility power plants, which include many older steam-fired plants and simple-cycle plants, is more on the order of 35% to 40%. When transmission and distribution losses are factored in, only about one-third of the energy in the utility company fuel input actually reaches the load as electricity. On the other hand, with DG in a combined heat and power confirmation, up to 90% of the energy in the fuel is usually utilized.
DG technologies are steadily improving in their electrical efficiency, and new emerging products will soon be available. For example, conventional DG-scale combustion-turbine and reciprocating-engine products are expected to approach about 50% efficiency by the end of this decade due to improvements in designs and materials. In the next five to ten years, high-temperature fuel-cell technologies such as the solid-oxide and molten-carbonate fuel cells are expected to be fully commercialized and should have electrical efficiencies from 55% to 60%. Manufacturers of fuel cells are also working to develop fuel-cell/combustion-turbine hybrid systems, where the electrical efficiencies may reach 70% or better.
However, DG efficiency is often less than the bulk power system efficiency. First, if the DG application does not employ heat recovery, then its peak efficiency will be about equivalent to the utility central-station “fleet” average efficiencies or

3-16
even a bit lower for many of the current technologies. Comparison to the “fleet” average is not a very meaningful comparison because the argument for micro-grids and DG is always a comparison of investing in new central plants versus investing in micro-grids and DG. It is not a fair comparison to compare existing fleet plants to the latest state-of-the-art DG.
The efficiencies cited for distributed generators are often peak efficiencies that occur at only the optimal loading point (near rated load). In many micro-grid applications, it will not always be possible to keep all generators loaded at their peak efficiency point because the load factors on the micro-grid are much less than 100% and because it is always necessary for some of the generation to be load-following and oversized slightly to handle ramping. As a result, the efficiencies obtained in practical operating conditions can be many percentage points lower than the stated peak DG efficiency (such as 25% instead of 30%). Ancillary equipment such as gas compressors and other devices can cut back a few more percent on the overall system efficiency. Finally, even when CHP is used, if the heat is poorly recovered or cannot be fully utilized because of a mismatch between heat demand and electrical production, then CHP efficiency may actually not add that much to the overall efficiency. Poorly designed micro-grid applications could actually have lower total efficiency than installing new central-station plants.
The efficiency of distributed generation can certainly be greater than the bulk power system, but this is not the case for most applications. Many applications are less efficient when they do not employ the correct elements needed for efficiency. Micro-grid DG applications that are sure to outperform combined-cycle central-station options by a wide margin are those that satisfy both of the following:
They are operated a very high capacity factors that will ensure that they are near the most efficient operating state most of the time.
They employ heat recovery whereby most of the recovered heat can be used for useful purposes (see Figure 3-6).

3-17
Figure 3-6 Combined Heat and Power Applications for DG are the Best Route to High Efficiency (Source: EPRI 1003973)
If the above two conditions are not satisfied, then the DG application may not be as efficient as a central-station combined-cycle application and it will need to be studied closely to see if there is an advantage in this category.
DG applications that do not use heat recovery and are, therefore, combined heat and power installations will likely be less efficient than even the utility “fleet” average.

3-18
Total Use of Electricity
Table 3-4 summarizes the estimates of total uses of electricity as discussed in this report.
Table 3-4 Total Use of Electricity1
Segment % Generation
% Use Net % Avg Low Avg High
Generation
Coal 44.9 4.7 7.6 10.5 3.41
Natural Gas 23.8 1.3 1.6 2.0
Nuclear 19.6 2.8 4.1 5.4
Hydro 6.2
Renewables 4.0
Other 1.5 --- --- --- ---
Transmission 100 2.85 2.85
Distribution 100 1.5 3.5 8.6 3.50
Total Use 9.76 1Based on 2011 Energy Information Agency (Electric Power Monthly Table 1.1. Net Generation by Source, www.eia.doe.gov)

4-1
Section 4: Next Steps In the power industry, there are considerable opportunities to achieve higher efficiencies end to end, from generation through power delivery and end use. To recognize these opportunities, it is important to look at each link within the electricity value chain individually and compare the effort for achieving higher efficiency within a framework for the whole.
To understand the opportunity each utility has to enhance electric energy efficiency across the production, delivery and use7 of electricity, a detailed framework is needed which can serve as a decision-making tool for optimizing the impact of the utility’s energy efficiency efforts. In this framework, generation, power delivery, including transmission and distribution, and end-use technologies need to be considered when identifying significant opportunities to improve efficiencies.
While many utilities are encouraged by the regulators to engage in end-use energy efficiency programs, few consider options to reduce energy losses along the electricity value chain. In many cases, the efficiency gains that could be realized through measures to reduce transmission and distribution losses or reduce electricity consumption at power plants can be in the same range as, or exceed, the potential of end-use efficiency savings. Moreover, given the intensity of energy consumption in the industry’s own physical infrastructure, efficiency measures undertaken at a finite number of power plants or in the power delivery grid can potentially yield energy savings and carbon emission reductions more cost-effectively than traditional end-use programs targeted at buildings, home, and other industries.
Development of Strategic Framework to Assess End-to-End Efficiency
A comprehensive strategic framework to assess, compare and evaluate efforts and impact energy efficiency measures along the electric value chain is needed. The framework will provide a unifying methodology and a holistic approach to integrate energy efficiency and carbon impact considerations into the capital project planning and prioritization process.
7 Use was not the subject of this report.

4-2
Framework Elements
Energy Efficiency Measure Profiles
Step one is to develop a comprehensive list of energy-efficiency measures for each stage of the value chain, including a summary profile based on a consistent set of attributes. The Energy Efficiency Measure Profile includes descriptive and qualitative attributes as well as a first order estimate of quantitative energy savings, emissions impacts and costs. Utility-specific data can be used, where available. The aim of this task is to establish a robust basis for comparing g efficiency measures across the value chain.
Estimation of Potential Savings per Sector
Step two entails quantifying the potential for efficiency, or loss reduction, for generation, transmission, distribution, and end-use programs based on estimates available from existing studies. This framework development process facilitates interaction and cooperation between groups in the utility that might otherwise have limited or no opportunity for dialogue on issues of energy efficiency or loss reduction.
Energy Efficiency Accounting Guidelines
In step three, metrics and methods to quantify the energy and carbon-savings impact and costs of prospective energy-efficiency measures are proposed. In this step, the utility must define the baseline for the energy savings and carbon mitigation impacts. In the context of specific regulatory or intervener requirements and data availability, recommendations are then created on calculation-based or simulation-based techniques to estimate, measure and verify the impact of energy-efficiency measures. As part of this process, the framework must also provide a consistent method to account not only for energy efficiency and emissions impacts but also for project costs. Since most capital projects are driven by reasons other than energy efficiency, the incremental cost of including energy-efficiency measures may be a more appropriate metric than the total project cost.
Integration Guidelines for Project Planning and Prioritization
The framework must provide a basis to compare and prioritize capital projects across generation, transmission, distribution, and end-use functions using energy efficiency and carbon impact as the overarching criteria. Subsequently, guidelines should be developed to define the value of energy efficiency and carbon impact and to integrate it into the value model of the existing prioritization process. Put into practice, such a modified value model would consistently factor efficiency and carbon impact of prospective projects into the decision-making process. This framework can be integrated into the existing project prioritization process. The framework will include the development of visual constructs, such as conceptual diagrams, decision trees, or flowcharts that illustrate how decision-making processes explicitly consider energy efficiency.

4-3
Once the analysis is complete, the utility may wish to develop a campaign blueprint to promote the process and results of end-to-end efficiency analysis to key stakeholders, including employees, customers, regulators, and intervener groups.
This assessment is most robust if a cross-disciplinary project team of experts in power plant operations, T&D operations, end-use efficiency, and environmental impacts are used to develop the framework. This framework development process should facilitate interaction and cooperation between groups in the utility that might otherwise have limited or no opportunity for dialogue on issues of energy efficiency or loss reduction.


5-1
Section 5: Conclusions The electricity industry is the second largest electricity-consuming industry in the United States. The use of electrical energy in the production of electricity as well as the uses or losses in power delivery (transmission and distribution) contribute to this total.
In power production, duty-cycle or capacity factor is the key driver that influences internal power usage relative to unit output. In coal-fired power plants, the average internal power use across the sample used in this analysis was 7.6%. In nuclear power plants, the average was 4.1%. There are opportunities to reduce electricity use in power production. These opportunities may include advances in control systems for auxiliary power devices and the use of adjustable-speed drive mechanisms (ASD). In addition, ASD installations often reduce CO2 emissions – the economics of which were not considered in this report.
Electricity use in power delivery totals approximately 6.3%. In the distribution system, the use of efficient transformers, improved voltage control, phase balancing, and balancing of reactive power needs could substantially reduce electricity use. In the transmission system, opportunities include extra high-voltage overlays, transformer and line efficiency.
In addition, albeit not intuitive, there are a few other “discoveries” worth highlighting: 1. Newer power plants are not necessarily more efficient than older plants due
principally to environmental requirements.
2. Non-baseload operating plants have a particularly high potential for improvement by the application of adjustable-speed drives (ASD) on motors.
Although beyond the scope of this report, it should be noted that shifting loads from peak to off-peak hours provides significant improvement by reducing load flows during peak periods on the transmission and distribution systems when losses are exacerbated, while also reducing cycling operation for selected generation units. In a similar manner, use of alternative energy sources close to load centers to supply energy requirements during peak periods can significantly reduce transmission and distribution losses during the most challenging periods of operation.


6-1
Section 6: References 1. Heat Rate Improvement Reference Manual, EPRI, Palo Alto, CA: 1998.
TR-109546. 2. 2009 Heat Rate Improvement Conference, EPRI, Palo Alto, CA: 2009.
TR-1017546. 3. Evaluation of Conservation Voltage Reduction (CVR) on a National Level,
Pacific Northwest National Laboratory for the U.S. Department of Energy, July 7, 2010.
4. Effects of Reduced Voltage on the Operation and Efficiency of Electric Loads, Vol. 1, EPRI, Palo Alto, CA: 1981. EL-2036.
5. The Power to Reduce CO2 Emissions: Transmission System Efficiency, EPRI, Palo Alto, CA: 2010. TR-1020142.
6. Distribution Efficiency Initiative, Northwest Energy Efficiency Alliance, December 2007.
7. Potential for Reducing Consumption Through Distribution Efficiency, EPRI, Palo Alto, CA: 2010.
8. Distribution Green Circuits Collaboration, EPRI, Palo Alto, CA: 2010, TR-1020740.
9. Modern Power Station Practice – Volume G: Station Operation and Maintenance, L.C. White, 3rd edition, British Electricity International, Pergamon Press, Oxford, UK.
10. Survey of Impacts of Environmental Controls on Plant Heat Rate. EPRI, Palo Alto, CA. 1019003.
11. Power Generation from Coal: Measuring and Reporting Efficiency Performance and CO2 Emissions, Coal Industry Advisory Board (CIAG), International Energy Agency (IEA), 2010.
12. The Smart Grit Begins with Smart GenerationTM, Energy Efficient Design of Auxiliary Systems in Fossil-Fuel Power Plants, ABB Inc., in collaboration with Rocky Mountain Institute, 2009.
13. Electric Utility Systems and Practices, Fourth, GE Utility Division edited by Homer M. Rustebakke, Wiley, 1983.
14. Renewable and Efficient Electric Power Systems, G.M. Masters, 2004.

6-2
15. 2008 Operating Performance, T. Hansen, Electric Light & Power, November 2009.
16. Plant Support Engineering (P2EP), House Loads Reduction, P2EP Survey #96-006, EPRI, May 15, 1996.
17. Energy Efficiency, Chapter 7, U.S. Department of Energy (USDOE), Energy Information Administration, www.eia.doe.gov/emeu/efficiency/ee_ch7.htm.
18. The Power to Reduce CO2 Emissions – Transmission System Efficiency, EPRI, Palo Alto, CA: 2010. 1020142.
19. 1995 Commercial Buildings Energy Consumption Survey, Energy Information Administration (EIA).
20. Distribution Green Circuits Collaboration, EPRI, Palo Alto, CA: 2010. 1020740.
21. Unit Generation and Emissions – Annual, assembled from federal form US EPA CEMS [fossil units]..
22. Monthly Plant Generation and Consumption, assembled from federal form EIA-923
23. Electrotechnology Reference Guide, EPRI, Palo Alto, CA: 2011. 1022334.
24. GOI Tariff Notification, India, November 6, 1995. 25. Performance Review of Thermal Power Stations 2006-07 Section 11, Central
Electricity Authority, India, www.cea.nic.in.
26. Medium Voltage AC Drives for Power Generation Industry, ABB, 2011, www.abb.com/product/ap.
27. ABB Energy Efficiency Handbook, ABB, Zurich, Switzerland, 2009.
28. Assessment of Achievable Potential from Energy Efficiency and Demand Response Program in the U.S.: (2010-2030), EPRI, Palo Alto, CA: 2010. 1016987.
29. Best Practices for Auxiliary Power Reduction in Thermal Power Stations, The Bulletin on Energy Efficiency, ISSN 0972-3102, August-October 2006, Vol. 7, Issue 1-2, India.
30. Substation Auxiliary Light and Power Efficiency Initiative, Consolidated Edison of New York and EPRI, S. Bose presented to EPRI International PDU Council Meeting, London, England, June 9, 2011.
31. State of the Efficiency Program Industry: 2009 Expenditures, Impacts and 2010 Budgets, Consortium for Energy Efficiency (CEE), Boston, MA, December 10, 2010
32. Investigation of the Technical and Economic Feasibility of Micro-Grid Based Power Systems, EPRI, Palo Alto, CA: 2001. 1003973.
33. End-to-End Efficiency Assessment Framework, EPRI, Palo Alto, CA: 2008. 1016532.


Electric Power Research Institute3420 Hillview Avenue, Palo Alto, California 94304-1338 • PO Box 10412, Palo Alto, California 94303-0813 USA
800.313.3774 • 650.855.2121 • [email protected] • www.epri.com
The Electric Power Research Institute Inc., (EPRI, www.epri.com)
conducts research and development relating to the generation, delivery
and use of electricity for the benefit of the public. An independent,
nonprofit organization, EPRI brings together its scientists and engineers
as well as experts from academia and industry to help address challenges
in electricity, including reliability, efficiency, health, safety and the
environment. EPRI also provides technology, policy and economic
analyses to drive long-range research and development planning, and
supports research in emerging technologies. EPRI’s members represent
more than 90 percent of the electricity generated and delivered in the
United States, and international participation extends to 40 countries.
EPRI’s principal offices and laboratories are located in Palo Alto, Calif.;
Charlotte, N.C.; Knoxville, Tenn.; and Lenox, Mass.
Together...Shaping the Future of Electricity
© 2011 Electric Power Research Institute (EPRI), Inc. All rights reserved. Electric Power Research Institute, EPRI, and TOGETHER...SHAPING THE FUTURE OF ELECTRICITY are registered service marks of the Electric Power Research Institute, Inc.
Export Control RestrictionsAccess to and use of EPRI Intellectual Property is granted with the spe-
cifi c understanding and requirement that responsibility for ensuring full
compliance with all applicable U.S. and foreign export laws and regu-
lations is being undertaken by you and your company. This includes
an obligation to ensure that any individual receiving access hereunder
who is not a U.S. citizen or permanent U.S. resident is permitted access
under applicable U.S. and foreign export laws and regulations. In the
event you are uncertain whether you or your company may lawfully
obtain access to this EPRI Intellectual Property, you acknowledge that it
is your obligation to consult with your company’s legal counsel to deter-
mine whether this access is lawful. Although EPRI may make available
on a case-by-case basis an informal assessment of the applicable U.S.
export classifi cation for specifi c EPRI Intellectual Property, you and your
company acknowledge that this assessment is solely for informational
purposes and not for reliance purposes. You and your company ac-
knowledge that it is still the obligation of you and your company to make
your own assessment of the applicable U.S. export classifi cation and
ensure compliance accordingly. You and your company understand and
acknowledge your obligations to make a prompt report to EPRI and the
appropriate authorities regarding any access to or use of EPRI Intellec-
tual Property hereunder that may be in violation of applicable U.S. or
foreign export laws or regulations.
Programs:
Technology Innovation
End-Use Energy Effi ciency and Demand Response in a Low-Carbon Future
1024651