program evaluation and review technique (pert)author.uthm.edu.my/uthm/www/content/lessons/654/week 9...
TRANSCRIPT

Program Evaluation and Review
Technique (PERT)

PERT
• Bar charts and CPM networks assume all activity durations
are constant or deterministic.
• The assumption of constant durations may not be realistic
because of working conditions.
• To address the variability of project activities, the Program
Evaluation and Review Technique (PERT) was developed.
• PERT incorporates uncertainty into the project by assuming
that the activity durations of some or all of the project
activities are variable.

PERT
• Three time estimates are required to compute the parameters of an activity’s duration distribution:
• pessimistic time (tb ) - the time the activity would take if things did not go well
• most likely time (tm ) - the consensus best estimate of the activity’s duration
• optimistic time (ta ) - the time the activity would take if things did go well
Mean (expected time): te =ta + 4 tm + tb
6
Variance: Vt =δ2 =tb - ta
6
2
Where,
tb is the expected duration
Tb is the most optimistic duration estimate
tm is the most likely duration estimate
Ta is the most pessimistic duration estimate

PERT Chart may look like

Draw the network
Use PERT formula to calculate the expected duration for each
activity of the project
Analyze the paths through the network and find the critical path
The length of the critical path is the mean of the project
duration probability distribution, It follows a normal distribution
The standard deviation of the project duration probability
distribution is computed by adding the variances of the critical
activities (all of the activities that make up the critical path) and
taking the square root of that sum
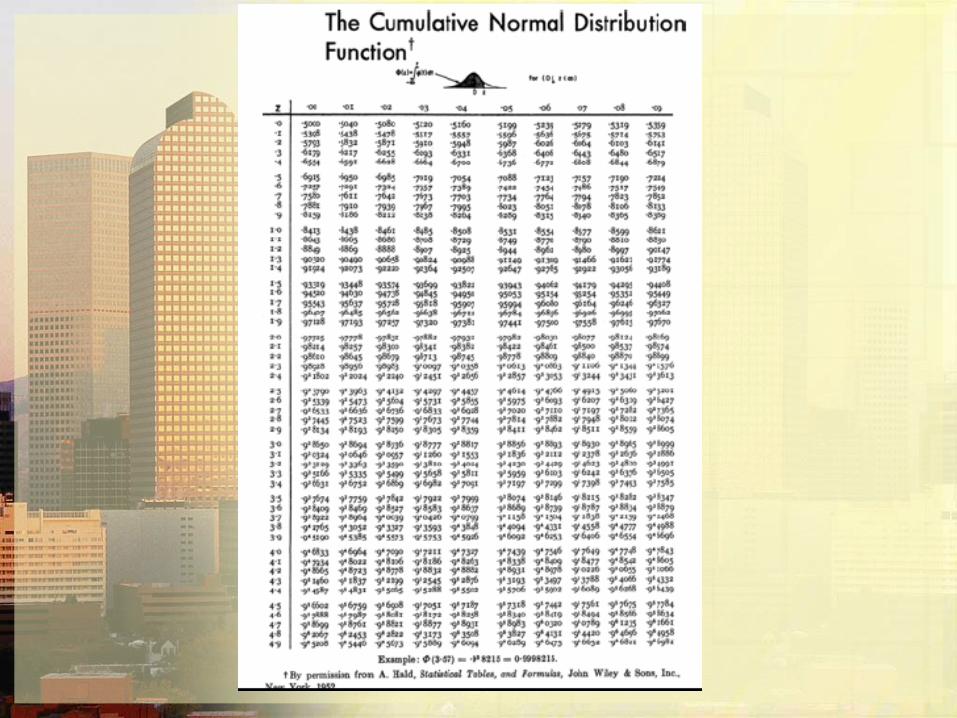
Probability computations can now be made using the normal
distribution
PERT ANALYSIS

Probability computation
Determine probability that project is completed within
specified time
Z = - N
where = tp = project mean time
= project standard mean time
N = (proposed ) specified time

Normal Distribution of Project Time
= tp Timex
Z
Probability
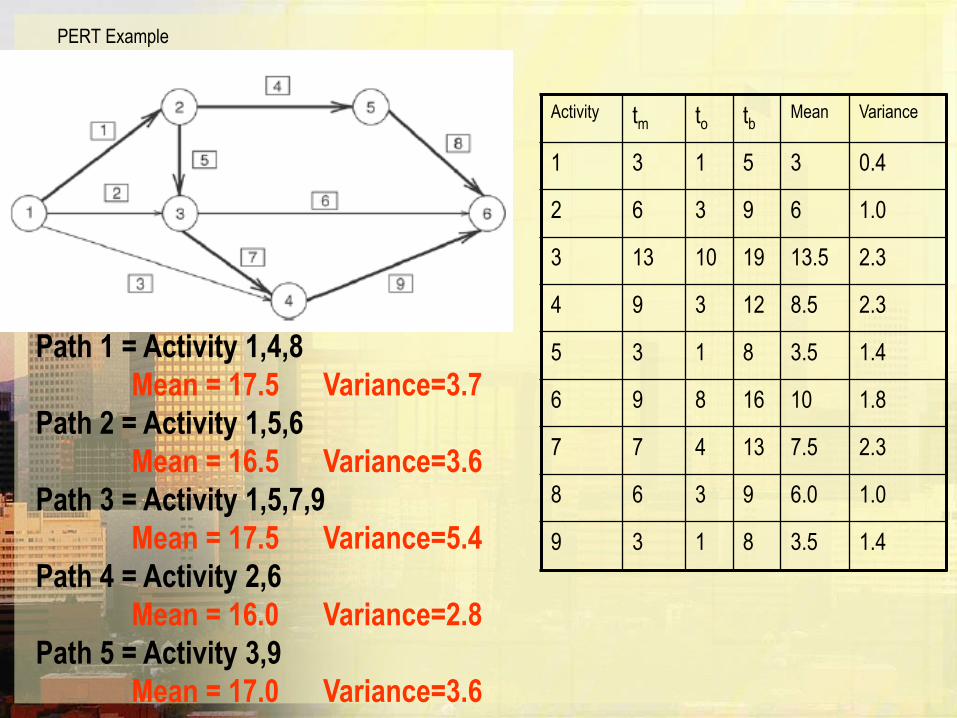
PERT Example
Activity tm to tb Mean Variance
1 3 1 5 3 0.4
2 6 3 9 6 1.0
3 13 10 19 13.5 2.3
4 9 3 12 8.5 2.3
5 3 1 8 3.5 1.4
6 9 8 16 10 1.8
7 7 4 13 7.5 2.3
8 6 3 9 6.0 1.0
9 3 1 8 3.5 1.4
Path 1 = Activity 1,4,8
Mean = 17.5 Variance=3.7
Path 2 = Activity 1,5,6
Mean = 16.5 Variance=3.6
Path 3 = Activity 1,5,7,9
Mean = 17.5 Variance=5.4
Path 4 = Activity 2,6
Mean = 16.0 Variance=2.8
Path 5 = Activity 3,9
Mean = 17.0 Variance=3.6

What is the probability that the project can be completed in N days?
Z = - N

Benefits of CPM/PERT
• Useful at many stages of project management
• Mathematically simple
• Give critical path and slack time
• Provide project documentation
• Useful in monitoring costs
•How long will the entire project take to be completed? What are
the risks involved?
•Which are the critical activities or tasks in the project which could
delay the entire project if they were not completed on time?
•Is the project on schedule, behind schedule or ahead of
schedule?
•If the project has to be finished earlier than planned, what is the
best way to do this at the least cost?
CPM/PERT can answer the following important questions:

Limitations to PERT
• PERT assumes statistically independence between
activities. This may not be appropriate
• PERT consistently underestimates the expected project
completion time due to alternate paths becoming
critical. The principal cause of this underestimation is a
condition known as “merge event bias”
• PERT results are too optimistic
To overcome the limitation, Monte Carlo simulations can
be performed on the network to eliminate the optimistic
bias

GANTT CHART vs PERT CHART

GANTT CHART vs PERT CHART
GANTT chart visually shows the duration of Tasks whereas a PERT
chart visually shows the sequence dependencies between tasks.
GANTT visually shows the Time overlap of Tasks whereas a
Network does not show time overlap but does show which tasks
could be done in parallel.
Some form of GANTT chart can visually show Slack Time available
within an Earliest Start and Latest finish time.
Most Project Managers find PERT very helpful for scheduling,
monitoring and controlling Projects.
PERT is recommended for Large Projects with high inter-task
dependencies and the GANTT chart for simpler Projects.
Most Project Management Case Tools nowadays (eg. MS-Project,
Primavera ) allow the best feature of PERT to be incorporated into
GANTT Charts.

Line of Balance Method
Line of Balance Method (LOB)
A graphical method for production control integrating bar chart and
production curve concepts.
This is most suited and efficient for linear constructions and repetitive
activities
LOB focuses on the planned versus actual progress for individual activities
and provides a visual display depicting their difference.
LOB enables management to provide accurate control by prioritizing
reallocation of resources. This assumes resources are interchangeable

Linear Construction Operations
Often construction sites have linear properties that influence the
production sequence.
A road job may be subdivided into many sections.
A set of work processes need to be completed in a particular sequence
before a section is completed:
(1) rough grading, (2) finish grading, (3) aggregate base installation, (4)
5-in.concrete pavement, (5) 9-in. concrete pavement, and (6) curb
installation.

Linear Construction Operations
Each of the 14 sections can be thought of as being processed by crews
and equipment representing each of the six work processes.
Work is proceeded from section 1, section 2, …, to section 14. The six
work processes are carried out in sequence.
There are work activity overlaps such that several operations are in
progress simultaneously during the middle of the job.

Many types of projects exhibit a kind of rigid work sequence and have
a “train” effect.
High-rise building
Each floor has to pass a set of operations: erect formwork, install
reinforcing steel and pure concrete.
Tunnel
Drill, blast, remove muck, and advance drilling shield..

Elements of LOB
There are four Elements of
LOB
1. The objective chart
2. The program chart
3. The progress chart
4. The comparison
Objective chart
A segmental curve showing
cumulative end products to
be produced over a calendar
time period.
Objective chart
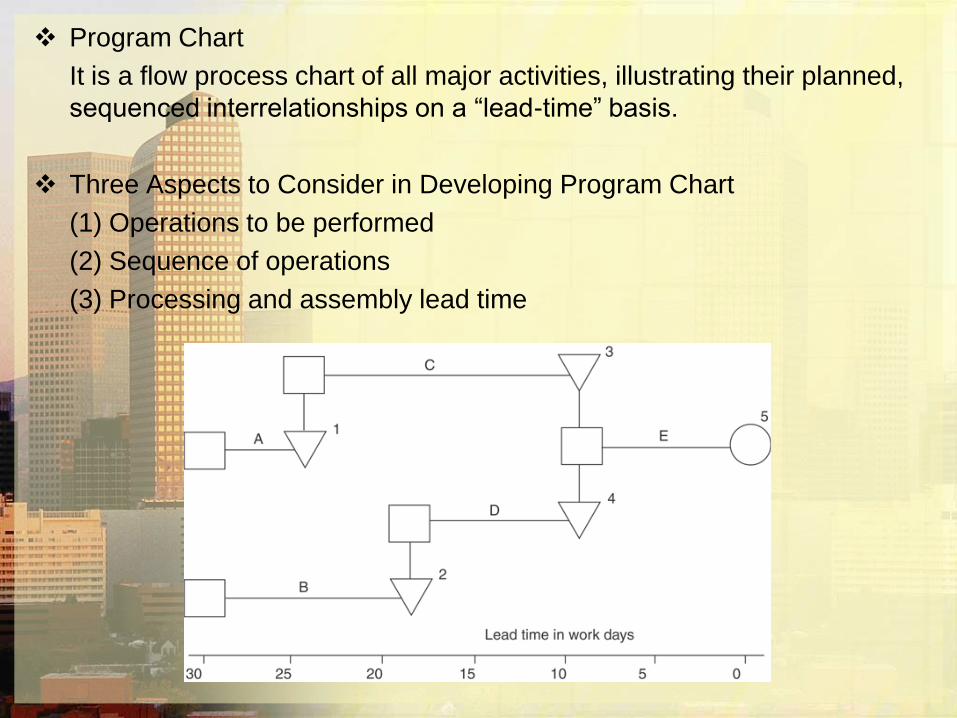
Program Chart
It is a flow process chart of all major activities, illustrating their planned,
sequenced interrelationships on a “lead-time” basis.
Three Aspects to Consider in Developing Program Chart
(1) Operations to be performed
(2) Sequence of operations
(3) Processing and assembly lead time
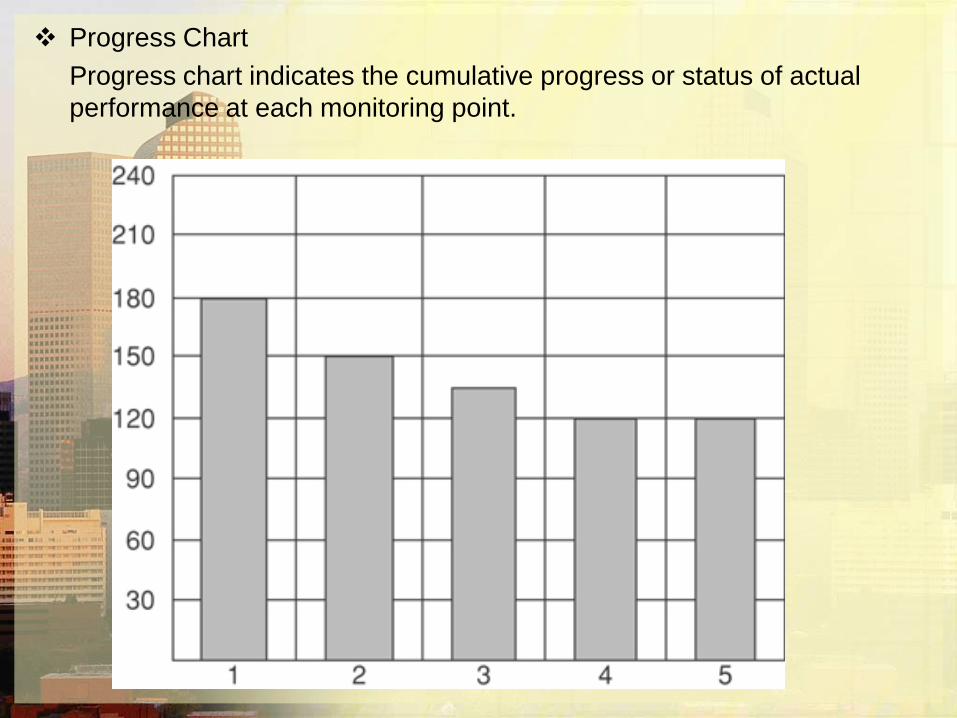
Progress Chart
Progress chart indicates the cumulative progress or status of actual
performance at each monitoring point.

Comparison of Actual Progress and Expected Progress

LOB Applied to Construction
A road project has 40 same sections and each section has 8
activities. Suppose they are balance production. Each week has 40
working hours. The production curve and the lead time are shown as
follows. Calculate the LOB values (completed sections) of each
control points at the beginning of fifth week.
8hr8hr2hr16hr6hr4hr14hr2hr
9
60
8
58
7
44
6
40
5
34
4
18
3
16
2
8
1
0
A B C D E F G H
40
30
20
10
0
Sections
12
28
40 80
21
120
3
160
4
200
5
240
6
280
7
Hours
Weeks0
0
Lead time
Production curve

Section
40
30
20
10
0ActivityHGFEDCBA
Answer:
LOB(1)= 0.1×3×40+0.2×1×40 = 20 sections
LOB(2)= 20+0.2×8 = 21.6 sections
LOB(3)= 21.6+0.2×8 = 23.2 sections
LOB(4)= 23.2+0.2×2 = 23.6 sections
LOB(5)= 23.6+0.2×16 = 26.8 sections
LOB(6)= 26.8+0.2×6 = 28 sections
LOB(7)= 28+0.15×4 = 28.6 sections
LOB(8)= 28.6+0.15×14 = 30.7 sections
LOB(9)= 30.7+0.15×2 = 31 sections
A B C D E F G H0
10
20
30
40
Activity
Planned Progress Chart
Comparative Progress Chart

Scheduling with Computer Software

Introduction to Computer software
Project planning and scheduling are key factors to completing a
construction project within budget, on time and with few problems
The most efficient way to develop a construction schedule is to use
computer programs
Computer programs also proved useful in resource allocation.
The lesson learned from previous projects could also be stored in
historical files. This improved future planning as well as estimating
process
A wide variety of affordable project management software packages
are available for purchase. These packages allow the project
manager and project team to plan and control projects in a
completely interactive mode.

Common features of project management software
Create lists of tasks with their estimated durations
Establish interdependencies among tasks
Work with a variety of time scales, including hours, days, weeks, months, and
years
Handle certain constrains
Track team members, including their pay rates, hours worked thus far on project
and upcoming vacation dates
Incorporate company holidays, weekends, and team members vacation days into
calendaring systems
Handle shifts of workers (day, evening, night)
Monitor and forecast budgets

Common features of project management software
Look for conflicts; for example, resource over allocated and time conflicts
Generate a wide variety of reports
Interface with other software packages such as spread sheets and database
Sort information in a variety of ways; for example, by project, by team member, or
by work package
Handle multiple projects
Work on-line and respond quickly to changes in schedule, budget, or personnel
Compare actual costs with budgeted costs
Display data in a variety of ways, including both Gantt charts and network
diagrams

Computer Software for Project Management
Various computer programs have been established so far with regard to preparing
schedules:
Microsoft Project (Microsoft Corp.)
Mac Project (Claris Corp.)
Power Project (ASTA Development Inc.)
Primavera Project Planner (Primavera)
Project Scheduler (Scitor Corp.)
Project Workbench (ABT Corp.)
However, out of which Microsoft project and Primavera Project Planner are two
popular software programs used in construction industry.

Benefits of using project management software
Organizing the plan and thinking through the details of what must be done
Scheduling deadlines that must be met
Scheduling the tasks in the appropriate sequence
Assigning resources and costs to tasks and scheduling tasks around
resource availability
Fine-turning the plan to satisfy time and budget constraint or to
accommodate changes
Preparing professional looking reports to explain the project to owners,
top management, supervisors, workers, subcontractors and the public.

Limitations of using project management software
Although scheduling software packages have supported resource-loading
activities for sometime, they still require manual input of resource
information and do not represent the reasons behind the selection of a
particular crew and crew size
In most cases, computer programs give adequate solutions; however,
when resource requirements exceed the resources available, the
computer programs do not provide the optimum scheduling solutions.


Activity Codes Calendars

Screen Layout of Project SNP1 in Primavera Project
Planner 3.1
Activity Bar
Activity ID
Activity Description
Activity codes

Relationship between Activities

Bar Chart

Data for Each Activity in The Project

Table of Resources Needed in The Project

Layout for Project Reporting

PERT or PDM View
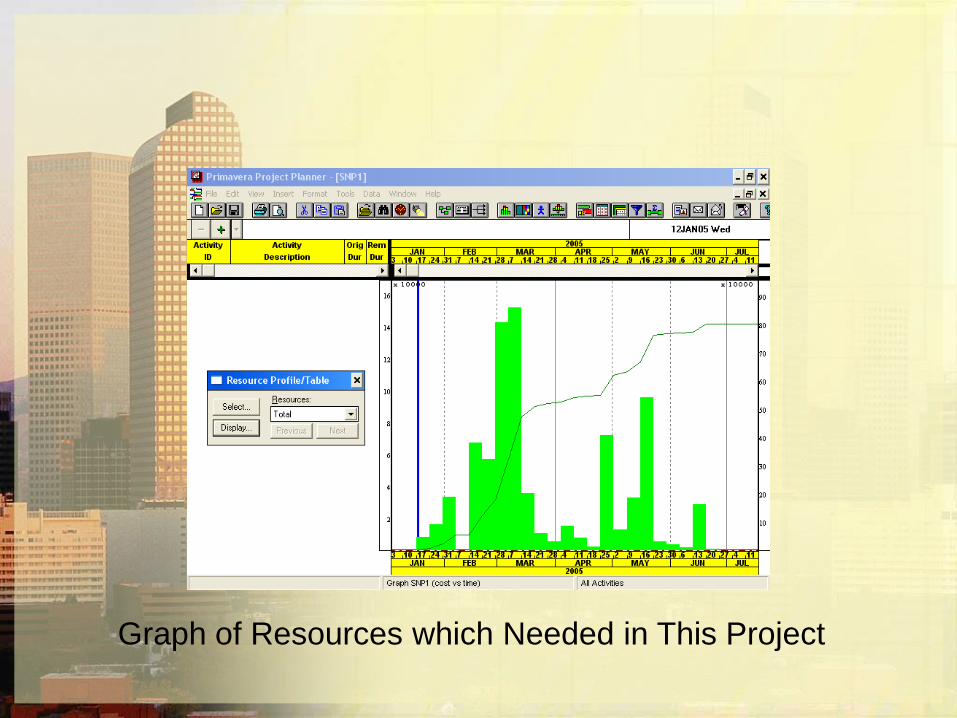
Graph of Resources which Needed in This Project


Screen Layout of MS Project

Relationship between Activities

Assigning Resources Needed in The Project

Layout of network diagram
