prognostication in mf: from cbc to cytogenetics to molecular markers alessandro m. vannucchi...
TRANSCRIPT

Prognostication in MF: From CBC to cytogenetics to molecular markers
Alessandro M. VannucchiUniversity of Florence, Italy

0.0
0.2
0.4
0.6
0.8
1.0
Pro
bab
ility
0 2 4 6 8 10 12 14 16 18 20 22 24 26Years
1980 - 1995 1996 - 2007
Whole series: actuarial survival (± 95% CI)according to period of diagnosis
p < 0.0001
Survival is Significantly Shortened in PMF
Cervantes F et al. JCO 2012; 24:2891-7.
Median survival: 4.6 versus 6.5 y

Why do we Need Accurate Prognostic Scores?
• Long term remissions with the potential of being cured have been described only in patients undergoing allogeneic HSCT
• However, HSCT approach to MF has several limitations, currently:
Disease related Procedure related
• Median age is 65 y (but changing…)
• Donor availability
• Age-related comorbidities • Only one prospective trial (+1 not yet fully reported)
• Fragile patients (splenomegaly, cytopenias, previous therapies…)
• High, and highly variable, TRM
• Rapid evolution to AML • Choice of fully ablative versus RIC
• Uncertainties about whom and when
• Poor information about long-term effects

Variable IPSS DIPSSAge >65 y
Constitutional symptoms
Hemoglobin <10 g/dL
Leukocyte count >25x109/L
Circulating blasts > 1%
Platelet count <100x109/L
RBC transfusion need
Unfavorable karyotype+8,-7/7q-,i(17q),inv(3), -5/5q-,12p-, 11q23 rearr.
Cervantes et al, Blood 2009;113:2895-901Passamonti et al, Blood 2010; 115:1703-8
Gangat N et al, J Clin Oncol 2011; 29:392-7
Risk Stratification in PMF
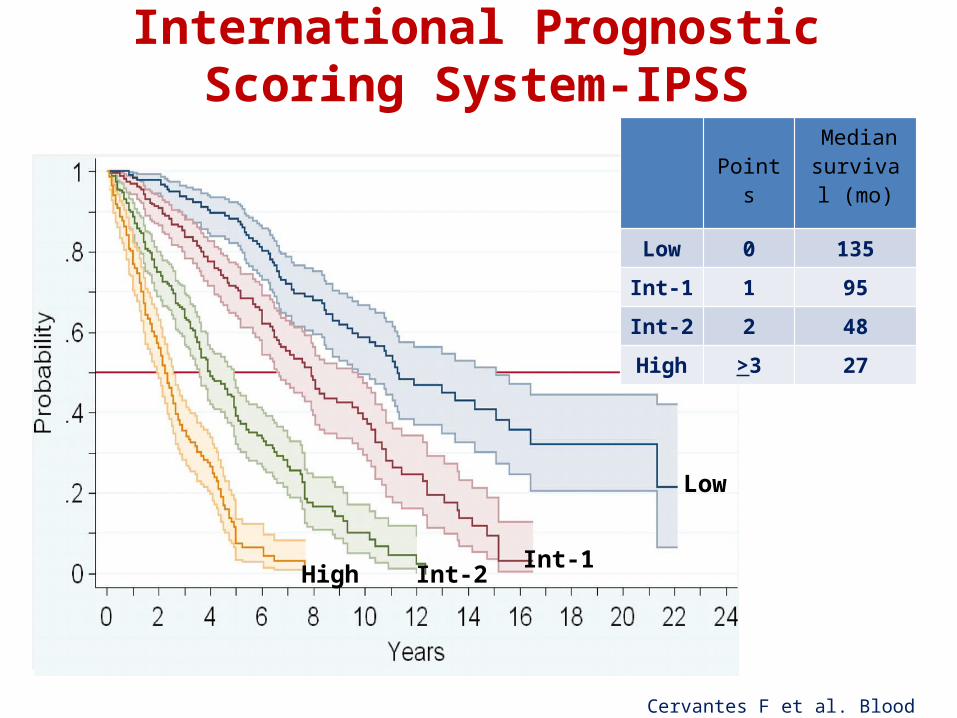
International Prognostic Scoring System-IPSS
Low
Int-1Int-2High
Cervantes F et al. Blood 2009;113:2895-901
Points Median survival
(mo)
Low 0 135
Int-1 1 95
Int-2 2 48
High >3 27

Impact of Anemia on Disease Progression
Passamonti F.et al, Blood 2010; 115:1703-8
• Disease-related anemia* has been associated with worse prognosis in all risk scoring systems (Lille, IPSS and derivatives)• RBC transfusional dependency is included in the DIPSS-plus score
* NOT treatment-related

Dynamic IPSS (DIPSS)
Passamonti F et al. Blood 2010;115:1703-8
Points Median survival
(mo)
Low 0 Not reach.
Int-1 1-2 170
Int-2 3-4 48
High 5-6 18

Survival by Cytogenetic Category in PMF
Tam C S et al. Blood 2009;113:4171-4178
At diagnosis Beyond initial diagnosis
CPX= complex (>3 abnormalities)

"Unfavorable" Karyotype in PMF: Effect on OS
Favorable KaryoM 5.2 yr5-yr survival: 51%
Unfavorable KaryoM 2.0 yr5-yr survival: 8%
UNFAVORABLE KARYO:- Complex karyo, - Sole or 2 abnormalities including:• Trisomy 8• -7/del(7q)• Del(5q)• Inv(3)• isochromosome 17q/17p-• 12p-• 11q23 abnormality
Caramazza D et al. Leukemia 2011; 25:82-88

"Unfavorable" Karyotype in PMF: Effect on LFS
Caramazza D et al. Leukemia 2011; 25:82-88
Favorable Karyo5-yr AML transformation rate: 7%
Unfavorable Karyo5-yr AML transformation rate: 46%

Variable IPSS DIPSS DIPSS-plusAge >65 y
Constitutional symptoms
Hemoglobin <10 g/dL
Leukocyte count >25x109/L
Circulating blasts > 1%
Platelet count <100x109/L
RBC transfusion need
Unfavorable karyotype+8,-7/7q-,i(17q),inv(3), -5/5q-,12p-, 11q23 rearr.
Cervantes et al, Blood 2009;113:2895-901Passamonti et al, Blood 2010; 115:1703-8
Gangat N et al, J Clin Oncol 2011; 29:392-7
Risk Stratification in PMF

Gangat et al. J Clin Oncol 2011;29:392-7
0
.2
.4
.6
.8
1
0 50 100 150 200 250 300 350 400
Su
rviv
al
Months
∆ Low risk (0 adverse points) n=66; median survival ~ 185 months
▲ Intermediate-1 risk (1 adverse point) n=174; median survival ~ 78 months
○ Intermediate-2 risk (2 or 3 adverse points) n=360; median survival ~ 35 months
High risk (4 or more adverse points) n=193; median survival ~ 16 months
Low risk (0 variable)M 185 mo
Int-1 risk (1 variable)M 78 mo
Int-2 risk (2-3 variables)M 35 mo
High risk (>4 variables)M 16 mo
Dynamic IPSS-plus (DIPSS-plus)

Vaidya R et al. Blood 2011;117:5612-15
Adverse Impact of Monosomal Karyotype
Normal karyoM 50 mo
Monosomal karyoM 6 mo
Sole +8M 20 mo
Complex karyoNo monosomalM 24 mo

“Very-High Risk” Patients: >80% MortalityAt 2 Years
Tefferi A et al. Blood 2011; 118:4595-8
Low (3%)
Int-1 (11%)
Int-2 (26%)High (53%)
Very High (82%)
Very-High risk variables
• monosomal karyotype
• inv(3)/i(17q)
or any 2 of the following:
• PB blasts >9%
• WBC >40x109/L
• other unfavorable karyotype

Novel Prognostic Variables
• Somatic Mutations
• Germline Characteristics
• Cytokines
• Other biomarkers (FLC, hepcidin & ferritin
levels)

P=0.198
WT
V617F
JAK2 V617F Mutation and Prognosis in PMF
JAK2 V617F JAK2 wt
89 (31.1%) 68 (34.5%)
103.4 mo (77.5-129.3)
137.6 mo(48.5-226.8)
N=483
Guglielmelli P et al, ASH2012

No Impact of JAK2V617F on Leukemia Risk
WT
V617F
P=0.839HR: 1.05 (95% CI, 0.7-1.7)
(Competitive risk analysis) Guglielmelli P et al, ASH2012

Blast transformation: Kaplan-Meier analysis
jak2=wt
jak2=heteroz
jak2=homoz
0.00
0.25
0.50
0.75
1.00
145 101 58 37 23 15 12 6 1 1 0jak2=homoz223 118 56 36 19 13 9 6 4 4 2 jak2=heteroz225 130 83 60 42 27 19 9 5 2 0jak2=wt
Number at risk
0 36 72 108 144 180 216 252 288 324 360Months
Kaplan Meier estimates for JAK2Event=Leukemia-transformation
Barosi et al. PlosOne 2013, In press
IPSS prognostic score 4.33 (1.5-12.6) 0.007
JAK2 V617F wt or Homo vs. Hetero
2.43 (1.44-4) 0.02
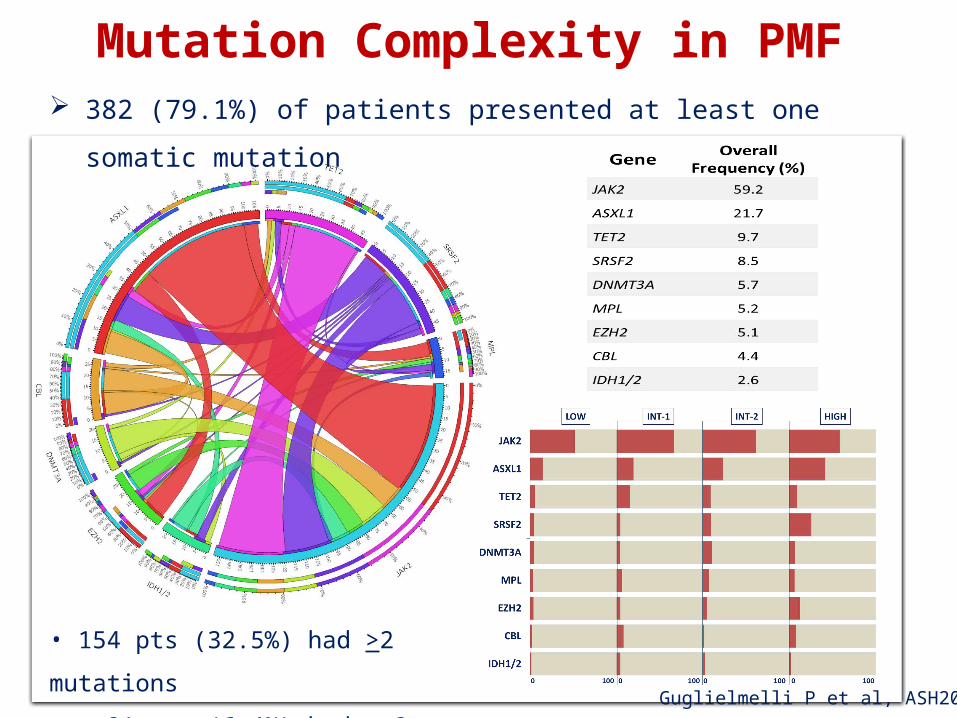
Mutation Complexity in PMF 382 (79.1%) of patients presented at least one somatic mutation
• 154 pts (32.5%) had >2 mutations
• 31 pts (6.4%) had >3 mutationsGuglielmelli P et al, ASH2012

EZH2 ASXL1
SRSF2
P= 0.0008 P< 0.0001
P< 0.0001
Hazard Risk(95% CI range) P
EZH2 1.91 (1.08-3.36) 0.025
ASXL1 2.21 (1.57-3.11) <0.0001
SRSF2 2.60 (1.63-41.6) <0.0001
Mutations Associated with Reduced Overall Survival in Multivariate Analysis
WTMut
WTMut
WT
Mut
Guglielmelli P et al, ASH2012

EZH2 ASXL1
SRSF2 IDH1/2
P=.003HR=1.98 (95%CI: 0.88-4.46)
P<.0001HR=2.5 (95%CI: 1.51-4.13)
P=.007HR= 2.73 (95%CI: 1.34-5.55)
P<.0001HR= 2.66(95%CI: 1.10-6.47)
* Competitive Risk Analysis
Mutations Associated with Leukemiain Multivariate Analysis
WT
Mut
WTMut
WTMut
WTMut
Guglielmelli P et al, ASH2012

• In the “molecularly high-risk” category, overall survival was 81 months (range: 61.9-99.5) compared with 148 months (range: 52.5-243.2) in the “molecularly low-risk” category (P<0.0001). Mutivariate analysis.
Low Risk
High Risk
P<0.0001
HR= 2.29 (95%CI: 1.65-3.19)
A "Molecularly High-Risk" Status Associates with Reduced Overall Survival
• EZH2• ASXL1• SRSF2• IDH1/2
Guglielmelli P et al, ASH2012

P<0.0001
Low Risk
High Risk
HR 2.96 (95%CI:1.85-4.76)
• In the “molecularly high-risk” category, leukemia-free survival was 129 months (range: 90-168) compared with 323 months (range: 194-452) in the “molecularly low-risk” category (P<0.0001) – Competitive risk analysis
A "Molecularly High-Risk" Status Associates With Leukemia Transformation
• EZH2• ASXL1• SRSF2• IDH1/2
Guglielmelli P et al, ASH2012
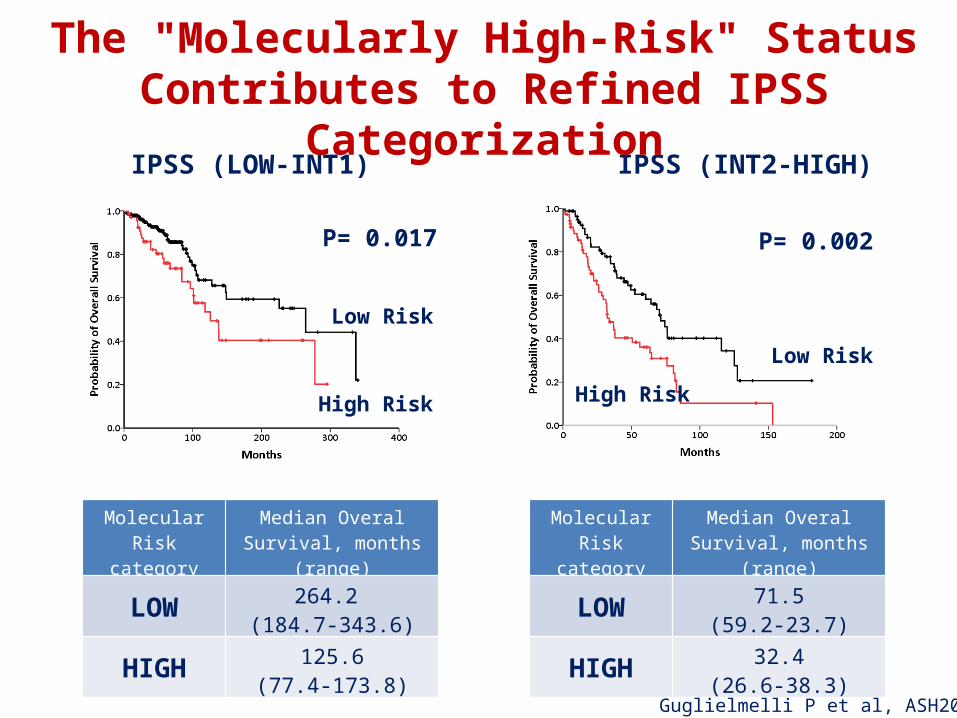
P= 0.017 P= 0.002
IPSS (LOW-INT1) IPSS (INT2-HIGH)
Low Risk
High Risk
Low Risk
High Risk
Molecular Risk category
Median Overal Survival, months (range)
LOW 264.2 (184.7-343.6)
HIGH 125.6(77.4-173.8)
Molecular Risk category
Median Overal Survival, months (range)
LOW 71.5(59.2-23.7)
HIGH 32.4(26.6-38.3)
The "Molecularly High-Risk" Status Contributes to Refined IPSS Categorization
Guglielmelli P et al, ASH2012
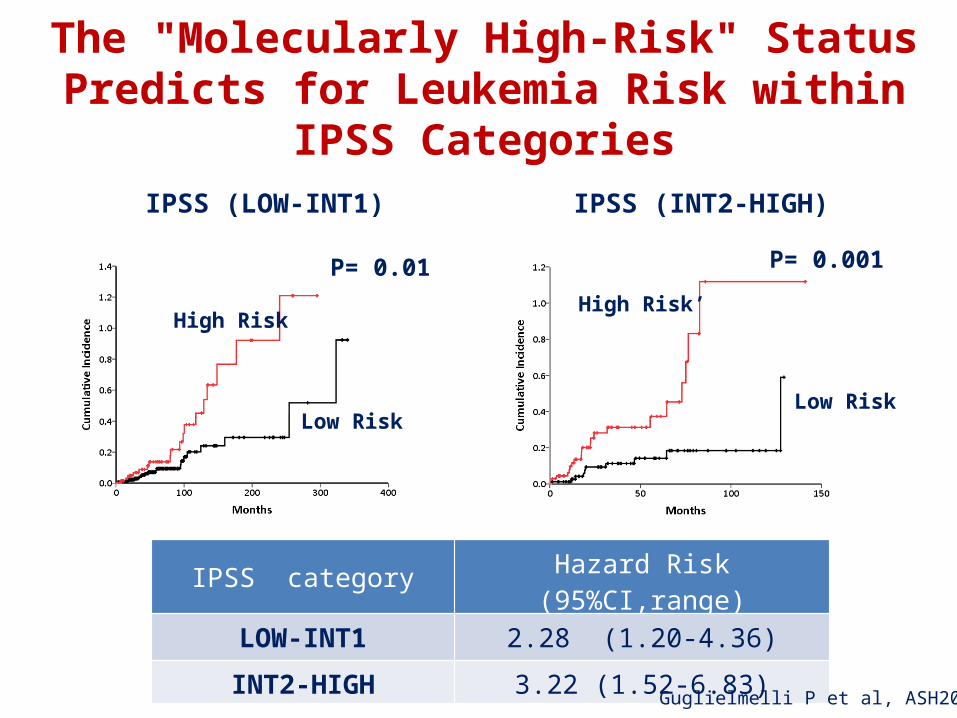
P= 0.01 P= 0.001
IPSS (LOW-INT1) IPSS (INT2-HIGH)
Low Risk
High Risk
Low Risk
High Risk’
IPSS category Hazard Risk (95%CI,range)
LOW-INT1 2.28 (1.20-4.36)
INT2-HIGH 3.22 (1.52-6.83)
The "Molecularly High-Risk" Status Predicts for Leukemia Risk within IPSS Categories
Guglielmelli P et al, ASH2012

ABSTRACT #430
Prognostic Interactions Between SRSF2, ASXL1, and IDH Mutations in Primary Myelofibrosis and Determination of Added Value to Cytogenetic Risk Stratification and DIPSS-PlusTerra L Lasho, MT, (ASCP)1*, Naseema Gangat, MD1*, Christy Finke, BS1*, Rebecca R. Laborde, PhD1*, Curtis A Hanson, MD2*, Rhett P Ketterling, MD3*, Ryan A Knudson3*, Animesh Pardanani, MBBS, PhD1 and Ayalew Tefferi, MD1

Barosi G et al, Blood 2012; 120:3112-7*, restricted to JAK2V617Fpos pts, n=295
OS* BT*
The A3669G Polymorhism of Glucocorticoid Receptor Contributes to Blast Transformation in PMF
0.47 per 100 pt-yr
13.6 per 100 pt-yr77.6mo vs 298mo; P=0.049
76.7mo vs 261mo; P=0.018remained significant in multivariate
• The A3669G allele is a susceptibility allele for PMF (HR 1.6-1.8)
• The G/G allele associated with a «more-myeloproliferative» phenotype
N=21N=274

Tefferi A et al. JCO 2011;29:1356-1363
All (n=127)
Treatment naive (n=90)
Int-1 (n=27)
Int-2 (n=70)
Abnormally Increased IL-8 and IL2R Plasma Levels Are Prognostically Detrimental

Pardanani A et al. JCO 2012;30:1087-94
Plasma Free Light Chain (FLC) Levels Predict Survival in PMF
Levels above or below the ROC cutoff (3.78 mg/dL)
FCL FCL +/- IL-8 and/or IL-2R
Both normal
Either abnormal
Both abnormal
< 3.78 mg/dL
Both abnormal> 3.78 mg/dL

Conclusions
• Prognostic scores in OMF are needed for therapeutic choices
• At present, they are mainly reserved for HSCT decision• Most used scores are based on clinical and hematologic
variables• Cytogenetics has been show to add to clinical scores• Molecular characterization may help refine clinical
scores, be cost-effective and overcome technical limitations of conventional cytogenetics

Acknowledgments
Section of Hematology, University of Florence
Paola Guglielmelli Flavia BiamonteTiziana FanelliAmbra SpolveriniMaria Chiara SusiniGiada RotunnoAlessandro PancrazziLisa Pieri
Mario Cazzola - PaviaGianni Barosi - PaviaFrancisco Cervantes - BarcelonaAndrea Reiter - MannheimAndrew Duncombe - SouthamptonKaterine Zoe - AthensNick Cross - Salisbury
Contributors