professor michael e. porter harvard business school ... files/20061218_maine_state... · harvard...
TRANSCRIPT
Copyright © 2006 Professor Michael E. PorterMeetings Dec-18-2006 RB MM 1
Maine Competitiveness:Moving to a New Economic Development Model
Professor Michael E. PorterHarvard Business School
December 18, 2006
This presentation draws on ideas from Professor Porter’s articles and books, in particular, The Competitive Advantage of Nations (The Free Press, 1990), “Clusters and the New Competitive Agenda for Companies and Governments” in On Competition (Harvard Business School Press, 1998), and the Clusters of Innovation Initiative (www.compete.org), a joint effort of the Council on Competitiveness, Monitor Group, Professor Porter, and the Cluster Mapping Project at Harvard Business School. Additional information may be found at the website of the Institute for Strategy and Competitiveness, www.isc.hbs.edu

Copyright © 2006 Professor Michael E. PorterMeetings Dec-18-2006 RB MM 2
WY
WV
WI
WA
VT
VA
UT
TX
TN
SD
SC
RI
PA
OR
OK
OH
NY
NV
NM
NJ
NH
NE
ND
NC
MTMS
MO
MNMI
ME
MD
MA
LAKY
KSIN
IL
ID
IA
HI
GA
FL
DE
CT
CO
CA
AZ
AR
AL
AK
$25,000
$30,000
$35,000
$40,000
$45,000
$50,000
2.0% 2.5% 3.0% 3.5% 4.0% 4.5%
U.S. StatesComparative Private Wage Performance, 1990-2004
Source: Prof. Michael E. Porter, Cluster Mapping Project, Institute for Strategy and Competitiveness, Harvard Business School; Richard Bryden, Project Director.
Maine
U.S. Average Wage Growth: 3.61%
U.S. Average Wage: $36,967
Wage Growth (CAGR), 1990-2004
Ave
rage
Wag
e, 2
004
Massachusetts
Connecticut
New Hampshire
Rhode Island
VermontKY IA
Copyright © 2006 Professor Michael E. PorterMeetings Dec-18-2006 RB MM 3
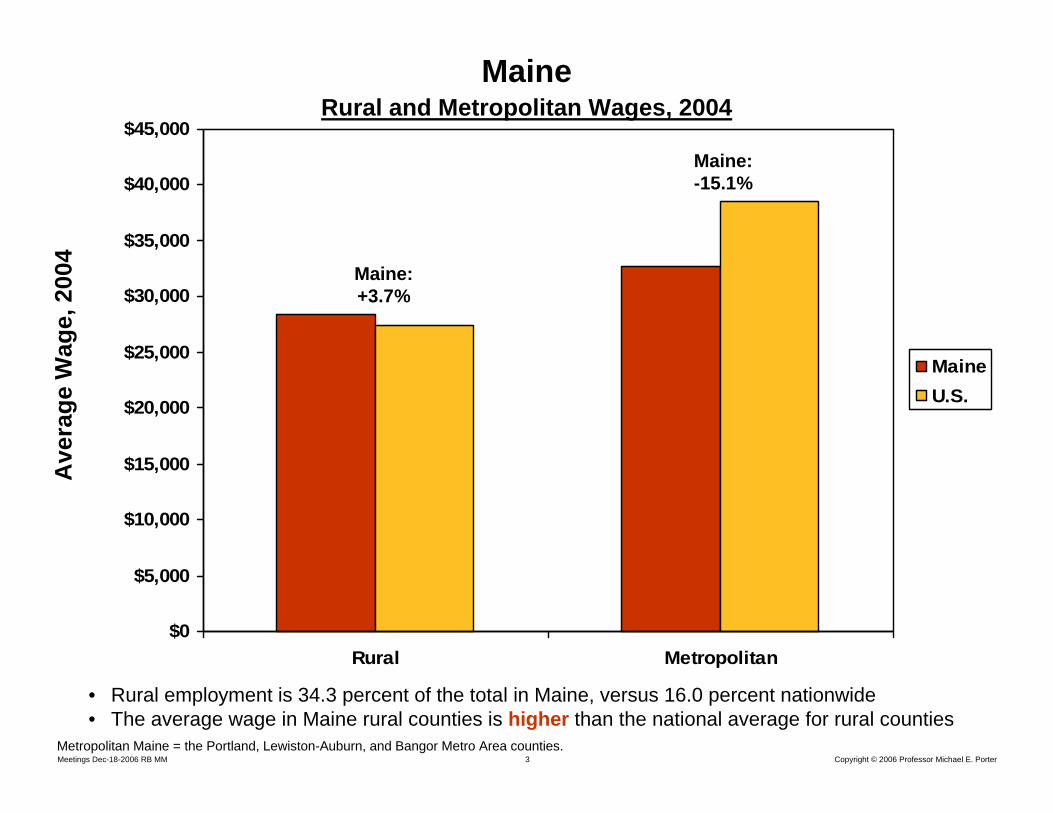
MaineRural and Metropolitan Wages, 2004
$0
$5,000
$10,000
$15,000
$20,000
$25,000
$30,000
$35,000
$40,000
$45,000
Rural Metropolitan
MaineU.S.
• Rural employment is 34.3 percent of the total in Maine, versus 16.0 percent nationwide• The average wage in Maine rural counties is higher than the national average for rural counties
Ave
rage
Wag
e, 2
004
Maine: +3.7%
Maine: -15.1%
Metropolitan Maine = the Portland, Lewiston-Auburn, and Bangor Metro Area counties.

420061114 Texas – Draft 20061106 Copyright © 2006 Professor Michael E. Porter
• Competitiveness is the productivity (value per unit of input) with which a region or cluster utilizes its human, capital, and natural resources. Productivity sets a nation’s or region’s standard of living (wages, returns on capital, returns on natural resources)
– It is not what industries a region competes in that matters for prosperity, but howfirms compete in those industries
• Nations or regions compete in offering the most productive environment for business
What is Competitiveness?

Copyright © 2006 Professor Michael E. PorterMeetings Dec-18-2006 RB MM 5
Context for Firm
Strategy and Rivalry
Context for Firm
Strategy and Rivalry
Related and Supporting Industries
Related and Supporting Industries
Factor(Input)
Conditions
Factor(Input)
ConditionsDemand
ConditionsDemand
Conditions
Upgrading the Business Environment
• Successful economic development is the process of enhancing the business environment to support and encourage increasingly sophisticated ways of competing
Sophisticated and demanding local customer(s)Local needs that anticipate those elsewhere
Presence of high quality business inputs
–Human resources–Capital resources–Physical infrastructure–Scientific and technological
infrastructure –Administrative systems (e.g.,
permitting and approvals)–Business-related information–Sustainable natural resources
Access to capable, locally based suppliersand firms in related fieldsPresence of clusters instead of isolated industries
Local rules, regulations, and norms that encourage investment and productivityOpen and vigorous local competition
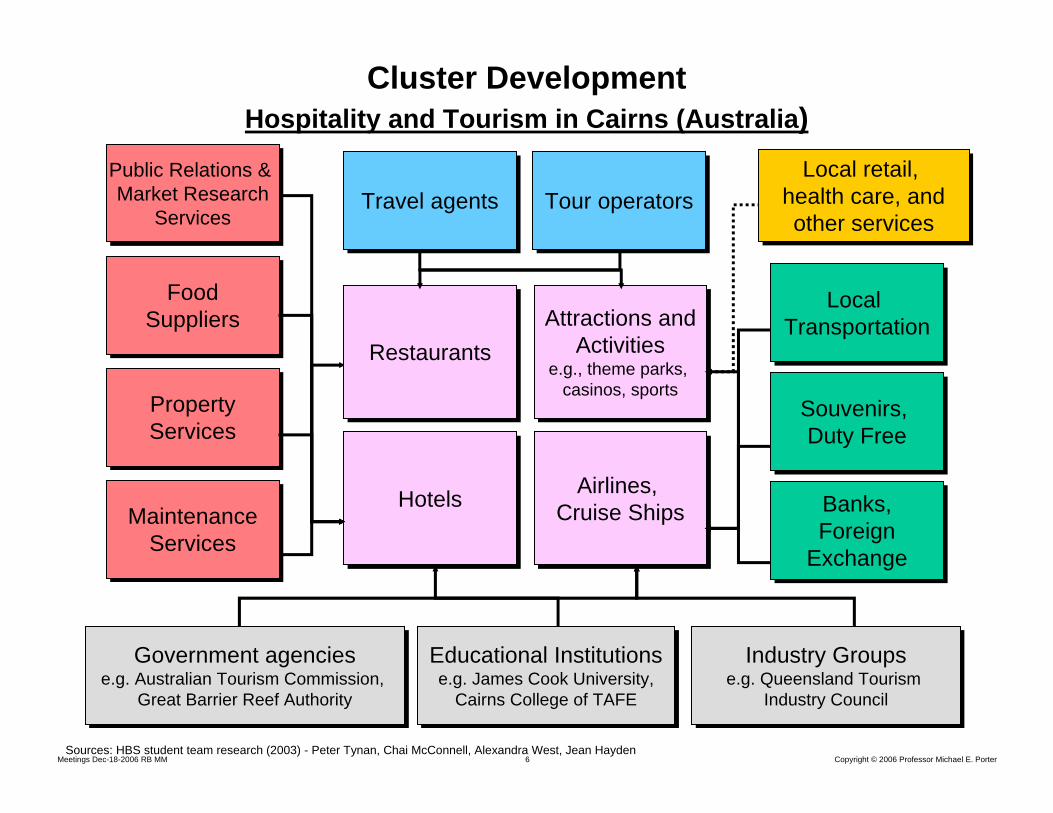
Copyright © 2006 Professor Michael E. PorterMeetings Dec-18-2006 RB MM 6Sources: HBS student team research (2003) - Peter Tynan, Chai McConnell, Alexandra West, Jean Hayden
HotelsHotels
Attractions andActivities
e.g., theme parks, casinos, sports
Attractions andActivities
e.g., theme parks, casinos, sports
Airlines, Cruise Ships
Airlines, Cruise Ships
Travel agentsTravel agents Tour operatorsTour operators
RestaurantsRestaurants
PropertyServicesPropertyServices
MaintenanceServices
MaintenanceServices
Government agenciese.g. Australian Tourism Commission,
Great Barrier Reef Authority
Government agenciese.g. Australian Tourism Commission,
Great Barrier Reef Authority
Educational Institutionse.g. James Cook University,
Cairns College of TAFE
Educational Institutionse.g. James Cook University,
Cairns College of TAFE
Industry Groupse.g. Queensland Tourism
Industry Council
Industry Groupse.g. Queensland Tourism
Industry Council
FoodSuppliers
FoodSuppliers
Public Relations & Market Research
Services
Public Relations & Market Research
Services
Cluster DevelopmentHospitality and Tourism in Cairns (Australia)
Local retail, health care, andother services
Local retail, health care, andother services
Souvenirs, Duty Free
Souvenirs, Duty Free
Banks,Foreign
Exchange
Banks,Foreign
Exchange
Local Transportation
Local Transportation
Copyright © 2006 Professor Michael E. PorterMeetings Dec-18-2006 RB MM 7
Educational, Research, and Trade Organizations (e.g., Wine Institute,
UC Davis, Culinary Institutes)
Educational, Research, and Trade Educational, Research, and Trade Organizations (e.g., Wine Institute, Organizations (e.g., Wine Institute,
UC Davis, Culinary Institutes)UC Davis, Culinary Institutes)
Growers / VineyardsGrowers / Vineyards
Wineries / Processing Facilities
Wineries / Processing Facilities
GrapestockGrapestockGrapestock
Fertilizer, Pesticides, Herbicides
Fertilizer, Pesticides, Fertilizer, Pesticides, HerbicidesHerbicides
Grape Harvesting Equipment
Grape Harvesting Grape Harvesting EquipmentEquipment
Irrigation TechnologyIrrigation TechnologyIrrigation Technology
Winemaking Equipment
Winemaking Winemaking EquipmentEquipment
BarrelsBarrelsBarrels
LabelsLabelsLabels
BottlesBottlesBottles
Caps and CorksCaps and CorksCaps and Corks
Public Relationsand Advertising
Public RelationsPublic Relationsand Advertisingand Advertising
Specialized Publications
(e.g., Wine Spectator, Trade Journal)
Specialized Specialized PublicationsPublications
(e.g., Wine Spectator, (e.g., Wine Spectator, Trade Journal)Trade Journal)
Food ClusterFood ClusterFood Cluster
Tourism ClusterTourism ClusterTourism ClusterCalifornia
AgriculturalCluster
CaliforniaCaliforniaAgriculturalAgricultural
ClusterCluster
State Government Agencies(e.g., Select Committee on Wine
Production and Economy)
State Government AgenciesState Government Agencies(e.g., Select Committee on Wine (e.g., Select Committee on Wine
Production and Economy)Production and Economy)
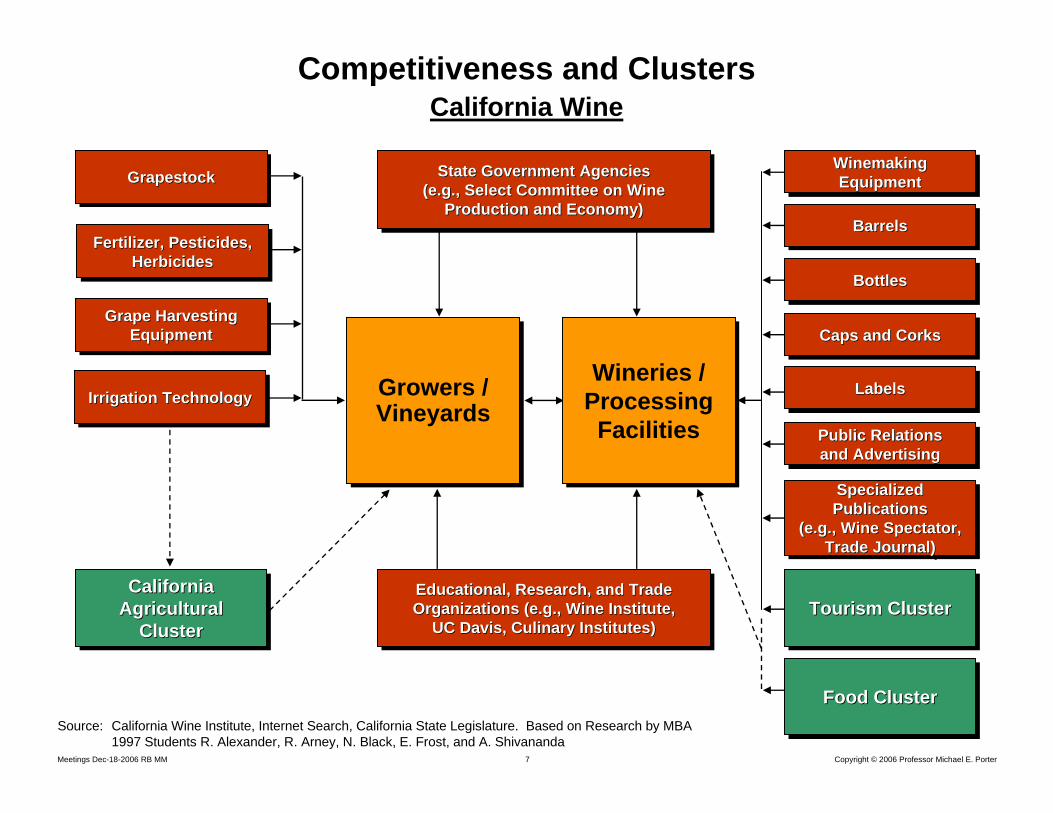
Source: California Wine Institute, Internet Search, California State Legislature. Based on Research by MBA 1997 Students R. Alexander, R. Arney, N. Black, E. Frost, and A. Shivananda
Competitiveness and ClustersCalifornia Wine
Copyright © 2006 Professor Michael E. PorterMeetings Dec-18-2006 RB MM 8
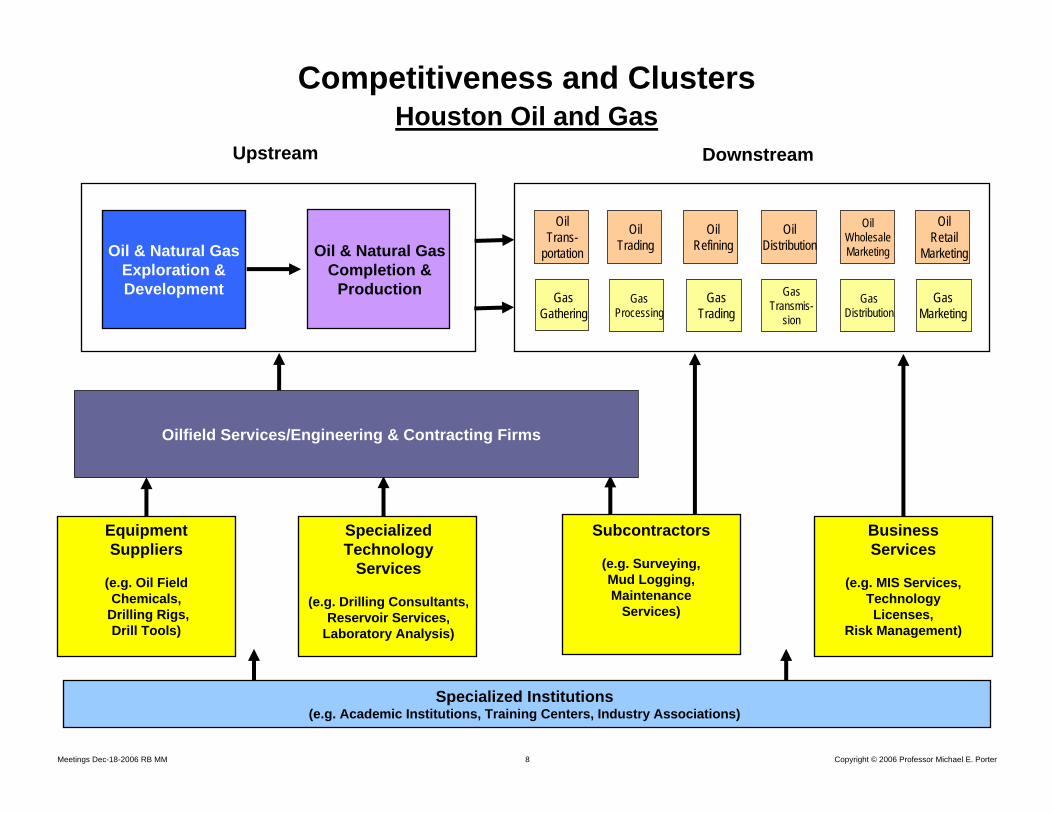
Equipment Suppliers
(e.g. Oil Field Chemicals,
Drilling Rigs, Drill Tools)
Specialized Institutions (e.g. Academic Institutions, Training Centers, Industry Associations)
SpecializedTechnology
Services
(e.g. Drilling Consultants,Reservoir Services,
Laboratory Analysis)
Subcontractors
(e.g. Surveying,Mud Logging,Maintenance
Services)
BusinessServices
(e.g. MIS Services,Technology Licenses,
Risk Management)
OilTrans-
portation
OilTrading
OilRefining
Oil Retail
Marketing
OilWholesaleMarketing
OilDistribution
GasGathering
GasProcessing
GasTrading
GasTransmis-
sion
GasDistribution
GasMarketing
Oil & Natural GasExploration & Development
Oil & Natural Gas Completion &
Production
Upstream Downstream
Oilfield Services/Engineering & Contracting Firms
Competitiveness and ClustersHouston Oil and Gas

Copyright © 2006 Professor Michael E. PorterMeetings Dec-18-2006 RB MM 9
TradedTraded LocalLocalLocal NaturalResource-Driven
NaturalNaturalResourceResource--DrivenDriven
29.3%0.7%
$49,367137.2%4.2%
144.1
20.4
590
29.3%0.7%
$49,367137.2%4.2%
144.1
20.4
590
70.0%2.4%
$30,41684.53.4%
79.3
0.4
241
70.0%70.0%2.4%2.4%
$30,416$30,41684.584.53.4%3.4%
79.379.3
0.40.4
241241
0.7%-1.2%
$35,81599.52.1%
140.1
3.0
48
0.7%0.7%--1.2%1.2%
$35,815$35,81599.599.52.1%2.1%
140.1140.1
3.03.0
4848
Share of EmploymentEmployment Growth Rate,
1990 to 2004
Average WageRelative WageWage Growth
Relative Productivity
Patents per 10,000 Employees
Number of SIC Industries
Note: 2004 data, except relative productivity which uses 1997 data.Source: Prof. Michael E. Porter, Cluster Mapping Project, Institute for Strategy and Competitiveness, Harvard Business School
The Composition of Regional EconomiesUnited States, 2004
Copyright © 2006 Professor Michael E. PorterMeetings Dec-18-2006 RB MM 10
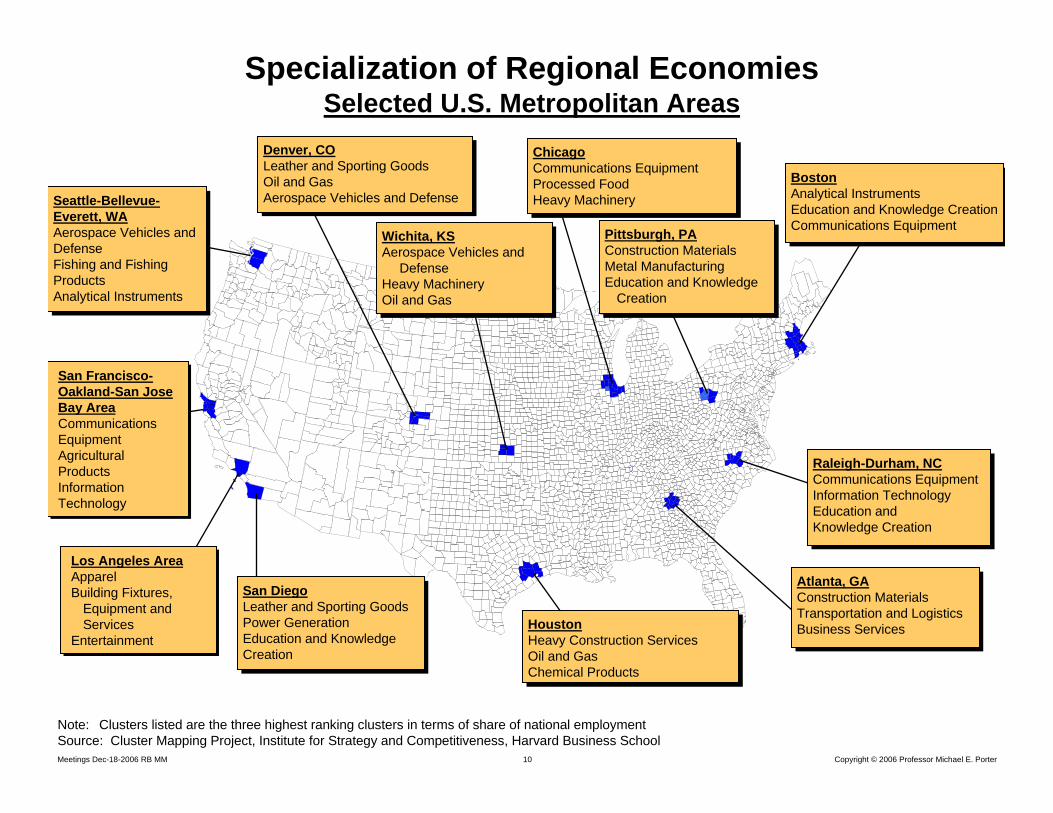
Specialization of Regional EconomiesSelected U.S. Metropolitan Areas
BostonAnalytical InstrumentsEducation and Knowledge CreationCommunications Equipment
BostonAnalytical InstrumentsEducation and Knowledge CreationCommunications Equipment
Los Angeles AreaApparelBuilding Fixtures,
Equipment and Services
Entertainment
Los Angeles AreaApparelBuilding Fixtures,
Equipment and Services
Entertainment
ChicagoCommunications EquipmentProcessed FoodHeavy Machinery
ChicagoCommunications EquipmentProcessed FoodHeavy Machinery
Denver, COLeather and Sporting GoodsOil and GasAerospace Vehicles and Defense
Denver, COLeather and Sporting GoodsOil and GasAerospace Vehicles and Defense
San DiegoLeather and Sporting GoodsPower GenerationEducation and Knowledge Creation
San DiegoLeather and Sporting GoodsPower GenerationEducation and Knowledge Creation
San Francisco-Oakland-San Jose Bay AreaCommunications EquipmentAgricultural ProductsInformation Technology
San Francisco-Oakland-San Jose Bay AreaCommunications EquipmentAgricultural ProductsInformation Technology
Seattle-Bellevue-Everett, WAAerospace Vehicles and DefenseFishing and Fishing ProductsAnalytical Instruments
Seattle-Bellevue-Everett, WAAerospace Vehicles and DefenseFishing and Fishing ProductsAnalytical Instruments
HoustonHeavy Construction ServicesOil and GasChemical Products
HoustonHeavy Construction ServicesOil and GasChemical Products
Pittsburgh, PAConstruction MaterialsMetal ManufacturingEducation and Knowledge
Creation
Pittsburgh, PAConstruction MaterialsMetal ManufacturingEducation and Knowledge
Creation
Atlanta, GAConstruction MaterialsTransportation and LogisticsBusiness Services
Atlanta, GAConstruction MaterialsTransportation and LogisticsBusiness Services
Raleigh-Durham, NCCommunications EquipmentInformation TechnologyEducation andKnowledge Creation
Raleigh-Durham, NCCommunications EquipmentInformation TechnologyEducation andKnowledge Creation
Wichita, KSAerospace Vehicles and
DefenseHeavy MachineryOil and Gas
Wichita, KSAerospace Vehicles and
DefenseHeavy MachineryOil and Gas
Note: Clusters listed are the three highest ranking clusters in terms of share of national employmentSource: Cluster Mapping Project, Institute for Strategy and Competitiveness, Harvard Business School

11 Copyright 2005 © Professor Michael E. PorterSession 2 –MOC Workshop- Dec 13, 2005
The Evolution of Regional EconomiesSan Diego
U.S. Military
CommunicationsEquipment
Sporting andLeather Goods
Analytical Instruments
Power GenerationAerospace Vehicles
and Defense
Transportationand Logistics
Information Technology
19101910 19301930 19501950 1990199019701970
Bioscience Research Centers
Climate and
Geography
Hospitality and Tourism
Medical Devices
Biotech / Pharmaceuticals
Education andKnowledge Creation
Copyright © 2006 Professor Michael E. PorterMeetings Dec-18-2006 RB MM 12
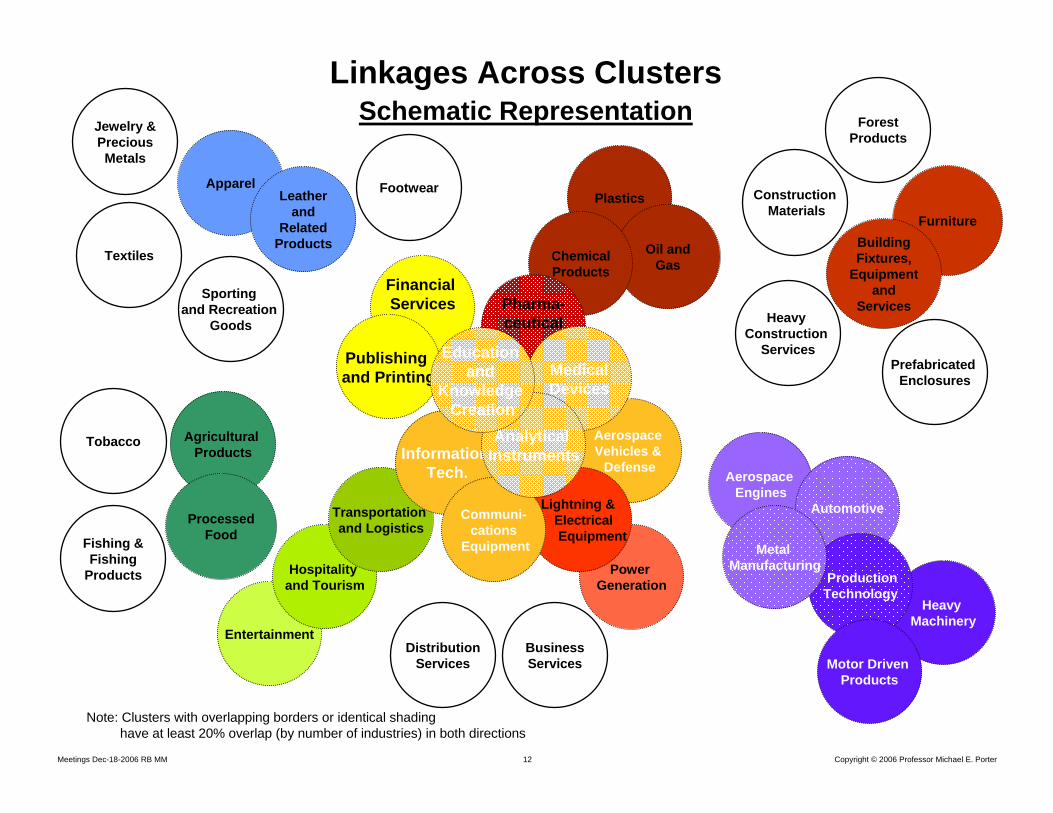
Plastics
Oil and GasChemical
Products
Pharma-ceutical
Power Generation
Aerospace Vehicles &
Defense
Lightning & Electrical Equipment
Financial Services
Publishing and Printing
Entertainment
Hospitality and Tourism
Transportation and Logistics
Information Tech.
Communi-cations
Equipment
Medical Devices
Analytical Instruments
Education and
Knowledge Creation
ApparelLeather
and Related
Products
Agricultural Products
Processed Food
FurnitureBuilding Fixtures,
Equipment and
Services
Note: Clusters with overlapping borders or identical shading have at least 20% overlap (by number of industries) in both directions
Sporting and Recreation
Goods
Business Services
DistributionServices
Fishing & Fishing
Products
Footwear
Forest Products
Heavy Construction
Services
Jewelry & Precious Metals
ConstructionMaterials
Prefabricated Enclosures
Textiles
Tobacco
Heavy Machinery
Aerospace Engines
Automotive
Production Technology
Motor Driven Products
Metal Manufacturing
Linkages Across ClustersSchematic Representation

Copyright © 2006 Professor Michael E. PorterMeetings Dec-18-2006 RB MM 13
MaineEmployment by Traded Cluster, 2004
Employment, 2004
Rank in US
Note: Ranks are among the 50 US states plus the District of Columbia. Maine overall employment rank = 40.
6198166175231272295299313
538553678
8931,0921,0971,1421,1471,3011,3671,4191,488
1,8961,9252,0252,1132,1652,2022,292
2,5902,782
3,0463,705
6,3976,714
7,8628,338
10,66210,968
11,821
15,46513,184
0 2,000 4,000 6,000 8,000 10,000 12,000 14,000 16,000 18,000
Tobacco 40Oil and Gas Products and Services 47
Jew elry and Precious Metals 44Aerospace Vehicles and Defense 38
Motor Driven Products 43Prefabricated Enclosures 47
Sporting, Recreational and Children's Goods 40Chemical Products 47
Apparel 41Construction Materials 40
Biopharmaceuticals 39Lighting and Electrical Equipment 38
Fishing and Fishing Products 16Analytical Instruments 44
Production Technology 42Footw ear 11
Pow er Generation and Transmission 42Heavy Machinery 40
Leather and Related Products 30Automotive 43
Communications Equipment 35Furniture 31
Aerospace Engines 12Agricultural Products 31
Medical Devices 33Metal Manufacturing 41
Plastics 41Textiles 16
Building Fixtures, Equipment and Services 39Information Technology 32Publishing and Printing 41
Entertainment 45Distribution Services 40
Heavy Construction Services 42Processed Food 38Forest Products 22
Transportation and Logistics 35Education and Know ledge Creation 38
Business Services 45Hospitality and Tourism 40
Financial Services 36
Source: Prof. Michael E. Porter, Cluster Mapping Project, Institute for Strategy and Competitiveness, Harvard Business School; Richard Bryden, Project Director.

Copyright © 2006 Professor Michael E. PorterMeetings Dec-18-2006 RB MM 14
5,965
7,185
8,601
9,000
10,095
10,938
12,120
13,411
18,214
21,440
22,926
26,653
35,268
38,438
39,191
82,177
0 10,000 20,000 30,000 40,000 50,000 60,000 70,000 80,000 90,000
Local Industrial Products and Services 42
Local Education and Training 39
Local Household Goods and Services 39
Local Entertainment and Media 43
Local Utilities 38
Local Personal Services (Non-Medical) 39
Local Financial Services 43
Local Logistical Services 38
Local Retail Clothing and Accessories 42
Local Community and Civic Organizations 39
Local Motor Vehicle Products and Services 40
Local Food and Beverage Processing and Distribution 38
Local Commercial Services 42
Local Real Estate, Construction, and Development 41
Local Hospitality Establishments 43
Local Health Services 37
Employment, 2004
Rankin US
MaineEmployment by Local Cluster, 2004
Maine overall employment rank = 40.Source: Prof. Michael E. Porter, Cluster Mapping Project, Institute for Strategy and Competitiveness, Harvard Business School; Richard Bryden, Project Director.

Copyright © 2006 Professor Michael E. PorterMeetings Dec-18-2006 RB MM 15
Agricultural Products
Maine's Overall Share of US Employment: 0.43%
0.00%
0.50%
1.00%
1.50%
2.00%
2.50%
-1.50% -1.00% -0.50% 0.00% 0.50% 1.00%
MaineSpecialization by Traded Cluster, 1990-2004
Change in Share of US Cluster Employment, 1990-2004
Overall change in the Maine's Share of US
Employment: -0.025%
2,000 Employees =Source: Prof. Michael E. Porter, Cluster Mapping Project, Institute for Strategy and Competitiveness, Harvard Business School.
Shar
e of
US
Clu
ster
Em
ploy
men
t, 20
04
Footwear (-8.7%, 4.7%)
Forest Products
Fishing and Fishing Products
TextilesTransportation and Logistics
Processed Food
Building Fixtures, Equipment and Services
Construction Materials
Leather and Related Products
Aerospace Engines
Medical Devices
Power Generation and Transmission
Copyright © 2006 Professor Michael E. PorterMeetings Dec-18-2006 RB MM 16
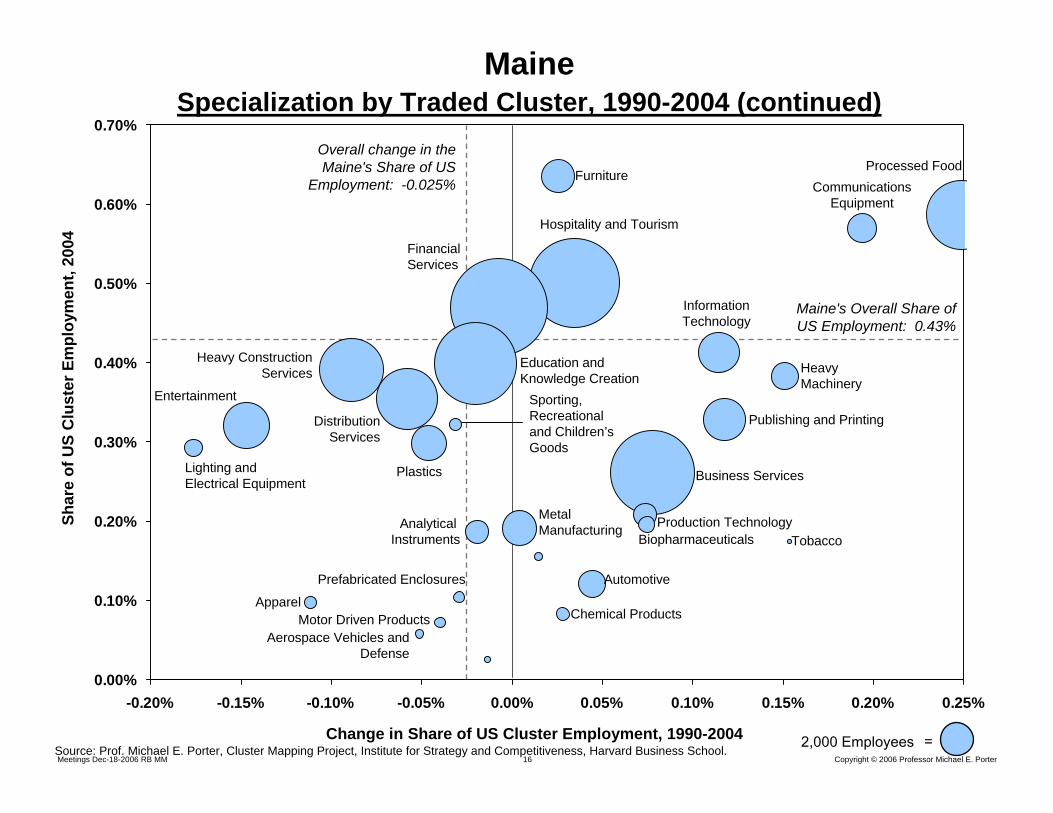
0.00%
0.10%
0.20%
0.30%
0.40%
0.50%
0.60%
0.70%
-0.20% -0.15% -0.10% -0.05% 0.00% 0.05% 0.10% 0.15% 0.20% 0.25%
MaineSpecialization by Traded Cluster, 1990-2004 (continued)
Change in Share of US Cluster Employment, 1990-2004
Maine's Overall Share of US Employment: 0.43%
Overall change in the Maine's Share of US
Employment: -0.025%
2,000 Employees =Source: Prof. Michael E. Porter, Cluster Mapping Project, Institute for Strategy and Competitiveness, Harvard Business School.
Shar
e of
US
Clu
ster
Em
ploy
men
t, 20
04 Financial Services
Hospitality and Tourism
Education and Knowledge Creation
CommunicationsEquipment
Processed Food
Heavy ConstructionServices
Distribution Services
Entertainment
Lighting and Electrical Equipment
Apparel
Analytical Instruments Biopharmaceuticals
Plastics
Sporting,Recreationaland Children’sGoods
Business Services
Production Technology
HeavyMachinery
InformationTechnology
Publishing and Printing
Tobacco
Metal Manufacturing
Furniture
Automotive
Chemical Products
Prefabricated Enclosures
Motor Driven ProductsAerospace Vehicles and
Defense
Copyright © 2006 Professor Michael E. PorterMeetings Dec-18-2006 RB MM 17
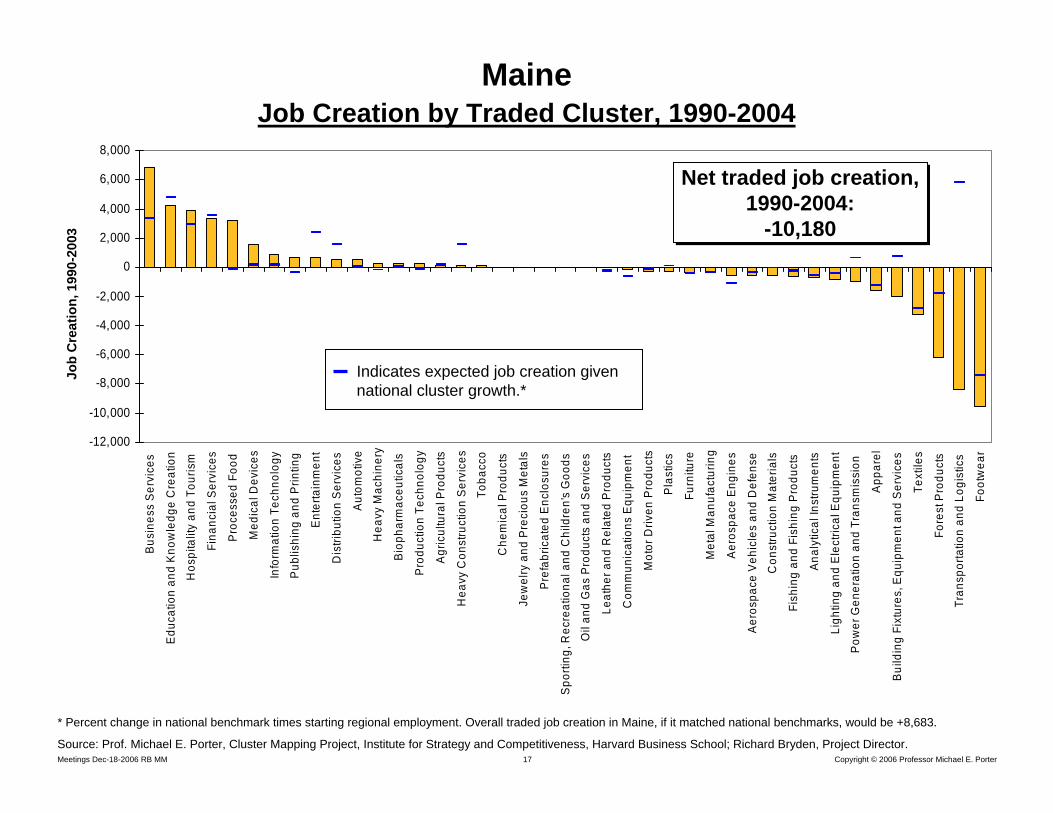
MaineJob Creation by Traded Cluster, 1990-2004
Job
Cre
atio
n, 1
990-
2003
-12,000
-10,000
-8,000
-6,000
-4,000
-2,000
0
2,000
4,000
6,000
8,000Bu
sine
ss S
ervi
ces
Edu
catio
n an
d K
now
ledg
e C
reat
ion
Hos
pita
lity
and
Tour
ism
Fina
ncia
l Ser
vice
s
Pro
cess
ed F
ood
Med
ical
Dev
ices
Info
rmat
ion
Tech
nolo
gy
Pub
lishi
ng a
nd P
rintin
g
Ent
erta
inm
ent
Dis
tribu
tion
Ser
vice
s
Aut
omot
ive
Hea
vy M
achi
nery
Bio
phar
mac
eutic
als
Pro
duct
ion
Tech
nolo
gy
Agr
icul
tura
l Pro
duct
s
Hea
vy C
onst
ruct
ion
Ser
vice
s
Toba
cco
Che
mic
al P
rodu
cts
Jew
elry
and
Pre
ciou
s M
etal
s
Pref
abric
ated
Enc
losu
res
Spo
rting
, Rec
reat
iona
l and
Chi
ldre
n's
Goo
ds
Oil
and
Gas
Pro
duct
s an
d S
ervi
ces
Leat
her a
nd R
elat
ed P
rodu
cts
Com
mun
icat
ions
Equ
ipm
ent
Mot
or D
riven
Pro
duct
s
Pla
stic
s
Furn
iture
Met
al M
anuf
actu
ring
Aer
ospa
ce E
ngin
es
Aer
ospa
ce V
ehic
les
and
Def
ense
Con
stru
ctio
n M
ater
ials
Fish
ing
and
Fish
ing
Pro
duct
s
Anal
ytic
al In
stru
men
ts
Ligh
ting
and
Ele
ctric
al E
quip
men
t
Pow
er G
ener
atio
n an
d Tr
ansm
issi
on
App
arel
Bui
ldin
g Fi
xtur
es, E
quip
men
t and
Ser
vice
s
Text
iles
Fore
st P
rodu
cts
Tran
spor
tatio
n an
d Lo
gist
ics
Foot
wea
r
* Percent change in national benchmark times starting regional employment. Overall traded job creation in Maine, if it matched national benchmarks, would be +8,683.
Net traded job creation, 1990-2004:
-10,180
Net traded job creation, 1990-2004:
-10,180
Indicates expected job creation given national cluster growth.*
Source: Prof. Michael E. Porter, Cluster Mapping Project, Institute for Strategy and Competitiveness, Harvard Business School; Richard Bryden, Project Director.
Copyright © 2006 Professor Michael E. PorterMeetings Dec-18-2006 RB MM 18
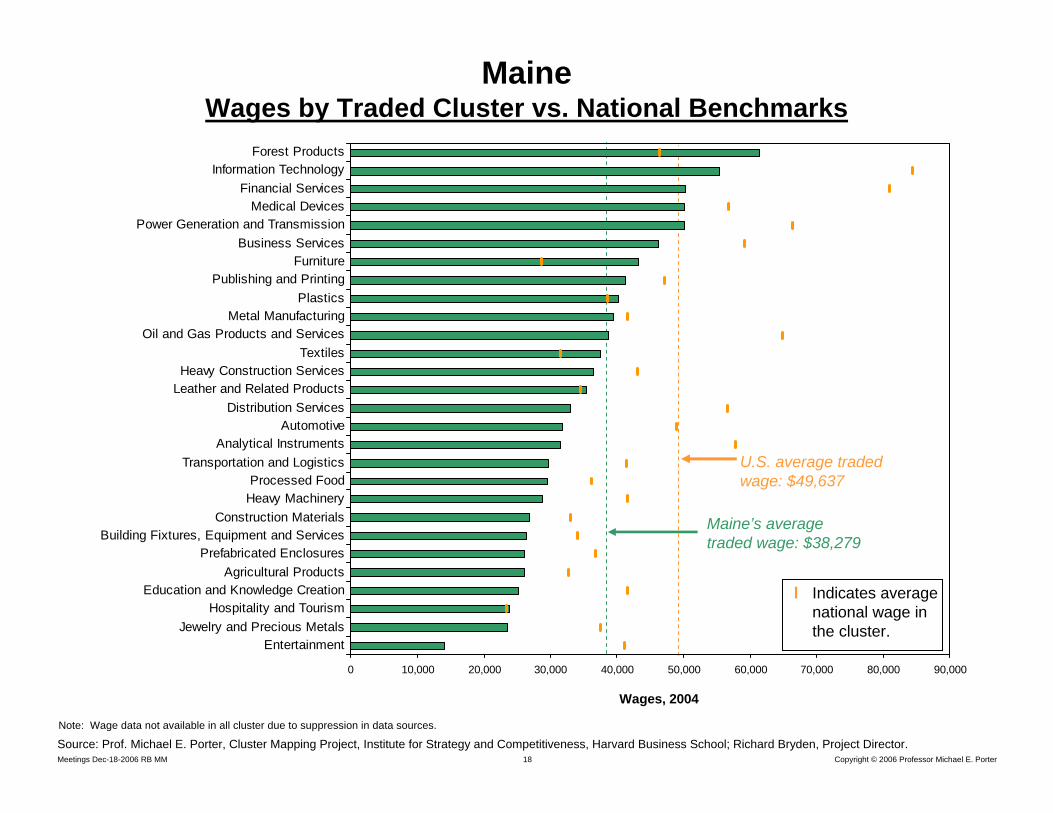
Maine Wages by Traded Cluster vs. National Benchmarks
Wages, 2004
0 10,000 20,000 30,000 40,000 50,000 60,000 70,000 80,000 90,000
EntertainmentJewelry and Precious Metals
Hospitality and TourismEducation and Knowledge Creation
Agricultural ProductsPrefabricated Enclosures
Building Fixtures, Equipment and ServicesConstruction Materials
Heavy MachineryProcessed Food
Transportation and LogisticsAnalytical Instruments
AutomotiveDistribution Services
Leather and Related ProductsHeavy Construction Services
TextilesOil and Gas Products and Services
Metal ManufacturingPlastics
Publishing and PrintingFurniture
Business ServicesPower Generation and Transmission
Medical DevicesFinancial Services
Information TechnologyForest Products
Maine’s average traded wage: $38,279
l Indicates average national wage in the cluster.
Note: Wage data not available in all cluster due to suppression in data sources.
Source: Prof. Michael E. Porter, Cluster Mapping Project, Institute for Strategy and Competitiveness, Harvard Business School; Richard Bryden, Project Director.
U.S. average traded wage: $49,637
Copyright © 2006 Professor Michael E. PorterMeetings Dec-18-2006 RB MM 19
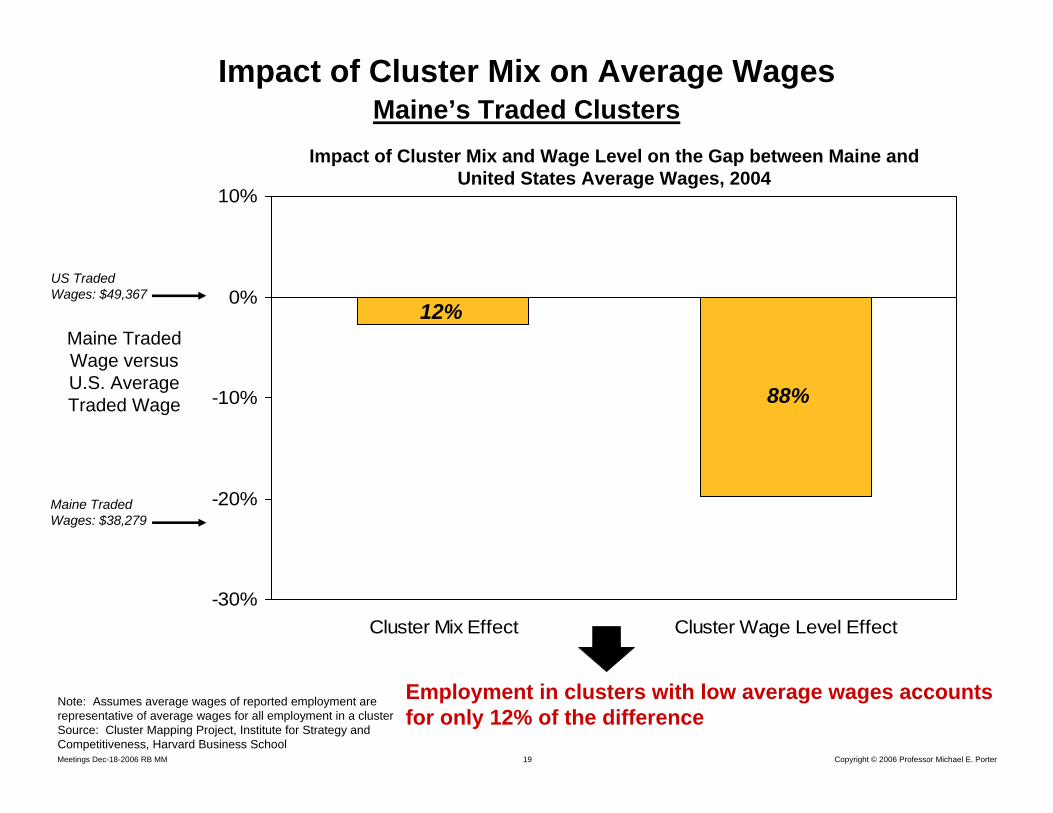
Impact of Cluster Mix on Average WagesMaine’s Traded Clusters
-30%
-20%
-10%
0%
10%
Cluster Mix Effect Cluster Wage Level Effect
88%
Impact of Cluster Mix and Wage Level on the Gap between Maine and United States Average Wages, 2004
Note: Assumes average wages of reported employment are representative of average wages for all employment in a clusterSource: Cluster Mapping Project, Institute for Strategy and Competitiveness, Harvard Business School
Employment in clusters with low average wages accounts for only 12% of the difference
Maine Traded Wage versus U.S. Average Traded Wage
Maine Traded Wages: $38,279
US Traded Wages: $49,367
12%

Copyright © 2006 Professor Michael E. PorterMeetings Dec-18-2006 RB MM 20
Maine Forest Products ClusterJob Creation by Subcluster, 1990-2004
- Indicates expected job creation given national subcluster performanceSource: Prof. Michael E. Porter, Cluster Mapping Project, Institute for Strategy and Competitiveness, Harvard Business School; Richard Bryden, Project Director.

Copyright © 2006 Professor Michael E. PorterMeetings Dec-18-2006 RB MM 21
Maine Hospitality and Tourism ClusterJob Creation by Subcluster, 1990-2004
- Indicates expected job creation given national subcluster performanceSource: Prof. Michael E. Porter, Cluster Mapping Project, Institute for Strategy and Competitiveness, Harvard Business School; Richard Bryden, Project Director.
Copyright © 2006 Professor Michael E. PorterMeetings Dec-18-2006 RB MM 22
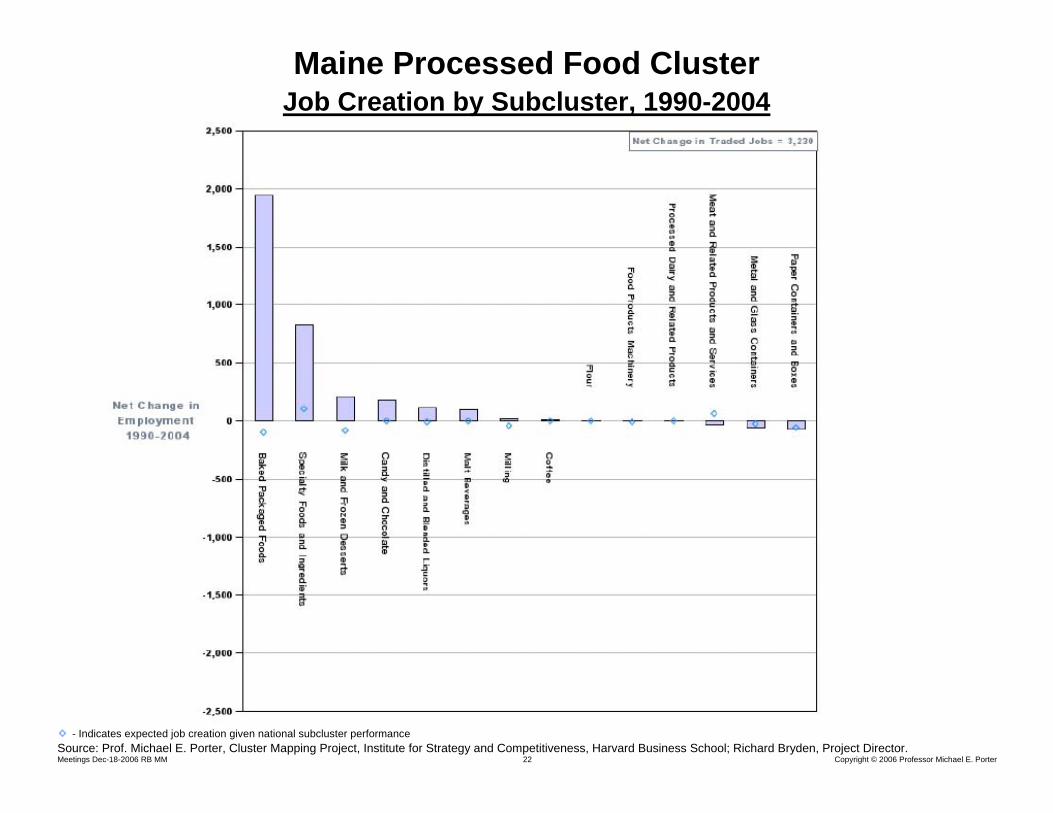
Maine Processed Food ClusterJob Creation by Subcluster, 1990-2004
- Indicates expected job creation given national subcluster performanceSource: Prof. Michael E. Porter, Cluster Mapping Project, Institute for Strategy and Competitiveness, Harvard Business School; Richard Bryden, Project Director.
Copyright © 2006 Professor Michael E. PorterMeetings Dec-18-2006 RB MM 23
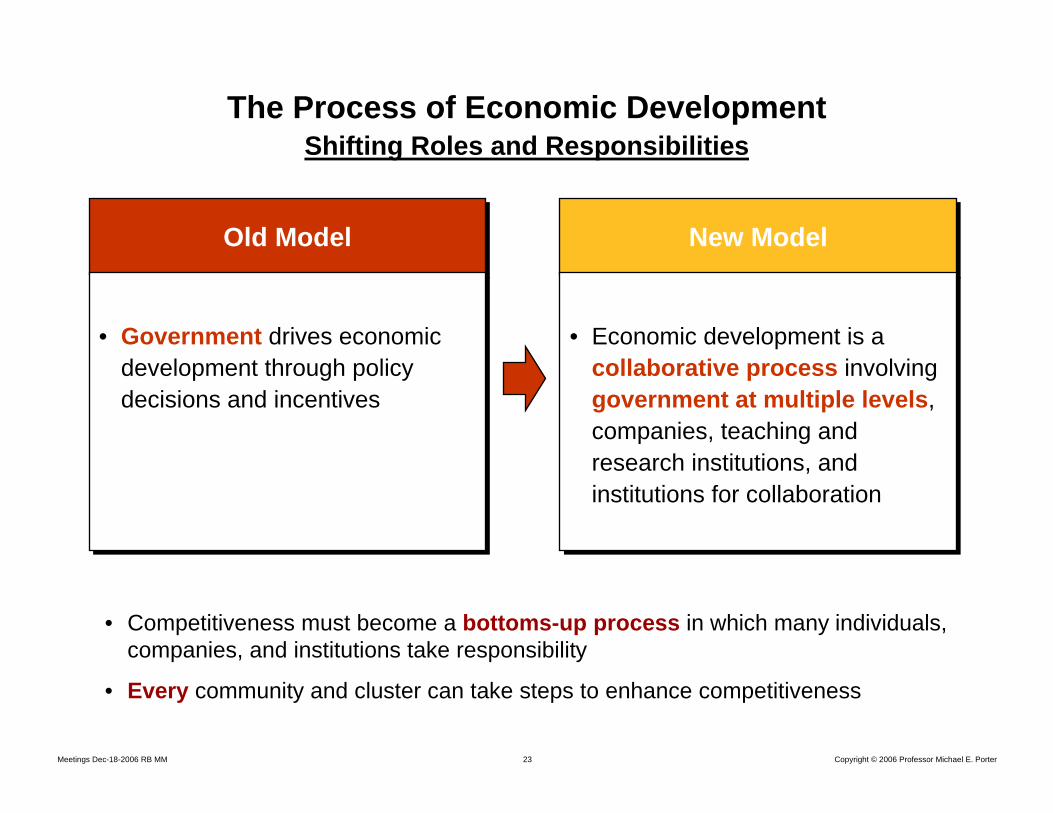
The Process of Economic DevelopmentShifting Roles and Responsibilities
Old ModelOld Model
• Government drives economic development through policy decisions and incentives
• Government drives economic development through policy decisions and incentives
New ModelNew Model
• Economic development is a collaborative process involving government at multiple levels, companies, teaching and research institutions, and institutions for collaboration
• Economic development is a collaborative process involving government at multiple levels, companies, teaching and research institutions, and institutions for collaboration
• Competitiveness must become a bottoms-up process in which many individuals, companies, and institutions take responsibility
• Every community and cluster can take steps to enhance competitiveness

Copyright © 2006 Professor Michael E. PorterMeetings Dec-18-2006 RB MM 24
Public / Private Cooperation in Cluster UpgradingMinnesota’s Medical Device Cluster
Context for Firm
Strategy and Rivalry
Context for Firm
Strategy and Rivalry
Related and Supporting Industries
Related and Supporting Industries
Factor(Input)
Conditions
Factor(Input)
ConditionsDemand
ConditionsDemand
Conditions
• Joint development of vocational-technical college curricula with the medical device industry
• Minnesota Project Outreach exposes businesses to resources available at university and state government agencies
• Active medical technology licensing through University of Minnesota
• State-formed Greater Minnesota Corp. to finance applied research, invest in new products, and assist in technology transfer
• State sanctioned reimbursement policiesto enable easier adoption and reimbursement for innovative products
• Aggressive trade associations(Medical Alley Association, High Tech Council)
• Effective global marketing of the cluster and of Minnesota as the “The Great State of Health”
• Full-time “Health Care Industry Specialist” in the department of Trade and Economic Development

Copyright © 2006 Professor Michael E. PorterMeetings Dec-18-2006 RB MM 25
Clusters and Public Policy
Physical Infrastructure
Natural Resource Protection
Environmental standards
Science and Technology(e.g., research centers, university departments, technology transfer)
Education and Workforce Training
Business Attraction
Export Promotion
• Clusters provide a framework for organizing the implementation of public policy and public investments towards economic development
Product standards
Market Information and Disclosure
Entrepreneurship / Small Business Development
ClustersClusters