productivity of the english hospital episode statistics hrg(4/4+) healthcare resource group (version...
TRANSCRIPT

CHE Research Paper 152
Productivity of the English National Health Service: 2015/16 Update
Adriana Castelli, Martin Chalkley, Idaira Rodriguez Santana

Productivity of the English National Health Service: 2015/16 Update Adriana Castelli Martin Chalkley Idaira Rodriguez Santana
Centre for Health Economics, University of York, UK April 2018

Background to series
CHE Discussion Papers (DPs) began publication in 1983 as a means of making current research material more widely available to health economists and other potential users. So as to speed up the dissemination process, papers were originally published by CHE and distributed by post to a worldwide readership. The CHE Research Paper series takes over that function and provides access to current research output via web-based publication, although hard copy will continue to be available (but subject to charge). Acknowledgements
We would like to thank Prof Andrew Street for his insightful inputs in this research and very useful comments on earlier drafts of this report, Katja Grašič for her invaluable assistance with data management, John Bates and Caroline Lee from the Department of Health and Social Care, and James Lewis from the Office for National Statistics. The report is based on independent research commissioned and funded by the NIHR Policy Research Programme (070/0081 Productivity; 103/0001 ESHCRU). The views expressed in the publication are those of the authors and not necessarily those of the NHS, the NIHR, the Department of Health and Social Care, arm’s length bodies or other government departments. The Hospital Episode Statistics are copyright © 2004/05 – 2015/16, to the Health and Social Care Information Centre. Re-used with the permission of the Health and Social Care Information Centre. All rights reserved. No ethical approval was needed as we used secondary data. Further copies
Only the latest electronic copy of our reports should be cited. Copies of this paper are freely available to download from the CHE website www.york.ac.uk/che/publications/. Access to downloaded material is provided on the understanding that it is intended for personal use. Copies of downloaded papers may be distributed to third parties subject to the proviso that the CHE publication source is properly acknowledged and that such distribution is not subject to any payment. Printed copies are available on request at a charge of £5.00 per copy. Please contact the CHE Publications Office, email [email protected], telephone 01904 321405 for further details. Centre for Health Economics Alcuin College University of York York, YO10 5DD, UK www.york.ac.uk/che ©Adriana Castelli, Martin Chalkley, Idaira Rodriguez Santana

Productivity of the English National Health Service 2015/16 update i
Executive summary
This report updates the Centre for Health Economics’ time series of National Health Service (NHS) productivity growth for the period 2014/15 to 2015/16. It also reports trends in output, input and productivity since 2004/05. NHS productivity growth is measured by comparing growth in the outputs produced by the NHS to growth in the inputs used to produce them. NHS outputs include all the activities undertaken for NHS patients wherever they are treated in England and accounts for changes in the quality of care provided to those patients. NHS inputs include the number of doctors, nurses and support staff providing care, the equipment and clinical supplies used, and the facilities of hospitals and other premises where care is provided. NHS outputs have increased substantially between 2004/05 and 2015/16, primarily because more patients are receiving treatment. In 2015/16, hospitals treated 4.9 million more patients than in 2004/05 – an increase of 39%. The number of outpatient attendances has also increased by just under 76% since 2004/05, with almost 38 million more contacts in 2015/16 compared to 2004/05.1 There have been year-on-year improvements in hospital survival rates, whilst waiting times have been getting longer since 2009/10 (although they remain shorter than they were in 2004/05), taking account of these changes in the quality of care, overall quality-adjusted NHS output increased by just over 55% between 2004/05 and 2015/16, and by 2.62% between 2014/15 and 2015/16. Increases in NHS outputs have been accompanied by increases in inputs. The number of NHS staff increased by 6.5% between 2004/05 and 2015/16, and expenditure on those staff increased by 48%. Some categories of expenditure have increased more rapidly. For example, between 2004/05 and 2015/16, NHS expenditure on Agency staff has increased by 138%, but this increase has varied considerably over the 11 year period, with periods of increased use of Agency staff followed by periods of restraint. Expenditure on materials and capital increased by 198% and 156% respectively between 2004/05 and 2015/16. Overall expenditure on NHS inputs has increased by 73% since 2004/05, and by 2.59% between 2014/15 and 2015/16. Over the last eleven years NHS productivity has increased by 13.49%. Productivity growth has been positive since 2009/10, with year-on-year growth averaging 1.17%. We find that productivity amounted to 0.04% between 2014/15 and 2015/16. Comparing the growth in productivity for the NHS to a measure of productivity for the whole economy (the Gross Value Added per hour worked), NHS productivity kept pace with the economy up to the recession in 2008/09, then between 2008/09 and 2013/14, NHS productivity growth has outpaced that of the economy, but from 2014/15 onwards that has reversed; substantially so in the most recent year.
1 Outpatient activity data in 2004/05 are not directly comparable to Outpatient activity data in 2015/16. The classification system for Outpatient activity, as captured in the Reference Costs database, underwent a complete overhaul in 2006/07 as documented in Castelli et al. (2008).
ii CHE Research Paper 152
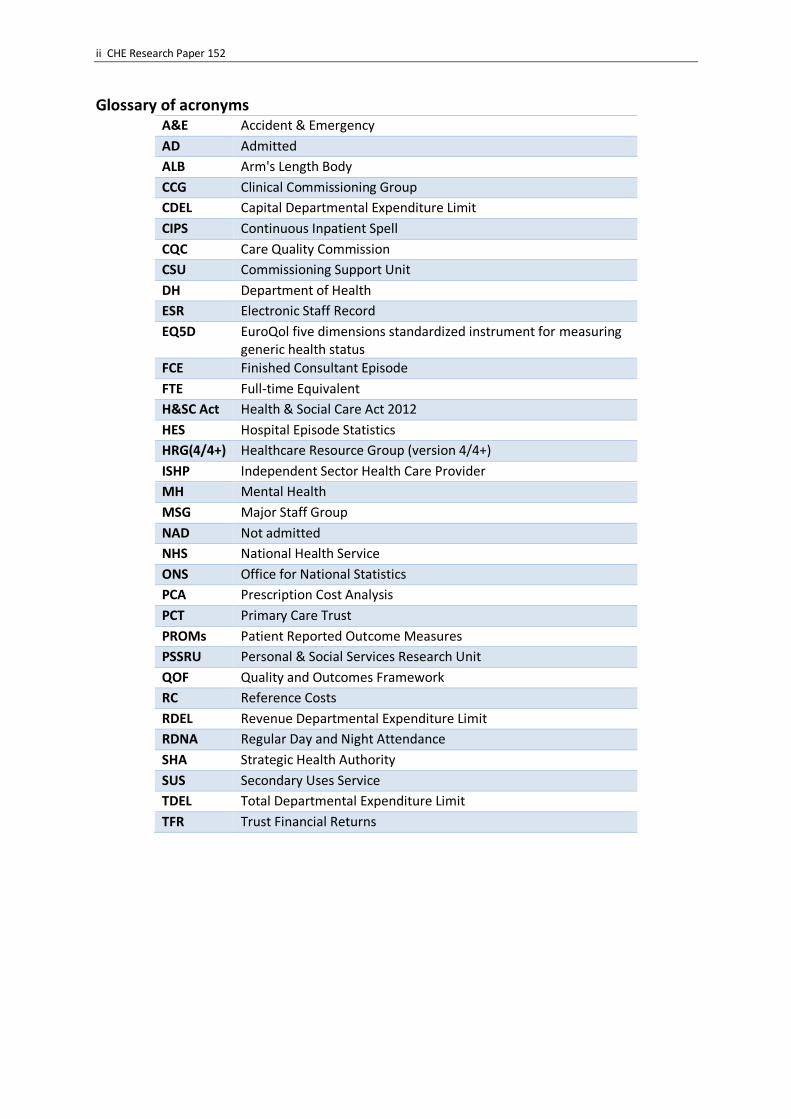
Glossary of acronyms A&E Accident & Emergency
AD Admitted
ALB Arm's Length Body
CCG Clinical Commissioning Group
CDEL Capital Departmental Expenditure Limit
CIPS Continuous Inpatient Spell
CQC Care Quality Commission
CSU Commissioning Support Unit
DH Department of Health
ESR Electronic Staff Record
EQ5D EuroQol five dimensions standardized instrument for measuring generic health status
FCE Finished Consultant Episode
FTE Full-time Equivalent
H&SC Act Health & Social Care Act 2012
HES Hospital Episode Statistics
HRG(4/4+) Healthcare Resource Group (version 4/4+)
ISHP Independent Sector Health Care Provider
MH Mental Health
MSG Major Staff Group
NAD Not admitted
NHS National Health Service
ONS Office for National Statistics
PCA Prescription Cost Analysis
PCT Primary Care Trust
PROMs Patient Reported Outcome Measures
PSSRU Personal & Social Services Research Unit
QOF Quality and Outcomes Framework
RC Reference Costs
RDEL Revenue Departmental Expenditure Limit
RDNA Regular Day and Night Attendance
SHA Strategic Health Authority
SUS Secondary Uses Service
TDEL Total Departmental Expenditure Limit
TFR Trust Financial Returns

Productivity of the English National Health Service 2015/16 update iii
Contents 1 Introduction .............................................................................................................................. 1
2 Output ....................................................................................................................................... 2
Measuring output .............................................................................................................. 2
HES inpatient, day case, mental health and outpatient data ............................................... 3
2.2.1 Elective, day case and non-elective activity ................................................................. 3
2.2.2 Elective, day case and non-elective activity: quality adjustment ................................. 4
2.2.4 Inpatient mental health: quality adjustment ............................................................... 8
2.2.5 HES outpatient activity ............................................................................................... 9
2.2.6 HES outpatient activity: quality adjustment ................................................................ 9
Reference cost data ......................................................................................................... 10
2.3.1 General RC data validation checks ............................................................................ 11
2.3.2 RC outpatient activity ............................................................................................... 19
2.3.3 A&E and ambulance services .................................................................................... 20
2.3.4 Chemotherapy, Radiotherapy & High Cost Drugs ...................................................... 22
2.3.5 Community care ....................................................................................................... 23
2.3.6 Diagnostic tests, pathology and radiology ................................................................. 24
2.3.7 Community mental health ........................................................................................ 24
2.3.8 Rehabilitation and renal dialysis ............................................................................... 27
2.3.9 Specialist services ..................................................................................................... 28
2.3.10 Other Reference Cost activities ................................................................................. 28
2.3.11 Total Reference Cost growth .................................................................................... 29
Dentistry and ophthalmology ........................................................................................... 29
Primary care activity......................................................................................................... 32
Community prescribing .................................................................................................... 36
Output growth ................................................................................................................. 39
2.7.1 Contribution by settings ........................................................................................... 40
3 Inputs ...................................................................................................................................... 42
Direct labour .................................................................................................................... 42
Expenditure data .............................................................................................................. 45
3.2.1 Input use derived from expenditure data.................................................................. 47
Input growth .................................................................................................................... 50
4 Productivity growth ................................................................................................................. 51
5 Conclusions ............................................................................................................................. 54

iv CHE Research Paper 152
6 References ............................................................................................................................... 55
Appendix A ...................................................................................................................................... 57
Technical details............................................................................................................... 57
Appendix B ...................................................................................................................................... 59
Independent sector providers (non-NHS bodies): output, input and sensitivity analysis,
2014/15 – 2015/16 .......................................................................................................................... 59
Appendix C ...................................................................................................................................... 62
Summary Statistics of Reference Costs data by broad service setting ............................... 62
Appendix D ...................................................................................................................................... 63
Growth in primary care output 2004/05 – 2015/16: an historic series .............................. 63
Appendix E ...................................................................................................................................... 70
Deflators .......................................................................................................................... 70
Appendix F ...................................................................................................................................... 71
Trusts only productivity measures .................................................................................... 71

Productivity of the English NHS: 2015/16 update 1
1. Introduction
This report updates the Centre for Health Economics’ time series of National Health Service (NHS) productivity growth, to account for growth between 2014/15 and 2015/16, as well as looking at the 11 year trends starting from 2004/05.2 We follow national accounting conventions to measure the change in productivity over time by means of a chained index (Eurostat, 2001). We concentrate on the calculation and comparison of output and inputs between 2014/15 and 2015/16. This latest ‘link’ is then attached to the chained index that reports productivity changes over the last decade. Technical details about methodology can be found in Appendix A. In calculating output growth, we construct a Laspeyres index aggregating different types of NHS output, using as weights the previous year’s cost for each specific output. We capture changes in quality by taking account of changes in survival following hospital treatment, waiting times, and improvements in blood pressure monitoring in primary care. Improvements in these dimensions contribute to output growth. Growth in the volume of inputs is calculated primarily using expenditure data. Current spending on labour, capital and material resources are deflated to the previous year’s costs in order to generate a measure of changing input use in the paired years. For labour we also use information about the volume and costs of staff recorded in the NHS Electronic Staff Record (ESR). This permits two alternative measures of input growth – one constructed entirely from accounts data (the indirect measure) and one which uses expenditure data for capital and materials and ESR data for labour (the mixed measure of input growth). This allows us to assess how sensitive productivity growth is to how labour input is measured. The focus of the report is on the data used to calculate output and input growth between 2014/15 and 2015/16. Specific details are provided about any potential data collection and coding artefacts that may compromise a genuine like-for-like comparison across the two years. The structure of the report is as follows. The output index is described in Section 2, and the elements of the input index are reported in Section 3. Section 4 reports the productivity growth figures. Summary and concluding remarks are provided in Section 5.
2 For the full productivity series from 1998/99 to 2013/14 see Bojke et al. (2016b).

2 CHE Research Paper 152
2. Output
Measuring output
Our NHS output index is designed to capture all activities provided to NHS patients, whether by NHS or private sector organisations.3 Table 1 below summarises data sources used to measure activity, quality and costs, and also indicates specific measurement issues that have had to be tackled in constructing the output growth index for 2014/15 – 2015/16. The data and these specific issues are detailed in the remainder of this section. It should be noted that we have two alternative sources of volume of activity for outpatient output: the Hospital Episode Statistics (HES) outpatient dataset, and the Reference Costs database. We compare the outpatient activity in these datasets. Table 1: Summary of output data sources
Output type Activity source Cost source Quality Notes for 2014/15 and
2015/16 data
Elective HES RC 30-day/in- hospital survival; health outcomes; waiting times
Activity described by HRG4+ In-hospital survival is used for years 2014/15 and 2015/16
Non-elective HES RC 30-day /in-hospital survival; health outcomes
Activity described by HRG4+ In-hospital survival is used for years 2014/15 and 2015/16
Outpatient HES (or RC) RC Waiting times Waiting times come from HES Two sources of activity data
Mental health HES & RC RC 30-day/in-hospital survival; health outcomes; waiting times
Activity described by HRG4+ In-hospital survival is used for years 2014/15 and 2015/16
Community care
RC RC N/A
A&E RC RC N/A
Other (1) RC RC N/A
Primary care QResearch (up to 2008/09) General Lifestyle Survey (2008/09-09/10) GP patient survey (from 2009/10)
PSSRU Unit Costs of Health and Social Care
QOF data Uplift survey responses by population growth; changes in QOF data
Prescribing Prescription cost analysis system
Prescription cost analysis system
N/A
Ophthalmic and dental services
NHS Digital NHS Digital N/A
Note: (1) Radiotherapy & High Cost Drugs, Diagnostic Tests, Hospital/patient Transport Scheme, Radiology, Rehabilitation, Renal Dialysis, Specialist Services
3 NHS activity provided by non-NHS providers was included in the output growth series up to 2010/11.

Productivity of the English NHS: 2015/16 update 3
HES inpatient, day case, mental health and outpatient data
HES is the source of data for both the amount of activity and for the measures of quality for elective and non-elective activity, including mental health care, delivered in hospitals.4 HES comprises of almost 20.2m records in 2014/15 and 20.6m in 2015/16. We convert HES records, defined as Finished Consultant Episodes (FCEs), into Continuous Inpatient Spells (CIPS) using the official algorithm for calculating CIPS published by NHS Digital (formerly the Health and Social Care Information Centre).5 We then count the number of CIPS in each Healthcare Resource Group (HRG), which form the basic means of describing different types of hospital output. The cost of each CIPS is calculated on the basis of the most expensive FCE within the CIPS, with costs for each HRG derived from the Reference Cost data (Bojke et al., 2013). Our previous research suggested that results are not sensitive to the alternatives of calculating the costs of CIPS on the basis of the first episode or the sum of all episodes (Daidone and Street, 2011). Reference Costs are reported for each HRG according to their point of delivery, indicating whether the patient was treated as a non-elective inpatient, elective inpatient or elective day case (Department of Health, 2015). The non-elective Reference Costs are used to determine the cost of patients treated on a non-elective basis, while we use the elective inpatient Reference Costs to determine the cost of all elective patients, including those treated on a day case basis (Bojke et al., 2016a). This ensures that elective inpatient and day case activity is assigned the same cost weight and, hence, is assumed to be of equivalent value, despite the latter being of lower cost. This equal weighting ensures that the output index is not biased downwards if delivery of treatment moves to lower cost forms or settings over time. Having assigned a cost to each CIPS, we then calculate the national average cost per CIPS in each HRG. Changes to the HRG system pose some difficulties in constructing the output index because costs might not be available for some activities. In such cases we deflate current costs in order to impute prior values (Castelli et al., 2011). However, this is not an issue for this report because no changes in the HRG groupings have occurred between the years 2014/15 and 2015/16. The vast majority of activity captured in HES is performed by hospital Trusts. As shown in Table 2, 97.3% of all activity was performed in Trusts in 2014/15 and 97.3% in 2015/16. The proportion of activity performed by private providers is gradually increasing: in 2012/13 they provided 2.1% of all activity, increasing to 2.6% in 2014/15 and to 2.7% in 2015/16. Table 2: Organisational coverage of HES activity, FCEs
Year NHS Trusts Private providers Other6 Total
2012/13 18,649,728 406,078 13,754 19,069,560
2013/14 19,061,786 470,454 1,873 19,534,113 2014/15 19,639,539 537,998 3,501 20,181,038
2015/16 20,049,753 557,574 1,204 20,608,531
2.2.1 Elective, day case and non-elective activity
As can be seen from Table 3, elective and day case activity has increased by 53.3% over the 11 years covered in this report, from 6.4m to 9.9m CIPS, while non-elective activity has increased by 23.9%, from 6m to 7.4m CIPS. While elective activity has grown steadily, growth in non-elective activity shows a more erratic pattern, as can be also observed in Figure 1.
4 As in previous years, we exclude patients categorised to HRGs which are not included in the tariff (“Zero Cost HRGs”). 5 http://www.hesonline.nhs.uk/Ease/servlet/ContentServer?siteID=1937&categoryID=1072. 6 Primary Care Trusts (2012/13 only) and organisations with the org code starting with 8 or A.
4 CHE Research Paper 152
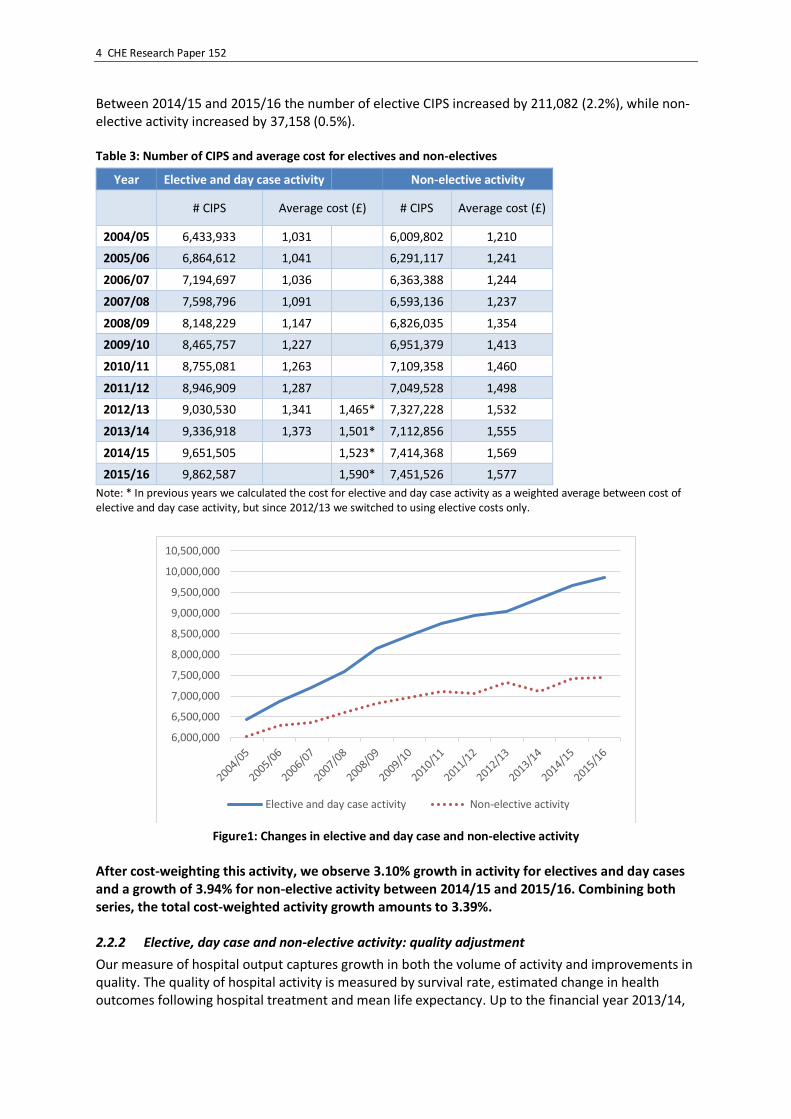
Between 2014/15 and 2015/16 the number of elective CIPS increased by 211,082 (2.2%), while non-elective activity increased by 37,158 (0.5%). Table 3: Number of CIPS and average cost for electives and non-electives
Year Elective and day case activity Non-elective activity
# CIPS Average cost (£) # CIPS Average cost (£)
2004/05 6,433,933 1,031 6,009,802 1,210
2005/06 6,864,612 1,041 6,291,117 1,241
2006/07 7,194,697 1,036 6,363,388 1,244
2007/08 7,598,796 1,091 6,593,136 1,237
2008/09 8,148,229 1,147 6,826,035 1,354
2009/10 8,465,757 1,227 6,951,379 1,413
2010/11 8,755,081 1,263 7,109,358 1,460
2011/12 8,946,909 1,287 7,049,528 1,498
2012/13 9,030,530 1,341 1,465* 7,327,228 1,532
2013/14 9,336,918 1,373 1,501* 7,112,856 1,555
2014/15 9,651,505 1,523* 7,414,368 1,569
2015/16 9,862,587 1,590* 7,451,526 1,577
Note: * In previous years we calculated the cost for elective and day case activity as a weighted average between cost of elective and day case activity, but since 2012/13 we switched to using elective costs only.
Figure1: Changes in elective and day case and non-elective activity
After cost-weighting this activity, we observe 3.10% growth in activity for electives and day cases and a growth of 3.94% for non-elective activity between 2014/15 and 2015/16. Combining both series, the total cost-weighted activity growth amounts to 3.39%. 2.2.2 Elective, day case and non-elective activity: quality adjustment
Our measure of hospital output captures growth in both the volume of activity and improvements in quality. The quality of hospital activity is measured by survival rate, estimated change in health outcomes following hospital treatment and mean life expectancy. Up to the financial year 2013/14,
6,000,000
6,500,000
7,000,000
7,500,000
8,000,000
8,500,000
9,000,000
9,500,000
10,000,000
10,500,000
Elective and day case activity Non-elective activity

Productivity of the English NHS: 2015/16 update 5
we used 30-day post discharge survival rate, but we have since switched to the in-hospital survival measure because ONS date of death data are not released to us in a sufficiently timely fashion.7 This part of the quality adjustment is designed to capture changes in the expected discounted sum of lifetime Quality Adjusted Life Years (QALYs) conditional on patients surviving treatment. Our quality adjustment also accounts for changes in inpatient waiting times. Longer waiting times are considered to have adverse health consequences and formulated as a scaling factor multiplying the health effect (Castelli et al., 2007). This adjustment applies only to elective and day case activity, and is measured by 80th percentile waiting times. Information on in-hospital survival rate and waiting times is obtained directly from HES; 30-day survival post-discharge was calculated from the mortality dataset provided by ONS; mean life expectancy is taken from life tables published annually by ONS.8 Table 4 and Figures 2 and 3 present average values for each of these measures over time. Table 4: Quality adjustment for elective and day case and for non-elective activity
Year Elective and day case activity Non-elective activity
30-day survival
rate
In-hospital survival rate
Mean life expectancy
80th percentile
waiting times
30-day survival
rate
In-hospital survival
rate
Mean life expectancy
2004/05 99.38% 23.7 104 95.16% 34.1
2005/06 99.47% 23.7 95 95.49% 34.3
2006/07 99.51% 23.6 89 95.65% 34.6
2007/08 99.72% 23.5 74 95.79% 34.7
2008/09 99.74% 23.2 60 95.85% 34.4
2009/10 99.76% 23.4 65 96.07% 34.6
2010/11 99.78% 23.4 76 96.05% 34.8
2011/12 99.45% 23.2 85 96.62% 34.6
2012/13 99.50% 98.76% 23.2 82a 96.45% 97.77% 34.1
2013/14a 99.44% 99.93% 23.2 81 96.32% 97.27% 34
2014/15 - 99.93% 22.9 79 - 97.18% 33.4
2015/16 - 99.93% 22.9 80 - 97.29% 33.5 a Previously reported figures showed the average across HRGs; from 2012/13 the figures show average across patients.
For the majority of hospital treatments, patients are not asked about their health status before or after treatment. However, since April 2009, all providers of NHS-funded care have been required to collect Patient Reported Outcome Measures (PROMs) for all patients undergoing unilateral hip and knee replacement, varicose vein surgery and groin hernia repair. The PROMs survey includes the EQ-5D questionnaire, which allows responses to be scaled from perfect health (=1) to death (=0). Patients report their health status before and either three or six months after surgery. Table 5 reports the ratio of these before and after responses for patients responding to both questionnaires for each condition since the questionnaire was first introduced. We use changes in the ratios to assess the impact that these four treatments have on patients’ health status over time.
5For the years 2012/13 and 2013/14 we report both the 30-days post discharge and in-hospital survival data. See Bojke et al (2017) for a sensitivity analysis using both measures 6 http://www.ons.gov.uk/ons/rel/lifetables/national-life-tables/index.html

6 CHE Research Paper 152
Table 5: Ratio of pre to post health status, based on EQ-5D
Year Groin hernia repair
Hip replacement
Knee replacement
Varicose vein
removal
2009/10 0.82 0.32 0.37 0.84
2010/11 0.8 0.36 0.41 0.82
2011/12 0.8 0.4 0.4 0.71
2012/13 0.76 0.36 0.37 0.8
2013/14 0.84 0.37 0.39 0.8
2014/15 0.82 0.37 0.44 0.85
2015/16 0.79 0.36 0.4 0.77
For treatments where no such information is available, we assume that the ratio is 0.8 for elective care and 0.4 for non-elective care. There is little variation in mean life expectancy for those treated in hospital over the entire period, as shown in Figure 2. A slight negative trend can be observed in recent years: this is mostly likely due to increases in the average age of people admitted to hospital, rather than lower quality of care, given that hospital mortality rates have not declined. Nonetheless, between 2014/15 and 2015/16 the mean life expectancy remained unaltered for electives and showed a slightly improvement for non-elective patients. This, however, masks occasional large variations in life expectancy at HRG level.
Figure 2: Mean life expectancy
In 2015/16 waiting times increased slightly compared to 2014/15, as shown in Figure 3. In the last four years waiting times are stable, but remain much higher than they were in 2008/09, when they were at an historic low.
20
22
24
26
28
30
32
34
36
Elective and day case activity Non-elective activity

Productivity of the English NHS: 2015/16 update 7
Figure 3: 80th percentile waiting times
We calculate the quality adjustment for each specific HRG, and separately for electives and non-electives. Once we take quality adjustment into account, the total Laspeyres output growth of elective, day case and non-elective activity is 5.08%. We find that the large improvement in the quality adjusted output growth rate for hospital activity is driven by improvements in in-hospital survival rates and life expectancy for non-elective activity. If considering elective and day cases separately from non-electives activity, we find that the quality-adjusted growth rates between 2014/15 and 2015/16 are 3.64% and 7.18% respectively. 2.2.3 Inpatient mental health: quality adjustment We identify mental health patients as those for whom the HRG falls into the subchapter “WD” (Treatment of Mental Health Patients by Non-Mental Health Service Providers). As seen in Table 6 and Figure 4, there has been year-on-year variation over the last decade in the number of patients with mental health problems treated in an elective/day case setting and a non-elective setting, but numbers have decreased over the last three years. Table 6: CIPS and average cost for inpatient mental health patients
Year Elective and day case activity Non-elective activity
# CIPS Average cost (£) # CIPS Average cost (£)
2004/05 45,624 689 123,983 1,012
2005/06 41,439 673 120,203 1,012
2006/07 38,408 656 115,560 1,012
2007/08 33,993 1,141 112,475 1,364
2008/09 25,792 1,133 109,636 1,319
2009/10 28,143 1,195 121,610 1,365
2010/11 30,714 1,297 125,823 1,445
2011/12 31,142 1,318 135,315 1,318
2012/13 31,078 1,358 145,787 1,358
2013/14 25,438 1,368 136,916 1,385
2014/15 24,757 1,384 131,029 1,401
015/16 20,478 1,396 126,899 1,417
0
20
40
60
80
100
120
80th percentile waiting times

8 CHE Research Paper 152
Figure 4: Number of CIPS for elective, day case and non-elective mental health patients over time
After cost-weighting mental health activity, we observe a decline of -5.38% between 2014/15 and 2015/16. We conjecture that the negative growth observed in the last four years relates to the fact that we only account for mental health activity performed in non-mental health hospitals.
2.2.4 Inpatient mental health: quality adjustment
As with other inpatient activity, we also account for changes in the quality of inpatient mental health care. We use the same quality adjusters as for other forms of inpatient activity, namely 30-day/in-hospital survival rates, mean life expectancy and 80th percentile waiting times; these measures are reported in Table 7. Table 7: Quality adjustments for mental health activity
Year Elective and day case activity Non-elective activity
30-day survival
rate
In-hospital survival
rate
Mean life expectancy
80th percentile
waiting times
30-day survival
rate
In-hospital survival
rate
Mean life expectancy
2004/05 97.72% 30.1 40 96.96% 28.7
2005/06 98.01% 30.0 265 97.22% 28.9
2006/07 98.15% 30.6 257 97.38% 29
2007/08 98.64% 29.9 28 97.65% 27.7
2008/09 98.71% 29.0 42 97.56% 27.3
2009/10 98.61% 29.4 28 97.68% 27.7
2010/11 98.85% 30.2 37 97.63% 27.8
2011/12 98.83% 31.1 37 97.78% 27.3
2012/13 98.41% 99.91% 29.6 52a 97.61% 97.29% 26.9
2013/14a 98.72% 98.95% 30.6 54 97.52% 97.87% 27.4
2014/15b - 99.25% 31.3 51 - 98.66% 27.1
2015/16 - 99.38% 31.6 54 - 98.63% 26.9 a Previously reported figures showed the average across HRGs; from 2012/13 the figures show average across patients.
b _ Previously, the in-hospital survival rates for elective and non-elective patients were estimated to be 99.1% and 98.25%
respectively (Bojke et al., 2017).
0
20,000
40,000
60,000
80,000
100,000
120,000
140,000
160,000
Elective and day case activity Non-elective activity

Productivity of the English NHS: 2015/16 update 9
In the same way as for other HES inpatient activity, we also calculate quality adjustment based on the performance in a specific HRG (separated for electives and non-electives). Some of these quality measures have improved (mortality), others deteriorated (waiting time) but the overall effect of the quality adjustment is positive. Hence, once we take quality adjustment into account, output growth from 2014/15 to 2015/16 increases from -5.38% to -5.23% for patients admitted to hospital for a mental health condition. 2.2.5 HES outpatient activity
The volume of outpatient activity can be derived from both the HES Outpatients Dataset and RC data, but we always use RC to determine costs. A like-for-like comparison between the two datasets is not wholly possible because the activity data are recorded somewhat differently in each. Specifically, the HES Outpatient dataset does not allow classification of activity into consultant-led and non-consultant-led activity, which is the common split for non-procedural activity in RC. For a successful match, one would need consultant codes in HES, which are considered sensitive and were not available to us. The HES outpatient activity classification is a combination of treatment speciality and SUS HRG code. Further differences between HES and RC recorded activity is that HES covers activity conducted by organisation types other than Trusts and HES contains data on appointments which were attended and those which were not. For the purpose of this analysis we include only appointments attended, with these representing approximately 80% of recorded data. Of non-attended appointments, there are roughly equal proportions of cancelations by patients, cancelations by providers, and patients who failed to attend without prior warning. In order to match consultant-led and non-consultant-led activity definitions from Reference Costs to those in HES, weighted averages are taken to produce averages specific only to currency codes (e.g. WF01A) and service codes. These averages are matched to HES activity. An initial round of matching was based on a complete match of Reference Cost service code and currency code combination with HES treatment speciality and SUS HRG code. This led to over 90% of records being matched to an associated RC code, the remaining unmatched 10% of records is assigned an overall average cost. Table 8: Volume and average cost over time
Year All providers (excl. ISHP and
‘Other providers’)
Volume Average cost
(£)
2011/12 88,926,968 114
2012/13 90,850,009 116.98
2013/14 96,690,559 117.18
2014/15 101,382,540 118.26
2015/16 107,092,657 118.37
Table 8 shows the volume of and average cost of attended outpatient activity. After cost weighting the activity, the Laspeyres growth in outpatient activity amounts to 3.73%. 2.2.6 HES outpatient activity: quality adjustment
We allow for changes in the quality of outpatient activity by taking account of changes in waiting times, as summarised in Table 9 and Figure 5. The 80th percentile waiting time has increased over the

10 CHE Research Paper 152
years and reached a maximum of 63 days in 2015/16. Accounting for this has virtually no impact on the growth index which drops slightly to 3.72%. Table 9: Outpatient mean and 80th percentile waiting times (days)
Year DH HES HES
Mean 80th
Percentile
2004/05 52
2005/06 46
2006/07 41
2007/08 24 37
2008/09 22 34
2009/10 24 36
2010/11 37
2011/12 37
2012/13 38 55
2013/14 40 57
2014/15 42 61
2015/16 44 63
Figure 5: Trends in outpatient waiting times
Reference Cost data
Reference Cost (RC) returns are used to capture activity performed in most health care settings other than hospitals, outpatient departments and primary care. In particular, RC data cover activity conducted in accident and emergency (A&E) departments, mental health and community care settings, and diagnostic facilities. Activities are reported in various ways: attendances, bed days, contacts and number of tests.
0
10
20
30
40
50
60
Mean waiting time: DH
Mean waiting time: HES Outpatient Minimum Dataset

Productivity of the English NHS: 2015/16 update 11
In 2012/13 and 2013/14, the RC returns only covered activity undertaken by hospital Trusts, but since 2014/15 RC returns were also submitted for contracted-out activity, that is, activity delivered by independent sector (non-NHS) providers. Activity provided by non-NHS providers is not included in the overall NHS output growth measure. However, we have conducted a sensitivity analysis of both outputs and inputs provided by non-NHS providers, the results of which are presented in Appendix B. RC returns also provide information on unit costs for all recorded activities (and about the costs of activity performed in hospitals and outpatient departments, as previously mentioned). Reference Costs data are checked for both the accuracy of the reported data and the activity coverage. 2.3.1 General RC data validation checks
Since 2011/12, the Department of Health has required mandatory and non-mandatory validations of the Reference Cost data reported by NHS Trusts (Department of Health, 2012). These have reduced the year-on-year volatility in the information contained in the RC returns. NHS Improvement, which has been commissioned to collect and report Reference Cost data since 2014/15, performs the following checks of the quality of Reference Cost returns:
Mandatory validations included checks that all data (both activity and cost) are reported, unit costs are reported as positive integers to two decimal places, no fields are missing, etc.
Non-mandatory validations include checking whether unit costs below £5 or over £50,000 are accurate and whether single professional outpatient attendance unit costs were less than multi-professional unit costs.
Finally, checks on ‘year-on-year changes’ are carried out. In particular, any change in total cost or activity greater than 25% is flagged and double-checked. The check is carried out by department code and HRG sub-chapter for acute services, or service code for non-acute services (only for outpatient attendances, outpatient procedures and emergency medicine).
Over and above these checks, we have implemented our own validation process (Bojke et al., 2014). This focuses on identifying large increases/decreases in either volume or unit costs of activity for all non-acute services. For 2015/16, we have revised our quality and assurance process, which now consists of four steps. Firstly, we check whether any NHS activity/HRG codes reported by NHS providers has been affected by a large change in either the total volume (>500,000 units) or the total value (>£25,000,000) of the activity reported in the Reference Cost returns. The check compares volumes of activity, unit costs and total costs of the last two financial years in the national productivity series (step 1). Secondly, we assess whether all identified cases are genuine large changes or possible errors. This step might lead to the identification of a sub-set of HRG / service codes requiring further investigation (step 2). Thirdly, limited to the HRG/service codes that have been identified as requiring further investigation, we further check whether any of the HRG codes were affected by changes in their labelling/definition/categorisation. This step involves cross-checking the set of HRGs with potential quality issues against the HRG codes listed in the HRG4+ Reference Costs Grouper Roots file (content.digital.nhs.uk/casemix/costing) (step 3). Finally, if this is not the case, then we analyse the
12 CHE Research Paper 152
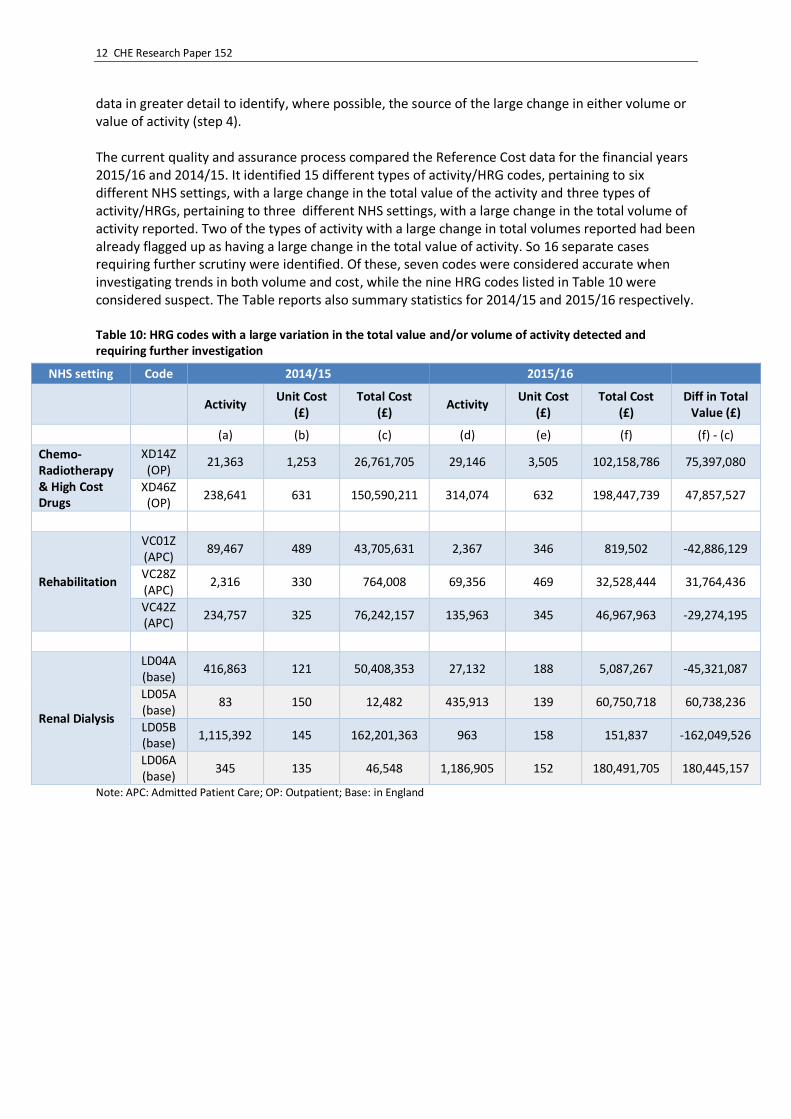
data in greater detail to identify, where possible, the source of the large change in either volume or value of activity (step 4). The current quality and assurance process compared the Reference Cost data for the financial years 2015/16 and 2014/15. It identified 15 different types of activity/HRG codes, pertaining to six different NHS settings, with a large change in the total value of the activity and three types of activity/HRGs, pertaining to three different NHS settings, with a large change in the total volume of activity reported. Two of the types of activity with a large change in total volumes reported had been already flagged up as having a large change in the total value of activity. So 16 separate cases requiring further scrutiny were identified. Of these, seven codes were considered accurate when investigating trends in both volume and cost, while the nine HRG codes listed in Table 10 were considered suspect. The Table reports also summary statistics for 2014/15 and 2015/16 respectively. Table 10: HRG codes with a large variation in the total value and/or volume of activity detected and requiring further investigation
NHS setting Code 2014/15 2015/16
Activity Unit Cost
(£) Total Cost
(£) Activity
Unit Cost (£)
Total Cost (£)
Diff in Total Value (£)
(a) (b) (c) (d) (e) (f) (f) - (c)
Chemo-Radiotherapy & High Cost Drugs
XD14Z (OP)
21,363 1,253 26,761,705 29,146 3,505 102,158,786 75,397,080
XD46Z (OP)
238,641 631 150,590,211 314,074 632 198,447,739 47,857,527
Rehabilitation
VC01Z (APC)
89,467 489 43,705,631 2,367 346 819,502 -42,886,129
VC28Z (APC)
2,316 330 764,008 69,356 469 32,528,444 31,764,436
VC42Z (APC)
234,757 325 76,242,157 135,963 345 46,967,963 -29,274,195
Renal Dialysis
LD04A (base)
416,863 121 50,408,353 27,132 188 5,087,267 -45,321,087
LD05A (base)
83 150 12,482 435,913 139 60,750,718 60,738,236
LD05B (base)
1,115,392 145 162,201,363 963 158 151,837 -162,049,526
LD06A (base)
345 135 46,548 1,186,905 152 180,491,705 180,445,157
Note: APC: Admitted Patient Care; OP: Outpatient; Base: in England
Productivity of the English NHS: 2015/16 update 13
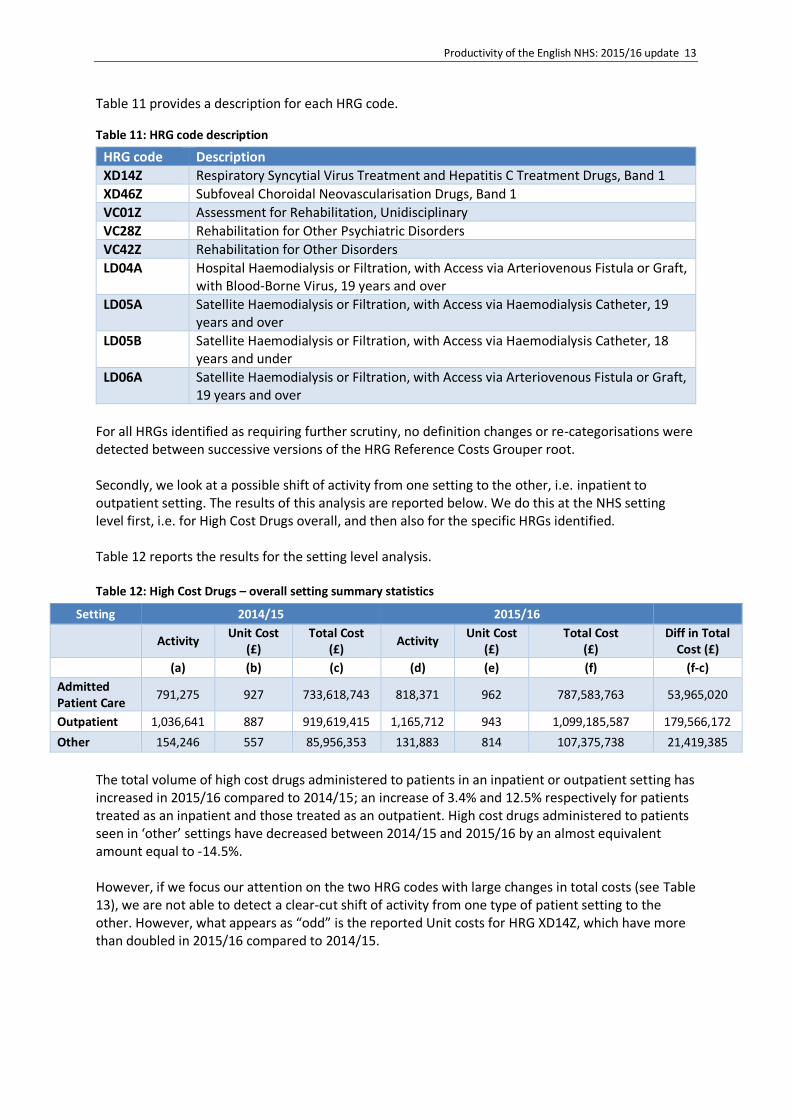
Table 11 provides a description for each HRG code.
Table 11: HRG code description
HRG code Description
XD14Z Respiratory Syncytial Virus Treatment and Hepatitis C Treatment Drugs, Band 1
XD46Z Subfoveal Choroidal Neovascularisation Drugs, Band 1
VC01Z Assessment for Rehabilitation, Unidisciplinary
VC28Z Rehabilitation for Other Psychiatric Disorders
VC42Z Rehabilitation for Other Disorders
LD04A Hospital Haemodialysis or Filtration, with Access via Arteriovenous Fistula or Graft, with Blood-Borne Virus, 19 years and over
LD05A Satellite Haemodialysis or Filtration, with Access via Haemodialysis Catheter, 19 years and over
LD05B Satellite Haemodialysis or Filtration, with Access via Haemodialysis Catheter, 18 years and under
LD06A Satellite Haemodialysis or Filtration, with Access via Arteriovenous Fistula or Graft, 19 years and over
For all HRGs identified as requiring further scrutiny, no definition changes or re-categorisations were detected between successive versions of the HRG Reference Costs Grouper root. Secondly, we look at a possible shift of activity from one setting to the other, i.e. inpatient to outpatient setting. The results of this analysis are reported below. We do this at the NHS setting level first, i.e. for High Cost Drugs overall, and then also for the specific HRGs identified. Table 12 reports the results for the setting level analysis. Table 12: High Cost Drugs – overall setting summary statistics
Setting 2014/15 2015/16
Activity Unit Cost
(£) Total Cost
(£) Activity
Unit Cost (£)
Total Cost (£)
Diff in Total Cost (£)
(a) (b) (c) (d) (e) (f) (f-c)
Admitted Patient Care
791,275 927 733,618,743 818,371 962 787,583,763 53,965,020
Outpatient 1,036,641 887 919,619,415 1,165,712 943 1,099,185,587 179,566,172
Other 154,246 557 85,956,353 131,883 814 107,375,738 21,419,385
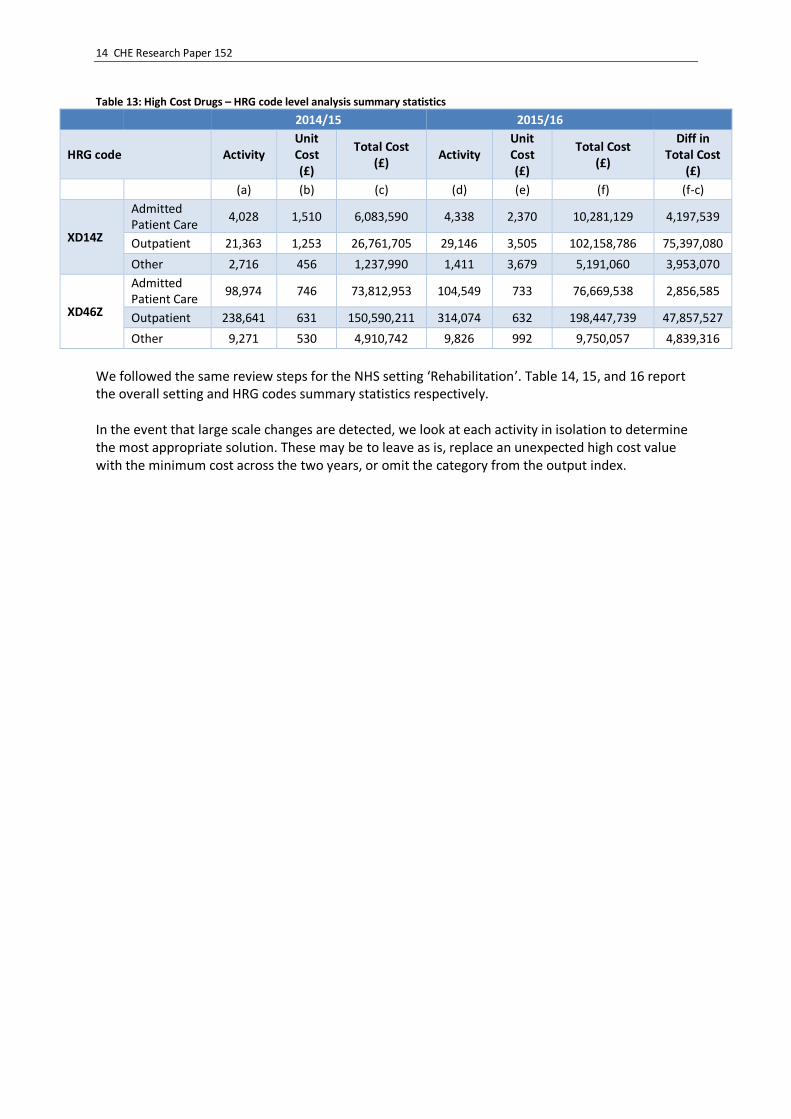
The total volume of high cost drugs administered to patients in an inpatient or outpatient setting has increased in 2015/16 compared to 2014/15; an increase of 3.4% and 12.5% respectively for patients treated as an inpatient and those treated as an outpatient. High cost drugs administered to patients seen in ‘other’ settings have decreased between 2014/15 and 2015/16 by an almost equivalent amount equal to -14.5%. However, if we focus our attention on the two HRG codes with large changes in total costs (see Table 13), we are not able to detect a clear-cut shift of activity from one type of patient setting to the other. However, what appears as “odd” is the reported Unit costs for HRG XD14Z, which have more than doubled in 2015/16 compared to 2014/15.
14 CHE Research Paper 152
Table 13: High Cost Drugs – HRG code level analysis summary statistics 2014/15 2015/16
HRG code Activity Unit Cost (£)
Total Cost (£)
Activity Unit Cost (£)
Total Cost (£)
Diff in Total Cost
(£) (a) (b) (c) (d) (e) (f) (f-c)
XD14Z
Admitted Patient Care
4,028 1,510 6,083,590 4,338 2,370 10,281,129 4,197,539
Outpatient 21,363 1,253 26,761,705 29,146 3,505 102,158,786 75,397,080
Other 2,716 456 1,237,990 1,411 3,679 5,191,060 3,953,070
XD46Z
Admitted Patient Care
98,974 746 73,812,953 104,549 733 76,669,538 2,856,585
Outpatient 238,641 631 150,590,211 314,074 632 198,447,739 47,857,527
Other 9,271 530 4,910,742 9,826 992 9,750,057 4,839,316
We followed the same review steps for the NHS setting ‘Rehabilitation’. Table 14, 15, and 16 report the overall setting and HRG codes summary statistics respectively. In the event that large scale changes are detected, we look at each activity in isolation to determine the most appropriate solution. These may be to leave as is, replace an unexpected high cost value with the minimum cost across the two years, or omit the category from the output index.

Productivity of the English NHS: 2015/16 update 15
Table 14: Rehabilitation – overall setting summary statistics
Rehabilitation Type 2014/15 2015/16
Setting Activity Unit cost
(£) Total cost
(£) Activity
Unit cost (£)
Total cost (£)
Diff in Total Cost (£)
(a) (b) (c) (d) (e) (f) (f) - (c)
Complex Specialised Rehabilitation Services (CSRS) - Level 1
Admitted Patient Care
790,555 375 296,065,440 771,690 395 304,980,049 8,914,610
Outpatient 58,640 253 14,832,046 60,798 216 13,139,338 -1,692,708
Other 139,537 236 32,903,871 83,504 162 13,560,347 -19,343,524
Specialist Rehabilitation Services (SRS)- Level 2
Admitted Patient Care
541,696 360 194,826,776 447,236 375 167,553,710 -27,273,066
Outpatient 5,248 237 1,241,991 3,853 179 689,064 -552,927
Other 120,474 166 19,996,059 107,693 157 16,877,473 -3,118,586
Non-specialist Rehabilitation (NSRS) Services
Admitted Patient Care
1,178,669 304 358,140,679 1,339,02
2 323 432,786,252 74,645,574
Outpatient 21,256 112 2,372,015 18,077 88 1,598,513 -773,501
Other 152,814 223 34,034,179 153,844 253 38,960,295 4,926,116

16 CHE Research Paper 152
Table 15: Rehabilitation – overall setting summary statistics
Rehabilitation Type 2014/15 2015/16
Setting Activity Unit cost
(£) Total cost
(£) Activity
Unit cost (£)
Total cost (£)
Diff in Total Cost (£)
(a) (b) (c) (d) (e) (f) (f) - (c)
Complex Specialised Rehabilitation Services (CSRS) - Level 1
Admitted Patient Care
790,555 375 296,065,440 771,690 395 304,980,049 8,914,610
Outpatient 58,640 253 14,832,046 60,798 216 13,139,338 -1,692,708
Other 139,537 236 32,903,871 83,504 162 13,560,347 -19,343,524
Specialist Rehabilitation Services (SRS)- Level 2
Admitted Patient Care
541,696 360 194,826,776 447,236 375 167,553,710 -27,273,066
Outpatient 5,248 237 1,241,991 3,853 179 689,064 -552,927
Other 120,474 166 19,996,059 107,693 157 16,877,473 -3,118,586
Non-specialist Rehabilitation (NSRS) Services
Admitted Patient Care
1,178,669 304 358,140,679 1,339,02
2 323 432,786,252 74,645,574
Outpatient 21,256 112 2,372,015 18,077 88 1,598,513 -773,501
Other 152,814 223 34,034,179 153,844 253 38,960,295 4,926,116
Productivity of the English NHS: 2015/16 update 17
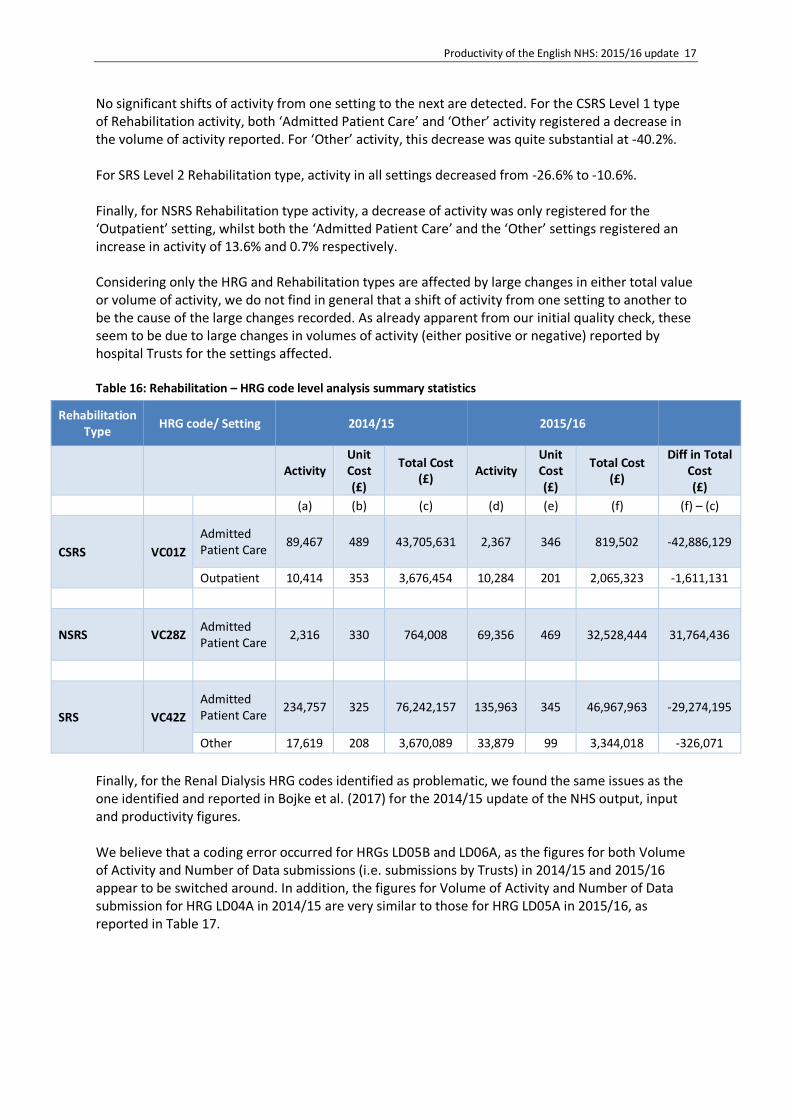
No significant shifts of activity from one setting to the next are detected. For the CSRS Level 1 type of Rehabilitation activity, both ‘Admitted Patient Care’ and ‘Other’ activity registered a decrease in the volume of activity reported. For ‘Other’ activity, this decrease was quite substantial at -40.2%. For SRS Level 2 Rehabilitation type, activity in all settings decreased from -26.6% to -10.6%. Finally, for NSRS Rehabilitation type activity, a decrease of activity was only registered for the ‘Outpatient’ setting, whilst both the ‘Admitted Patient Care’ and the ‘Other’ settings registered an increase in activity of 13.6% and 0.7% respectively. Considering only the HRG and Rehabilitation types are affected by large changes in either total value or volume of activity, we do not find in general that a shift of activity from one setting to another to be the cause of the large changes recorded. As already apparent from our initial quality check, these seem to be due to large changes in volumes of activity (either positive or negative) reported by hospital Trusts for the settings affected. Table 16: Rehabilitation – HRG code level analysis summary statistics
Rehabilitation Type
HRG code/ Setting 2014/15 2015/16
Activity Unit Cost (£)
Total Cost (£)
Activity Unit Cost (£)
Total Cost (£)
Diff in Total Cost (£)
(a) (b) (c) (d) (e) (f) (f) – (c)
CSRS VC01Z
Admitted Patient Care
89,467 489 43,705,631 2,367 346 819,502 -42,886,129
Outpatient 10,414 353 3,676,454 10,284 201 2,065,323 -1,611,131
NSRS VC28Z Admitted Patient Care
2,316 330 764,008 69,356 469 32,528,444 31,764,436
SRS VC42Z
Admitted Patient Care
234,757 325 76,242,157 135,963 345 46,967,963 -29,274,195
Other 17,619 208 3,670,089 33,879 99 3,344,018 -326,071
Finally, for the Renal Dialysis HRG codes identified as problematic, we found the same issues as the one identified and reported in Bojke et al. (2017) for the 2014/15 update of the NHS output, input and productivity figures. We believe that a coding error occurred for HRGs LD05B and LD06A, as the figures for both Volume of Activity and Number of Data submissions (i.e. submissions by Trusts) in 2014/15 and 2015/16 appear to be switched around. In addition, the figures for Volume of Activity and Number of Data submission for HRG LD04A in 2014/15 are very similar to those for HRG LD05A in 2015/16, as reported in Table 17.

18 CHE Research Paper 152
Table 17: Coding issues for Renal Dialysis HRGs
Year HRG Description Volume of
activity
Average cost No Data
submissions (£)
2013/14
LD04A Hospital haemodialysis or filtration, with access via arteriovenous fistula or graft, with blood-borne virus, 19 years and over
20,269 176 47
LD05A Satellite haemodialysis or filtration, with access via haemodialysis catheter, 19 years and over
416,706 133 42
LD05B Satellite haemodialysis or filtration, with access via haemodialysis catheter, 18 years and under
275 115 6
LD06A Satellite haemodialysis or filtration, with access via arteriovenous fistula or graft, 19 years and over
1,092,718 153 42
2014/15
LD04A Hospital haemodialysis or filtration, with access via arteriovenous fistula or graft, with blood-borne virus, 19 years and over
416,863 121 42
LD05A Satellite haemodialysis or filtration, with access via haemodialysis catheter, 19 years and over
83 150 4
LD05B Satellite haemodialysis or filtration, with access via haemodialysis catheter, 18 years and under
1,115,392 145 42
LD06A Satellite haemodialysis or filtration, with access via arteriovenous fistula or graft, 19 years and over
345 135 7
2015/16
LD04A Hospital haemodialysis or filtration, with access via arteriovenous fistula or graft, with blood-borne virus, 19 years and over
27,132 188 41
LD05A Satellite haemodialysis or filtration, with access via haemodialysis catheter, 19 years and over
435,913 139 43
LD05B Satellite haemodialysis or filtration, with access via haemodialysis catheter, 18 years and under
963 158 6
LD06A Satellite haemodialysis or filtration, with access via arteriovenous fistula or graft, 19 years and over
1,186,905 152 44
After correcting these apparent mistakes, we have decided to keep in our measure of output growth the HRGs LD04A,LD05B and LD06A for the financial year 2014/15 and the HRGs LD05A, LD05B and LD06A for the financial year 2015/16. We have dropped only one HRG in each financial year: LD05A in 2014/15 and LD04A in 2015/16. The total volume of activity that has been excluded is 83 for HRG LD05A in 2014/15 and 27,132 for HRG LD04A in 2015/16. See Table 18 for mapping of HRGs.

Productivity of the English NHS: 2015/16 update 19
Table 18: Mapping of Renal Dialysis HRGs
HRG – 2013/14 HRG-2014/15 HRG-2015/16
LD05A LD04A LD05A
LD06A LD05B LD06A
LD05B LD06A LD05B
Table 19 summarises the RC data according to broad service settings over the past two years. This shows that the number of categories is quite stable between 2014/15 and 2015/16 across the different settings. Table 19: Reference cost settings
Setting 2014/15 2015/16
Nr Cat. Activity Cost (£) Nr Cat. Activity Cost (£)
A&E and Ambulance Services 89 36,551,479 4,201,423,614 92 37,792,911 4,454,964,482
Chemo/Radiotherapy & High Cost Drugs
344 7,567,487 3,351,048,218 340 6,283,287 3,697,193,821
Community Care 180 85,733,534 5,052,768,659 184 86,767,072 5,171,028,803
Diagnostic Tests 82 363,656,649 994,023,634 81 367,378,910 984,870,571
Community Mental Health 130 259,036,112 6,489,414,327 125 253,275,018 6,309,945,016
Outpatient 9,465 83,856,229 9,815,241,661 9,616 85,394,479 10,221,877,406
Radiology 258 9,866,952 944,288,512 267 10,755,438 1,048,586,605
Rehabilitation 121 3,008,889 954,413,054 99 2,985,717 990,145,041
Renal Dialysis 39 4,070,447 533,927,599 37 4,157,008 556,027,298
Specialist Services 145 4,967,499 3,252,277,420 143 5,162,337 3,402,452,724
Other 1,119 3,407,664 287,913,867 1,130 3,990,126 319,906,305
Note: A Table summarising the RC data according to broad service settings for the years 2012/13 and 2013/14 can be found in Appendix C.
2.3.2 RC outpatient activity
Outpatient activity as measured in the RC database has tended to be classified into three major groups: consultant led activity; non-consultant led activity and procedures. Consultant and non-consultant led activity represent broadly the same set of outpatient specific HRG-style codes (currency codes beginning with WF) and outpatient procedure codes represent procedure related HRGs which may appear in other hospital settings. On average, consultant led activity for Trusts represents about 68% of overall outpatient cost-weighted activity. Outpatient procedures have increased considerably in volume representing just 3% of overall outpatient activity in 2007/08 and about 14% in 2015/16.

20 CHE Research Paper 152
Table 20: Outpatient activity and cost
Year Outpatient
All providers Trusts only
Volume of activity Average cost
(£) Volume of activity
Average cost (£)
2007/08 69,679,600 94 61,508,362 98
2008/09 74,421,017 98 65,804,814 103
2009/10 80,093,906 101 71,115,142 105
2010/11 81,301,615 105 73,621,984 107
2011/12 - - 75,826,947 108
2012/13 - - 77,222,725 111
2013/14 - - 81,699,802 114
2014/15 - - 83,856,229 117
2015/16 - - 85,394,479 120
The Laspeyres output growth measure for outpatient activity as captured by the Reference Costs data was 2.7% from 2014/15 to 2015/16, which compares to 3.73% when using the HES outpatient data. The difference between HES and RC measures of growth is about 1%, with RC data reporting lower growth than the HES outpatient data. Although both datasets have some quality issues, our preferred method uses HES, as it is a patient-level dataset as opposed to the more aggregated RC. This allows us to perform more thorough quality checks and better assure a like-for-like comparison over time. 2.3.3 A&E and ambulance services
Table 21 reports summary statistics for A&E services provided in Emergency Departments and Other A&E services according to whether patients were subsequently admitted to hospital (AD) or not admitted (NAD). Emergency departments offer a consultant-led 24 hour service with full resuscitation facilities and designated accommodation for the reception of A&E patients.9 Between 2014/15 and 2015/16 there was an increase (of about 2.3%) in the total number of emergency department attendances, with an increase of 1.26% in the number of people being subsequently admitted to hospital. The category ‘Other A&E services’ captures activities carried out in any of the following departments: ‘Consultant led mono specialty accident and emergency services (e.g. ophthalmology, dental) with designated accommodation for the reception of patients’, ‘Other type of A&E/minor injury activity with designated accommodation for the reception of accident and emergency patients’ and ‘NHS Walk-in-Centres’. ‘Other A&E services’ increased overall by 5.8% between 2014/15 and 2015/16, with an increase by just over 6% of patients being subsequently admitted to hospital. Overall, the total volume of A&E activity increased by 3.1% between 2014/15 and 2015/16. However, the number of patients subsequently being admitted to hospital as emergency cases, from
9http://content.digital.nhs.uk/media/19424/AE-DD-Final-Doc/pdf/DD-AE-V7.pdf

Productivity of the English NHS: 2015/16 update 21
either an A&E Department of other types of A&E departments decreased by just under 5% between 2014/15 and 2015/16. This might be an indication that A&E departments of all types have been dealing with increased demand from patients with ambulatory care conditions, which should have been attended to in a primary care setting. Table 21: A&E activity and average cost
Year Emergency departments Other A&E services
AD NAD AD NAD
Volume of activity
Average cost (£)
Volume of activity
Average cost (£)
Volume of activity
Average cost (£)
Volume of activity
Average cost (£)
2006/07 3,464,869 107 10,327,147 83 281,135 50 3,900,718 36
2007/08 3,326,719 121 9,058,765 89 531,498 70 3,769,765 43
2008/09 3,566,642 118 9,708,958 99 1,000,986 49 4,184,796 49
2009/10 4,047,176 134 10,075,701 103 1,090,650 49 3,628,469 50
2010/11 4,004,868 141 9,881,747 108 1,145,125 62 3,800,261 55
2011/12 4,040,760 157 10,405,762 108 616,812 83 3,253,452 52
2012/13 4,345,100 160 10,292,933 115 362,656 90 3,426,231 59
2013/14 4,218,480 177 10,189,225 127 494,549 80 3,639,355 59
2014/15 4,050,701 206 10,636,666 133 446,779 65 3,972,875 61
2015/16 4,101,720 219 10,921,696 140 473,723 69 4,202,986 60 Legend: AD – leading to admitted patient care; NAD – Not leading to admitted patient care
Figure 6: Trend of A&E activity across settings
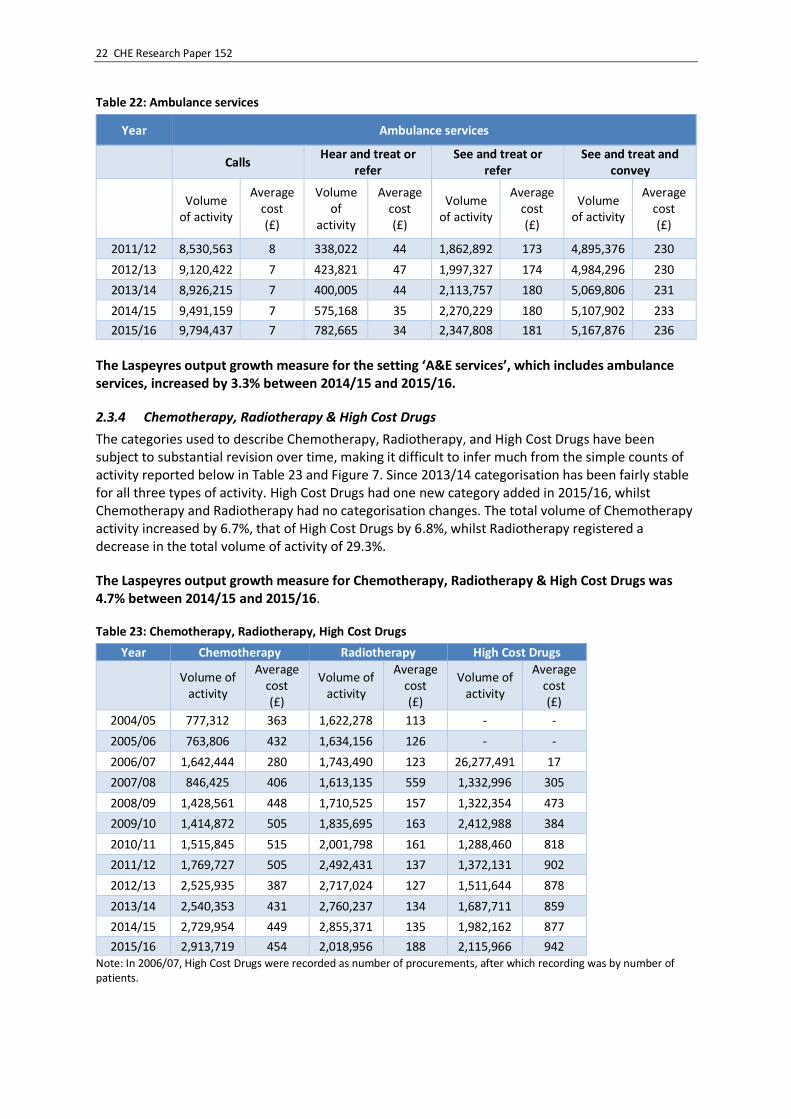
Ambulance services are reported in Table 22 for the four years since this activity was first recorded in the Reference Cost database. Activity is measured in terms of calls received for the category ‘Calls’; patients for the category ‘Hear and treat or refer’; incidents for the categories ‘See and treat or refer’ and categories ‘See and treat and convey’. Overall activity by ambulance services increased between 2014/15 and 2015/16 (3.72%), with the category ‘Hear’ alone increasing by 36.08%, and the category ‘See and treat and convey’ increasing by just 1.17%.
0
2,000,000
4,000,000
6,000,000
8,000,000
10,000,000
12,000,000
2006/07 2007/08 2008/09 2009/10 2010/11 2011/12 2012/13 2013/14 2014/15 2015/16
Emergency dep - AD Emergency dep - NAD
Other A&E services - AD Other A&E services - NAD
22 CHE Research Paper 152
Table 22: Ambulance services
Year Ambulance services
Calls Hear and treat or
refer See and treat or
refer See and treat and
convey
Volume of activity
Average cost (£)
Volume of
activity
Average cost (£)
Volume of activity
Average cost (£)
Volume of activity
Average cost (£)
2011/12 8,530,563 8 338,022 44 1,862,892 173 4,895,376 230
2012/13 9,120,422 7 423,821 47 1,997,327 174 4,984,296 230
2013/14 8,926,215 7 400,005 44 2,113,757 180 5,069,806 231
2014/15 9,491,159 7 575,168 35 2,270,229 180 5,107,902 233
2015/16 9,794,437 7 782,665 34 2,347,808 181 5,167,876 236
The Laspeyres output growth measure for the setting ‘A&E services’, which includes ambulance services, increased by 3.3% between 2014/15 and 2015/16.
2.3.4 Chemotherapy, Radiotherapy & High Cost Drugs
The categories used to describe Chemotherapy, Radiotherapy, and High Cost Drugs have been subject to substantial revision over time, making it difficult to infer much from the simple counts of activity reported below in Table 23 and Figure 7. Since 2013/14 categorisation has been fairly stable for all three types of activity. High Cost Drugs had one new category added in 2015/16, whilst Chemotherapy and Radiotherapy had no categorisation changes. The total volume of Chemotherapy activity increased by 6.7%, that of High Cost Drugs by 6.8%, whilst Radiotherapy registered a decrease in the total volume of activity of 29.3%.
The Laspeyres output growth measure for Chemotherapy, Radiotherapy & High Cost Drugs was 4.7% between 2014/15 and 2015/16. Table 23: Chemotherapy, Radiotherapy, High Cost Drugs
Year Chemotherapy Radiotherapy High Cost Drugs
Volume of activity
Average cost (£)
Volume of activity
Average cost (£)
Volume of activity
Average cost (£)
2004/05 777,312 363 1,622,278 113 - -
2005/06 763,806 432 1,634,156 126 - -
2006/07 1,642,444 280 1,743,490 123 26,277,491 17
2007/08 846,425 406 1,613,135 559 1,332,996 305
2008/09 1,428,561 448 1,710,525 157 1,322,354 473
2009/10 1,414,872 505 1,835,695 163 2,412,988 384
2010/11 1,515,845 515 2,001,798 161 1,288,460 818
2011/12 1,769,727 505 2,492,431 137 1,372,131 902
2012/13 2,525,935 387 2,717,024 127 1,511,644 878
2013/14 2,540,353 431 2,760,237 134 1,687,711 859
2014/15 2,729,954 449 2,855,371 135 1,982,162 877
2015/16 2,913,719 454 2,018,956 188 2,115,966 942 Note: In 2006/07, High Cost Drugs were recorded as number of procurements, after which recording was by number of patients.
Productivity of the English NHS: 2015/16 update 23
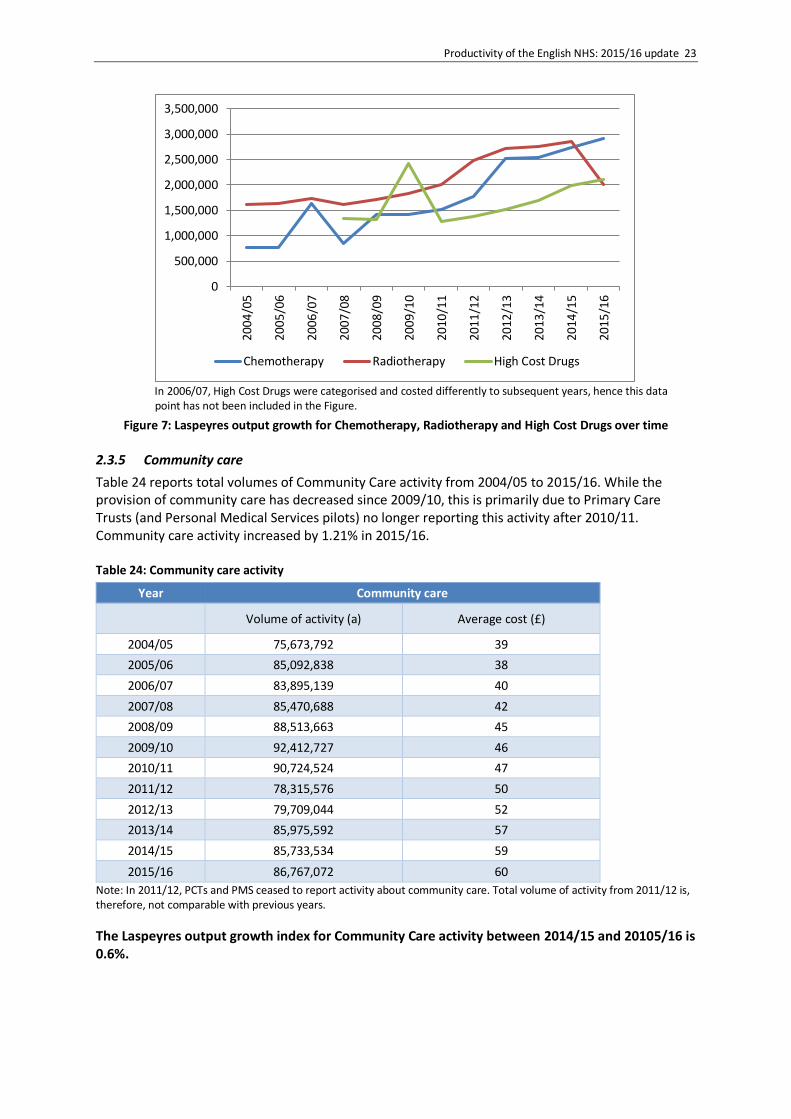
In 2006/07, High Cost Drugs were categorised and costed differently to subsequent years, hence this data point has not been included in the Figure.
Figure 7: Laspeyres output growth for Chemotherapy, Radiotherapy and High Cost Drugs over time
2.3.5 Community care
Table 24 reports total volumes of Community Care activity from 2004/05 to 2015/16. While the provision of community care has decreased since 2009/10, this is primarily due to Primary Care Trusts (and Personal Medical Services pilots) no longer reporting this activity after 2010/11. Community care activity increased by 1.21% in 2015/16. Table 24: Community care activity
Year Community care
Volume of activity (a) Average cost (£)
2004/05 75,673,792 39
2005/06 85,092,838 38
2006/07 83,895,139 40
2007/08 85,470,688 42
2008/09 88,513,663 45
2009/10 92,412,727 46
2010/11 90,724,524 47
2011/12 78,315,576 50
2012/13 79,709,044 52
2013/14 85,975,592 57
2014/15 85,733,534 59
2015/16 86,767,072 60
Note: In 2011/12, PCTs and PMS ceased to report activity about community care. Total volume of activity from 2011/12 is, therefore, not comparable with previous years.
The Laspeyres output growth index for Community Care activity between 2014/15 and 20105/16 is 0.6%.
0
500,000
1,000,000
1,500,000
2,000,000
2,500,000
3,000,000
3,500,000
2004
/05
2005
/06
2006
/07
2007
/08
2008
/09
2009
/10
2010
/11
2011
/12
2012
/13
2013
/14
2014
/15
2015
/16
Chemotherapy Radiotherapy High Cost Drugs
24 CHE Research Paper 152
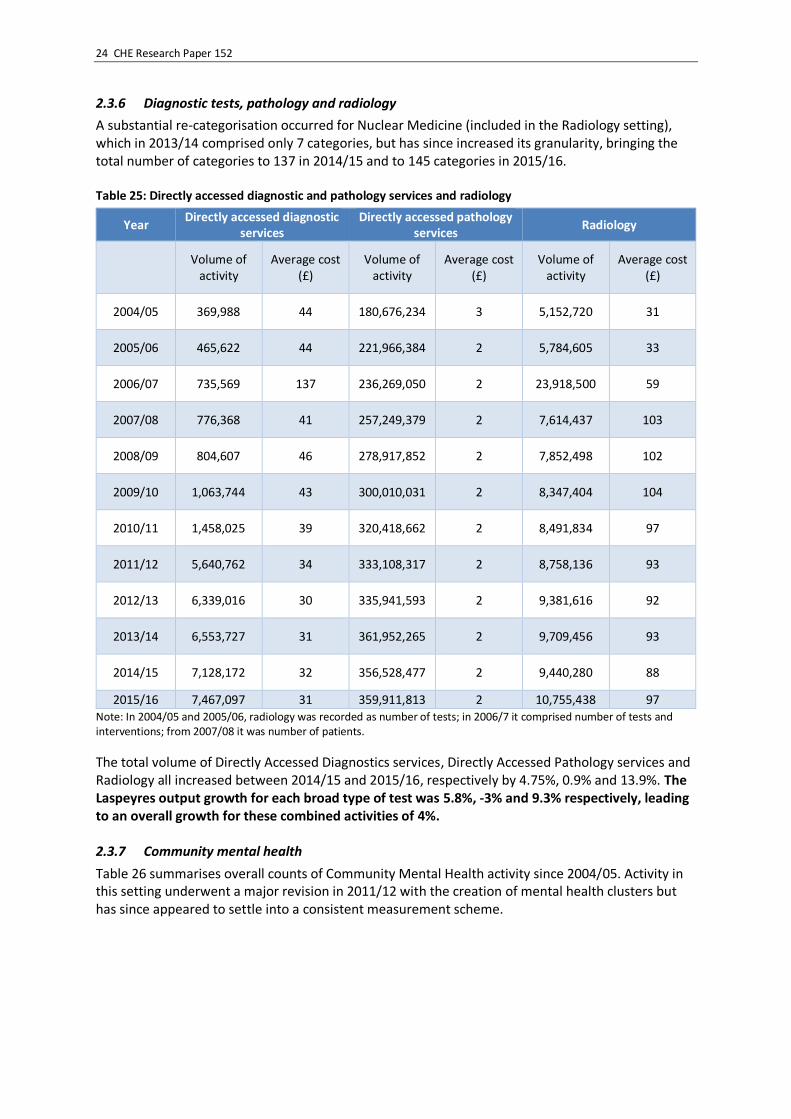
2.3.6 Diagnostic tests, pathology and radiology
A substantial re-categorisation occurred for Nuclear Medicine (included in the Radiology setting), which in 2013/14 comprised only 7 categories, but has since increased its granularity, bringing the total number of categories to 137 in 2014/15 and to 145 categories in 2015/16. Table 25: Directly accessed diagnostic and pathology services and radiology
Year Directly accessed diagnostic
services Directly accessed pathology
services Radiology
Volume of activity
Average cost (£)
Volume of activity
Average cost (£)
Volume of activity
Average cost (£)
2004/05 369,988 44 180,676,234 3 5,152,720 31
2005/06 465,622 44 221,966,384 2 5,784,605 33
2006/07 735,569 137 236,269,050 2 23,918,500 59
2007/08 776,368 41 257,249,379 2 7,614,437 103
2008/09 804,607 46 278,917,852 2 7,852,498 102
2009/10 1,063,744 43 300,010,031 2 8,347,404 104
2010/11 1,458,025 39 320,418,662 2 8,491,834 97
2011/12 5,640,762 34 333,108,317 2 8,758,136 93
2012/13 6,339,016 30 335,941,593 2 9,381,616 92
2013/14 6,553,727 31 361,952,265 2 9,709,456 93
2014/15 7,128,172 32 356,528,477 2 9,440,280 88
2015/16 7,467,097 31 359,911,813 2 10,755,438 97 Note: In 2004/05 and 2005/06, radiology was recorded as number of tests; in 2006/7 it comprised number of tests and interventions; from 2007/08 it was number of patients.
The total volume of Directly Accessed Diagnostics services, Directly Accessed Pathology services and Radiology all increased between 2014/15 and 2015/16, respectively by 4.75%, 0.9% and 13.9%. The Laspeyres output growth for each broad type of test was 5.8%, -3% and 9.3% respectively, leading to an overall growth for these combined activities of 4%. 2.3.7 Community mental health
Table 26 summarises overall counts of Community Mental Health activity since 2004/05. Activity in this setting underwent a major revision in 2011/12 with the creation of mental health clusters but has since appeared to settle into a consistent measurement scheme.

Productivity of the English NHS: 2015/16 update 25
Table 26: Community mental health
Year Community mental health
Volume of activity
Volume of activity (a)
Average cost (£)
2004/05 16,389,891 164
2005/06 17,738,894 170
2006/07 19,259,205 167
2007/08 21,751,043 153
2008/09 22,674,811 157
2009/10 23,440,616 161
2010/11 24,341,950 159
2011/12 224,329,080 28
2012/13 260,266,214 24
2013/14 259,659,214 25
2014/15 262,460,243 25
2015/16 253,275,018 26
Note: Due to the reclassification of activity in Community Mental Health, data from 2011/12 are not directly comparable with data reported in previous years. Hence, Community mental health activity was excluded from the calculations of both the Community Mental Health and the overall NHS output growth indices for the pair of years 2010/11 to 2011/12.
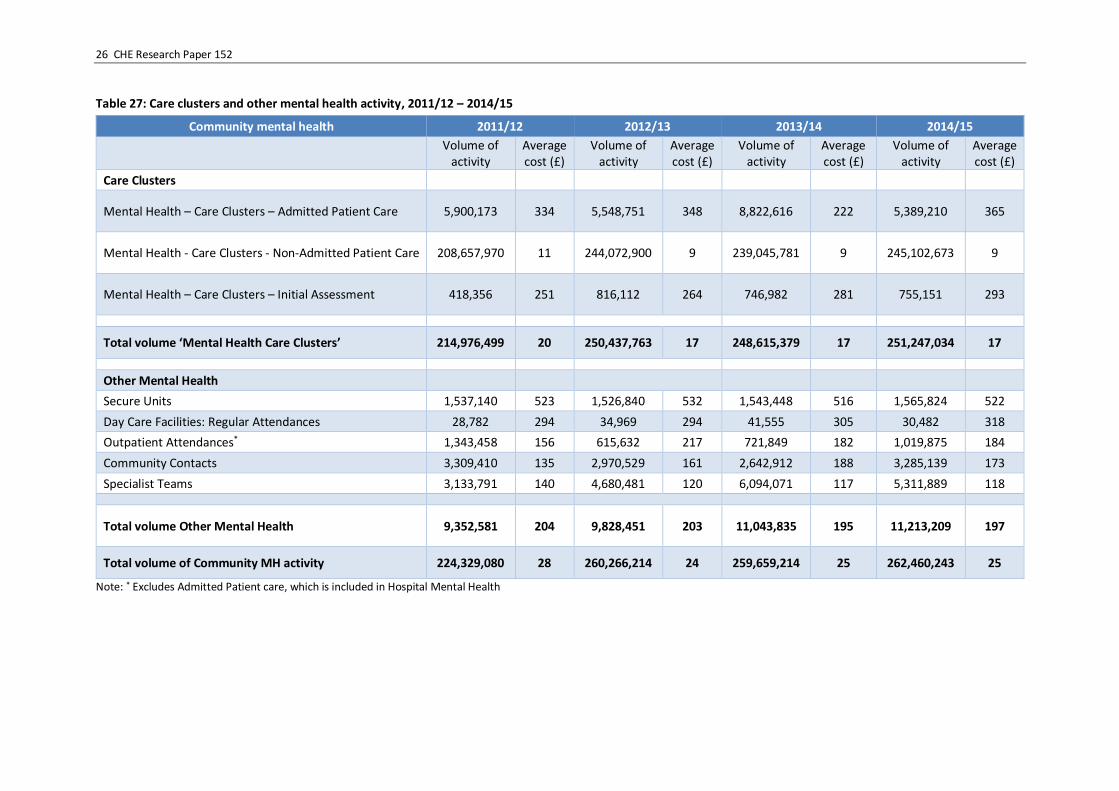
In 2015/16, the Reference Costs data added to its collection activity and cost information for Improving Access to Psychological Therapy (IAPT) activity for adults by clusters. In previous years, this activity, although not of comparable nature, was captured by contact and delivered by the Mental Health Specialist teams. As a consequence, we had to exclude the newly reported IAPT activity and that reported under MH specialist teams respectively for the years 2015/16 and 2014/15. We therefore report two separate tables summarising Community Mental Health activity: one for the years from 2011/12 to 2014/15, and one for the last two financial years, 2014/15 and 2015/16. Furthermore, ‘Other Mental Health’ activity underwent a re-labelling of broad category exercise back in 2014/15, which has continued in 2015/16. Thus, in Table 27 the categories reported under ‘Other Mental Health’ activity are different from those reported in Table 28.
26 CHE Research Paper 152
Table 27: Care clusters and other mental health activity, 2011/12 – 2014/15
Community mental health 2011/12 2012/13 2013/14 2014/15
Volume of activity
Average cost (£)
Volume of activity
Average cost (£)
Volume of activity
Average cost (£)
Volume of activity
Average cost (£)
Care Clusters
Mental Health – Care Clusters – Admitted Patient Care 5,900,173 334 5,548,751 348 8,822,616 222 5,389,210 365
Mental Health - Care Clusters - Non-Admitted Patient Care 208,657,970 11 244,072,900 9 239,045,781 9 245,102,673 9
Mental Health – Care Clusters – Initial Assessment 418,356 251 816,112 264 746,982 281 755,151 293
Total volume ‘Mental Health Care Clusters’ 214,976,499 20 250,437,763 17 248,615,379 17 251,247,034 17
Other Mental Health
Secure Units 1,537,140 523 1,526,840 532 1,543,448 516 1,565,824 522
Day Care Facilities: Regular Attendances 28,782 294 34,969 294 41,555 305 30,482 318
Outpatient Attendances* 1,343,458 156 615,632 217 721,849 182 1,019,875 184
Community Contacts 3,309,410 135 2,970,529 161 2,642,912 188 3,285,139 173
Specialist Teams 3,133,791 140 4,680,481 120 6,094,071 117 5,311,889 118
Total volume Other Mental Health 9,352,581 204 9,828,451 203 11,043,835 195 11,213,209 197
Total volume of Community MH activity 224,329,080 28 260,266,214 24 259,659,214 25 262,460,243 25
Note: * Excludes Admitted Patient care, which is included in Hospital Mental Health

Productivity of the English NHS: 2015/16 update 27
Table 28: Care clusters and other mental health activity, 2014/15 – 2015/16
Community mental health 2014/15 2015/16
Volume of activity
Average cost (£)
Volume of activity
Average cost (£)
Care Clusters
Mental Health – Care Clusters – Admitted Patient Care 5,389,210 365 5,269,507 388
Mental Health - Care Clusters - Non-Admitted Patient Care 245,102,673 9 239,684,860 9
Mental Health – Care Clusters – Initial Assessment 755,151 293 773,308 306
Total volume ‘Mental Health Care Clusters’ 251,247,034 17 245,727,675 18
Other Mental Health *
Children and Adolescent Mental Health Services 2,010,635 247 1,993,978 255
Drug and Alcohol Services 2,019,664 100 1,519,640 105
Mental Health Specialist Teams 1,887,758 162 2,111,275 165
Secure Mental Health Services 1,565,824 522 1,570,096 524
Specialist Mental Health Services 305,197 225 352,354 219
Total volume Other Mental Health 7,789,078 243 7,547,343 254
Total volume of Community MH activity 259,036,112 25 253,275,018 26
Note: * Excludes Admitted Patient care, which is included in Hospital Mental Health
In terms of raw activity, Community Mental Health decreased by 2.2% from 2014/15 to 2015/16, which is reflected by a decrease in its cost-weighted output growth measure of about -0.6%. As the decrease in the cost-weighted output growth measure is only small, we can infer that the decrease in the volume of Mental Health activity has predominantly occurred in less costly activity. 2.3.8 Rehabilitation and renal dialysis
The volume of rehabilitation and renal dialysis activity over time is reported in Table 29. Table 29: Rehabilitation and renal dialysis
Year Rehabilitation Renal dialysis
Volume of activity Average cost
(£) Volume of activity
Average cost (£)
2004/05 4,095,087 178 8,232,432 52
2005/06 4,509,489 185 6,819,136 64
2006/07 3,028,598 241 4,200,298 104
2007/08 2,732,048 259 3,980,793 114
2008/09 3,277,757 265 4,091,245 120
2009/10 3,277,430 279 4,050,658 129
2010/11 3,314,085 285 4,088,817 129
2011/12 2,897,721 278 4,166,150 129
2012/13 2,715,650 301 4,135,914 128
2013/14 3,002,512 298 4,069,460 131
2014/15 3,008,889 317 4,070,447 131
2015/16 2,985,717 332 4,157,008 134
28 CHE Research Paper 152
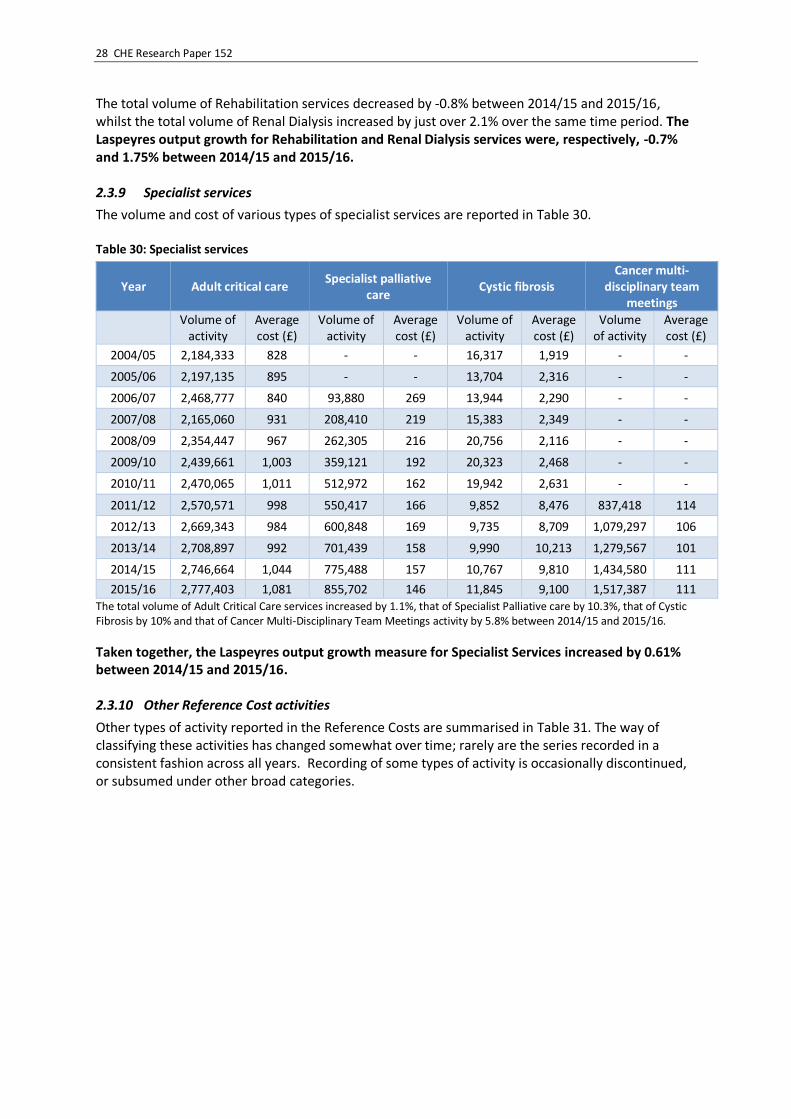
The total volume of Rehabilitation services decreased by -0.8% between 2014/15 and 2015/16, whilst the total volume of Renal Dialysis increased by just over 2.1% over the same time period. The Laspeyres output growth for Rehabilitation and Renal Dialysis services were, respectively, -0.7% and 1.75% between 2014/15 and 2015/16. 2.3.9 Specialist services
The volume and cost of various types of specialist services are reported in Table 30. Table 30: Specialist services
Year Adult critical care Specialist palliative
care Cystic fibrosis
Cancer multi-disciplinary team
meetings
Volume of activity
Average cost (£)
Volume of activity
Average cost (£)
Volume of activity
Average cost (£)
Volume of activity
Average cost (£)
2004/05 2,184,333 828 - - 16,317 1,919 - -
2005/06 2,197,135 895 - - 13,704 2,316 - -
2006/07 2,468,777 840 93,880 269 13,944 2,290 - -
2007/08 2,165,060 931 208,410 219 15,383 2,349 - -
2008/09 2,354,447 967 262,305 216 20,756 2,116 - -
2009/10 2,439,661 1,003 359,121 192 20,323 2,468 - -
2010/11 2,470,065 1,011 512,972 162 19,942 2,631 - -
2011/12 2,570,571 998 550,417 166 9,852 8,476 837,418 114
2012/13 2,669,343 984 600,848 169 9,735 8,709 1,079,297 106
2013/14 2,708,897 992 701,439 158 9,990 10,213 1,279,567 101
2014/15 2,746,664 1,044 775,488 157 10,767 9,810 1,434,580 111
2015/16 2,777,403 1,081 855,702 146 11,845 9,100 1,517,387 111 The total volume of Adult Critical Care services increased by 1.1%, that of Specialist Palliative care by 10.3%, that of Cystic Fibrosis by 10% and that of Cancer Multi-Disciplinary Team Meetings activity by 5.8% between 2014/15 and 2015/16.
Taken together, the Laspeyres output growth measure for Specialist Services increased by 0.61% between 2014/15 and 2015/16. 2.3.10 Other Reference Cost activities
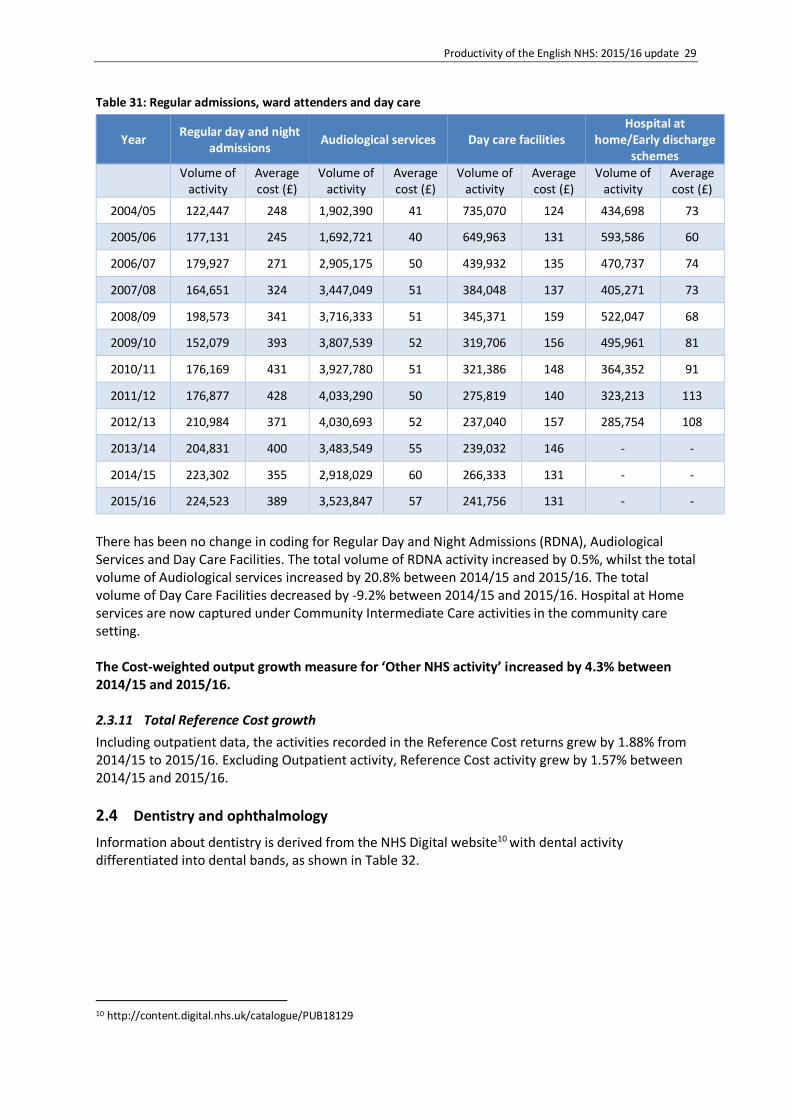
Other types of activity reported in the Reference Costs are summarised in Table 31. The way of classifying these activities has changed somewhat over time; rarely are the series recorded in a consistent fashion across all years. Recording of some types of activity is occasionally discontinued, or subsumed under other broad categories.
Productivity of the English NHS: 2015/16 update 29
Table 31: Regular admissions, ward attenders and day care
Year Regular day and night
admissions Audiological services Day care facilities
Hospital at home/Early discharge
schemes
Volume of activity
Average cost (£)
Volume of activity
Average cost (£)
Volume of activity
Average cost (£)
Volume of activity
Average cost (£)
2004/05 122,447 248 1,902,390 41 735,070 124 434,698 73
2005/06 177,131 245 1,692,721 40 649,963 131 593,586 60
2006/07 179,927 271 2,905,175 50 439,932 135 470,737 74
2007/08 164,651 324 3,447,049 51 384,048 137 405,271 73
2008/09 198,573 341 3,716,333 51 345,371 159 522,047 68
2009/10 152,079 393 3,807,539 52 319,706 156 495,961 81
2010/11 176,169 431 3,927,780 51 321,386 148 364,352 91
2011/12 176,877 428 4,033,290 50 275,819 140 323,213 113
2012/13 210,984 371 4,030,693 52 237,040 157 285,754 108
2013/14 204,831 400 3,483,549 55 239,032 146 - -
2014/15 223,302 355 2,918,029 60 266,333 131 - -
2015/16 224,523 389 3,523,847 57 241,756 131 - -
There has been no change in coding for Regular Day and Night Admissions (RDNA), Audiological Services and Day Care Facilities. The total volume of RDNA activity increased by 0.5%, whilst the total volume of Audiological services increased by 20.8% between 2014/15 and 2015/16. The total volume of Day Care Facilities decreased by -9.2% between 2014/15 and 2015/16. Hospital at Home services are now captured under Community Intermediate Care activities in the community care setting. The Cost-weighted output growth measure for ‘Other NHS activity’ increased by 4.3% between 2014/15 and 2015/16. 2.3.11 Total Reference Cost growth
Including outpatient data, the activities recorded in the Reference Cost returns grew by 1.88% from 2014/15 to 2015/16. Excluding Outpatient activity, Reference Cost activity grew by 1.57% between 2014/15 and 2015/16.
Dentistry and ophthalmology
Information about dentistry is derived from the NHS Digital website10 with dental activity differentiated into dental bands, as shown in Table 32.
10 http://content.digital.nhs.uk/catalogue/PUB18129

30 CHE Research Paper 152
Table 32: Dental services
Year Dentistry
Band 1 Band 2 Band 3 Urgent Other Total
Volume activity
Av cost (£)
Volume activity
Av cost (£)
Volume activity
Av cost (£)
Volume activity
Av cost (£)
Volume activity
Av cost (£)
2004/05* 2,241,095,331
2005/06* 2,433,471,413
2006/07 19,012,890 16 10,687,669 42 1,529,129 189 2,881,205 16 939,871 16 1,096,089,020
2007/08 19,275,334 17 10,991,870 46 1,684,537 198 3,133,209 17 901,975 17 1,219,391,145
2008/09 19,803,371 17 11,489,585 46 1,859,524 198 3,343,459 17 930,279 17 1,289,383,127
2009/10 20,346,012 17 11,699,635 46 2,086,179 198 3,509,055 17 948,634 17 1,355,827,865
2010/11 20,718,874 17 11,804,774 46 2,187,483 198 3,615,027 17 918,371 17 1,388,081,816
2011/12 20,886,648 17 11,862,329 46 2,217,060 198 3,685,411 17 919,217 17 1,400,506,136
2012/13 21,016,444 18 11,750,849 48 2,239,287 209 3,712,031 18 603,054 18 1,475,353,493
2013/14 21,685,314 18 11,801,493 49 2,232,243 214 3,852,470 18 190,216 18 1,519,077,159
2014/15 22,028,232 19 11,446,920 51 2,177,960 219 3,780,401 19 178,531 19 1,535,805,234
2015/16 22,437,889 19 11,251,942 51 2,129,467 223 3,693,752 19 169,831 19 1,545,498,706
Note: Total value of dentistry activity for years 2004/05 and 2005/06 is not directly comparable to following years, as it comes from a different data source (DH).

Productivity of the English NHS: 2015/16 update 31
As shown in Figure 8, output for all dental services, except for those in Band 1, has continued to decrease in 2015/16. Overall, the Laspeyres growth rate for dental activity decreased by -0.95% between 2014/15 and 2015/16.
Figure 8: Number of courses of treatments (CoT) over time
Data about the volume of activity for ophthalmology is published by NHS Digital on a bi-annual basis.11 Table 33 presents the volume of activity and cost for ophthalmic services over time. In 2015/16, we have been able to update the source of cost data for ophthalmological services, using those provided by the Association of Optometrists. The new cost data are reported in the last
column of Table 33. Table 33: Volume and average cost in ophthalmology
Year Ophthalmology
Volume of activity Average cost (£)
Average cost (£) -
New source
2004/05 10,148,978 33
2005/06 10,354,682 35
2006/07 10,484,922 36 19
2007/08 11,047,890 28 19
2008/09 11,278,474 28 20
2009/10 11,811,651 28 20
2010/11 11,938,529 28 21
2011/12 12,305,727 28 21
2012/13 12,339,253 28 21
2013/14 12,787,430 28 21
2014/15 12,764,485 28 21
2015/16 12,979,762 28 21
11 http://content.digital.nhs.uk/article/2021/Website-Search?productid=21325&q=a+guide+to+NHS+eye+care&sort=Relevance&size=10&page=1&area=both#top
0
5,000,000
10,000,000
15,000,000
20,000,000
25,000,000
Band 1 Band 2 Band 3 Urgent Other
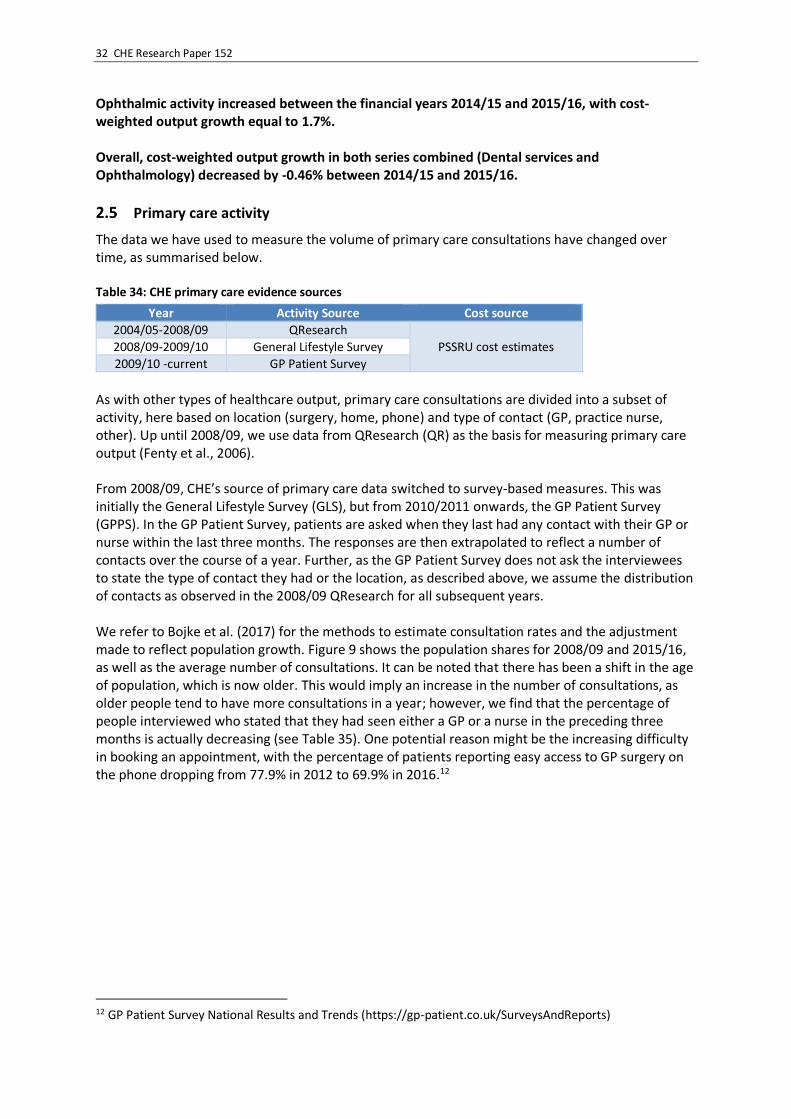
32 CHE Research Paper 152
Ophthalmic activity increased between the financial years 2014/15 and 2015/16, with cost-weighted output growth equal to 1.7%. Overall, cost-weighted output growth in both series combined (Dental services and Ophthalmology) decreased by -0.46% between 2014/15 and 2015/16.
Primary care activity
The data we have used to measure the volume of primary care consultations have changed over time, as summarised below. Table 34: CHE primary care evidence sources
Year Activity Source Cost source
2004/05-2008/09 QResearch
PSSRU cost estimates 2008/09-2009/10 General Lifestyle Survey
2009/10 -current GP Patient Survey
As with other types of healthcare output, primary care consultations are divided into a subset of activity, here based on location (surgery, home, phone) and type of contact (GP, practice nurse, other). Up until 2008/09, we use data from QResearch (QR) as the basis for measuring primary care output (Fenty et al., 2006). From 2008/09, CHE’s source of primary care data switched to survey-based measures. This was initially the General Lifestyle Survey (GLS), but from 2010/2011 onwards, the GP Patient Survey (GPPS). In the GP Patient Survey, patients are asked when they last had any contact with their GP or nurse within the last three months. The responses are then extrapolated to reflect a number of contacts over the course of a year. Further, as the GP Patient Survey does not ask the interviewees to state the type of contact they had or the location, as described above, we assume the distribution of contacts as observed in the 2008/09 QResearch for all subsequent years. We refer to Bojke et al. (2017) for the methods to estimate consultation rates and the adjustment made to reflect population growth. Figure 9 shows the population shares for 2008/09 and 2015/16, as well as the average number of consultations. It can be noted that there has been a shift in the age of population, which is now older. This would imply an increase in the number of consultations, as older people tend to have more consultations in a year; however, we find that the percentage of people interviewed who stated that they had seen either a GP or a nurse in the preceding three months is actually decreasing (see Table 35). One potential reason might be the increasing difficulty in booking an appointment, with the percentage of patients reporting easy access to GP surgery on the phone dropping from 77.9% in 2012 to 69.9% in 2016.12
12 GP Patient Survey National Results and Trends (https://gp-patient.co.uk/SurveysAndReports)
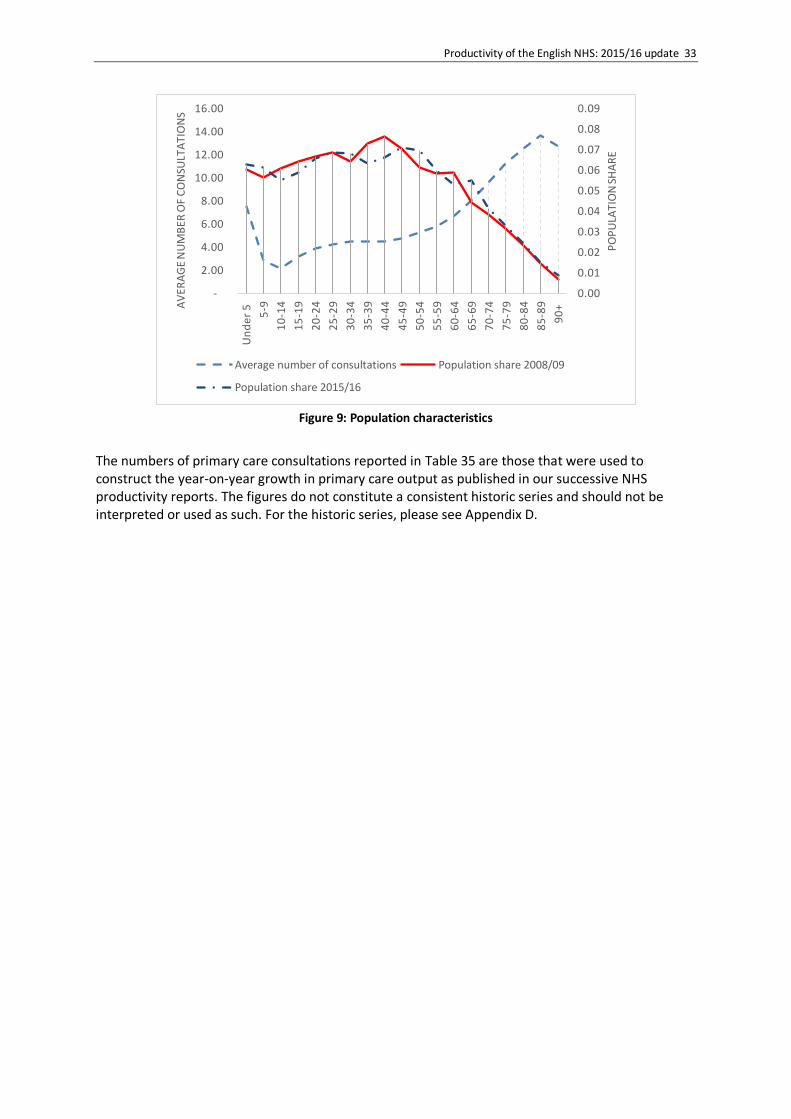
Productivity of the English NHS: 2015/16 update 33
Figure 9: Population characteristics
The numbers of primary care consultations reported in Table 35 are those that were used to construct the year-on-year growth in primary care output as published in our successive NHS productivity reports. The figures do not constitute a consistent historic series and should not be interpreted or used as such. For the historic series, please see Appendix D.
0.00
0.01
0.02
0.03
0.04
0.05
0.06
0.07
0.08
0.09
-
2.00
4.00
6.00
8.00
10.00
12.00
14.00
16.00
Un
de
r 5
5-9
10
-14
15
-19
20
-24
25
-29
30
-34
35
-39
40
-44
45
-49
50
-54
55
-59
60
-64
65
-69
70
-74
75
-79
80
-84
85
-89
90
+
PO
PU
LATI
ON
SH
AR
E
AV
ERA
GE
NU
MB
ER O
F C
ON
SULT
ATI
ON
S
Average number of consultations Population share 2008/09
Population share 2015/16

34 CHE Research Paper 152
Table 35: CHE GPPS based measure of volume of consultations13
Year
Patients who report having seen a GP in previous 3
months
Patients who report having seen a nurse in previous 3
months
Number of consultations
Population adjusted
number of consultations
Quality and population
adjusted number of consultations
QR
2004/05 265,600 274,122
2005/06 283,100 293,733
2006/07 293,000 305,517
2007/08 292,500 305,291
2008/09 300,400 313,815
GLS
2009/10 53.55% 300,400 300,400 313,988
GPPS
2010/11 52.37% 293,517 303,355
2011/12 54.00% 303,820 317,893
Population Adjustment*
2011/12 54.00% 303,764 319,661 334,468
2012/13 54.83% 308,433 327,301 342,667
2013/14 54.28% 305,328 328,199 343,942
Age & Gender Adjustment
2013/14** 54.28% 35.91% 301,253 318,249 333,484
2014/15 53.28% 35.86% 298,024 318,519 333,842
2015/16 51.47% 34.81% 288,092 311,103 325,950
Notes: *The population-adjustments are based on estimates for England only, and since 2013/14 these have also been adjusted for age and gender. ** Up to 2013/14, the number of consultations was based on those reporting they’d seen a GP within the previous 3 months. From 2013/14 onwards, the number also includes those who’d seen a primary care nurse. As a baseline, this calculation also takes the number of consultations reported by QResearch for the 2008/09 financial rather than calendar year (303,900,000) (http://content.digital.nhs.uk/pubs/gpcons95-09).
The total number of consultations is broken down into types of consultations by using the relative shares as measured by QResearch in 2008/09. Cost information for different types of consultation is derived from the PSSRU Unit Costs of Health and Social Care publication, as shown in Table 36.
13 The 2013/14 and 2014/15 figures for ‘Population adjusted number of consultations’ and ‘’Quality and population adjusted number of consultations’ differ from those reported in Bojke et al. (2017). These were amended following the identification of an error in the age-gender population adjustment formula. The correction has an effect on the output growth measure for primary care between 2013/14 and 2014/15 (the amended growth rate is reported in Table 38) and also on the NHS productivity figure (mixed method) which goes up to 0.56% from 0.53%.

Productivity of the English NHS: 2015/16 update 35
Table 36: PSSRU unit costs for consultation types (£)
Year GP Home Visit GP Telephone GP Surgery GP
Other Practice Nurse
Other Consultations
2004/05 69 30 24 24 10 15
2005/06 69 27 24 24 10 15
2006/07 55 21 34 34 9 14
2007/08 58 22 36 36 11 15
2008/09 117 21 35 35 11 14
2009/10 120 22 36 36 12 17
2010/11 121 22 36 36 13 25
2011/12 110 26 43 43 14 25
2012/13 114 27 45 45 13 25
2013/14 114 28 46 46 14 25
2014/15 114 27 44 44 14 25
2015/16 114 15a 36b 36 11 N/A Notes: a: Estimates extracted from a telephone triage GP-lead cost estimates. b: Duration of GP consultation contact has been reduced from 11.7 to 9.22 minutes.
Changes in the quality of primary care activity, limited to Coronary Heart Disease, Stroke and Hypertension are accounted for using the Quality & Outcomes Framework (QOF) achievement indicators.14 (Derbyshire et al., 2007) The numbers for prevalence are obtained from Annex 1 of the QOF report.15 Data about success rates are obtained from the Clinical results tables, available in the same report. These data are summarised in Table 37. The QOF achievements for 2015/16 are slightly smaller than those reported in 2014/15; thus, we expect the quality-adjusted primary care output growth measure to reflect this. Table 37: Quality adjustment for primary care (%)
Year Prevalence QOF achievement
CHD Stroke Hypertension CHD Stroke Hypertension
2005/06 3.57 1.66 11.48 84.44 81.22 71.05
2006/07 3.54 1.61 12.49 88.86 86.92 77.62
2007/08 3.5 1.63 12.79 89.41 87.51 78.35
2008/09 3.47 1.66 13.13 89.68 87.88 78.56
2009/10 3.44 1.68 13.35 89.77 88.12 78.72
2010/11 3.4 1.71 13.52 90.16 88.57 79.3
2011/12 3.38 1.74 13.63 90.14 88.61 79.65
2012/13 3.4 1.7 13.68 90.57 89.26 80.79
2013/14 3.29 1.72 13.73 91.27 89.84 83.09
2014/15 3.25 1.73 13.79 91.98 88.17 83.61
2015/16 3.20 1.74 13.81 91.89 87.63 82.90
14 These are QOF CHD002 for Coronary Heart Disease, STIA003 for Stroke and HYP006 for Hypertension. 15 http://content.digital.nhs.uk/catalogue/PUB18887

36 CHE Research Paper 152
The Laspeyres growth rates for primary care are reported in Table 38. Table 38: Laspeyres growth rates for primary care
Years Unadjusted growth rate
Population adjusted
growth rate
Population and quality
adjusted growth rate
2004/05 - 2005/06 6.59% 7.15%
2005/06 - 2006/07 3.50% 4.01%
2006/07 - 2007/08 -0.17% -0.07%
2007/08 - 2008/09 2.70% 2.79%
2008/09 - 2009/10 0.00% 0.06%
2009/10 - 2010/11 -2.61% -1.11% -0.99%
2010/11 - 2011/12 3.83% 4.66% 4.70%
2011/12 - 2012/13 1.54% 2.39% 2.45%
2012/13 - 2013/14 -1.01% 0.27% 0.37%
2013/14 - 2014/15 -1.07% 0.08% 0.11%
2014/15 - 2015/16 -3.33% -2.33% -2.36%
The survey data suggest that the number of primary care consultations decreased by -3.33% between 2014/15 and 2015/16. Scaled up to account for population growth, the growth in primary care activity amounts to -2.33%. Finally, after taking account of the quality of consultations over these two years, the growth in primary care consultations amounts to -2.36%. The quality adjustment further reduces the growth rate and the result is due both to the higher prevalence of stroke and hypertension and the lower achievement of the three QOF indicators in 2015/16 with respect to the same indicators in 2014/15.
Community prescribing
Data about community prescribing are derived from the Prescription Cost Analysis (PCA) system, supplied by the Prescription Pricing Authority via the NHS Digital Prescription Drugs Team. The data are based on a full analysis of all prescriptions dispensed in the community, summarised into different categories defined according to chemical composition. The data include information about the Drug code (PropGenLinkCode), Net Ingredient Cost (NIC), Quantity of Drug Dispensed, and Number of Prescription Items. The data are complete and prices are available for all items across the years. Table 39 reports summary statistics about community prescribing. Drugs are categorised according to their chemical composition, with the number of category changing over time. A peak number of categories was reported in 2004/05 (8,779 categories), falling to a low in 2013/14 (7,809 categories)

Productivity of the English NHS: 2015/16 update 37
before picking up again. Variations in the number of categories are usually due to zero counts in some years, rather than definitional changes. The 2015/16 data contain information on 8,021 distinct community prescribed drug items representing over a billion prescriptions with a total value/cost of approximately £9.3 billion, which is almost £346m more than in 2014/15. There are 704 new drug items totalling £14.6m that appear in 2015/16 but not 2014/15. There are 609 drug items which appeared in 2014/15 but not in 2015/16, with a lagged total spend of £1.6m. There are no data items which appear obviously incorrect and we therefore take the data at face value. Table 39: Community prescribing, summary data
Year Unique
drug codes
observed
Total Prescribing
Total Spend
Activity weighted average
prescription unit cost (£)
2004/05 8,779 691,948,868 £8,094,174,944 11.7
2005/06 8,535 733,010,929 £8,013,483,226 10.93
2006/07 8,218 762,631,738 £8,250,323,893 10.82
2007/08 8,769 803,297,137 £8,303,500,918 10.34
2008/09 8,276 852,482,281 £8,376,264,432 9.83
2009/10 8,072 897,727,347 £8,621,421,130 9.6
2010/11 7,860 936,743,859 £8,880,735,344 9.48
2011/12 7,856 973,381,568 £8,777,964,802 9.02
2012/13 7,699 1,001,825,994 £8,397,492,181 8.38
2013/14 7,353 1,031,703,347 £8,540,423,964 8.28
2013/14* 7,809 1,039,535,998 £8,703,169,718 8.37
2014/15 7,926 1,071,065,672 £8,942,734,216 8.35
2015/16 8,021 1,087,838,465 £9,288,424,660 8.54
Note: *In February 2017, NHS Digital released a new set of prescribing data to include previously omitted drug codes. The 2012/13-2013/14 growth figures for prescribing are based on the earlier data, whilst the 2013/14-2014/15 growth figures are based on the new data.
From the data we observe changes in average cost of prescription and in unit (i.e. item) cost over recent years (Table 39). Output and price indices for community prescribing are reported in Table 40. Prices have fallen year-on-year over the whole period, the drop is minimal between 2014/15 and 2015/16, being equal to -0.07%, the smallest decrease in all years reported.
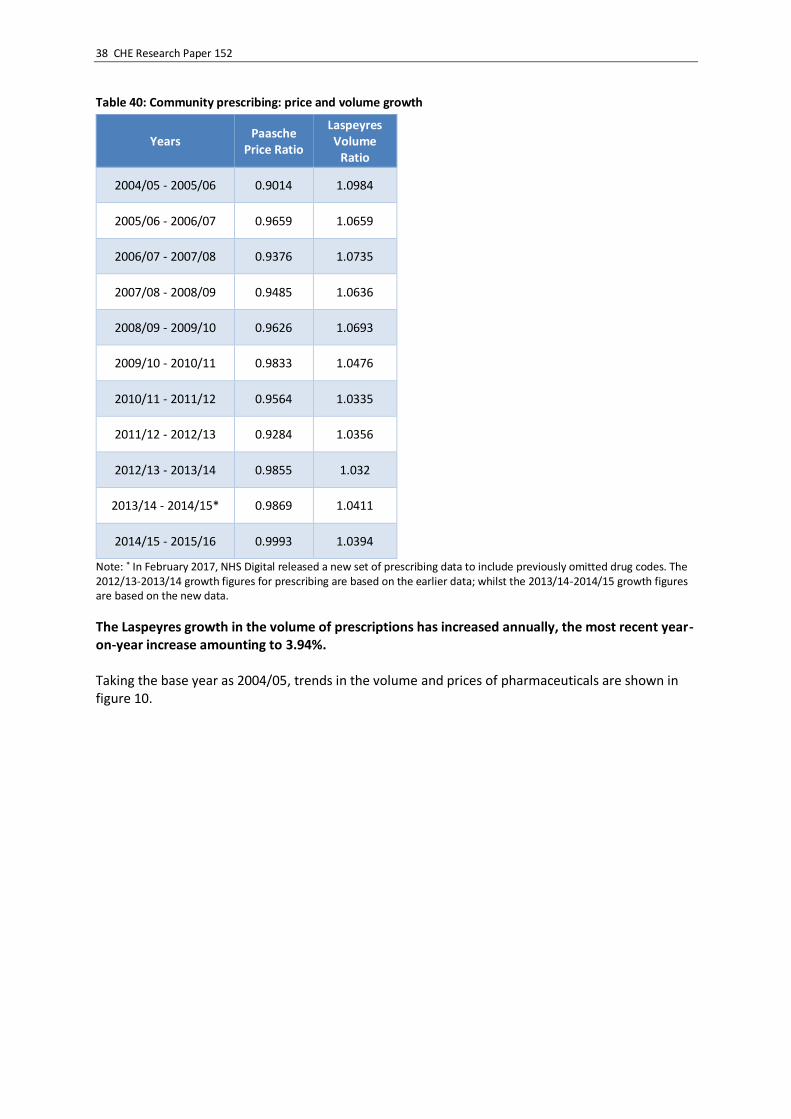
38 CHE Research Paper 152
Table 40: Community prescribing: price and volume growth
Years Paasche
Price Ratio
Laspeyres Volume
Ratio
2004/05 - 2005/06 0.9014 1.0984
2005/06 - 2006/07 0.9659 1.0659
2006/07 - 2007/08 0.9376 1.0735
2007/08 - 2008/09 0.9485 1.0636
2008/09 - 2009/10 0.9626 1.0693
2009/10 - 2010/11 0.9833 1.0476
2010/11 - 2011/12 0.9564 1.0335
2011/12 - 2012/13 0.9284 1.0356
2012/13 - 2013/14 0.9855 1.032
2013/14 - 2014/15* 0.9869 1.0411
2014/15 - 2015/16 0.9993 1.0394
Note: * In February 2017, NHS Digital released a new set of prescribing data to include previously omitted drug codes. The 2012/13-2013/14 growth figures for prescribing are based on the earlier data; whilst the 2013/14-2014/15 growth figures are based on the new data.
The Laspeyres growth in the volume of prescriptions has increased annually, the most recent year-on-year increase amounting to 3.94%. Taking the base year as 2004/05, trends in the volume and prices of pharmaceuticals are shown in figure 10.

Productivity of the English NHS: 2015/16 update 39
Figure 10: Price and volume changes for community prescribed pharmaceuticals
Note: * In February 2017, NHS Digital released a new set of prescribing data to include previously omitted drug codes. The 2012/13-2013/14 growth figures for prescribing are based on the earlier data, whilst the 2013/14-2014/15 growth figures are based on the new data.
Output growth
Output growth is measured by combining activities of different types into a single index, using costs to reflect their values. As shown in Table 41, this generates our cost-weighted output growth index, which increased by 2.16% between 2014/15 and 2015/16.
We then re-scale each type of cost-weighted output according to changes in survival, health improvements, waiting times, and blood pressure monitoring. This generates our quality-adjusted index, which increased by 2.62% between 2014/15 and 2015/16. This is (0.46%) higher than the cost-weighted index, with improvements registered in some of the quality measures (survival rates, life expectancy and PROMS) and deteriorations in others (waiting times and QOF achievement in primary care). Table 41: Output growth
Years All NHS
Cost-weighted
growth Quality adjusted
CW growth
2004/05 – 2005/06 6.53% 7.11%
2005/06 – 2006/07 5.88% 6.50%
2006/07 – 2007/08 3.41% 3.66%
2007/08 – 2008/09 5.34% 5.73%
2008/09 – 2009/10 3.44% 4.11%
2009/10 – 2010/11 3.61% 4.57%
2010/11 – 2011/12 2.38% 3.15%
2011/12 – 2012/13 2.58% 2.34%
2012/13 – 2013/14 2.37% 2.64%
2013/14 – 2014/15 2.53% 2.49%
2014/15 – 2015/16 2.16% 2.63%
0.6
0.7
0.8
0.9
1
1.1
1.2
1.3
1.4
1.5
Volume Average Price
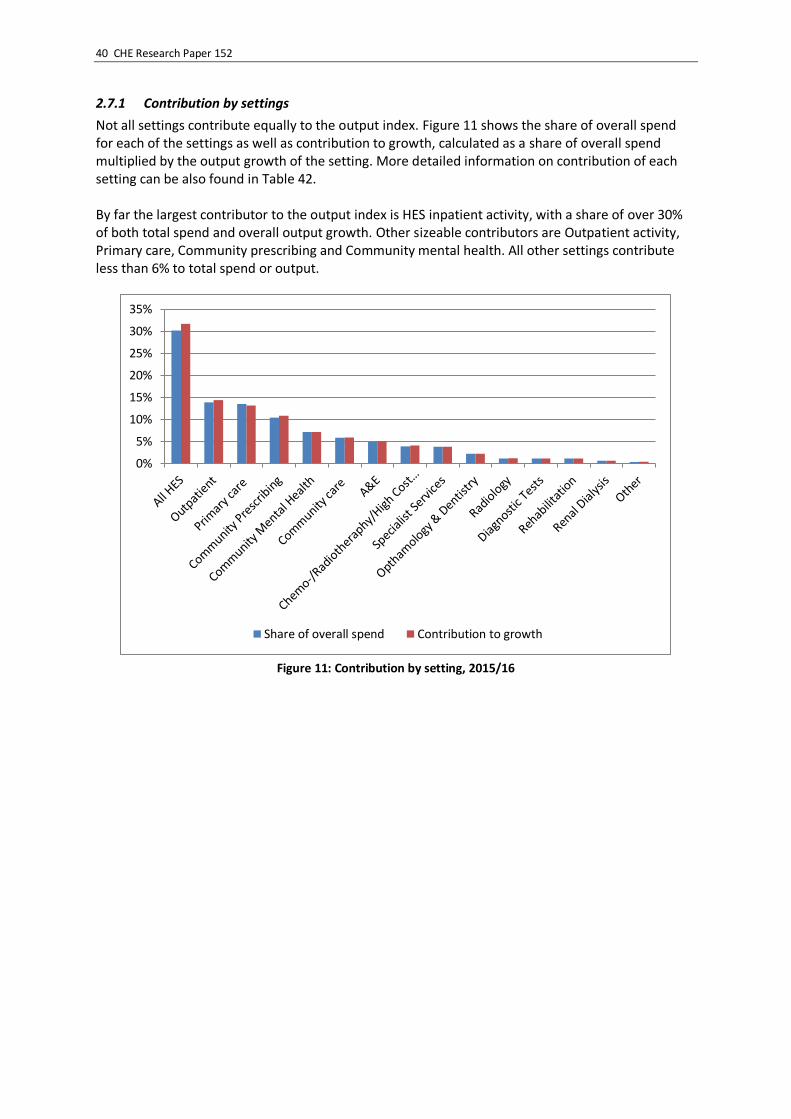
40 CHE Research Paper 152
2.7.1 Contribution by settings
Not all settings contribute equally to the output index. Figure 11 shows the share of overall spend for each of the settings as well as contribution to growth, calculated as a share of overall spend multiplied by the output growth of the setting. More detailed information on contribution of each setting can be also found in Table 42. By far the largest contributor to the output index is HES inpatient activity, with a share of over 30% of both total spend and overall output growth. Other sizeable contributors are Outpatient activity, Primary care, Community prescribing and Community mental health. All other settings contribute less than 6% to total spend or output.
Figure 11: Contribution by setting, 2015/16
0%
5%
10%
15%
20%
25%
30%
35%
Share of overall spend Contribution to growth
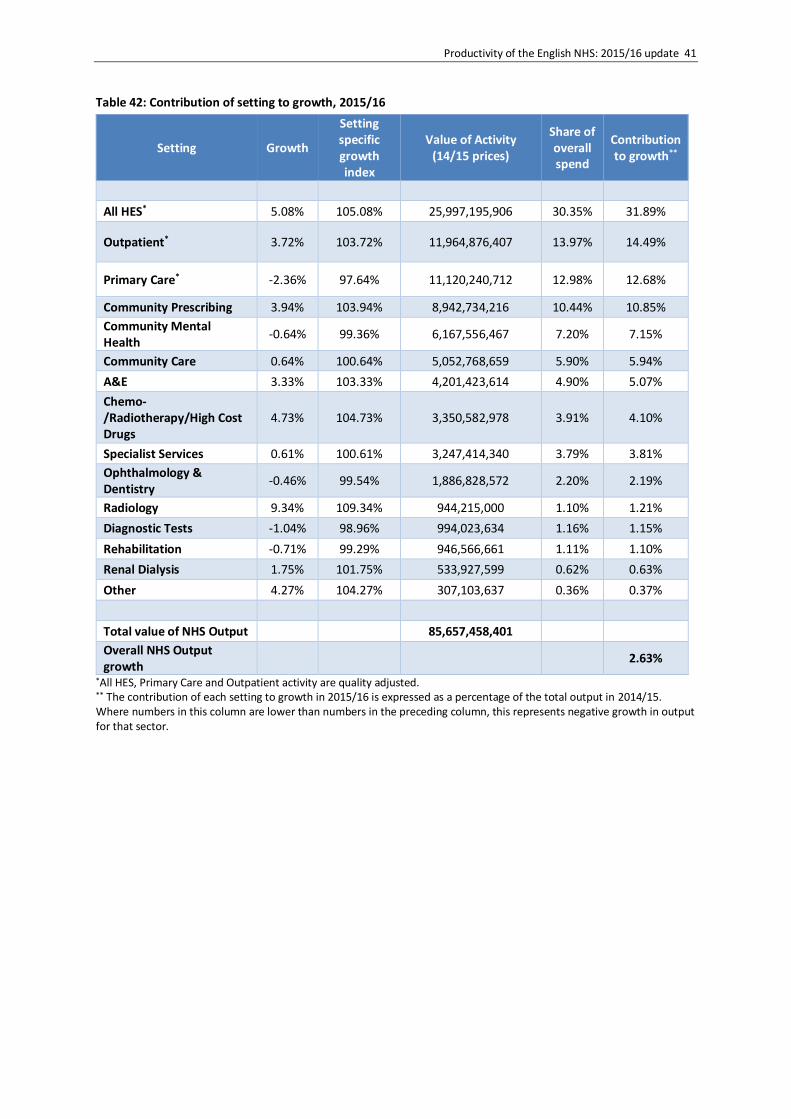
Productivity of the English NHS: 2015/16 update 41
Table 42: Contribution of setting to growth, 2015/16
Setting Growth
Setting specific growth index
Value of Activity (14/15 prices)
Share of overall spend
Contribution to growth**
All HES* 5.08% 105.08% 25,997,195,906 30.35% 31.89%
Outpatient* 3.72% 103.72% 11,964,876,407 13.97% 14.49%
Primary Care* -2.36% 97.64% 11,120,240,712 12.98% 12.68%
Community Prescribing 3.94% 103.94% 8,942,734,216 10.44% 10.85%
Community Mental Health
-0.64% 99.36% 6,167,556,467 7.20% 7.15%
Community Care 0.64% 100.64% 5,052,768,659 5.90% 5.94%
A&E 3.33% 103.33% 4,201,423,614 4.90% 5.07%
Chemo-/Radiotherapy/High Cost Drugs
4.73% 104.73% 3,350,582,978 3.91% 4.10%
Specialist Services 0.61% 100.61% 3,247,414,340 3.79% 3.81%
Ophthalmology & Dentistry
-0.46% 99.54% 1,886,828,572 2.20% 2.19%
Radiology 9.34% 109.34% 944,215,000 1.10% 1.21%
Diagnostic Tests -1.04% 98.96% 994,023,634 1.16% 1.15%
Rehabilitation -0.71% 99.29% 946,566,661 1.11% 1.10%
Renal Dialysis 1.75% 101.75% 533,927,599 0.62% 0.63%
Other 4.27% 104.27% 307,103,637 0.36% 0.37%
Total value of NHS Output 85,657,458,401
Overall NHS Output growth
2.63%
*All HES, Primary Care and Outpatient activity are quality adjusted. ** The contribution of each setting to growth in 2015/16 is expressed as a percentage of the total output in 2014/15. Where numbers in this column are lower than numbers in the preceding column, this represents negative growth in output for that sector.

42 CHE Research Paper 152
3. Inputs
Inputs into the health care system consist of:
Labour, such as doctors, nurses, technicians and managers;
Materials and supplies, such as drugs and disposable items;
Capital, such as buildings and equipment with an asset life of more than a year. We construct a comprehensive index of input growth, using the workforce data and organisational accounts submitted by NHS organisations together with other forms of expenditure data. These data are used to quantify the amount of all inputs used in the production of health care provided to NHS patients. For capital and materials we have only expenditure data, but labour data comes from two sources: expenditure data as well as staff numbers from the Electronic Staff Record (ESR). We explore the growth consequences of using these alternative data sources for labour input. We report estimates for two different formulations of the input index. Our mixed index uses information about labour inputs recorded in the ESR and expenditure for everything else; our indirect method uses expenditure data for all types of input.
Direct labour
Since 2007/08 we use the ESR data to calculate growth in labour inputs.16 These data are obtained from the NHS iView database17 which draws data directly from the ESR, and combined Payroll and Human Resources system for the NHS. The data contain numbers of full time equivalent (FTEs) staff and earnings for over 580 different occupational groups for all staff employed by NHS organisations.18 Where 5 or less staff members are employed in a particular staff group, the organisation randomly reports either 5 or 0. For this reason, the reported total number of staff constructed using the ESR source data differs from the aggregated figures published by NHS Digital.19 The ESR data collection method was updated in March 2016, and resulted in a list of several developments that affect the way staff are counted and classified and which have been introduced to improve the quality of the data available. The complete list of developments is available on the NHS Digital website.20 The new methodology introduces a break in the chain and makes the figures from 2015/16 no longer comparable to previous financial years. We have, however, obtained from NHS Digital ESR data for the financial year 2014/15 that are comparable to those reported for 2015/16. Thus, in the following tables, we present two columns of data for the year 2014/15: the first column reports data from the pre-update of the ESR data collection method (as reported in our previous research paper, Bojke et al. (2017)) and the second 2014/15 column which reports data using NHS Digital newest methodology. Data on staff earnings come from a separate dataset, also provided by NHS Digital, which includes all earnings data submitted by NHS organisations for staff paid directly by the NHS. This dataset
16 Up to 2006/07, we used data from the Workforce Census to count the number of staff working in the NHS. 17 http://content.digital.nhs.uk/iview 18 We drop ESR returns made by private providers, NHS Arm’s-length bodies, Special Health Authorities and other NHS bodies that report to the ESR but do not fall in the included categories (e.g. Sussex Health Informatics Service (YDD81) ) 19 http://content.digital.nhs.uk/workforce. 20 http://content.digital.nhs.uk/hchs
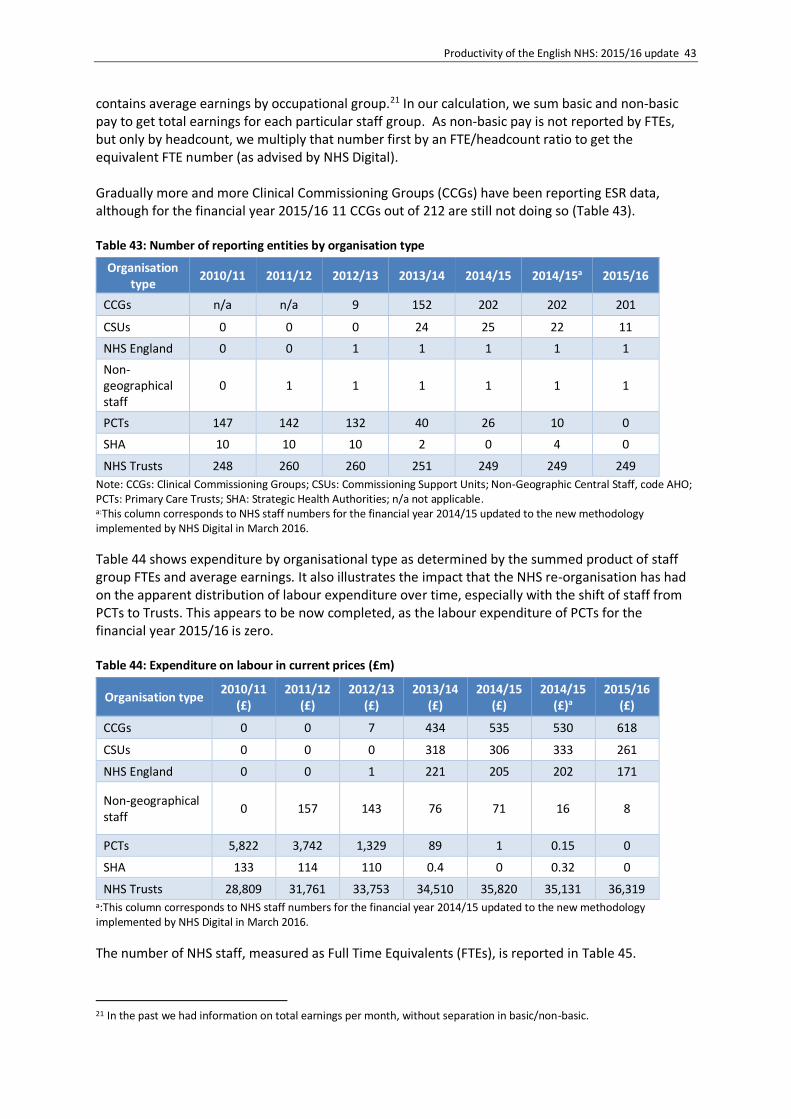
Productivity of the English NHS: 2015/16 update 43
contains average earnings by occupational group.21 In our calculation, we sum basic and non-basic pay to get total earnings for each particular staff group. As non-basic pay is not reported by FTEs, but only by headcount, we multiply that number first by an FTE/headcount ratio to get the equivalent FTE number (as advised by NHS Digital). Gradually more and more Clinical Commissioning Groups (CCGs) have been reporting ESR data, although for the financial year 2015/16 11 CCGs out of 212 are still not doing so (Table 43). Table 43: Number of reporting entities by organisation type
Organisation type
2010/11 2011/12 2012/13 2013/14 2014/15 2014/15a 2015/16
CCGs n/a n/a 9 152 202 202 201
CSUs 0 0 0 24 25 22 11
NHS England 0 0 1 1 1 1 1
Non-geographical staff
0 1 1 1 1 1 1
PCTs 147 142 132 40 26 10 0
SHA 10 10 10 2 0 4 0
NHS Trusts 248 260 260 251 249 249 249
Note: CCGs: Clinical Commissioning Groups; CSUs: Commissioning Support Units; Non-Geographic Central Staff, code AHO; PCTs: Primary Care Trusts; SHA: Strategic Health Authorities; n/a not applicable. a:This column corresponds to NHS staff numbers for the financial year 2014/15 updated to the new methodology implemented by NHS Digital in March 2016.
Table 44 shows expenditure by organisational type as determined by the summed product of staff group FTEs and average earnings. It also illustrates the impact that the NHS re-organisation has had on the apparent distribution of labour expenditure over time, especially with the shift of staff from PCTs to Trusts. This appears to be now completed, as the labour expenditure of PCTs for the financial year 2015/16 is zero. Table 44: Expenditure on labour in current prices (£m)
Organisation type 2010/11
(£) 2011/12
(£) 2012/13
(£) 2013/14
(£) 2014/15
(£) 2014/15
(£)a 2015/16
(£)
CCGs 0 0 7 434 535 530 618
CSUs 0 0 0 318 306 333 261
NHS England 0 0 1 221 205 202 171
Non-geographical staff
0 157 143 76 71 16 8
PCTs 5,822 3,742 1,329 89 1 0.15 0
SHA 133 114 110 0.4 0 0.32 0
NHS Trusts 28,809 31,761 33,753 34,510 35,820 35,131 36,319 a:This column corresponds to NHS staff numbers for the financial year 2014/15 updated to the new methodology implemented by NHS Digital in March 2016.
The number of NHS staff, measured as Full Time Equivalents (FTEs), is reported in Table 45.
21 In the past we had information on total earnings per month, without separation in basic/non-basic.

44 CHE Research Paper 152
Table 45: NHS staff numbers
2004/5 2005/6 2006/7 2007/8 2008/9 2009/10 2010/11 2011/12 2012/13 2013/14 2014/15 2014/15(c) 2015/16
GPs (a) 31,021 32,855 33,384 33,730 34,043 36,085 35,243 35,319 35,871 36,294 n/a n/a n/a
GP Practice staff 69,140 72,006 72,990 75,085 73,292 72,153 73,306
GP Practice staff – new method
82,802 84,609 85,546 87,114 n/a n/a n/a
Medical staff (b) 78,462 82,568 85,975 84,811 90,460 93,393 95,531 99,331 100,878 100,797 104,189 102,764 104,009
Ambulance staff 21,149 23,084 24,489 25,056 24,908 24,566 24,757 25,381 25,028 26,008
Administration and estates staff
237,264 243,018 262,479 263,723 250,539 242,980 239,359 245,504 208,961 213,880
Health care assistants and other support staff
101,114 106,406 112,710 114,786 116,643 116,018 119,138 123,870 121,564 126,549
Nursing, midwifery and health visiting staff and learners
366,520 372,132 379,841 380,114 377,948 363,781 366,246 372,060 359,221 359,826
Scientific, therapeutic and technical staff and healthcare scientists
141,754 150,056 159,538 165,454 168,750 164,312 165,683 173,536 165,188 167,438
Unknown and Non-funded staff
4,327 3,595 3,462 3,351 3,055 2,652 2,423 0 3,544 3,757
Professionally qualified clinical staff
412,013 425,044 425,983
Support to clinical staff
271,347 278,994 273,202
NHS infrastructure support staff
178,530 186,510 178,230
Notes: a Data for GPs and GP practice staff are not available from ESR; Workforce Census data are used instead; there were also changes in counting of GP Practice staff, therefore data from 2010/11 onwards are not comparable to previous years. NHS Digital stopped reporting the GP figures in 2014/15. b FTE data up to 2006/07 are taken from the Workforce Census data. FTE data from 2007/08 onwards are taken from organisational returns of Electronic Staff Records. When there are 5 or less people employed in an occupational group, organisations report either 5 or 0; these totals therefore will differ from those derived from national level data. c This column corresponds to NHS staff numbers for the financial year 2014/15 updated to the new methodology implemented by NHS Digital in March 2016.
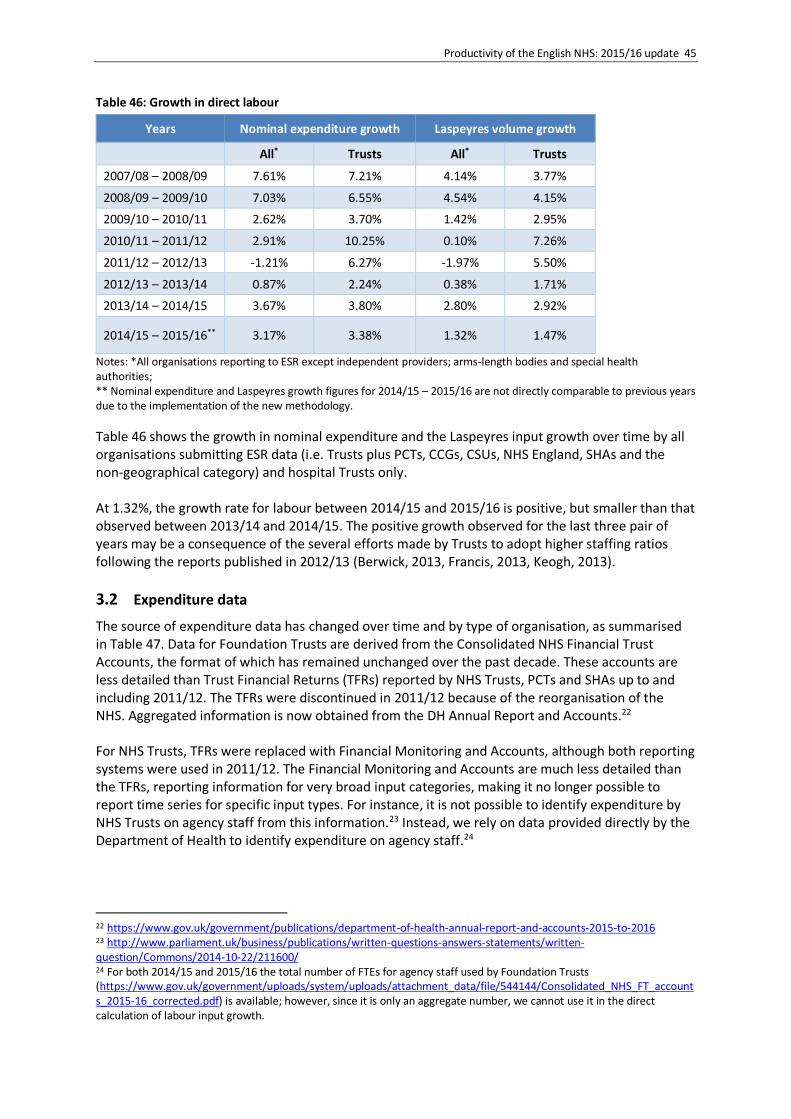
Productivity of the English NHS: 2015/16 update 45
Table 46: Growth in direct labour
Years Nominal expenditure growth Laspeyres volume growth
All* Trusts All* Trusts
2007/08 – 2008/09 7.61% 7.21% 4.14% 3.77%
2008/09 – 2009/10 7.03% 6.55% 4.54% 4.15%
2009/10 – 2010/11 2.62% 3.70% 1.42% 2.95%
2010/11 – 2011/12 2.91% 10.25% 0.10% 7.26%
2011/12 – 2012/13 -1.21% 6.27% -1.97% 5.50%
2012/13 – 2013/14 0.87% 2.24% 0.38% 1.71%
2013/14 – 2014/15 3.67% 3.80% 2.80% 2.92%
2014/15 – 2015/16** 3.17% 3.38% 1.32% 1.47%
Notes: *All organisations reporting to ESR except independent providers; arms-length bodies and special health authorities; ** Nominal expenditure and Laspeyres growth figures for 2014/15 – 2015/16 are not directly comparable to previous years due to the implementation of the new methodology.
Table 46 shows the growth in nominal expenditure and the Laspeyres input growth over time by all organisations submitting ESR data (i.e. Trusts plus PCTs, CCGs, CSUs, NHS England, SHAs and the non-geographical category) and hospital Trusts only. At 1.32%, the growth rate for labour between 2014/15 and 2015/16 is positive, but smaller than that observed between 2013/14 and 2014/15. The positive growth observed for the last three pair of years may be a consequence of the several efforts made by Trusts to adopt higher staffing ratios following the reports published in 2012/13 (Berwick, 2013, Francis, 2013, Keogh, 2013).
Expenditure data
The source of expenditure data has changed over time and by type of organisation, as summarised in Table 47. Data for Foundation Trusts are derived from the Consolidated NHS Financial Trust Accounts, the format of which has remained unchanged over the past decade. These accounts are less detailed than Trust Financial Returns (TFRs) reported by NHS Trusts, PCTs and SHAs up to and including 2011/12. The TFRs were discontinued in 2011/12 because of the reorganisation of the NHS. Aggregated information is now obtained from the DH Annual Report and Accounts.22 For NHS Trusts, TFRs were replaced with Financial Monitoring and Accounts, although both reporting systems were used in 2011/12. The Financial Monitoring and Accounts are much less detailed than the TFRs, reporting information for very broad input categories, making it no longer possible to report time series for specific input types. For instance, it is not possible to identify expenditure by NHS Trusts on agency staff from this information.23 Instead, we rely on data provided directly by the Department of Health to identify expenditure on agency staff.24
22 https://www.gov.uk/government/publications/department-of-health-annual-report-and-accounts-2015-to-2016 23 http://www.parliament.uk/business/publications/written-questions-answers-statements/written-question/Commons/2014-10-22/211600/ 24 For both 2014/15 and 2015/16 the total number of FTEs for agency staff used by Foundation Trusts (https://www.gov.uk/government/uploads/system/uploads/attachment_data/file/544144/Consolidated_NHS_FT_accounts_2015-16_corrected.pdf) is available; however, since it is only an aggregate number, we cannot use it in the direct calculation of labour input growth.
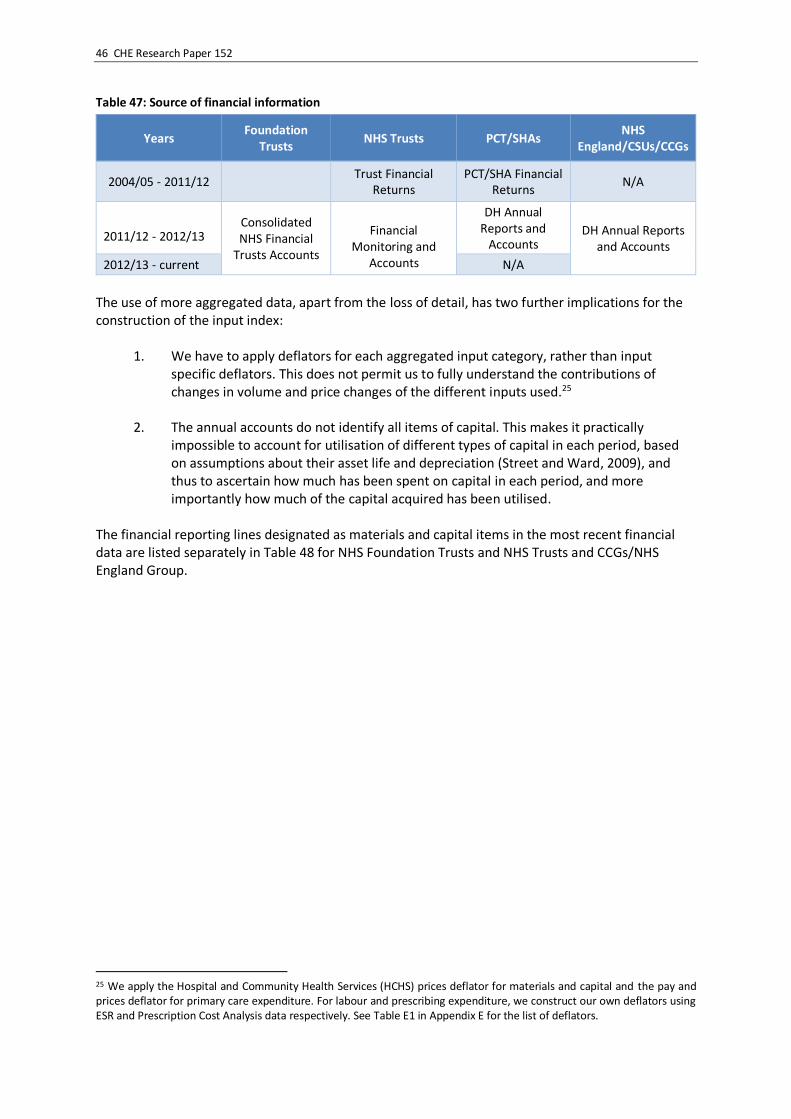
46 CHE Research Paper 152
Table 47: Source of financial information
Years Foundation
Trusts NHS Trusts PCT/SHAs
NHS England/CSUs/CCGs
2004/05 - 2011/12 Trust Financial
Returns PCT/SHA Financial
Returns N/A
2011/12 - 2012/13
Consolidated NHS Financial
Trusts Accounts
Financial
Monitoring and Accounts
DH Annual Reports and
Accounts DH Annual Reports
and Accounts
2012/13 - current N/A
The use of more aggregated data, apart from the loss of detail, has two further implications for the construction of the input index:
1. We have to apply deflators for each aggregated input category, rather than input specific deflators. This does not permit us to fully understand the contributions of changes in volume and price changes of the different inputs used.25
2. The annual accounts do not identify all items of capital. This makes it practically impossible to account for utilisation of different types of capital in each period, based on assumptions about their asset life and depreciation (Street and Ward, 2009), and thus to ascertain how much has been spent on capital in each period, and more importantly how much of the capital acquired has been utilised.
The financial reporting lines designated as materials and capital items in the most recent financial data are listed separately in Table 48 for NHS Foundation Trusts and NHS Trusts and CCGs/NHS England Group.
25 We apply the Hospital and Community Health Services (HCHS) prices deflator for materials and capital and the pay and prices deflator for primary care expenditure. For labour and prescribing expenditure, we construct our own deflators using ESR and Prescription Cost Analysis data respectively. See Table E1 in Appendix E for the list of deflators.

Productivity of the English NHS: 2015/16 update 47
Table 48: Materials and capital items
Organisation Materials Capital
Foundation Trusts and NHS Trusts Source: Financial Monitoring & Accounts, Consolidated NHS Financial Trusts Accounts
Services from Other NHS Trusts Services from PCTs Services from Other NHS Bodies Services from Foundation Trusts Purchase of Healthcare from Non-NHS Bodies Supplies & Services - Clinical Supplies & Services - General Consultancy Services Transport Audit fees Other Auditors Remuneration Clinical Negligence Research & Development (excluding staff costs) Education & Training Establishment Other
Premises Impairments & Reversals of Receivables Inventories write downs Depreciation Amortisation Impairments & Reversals of Property, Plant & Equipment Impairments & Reversals of Intangible Assets Impairments & Reversals of Financial Assets Impairments & Reversals for Non-Current Assets held for sale Impairments & Reversals for Investment Properties
CCGs/NHS England Group Source: DH Annual Report & Accounts
Consultancy Services Transport Clinical Negligence Costs Establishment Education, Training & Conferences Supplies & Services - Clinical Supplies & Services - General Inventories consumed Research & Development Expenditure Other
Premises Impairment of Receivables Rentals under operating leases Depreciation Amortisation Impairments & reversals Interest Charges
3.2.1 Input use derived from expenditure data
Table 49 presents expenditure data reported by PCTs, CCGs and NHS England Group. PCTs officially ceased to exist in 2013/14; their activity was partly taken over by CCGs, as well as by CSUs and NHS England, together forming the NHS England Group. Between 2014/15 and 2015/16 we observe a large increase in the expenditure associated with Materials, and more specifically with the item ‘Supplies & Services – General’, which experienced a growth equal to 86.21%.

48 CHE Research Paper 152
Table 49: Current expenditure by PCTs and NHS England Group, (£000)
Organisation Year Labour Materials Capital
PCTs
2007/08 6,701,228 2,617,114 1,174,841
2008/09 7,478,953 2,526,610 1,247,997
2009/10 8,230,341 2,623,459 1,703,974
2010/11 7,175,399 2,638,638 1,171,813
2011/12 2,328,314 2,052,029 892,604
2011/12* 2,358,373 860,860 1,721,795
2012/13* 1,938,770 885,265 1,814,809
NHS England Group
2013/14* 1,529,067 1,420,027 696,400
2014/15* 1,726,006 1,457,798 536,383
2015/16* 1,741,655 1,960,006 502,897
* Data up to 2010/11 are taken from Financial Returns and from 2011/12 onwards from DH Annual Report and Accounts. Material and capital items are identified differently in each source.
Table 50 shows the expenditure for labour, materials and capital for hospital Trusts. In current terms, labour expenditure increased by 2.87% between 2014/15 and 2015/16. We also observe a large increase in spend on materials of 9.68%, whilst capital spend decreased by -1.4% between 2014/15 and 2015/16. Table 50: Current expenditure by hospital Trusts (£000)
Year Labour Materials Capital
2007/08 30,884,556 10,140,836 6,452,630
2008/09 33,435,219 11,322,441 6,340,019
2009/10 35,983,781 12,115,273 6,529,977
2010/11 38,222,951 12,961,217 6,839,898
2011/12 42,647,889 14,941,588 7,278,435
2011/12* 42,701,684 17,477,370 12,097,485
2012/13* 43,797,935 19,681,855 12,377,259
2013/14* 45,360,562 21,108,612 13,217,703
2014/15* 46,847,155 21,983,076 12,747,384
2015/16* 48,193,902 24,110,377 12,569,351
* For NHS Trusts, data up to 2011/12 are derived from Financial Returns; for 2011/12 and following years data are derived from Financial Monitoring and Accounts. Material and capital items are identified differently in each source.
The use of agency staff is subject to considerable year-on-year variation, as shown in Figure 12. The increase of 10.7% between 2014/15 and 2015/16 will contribute to increased overall input growth.

Productivity of the English NHS: 2015/16 update 49
Figure 12: Trends in use of agency staff
Table 51 presents current expenditures for the whole NHS. From 2013/14 onwards, we do not include spend for DH administration. This is due to the restructuring of the NHS and changes to the DH responsibilities. Table 52 shows the share of expenditure by setting for the years 2014/15 and 2015/16. Table 51: Total NHS current expenditure (£000)
Year NHS Staff Agency Material Capital Prescribing Primary
Care DH
Admin TOTAL
2004/05 31,334,252 1,557,282 8,757,990 5,115,514 8,094,175 9,569,836 278,000 64,707,050
2005/06 33,926,746 1,459,936 10,271,344 5,839,664 8,013,483 11,162,141 262,000 70,935,314
2006/07 35,177,509 1,185,244 11,378,727 6,568,363 8,250,324 11,209,422 229,000 73,998,589
2007/08 36,561,167 1,207,654 13,036,200 7,784,592 8,303,501 11,697,639 226,000 78,816,753
2008/09 39,264,185 1,895,423 13,991,803 7,426,031 8,376,264 12,074,672 242,958 83,271,336
2009/10 42,104,673 2,302,578 14,911,074 7,635,390 8,621,421 12,683,418 241,608 88,500,162
2010/11 43,513,839 2,127,889 16,077,609 8,025,361 8,880,735 12,962,081 212,245 91,799,759
2011/12 43,360,622 1,872,598 17,221,673 8,265,079 8,777,965 13,250,874 453,000 93,201,811
2011/12* 43,457,477 1,862,385 19,154,991 13,892,358 8,777,965 13,250,874 453,000 100,849,049
2012/13* 43,654,591 2,345,552 21,442,537 14,273,017 8,397,492 13,419,803 457,000 103,989,992
2013/14* 44,310,698 2,578,931 22,528,639 13,914,103 8,540,424 13,294,670 n/a 105,167,465
2013/14** 8,703,170 105,330,221
2014/15** 45,239,355 3,333,806 23,440,874 13,283,767 8,942,734 13,460,552 n/a 107,701,088
2015/16** 46,233,148 3,702,409 26,070,383 13,072,248 9,288,425 13,759,292 n/a 112,125,905
*For NHS Trusts, data from prior to 2011/12 from Financial Returns and from 2011/12 onwards data from Financial Monitoring and Accounts. Agency costs, material and capital items are identified differently in each source. ** In February 2017, NHS Digital released a new set of prescribing data to include previously omitted drug codes. The 2013/14 and 2014/15 expenditure figure for prescribing are based on the new data.
0
500,000
1,000,000
1,500,000
2,000,000
2,500,000
3,000,000
3,500,000
4,000,000
Agency - old source Agency -new source

50 CHE Research Paper 152
Table 52 Share of expenditure by setting (in £M)
2014/15 2015/16
Current expenditure
Share Current
expenditure Share
NHS Staff 45,239 42.0% 46,233 41.2%
Agency Staff 3,334 3.1% 3,702 3.3%
Materials 23,441 21.8% 26,070 23.3%
Capital 13,284 12.3% 13,072 11.7%
Primary care 13,460 12.5% 13,759 12.3%
Prescribing 8,943 8.3% 9,288 8.3%
Total 107,701 112,124
Input growth
Our measures of input growth are reported in Table 53, differentiated according to the use of the mixed or indirect index. For 2014/15 – 2015/16 the mixed index suggests a growth rate of 2.59%, whilst the indirect index suggests that an input growth rate of 2.82%. This implies that growth in labour inputs between 2014/15 and 2015/16 is greater if using expenditure data rather than ESR data. Table 53: Input growth
Years All NHS
Mixed Indirect
2004/05 – 2005/06
7.19% 7.10%
2005/06 – 2006/07
1.92% 1.36%
2006/07 – 2007/08
3.88% 3.70%
2007/08 – 2008/09
4.23% 4.24%
2008/09 – 2009/10
5.43% 5.83%
2009/10 – 2010/11
1.33% 0.80%
2010/11 – 2011/12
1.00% 0.75%
2011/12 – 2012/13
1.98% 2.63%
2012/12 – 2013/14
0.43% 0.55%
2013/14 – 2014/15
1.94% 1.52%
2014/15 – 2015/16
2.59% 2.82%

Productivity of the English NHS: 2015/16 update 51
4. Productivity growth
Year-on-year productivity growth figures over the pair of years from 2004/05 – 2015/16 are provided in Table 54. These figures are constructed by comparing the quality-adjusted output growth rate, as reported in the final column of Table 41, with the estimates of mixed and indirect input growth, as reported in Table 53. Productivity growth between 2014/15and 2015/16 is estimated to have been -0.19% based on the mixed method, and 0.04 % based on the indirect method. Table 54: Quality-adjusted productivity growth year-on-year
Years All NHS
Mixed Indirect
2004/05 – 2005/06 -0.07% 0.01%
2005/06 – 2006/07 4.50% 5.07%
2006/07 – 2007/08 -0.21% -0.04%
2007/08 – 2008/09 1.44% 1.43%
2008/09 – 2009/10 -1.25% -1.63%
2009/10 – 2010/11 3.21% 3.74%
2010/11 – 2011/12 2.13% 2.38%
2011/12 – 2012/13 0.36% -0.28%
2012/13 – 2013/14 2.20% 2.07% 2013/14 – 2014/15 0.53% 0.95%
2014/15 – 2015/16 0.04% -0.19%
As can be observed in figure 13, both input and output year-on-year growth rates have increased between 2014/15 and 2015/16, which will result in a close to zero productivity growth.
Figure 13: Input and Output growth
Finally, Figure 14 shows the trend in the NHS Output, Input and Productivity indices from the start of the most recent time series. NHS Outputs and Inputs have both increased since 2004/05, with NHS Outputs increasing by over 5% over the whole period, and NHS inputs only just under 4%.
0.00%
1.00%
2.00%
3.00%
4.00%
5.00%
6.00%
7.00%
8.00%
Input growth Output growth

52 CHE Research Paper 152
Figure 14: Trends in input, output and productivity indices
The increasing productivity growth that we observe in the NHS over time is not observed in the rest of the economy. Productivity is measured somewhat differently according to the nature of the data available for each sector of the economy, but the measures are otherwise equivalent. The main measure produced by the Office of National Statistics is called Gross Value Added per hour worked,26 which is used to measure the contribution to the economy of each sector in the United Kingdom.27 The rate of NHS productivity growth since 2004/05 compares favourably with that achieved by the economy as a whole. This is shown in the graph below, with NHS productivity growth index outpacing the economy as a whole through the entire period. The recession in 2008/09 is reflected by the notable dip in the two series. Since then, NHS productivity has increased year-on-year, whereas whole economy productivity has been falling or been stable over the same time period, except for the last three financial years, where the productivity for the whole economy has grown at a faster rate than that for the NHS. From 2004/05 total productivity growth was 13.49% for the NHS, compared to only 6.04% in the whole economy.
26 http://www.ons.gov.uk/ons/guide-method/method-quality/specific/economy/national-accounts/gva/relationship-gva-and-gdp/gross-value-added-and-gross-domestic-product.html 27http://www.ons.gov.uk/employmentandlabourmarket/peopleinwork/labourproductivity/datasets/labourproductivitytables110andr1
90
100
110
120
130
140
150
160
Inputs Outputs Productivty

Productivity of the English NHS: 2015/16 update 53
Figure 15: Comparison of productivity indices: NHS vs Whole Economy
90
95
100
105
110
115
NHS Whole Economy

54 CHE Research Paper 152
5. Conclusions
Total NHS productivity growth between 2014/15 and 2015/16 amounted to 0.04%, according to our preferred mixed method and to -0.19% according to the indirect method. Quality-adjusted output growth between 2014/15 and 2015/16 amounted to 2.63% for the NHS as a whole, which is slightly higher than last year (2.49%), but lower than the average over the whole period (4.08 %). We observe positive growth across all settings, with the exception of Primary Care, Community Mental Health, Ophthalmology, Diagnostic Tests and Rehabilitation. Growth was substantial in both inpatient and outpatient settings, amounting to 5.08% and 3.72% respectively. We also observe high growth in the A&E attendances (3.33%) as well as across most of RC categories. Quality of care is captured only for hospital inpatient activity by measuring changes in survival following hospital admission, health status, life expectancy and waiting times, and for primary care activity by changes in blood pressure monitoring of patients with either a Coronary Heart Disease, Stroke or Hypertension. There were improvements in most of the quality measures for hospital inpatient activity other than waiting times. The quality of primary care has deteriorated between 2014/15 and 2015/16, with higher prevalence for Stroke and Hypertension amongst the patient population and lower QOF achievements for stroke, hypertension and chronic heart disease. Overall, however, the net effect is an improvement in quality between 2014/15 and 2015/16, which increases the output index by 0.47% over the simple cost-weighted output index. Our indirect measure of input growth is 2.82% between 2014/15 and 2015/16 and our mixed measure (using the direct measure of labour) is 2.59%. Our usual base case measure uses the mixed method, as it is appropriate to use direct measures of input whenever possible. In addition to our usual whole-NHS measurement, we include a measurement for Trusts. The full results are reported in Appendix F. Between 2014/15 and 2015/16 NHS Trusts had output growth of 3.38% and mixed input growth of 2.40%; hence productivity growth of Trusts is 0.96% between these two years. In order to meet the challenge of reduced real increases in resources, the NHS has been set the target of increasing productivity by 2-3% a year (NHS England, 2014). Our previous reports have shown that this target is ambitious because the average increase since 2004/05 has been 1.17%. This latest report indicates that the NHS had zero productivity growth over the last year. To catch up with the 2-3% target, it implies having to find unprecedented productivity gains. Establishing the reasons for the stagnation in NHS productivity is beyond the remit of this report. However, our findings suggest that the target growth in productivity of 2-3% may soon unattainable. There may thus need to be a reassessment of what the realistic funding needs of the NHS are, going forward.

Productivity of the English NHS: 2015/16 update 55
6. References
ATKINSON, T. 2010. Measuring Health Output, Productivity and Equity, London, Office of Health Economics.
BERWICK, D. 2013. A promise to learn – a commitment to act. Improving the safety of patients in England. Department of Health.
BOJKE, C., CASTELLI, A., GOUDIE, R., STREET, A. & WARD, P. 2012. Productivity of the English National Health Service 2003-4 to 2009-10, York, Centre for Health Economics Research Paper 76, University of York
BOJKE, C., CASTELLI, A., GRAŠIČ, K., HOWDON, D., RODRIGUEZ SANTANA, I. & STREET, A. 2017. Productivity of the English NHS: 2014/15 update. CHE Research Paper 146
York: Centre for Health Economics, University of York. BOJKE, C., CASTELLI, A., GRAŠIČ, K., HOWDON, D. & STREET, A. 2016a. Productivity of the English NHS:
2013/14 update, York, Centre for Health Economics Research Paper 126, University of York BOJKE, C., CASTELLI, A., GRAŠIČ, K. & STREET, A. 2014. Productivity of the English National Health
Service from 2004/5: updated to 2011/12, York, Centre for Health Economics Research Paper 94, University of York
BOJKE, C., CASTELLI, A., GRAŠIČ, K. & STREET, A. 2015. Productivity of the English NHS: 2012/13 update, York, Centre for Health Economics Research Paper 110, University of York
BOJKE, C., CASTELLI, A., GRAŠIČ, K. & STREET, A. 2016b. Productivity growth in the English National Health Service from 1998/1999 to 2013/2014. Health Economics DOI: 10.1002/hec.3338.
BOJKE, C., CASTELLI, A., GRAŠIČ, K., STREET, A. & WARD, P. 2013. Productivity of the English National Health Service 2004/5 to 2010/11, York, Centre for Health Economics Research Paper 87, University of York
CASTELLI, A., DAWSON, D., GRAVELLE, H., JACOBS, R., KIND, P., LOVERIDGE, P., MARTIN, S., O'MAHONY, M., STEVENS, P., STOKES, L., STREET, A. & WEALE, M. 2007. A new approach to measuring health system output and productivity. National Institute Economic Review, 200, 105-117.
CASTELLI, A., LAUDICELLA, M. & STREET, A. 2008. Measuring NHS output growth, York, Centre for Health Economics research paper 43.
CASTELLI, A., LAUDICELLA, M., STREET, A. & WARD, P. 2011. Getting out what we put in: productivity of the English National Health Service. Health Economics, Policy and Law, 6, 313-335
DAIDONE, S. & STREET, A. 2011. Estimating the costs of specialised care, York, Centre for Health Economics research paper 61.
DELOITTE 2014. Under pressure: the funding of patient care in general practice http://www.rcgp.org.uk/campaign-home/~/media/Files/PPF/Deloitte%20Report_Under%20Pressure.ashx, London, Deloitte LLP.
DEPARTMENT OF HEALTH 2012. Reference Costs 2011-12, Leeds, NHS Information Centre. DEPARTMENT OF HEALTH 2015. Reference Costs 2014-15, Leeds, Department of Health. DEPARTMENT OF HEALTH AND SOCIAL CARE 2016. NHS reference costs 2015 to 2016.
https://www.gov.uk/government/publications/nhs-reference-costs-2015-to-2016: Department of Health and Social Care
DERBYSHIRE, K., ZERDEVAS, P., UNSWORTH, R. & HASLAM, M. 2007. Further developments in
measuring quality adjusted healthcare output, Leeds, Department of Health. DIEWERT, W. E., BALK, B. M., FIXLER, D., FOX, K. J. & NAKAMURA, A. O. 2010. Price and Productivity
Measurement: Volume 6 -- Index Number Theory, Trafford Press. EUROSTAT 2001. Handbook on price and volume measures in national accounts, Luxembourg: Office
for Official Publications of the European Communities.
56 CHE Research Paper 152
FENTY, J., COUPLAND, C., HIPPISLEY-COX, J. & GRAVELLE, H. 2006. Determinants of consultation rates over time: Implications for estimating the national volume of consultations. , Nottingham, QRESEARCH University of Nottingham.
FRANCIS, R. 2013. The Mid Staffordshire NHS Foundation Trust Public Inquiry. House of Commons. HIPPISLEY-COX, J. & VINOGRADOVA, Y. 2009. Trends in Consultation Rates in General Practice 1995 to
2008: Analysis of the QResearch® database. http://www.ic.nhs.uk/webfiles/publications/gp/Trends_in_Consultation_Rates_in_General_Practice_1995_2008.pdf, Nottingham, University of Nottingham.
KEOGH, B. 2013. Review into the quality of care and treatment provided by 14 hospital trusts in England: overview report. London: National Health Service.
NHS ENGLAND 2014. Five year forward view, London, NHS England. OECD 2001. OECD Productivity Manual: a guide to the measurement of industry-level and aggregate
productivity growth. Paris: Organisation for Economic Cooperation and Development. STREET, A. & WARD, P. 2009. NHS Input and Productivity Growth 2003/4 - 2007/8, York, Centre for
Health Economics research paper 47.

Productivity of the English NHS: 2015/16 update 57
Appendix A
Technical details
In calculating productivity growth for the health care system, it is necessary to combine the multitude of outputs and inputs into single measures for both outputs and inputs. This requires the construction of an output growth index (𝑋) and an input growth index (𝑍), with total factor productivity growth ∆𝑇𝐹𝑃 calculated by comparing growth in outputs with growth in inputs such that:
∆𝑇𝐹𝑃 = [𝑋/𝑍] − 1 (A1) In order to estimate total factor productivity, it is necessary to correctly define and measure the output and input indices. Output growth
Quantification of health care output is a challenge because patients have varied health care requirements and receive very different packages of care. To address this, it is necessary to classify patients into reasonably homogenous output groupings, such as Healthcare Resource Groups (HRGs) or Reference Cost (RC) categories. Furthermore, in order to aggregate these diverse outputs into a single index, some means of assessing their relative value is required. Usually prices are used to assess value, but prices are not available for the vast majority of NHS services for which people do not have to pay at point of use. In common with the treatment of other non-market sectors of the economy in the national accounts, costs are used to indicate the value of health services. Costs reflect producer rather than consumer valuations of outputs, but have the advantage of being readily available. As costs are not believed to truly reflect consumers’ valuations, Atkinson suggests supplementing costs with information about the quality of non-market goods and services (Atkinson, 2010). One way of doing this is by adding a scalar to the output index that captures changes over time in different dimensions of quality (Castelli et al., 2007). Thus, following Castelli et al. (2007), the output growth index (in its Laspeyres form) can be calculated across two time periods as:
𝑋(0,𝑡)𝑐𝑞 =
∑ 𝑥𝑗𝑡𝑐𝑗0[𝑣𝑗0𝑞𝑗𝑡
𝑞𝑗0]
𝐽𝑗=1
∑ 𝑥𝑗0𝑐𝑗0𝐽𝑗=1
(A2)
We define 𝑥𝑗 as the number of patients who have output type j, where j=1…J; 𝑐𝑗𝑜 indicates the cost
of output j; 𝑞𝑗 represents a unit of quality for output j, and 𝑣𝑗 is the value of this unit of quality; and
t indicates time with 0 indicating the first period of the time series. Our measures of quality include inpatient and outpatient waiting times, health improvements (limited to four conditions), survival rates following hospitalisation, and blood pressure management in primary care. Input growth
Turning to the input growth index (𝑍), inputs into the health care system consist of labour, material goods and capital. Growth in the use of these factors of production can be calculated directly or indirectly (OECD, 2001). A direct measure of input growth can be calculated when data on the volume and price of inputs are available. In its Laspeyres form, the input growth index can be calculated as:
𝑍(0,𝑡)𝐷 =
∑ 𝑧𝑛𝑡𝜔𝑛0𝑁𝑛=1
∑ 𝑧𝑛0𝜔𝑛0𝑁𝑛=1
(A3)

58 CHE Research Paper 152
Where 𝑧𝑛𝑡 is the volume of input of type n at time t and 𝜔𝑛𝑡 is the price of input type n at time t. However, data about the volume of inputs are rarely available. It is, therefore, common practice to calculate input growth using expenditure data. Changes in expenditure are driven by both changes in the volume of resource use and in prices. Hence to isolate the volume effect, it is necessary to wash out price changes by converting ‘current’ monetary values into ‘constant’ expenditure using a deflator 𝜋𝑛𝑡 . This deflator reflects the underlying trend in prices for the input in question, such that 𝜔𝑛𝑡+1 = 𝜋𝑛𝑡𝜔𝑛𝑡 . If expenditure data and deflators are available, the input growth index can be specified as:
𝑍(0,𝑡)𝐼𝑛𝑑 =
∑ 𝜋𝑛𝑡𝐸𝑛𝑡𝑁𝑛=1
∑ 𝐸𝑛0𝑁𝑛=1
=∑ 𝑧𝑛𝑡𝜋𝑛𝑡𝜔𝑛𝑡
𝑁𝑛=1
∑ 𝑧𝑛0𝜔𝑛0𝑁𝑛=1
=∑ 𝑧𝑛𝑡𝜔𝑛0
𝑁𝑛=1
∑ 𝑧𝑛0𝜔𝑛0𝑁𝑛=1
= 𝑍(0,𝑡)𝐷 (A4)
As shown, this is equivalent to using volume data, provided that deflators correctly capture the trend in prices for each input in question. Productivity growth
The above equations show output or input growth over two periods from a base (0) to a current period (t). Usually, there is interest in assessing productivity growth over longer periods of time. We do this by means of a chained index that involves updating weights in every period, thereby making it possible to account for ongoing changes in the composition of the outputs and inputs being measured (Diewert et al., 2010). Using the Laspeyres output index as defined in eq. (A2), a chained output index takes the following form:
𝑋(0,𝑇)𝑐𝑞 =
∑ 𝑥𝑗𝑡𝑐𝑗0[𝑣𝑗0𝑞𝑗𝑡
𝑞𝑗0]
𝐽𝑗=1
∑ 𝑥𝑗0𝑐𝑗0𝐽𝑗=1
× ∑ 𝑥𝑗𝑡+1𝑐𝑗𝑡[
𝑣𝑗𝑡𝑞𝑗𝑡+1
𝑞𝑗𝑡]
𝐽𝑗=1
∑ 𝑥𝑗𝑡𝑐𝑗𝑡𝐽𝑗=1
× ∙∙∙ × ∑ 𝑥𝑗𝑇𝑐𝑗𝑇−1[
𝑣𝑗𝑇𝑞𝑗𝑇
𝑞𝑗𝑇−1]
𝐽𝑗=1
∑ 𝑥𝑗𝑇−1𝑐𝑗𝑇−1𝐽𝑗=1
(A5)
This can be simplified as:
𝑋(0,𝑇)𝑐,𝑞 = 𝑋(0,𝑡)
𝑐,𝑞 × 𝑋(𝑡,𝑡+1)𝑐,𝑞 ×∙∙∙× 𝑋(𝑇−1,𝑇)
𝑐,𝑞 (A6)
where each link is represented by eq. (A2) for the relevant two consecutive years. An analogous construction applies to the chained input index.

Productivity of the English NHS: 2015/16 update 59
Appendix B
Independent sector providers (non-NHS bodies): output, input and sensitivity analysis, 2014/15 – 2015/16
NHS Trusts and NHS Foundation Trusts sub-contract services to the independent sector. They do so for a number of reasons, the most common being the inability to meet capacity requirements (DH, 2016). Reference Costs data for non-NHS providers do not capture, as far as we are aware, services directly sub-contracted by either NHS England and/or by Clinical Commissioning Groups (CCGs). Up until 2011/12, the Reference Costs data collection included information on the total volume and unit costs of NHS activity contracted out to the independent sector (non-NHS bodies). This series was discontinued until 2014/15 when NHS Improvement and NHS England re-mandated the collection and publication of the costs and the activity of the services sub-contracted out. Unit costs and activity provided by non-NHS bodies continued in 2015/16. The availability of activity and cost data for two consecutive years allows us to calculate the growth in NHS output sub-contracted to and provided by non-NHS bodies. However, since the collection of these data is still new, the DH warns that “it is difficult to be assured that the quality or consistency of the data will be consistent over the two years, making comparisons less meaningful.” (Department of Health and Social Care, 2016) Another caveat to keep in mind is that the unit costs associated with services which are contracted out are not “[…] the same as the cost(s) of a provider delivering activity itself with the difference varying on a case by case basis depending on local arrangements.”(Department of Health and Social Care, 2016). With these two caveats in mind, Table B1: Volume and value of activity provided by non-NHS bodies, 2014/15 and 2015/16 shows the total volume and value of activity (both in current and constant terms) sub-contracted to non-NHS bodies in 2014/15 and 2015/16, for all services (see Box B1B1 for the full list of health care settings) provided but excluding inpatient activity. The latter is already covered in the national NHS output series as we derive the information on inpatient activity from the HES database. Table B1: Volume and value of activity provided by non-NHS bodies, 2014/15 and 2015/16
Year Volume of
activity Value of activity
(current)
Value of activity (constant costs – base year, with
correction for high and low cost outliers)
2014/15 3,712,158 74,254,313 73,761,799
2015/16 4,490,166 147,782,944 152,261,233
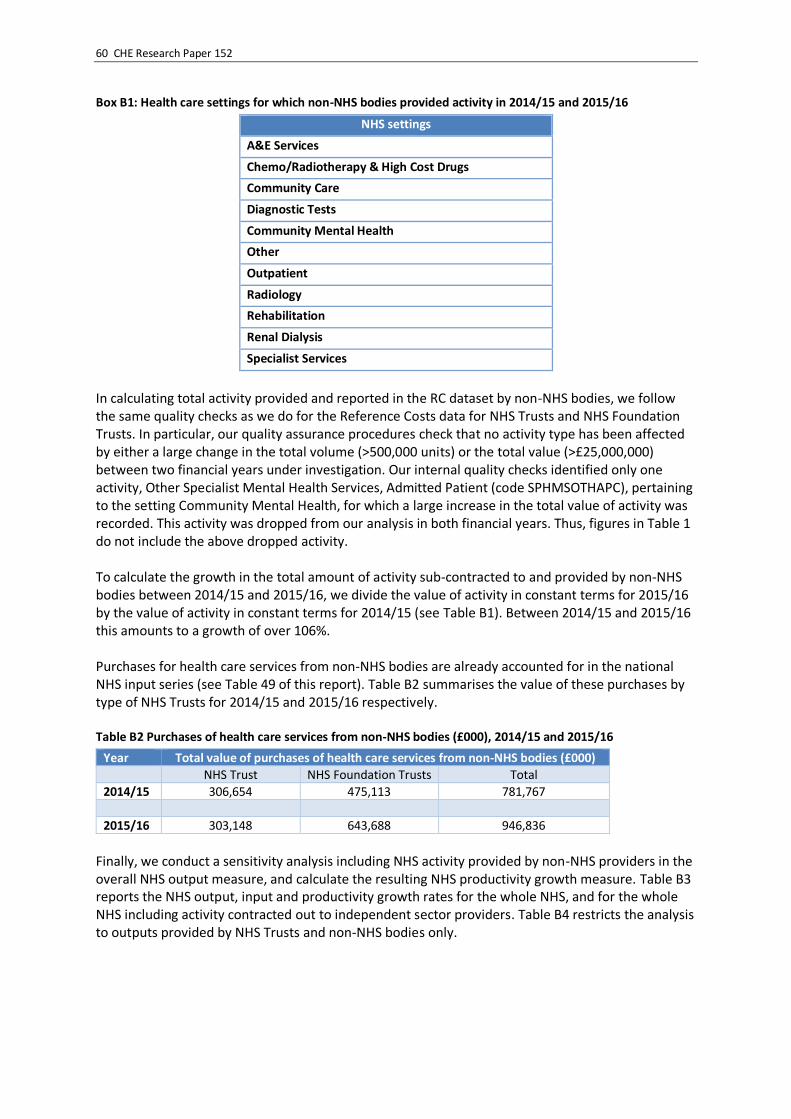
60 CHE Research Paper 152
Box B1: Health care settings for which non-NHS bodies provided activity in 2014/15 and 2015/16
NHS settings
A&E Services
Chemo/Radiotherapy & High Cost Drugs
Community Care
Diagnostic Tests
Community Mental Health
Other
Outpatient
Radiology
Rehabilitation
Renal Dialysis
Specialist Services
In calculating total activity provided and reported in the RC dataset by non-NHS bodies, we follow the same quality checks as we do for the Reference Costs data for NHS Trusts and NHS Foundation Trusts. In particular, our quality assurance procedures check that no activity type has been affected by either a large change in the total volume (>500,000 units) or the total value (>£25,000,000) between two financial years under investigation. Our internal quality checks identified only one activity, Other Specialist Mental Health Services, Admitted Patient (code SPHMSOTHAPC), pertaining to the setting Community Mental Health, for which a large increase in the total value of activity was recorded. This activity was dropped from our analysis in both financial years. Thus, figures in Table 1 do not include the above dropped activity. To calculate the growth in the total amount of activity sub-contracted to and provided by non-NHS bodies between 2014/15 and 2015/16, we divide the value of activity in constant terms for 2015/16 by the value of activity in constant terms for 2014/15 (see Table B1). Between 2014/15 and 2015/16 this amounts to a growth of over 106%. Purchases for health care services from non-NHS bodies are already accounted for in the national NHS input series (see Table 49 of this report). Table B2 summarises the value of these purchases by type of NHS Trusts for 2014/15 and 2015/16 respectively. Table B2 Purchases of health care services from non-NHS bodies (£000), 2014/15 and 2015/16
Year Total value of purchases of health care services from non-NHS bodies (£000)
NHS Trust NHS Foundation Trusts Total
2014/15 306,654 475,113 781,767
2015/16 303,148 643,688 946,836
Finally, we conduct a sensitivity analysis including NHS activity provided by non-NHS providers in the overall NHS output measure, and calculate the resulting NHS productivity growth measure. Table B3 reports the NHS output, input and productivity growth rates for the whole NHS, and for the whole NHS including activity contracted out to independent sector providers. Table B4 restricts the analysis to outputs provided by NHS Trusts and non-NHS bodies only.
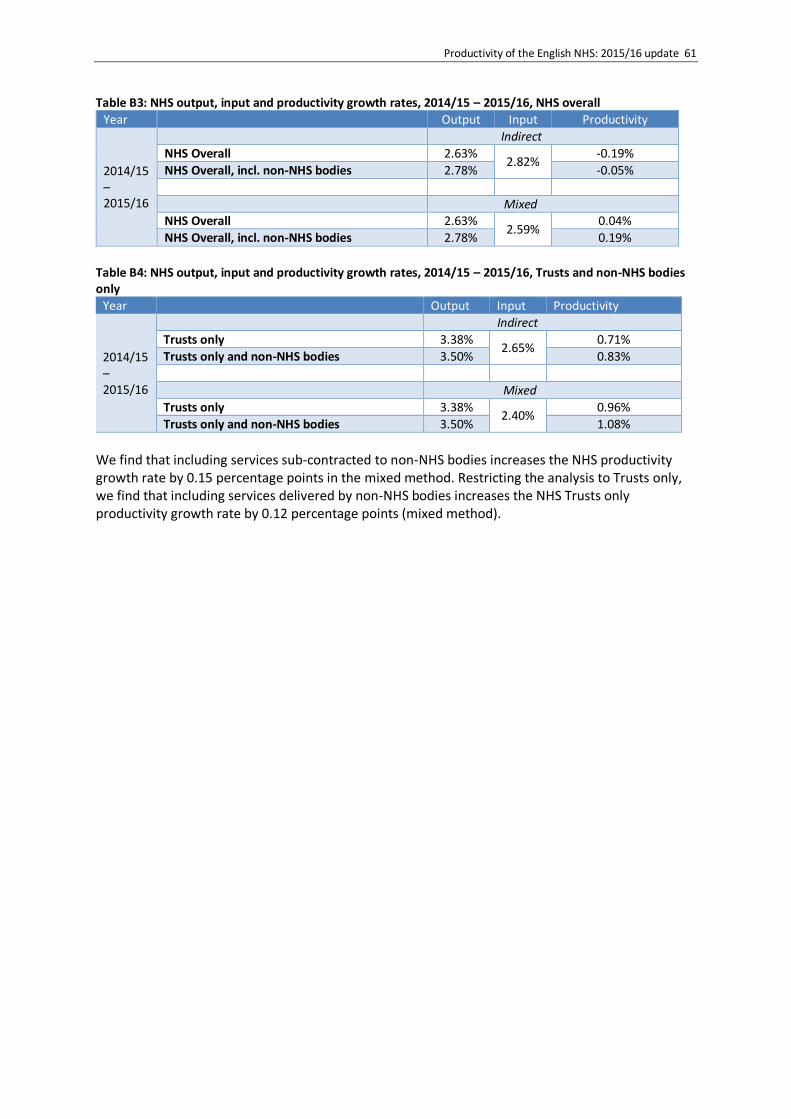
Productivity of the English NHS: 2015/16 update 61
Table B3: NHS output, input and productivity growth rates, 2014/15 – 2015/16, NHS overall
Year Output Input Productivity
2014/15 – 2015/16
Indirect
NHS Overall 2.63% 2.82%
-0.19%
NHS Overall, incl. non-NHS bodies 2.78% -0.05%
Mixed NHS Overall 2.63%
2.59% 0.04%
NHS Overall, incl. non-NHS bodies 2.78% 0.19%
Table B4: NHS output, input and productivity growth rates, 2014/15 – 2015/16, Trusts and non-NHS bodies only
Year Output Input Productivity
2014/15 – 2015/16
Indirect
Trusts only 3.38% 2.65%
0.71%
Trusts only and non-NHS bodies 3.50% 0.83%
Mixed
Trusts only 3.38% 2.40%
0.96%
Trusts only and non-NHS bodies 3.50% 1.08%
We find that including services sub-contracted to non-NHS bodies increases the NHS productivity growth rate by 0.15 percentage points in the mixed method. Restricting the analysis to Trusts only, we find that including services delivered by non-NHS bodies increases the NHS Trusts only productivity growth rate by 0.12 percentage points (mixed method).

62 CHE Research Paper 152
Appendix C
Summary Statistics of Reference Costs data by broad service setting
Table C1: Reference Cost settings, 2012/13 – 2013/14
Setting 2012/13 2013/14
Nr Cat.
Activity Cost (£) Nr Cat.
Activity Cost (£)
A&E and Ambulance Services 89 34,952,786 3,692,014,018 90 35,051,392 3,923,106,579
Chemo/Radiotherapy & High Cost Drugs
317 6,754,603 2,652,051,626 323 6,988,301 2,915,174,231
Community Care 149 79,709,044 4,139,765,181 174 85,975,592 4,864,684,367
Diagnostic Tests 64 342,280,609 941,490,357 72 368,505,992 964,981,062
Community Mental Health 117 260,266,214 6,311,927,307 124 259,659,214 6,410,525,825
Outpatient 6,979 77,222,725 8,546,218,360 8,055 81,699,802 9,275,173,143
Radiology 5,047 9,381,616 859,058,674 136 9,709,456 904,796,391
Rehabilitation 119 2,715,650 817,792,033 113 3,002,512 893,588,640
Renal Dialysis 40 4,135,914 528,076,698 40 4,079,238 533,459,915
Specialist Services 86 4,359,263 2,927,444,066 145 4,699,893 3,030,502,560
Other 3,099 4,763,955 354,760,843 937 3,927,412 309,107,379

Productivity of the English NHS: 2015/16 update 63
Appendix D
Growth in primary care output 2004/05 – 2015/16: an historic series
Introduction
We calculate growth in primary care output in a similar way as for any type of NHS output. This involves constructing a Laspeyres output index for primary care of the form:
𝑋𝑝𝑐 =[∑ 𝑥𝑗𝑡+1𝑐𝑗𝑡]]𝑞𝑗𝑡+1
𝐽𝑗=1
[∑ 𝑥𝑗𝑡𝑐𝑗𝑡]𝐽𝑗=1 𝑞𝑗𝑡
(D1)
Where 𝑥𝑗 captures the national annual volume of primary care activity of type j such as GP surgery
consultations, practice nurse consultations, GP home visits, 𝑐 reflects the cost of each activity, 𝑞 captures the quality of primary care activity, and t indexes time. The main practical challenge in England is to derive information about the volume of each type of 𝑥𝑗 .
Ideally there would be a comprehensive and exhaustive dataset, akin to Hospital Episode Statistics (HES) in the case of secondary care, which routinely captures all activity. Although the data are already being captured by individual practice software management systems, there is no accessible single repository of these nationally. From 2004/05 to 2008/09, we used data from QResearch (QR) as the basis for measuring primary care output (Fenty et al., 2006, Hippisley-Cox and Vinogradova, 2009), this representing a major data source in understanding primary care activity. The key data from QResearch are: the average number of consultations per person-year over time; the distribution of consultation rates across the population by five year age and gender bands; and the distribution of consultations by staff type and by location. The problem is that QResearch data were last reported for 2008/09. With QResearch data no longer being available, and there being no alternative source of the volume of primary consultations, it has been necessary to estimate the growth in primary care output, taking 2008/09 as the baseline. There are three key elements to this process, which involve taking account of annual changes in the following:
1. Frequency of primary care contacts 2. Size and composition of the population 3. Quality of primary care
We have used different sources of information to do this over successive productivity reports, as data sources have changed or as we have refined our methods. In this note, we apply consistent data (insofar as is possible) and a standard methodology to construct an historical series. Establishing the baseline
QResearch published figures by calendar year (2008) and financial year (2008/09)(Hippisley-Cox and Vinogradova, 2009).28 In past productivity reports, we used the calendar year, but here we take the number of consultations reported by QResearch for the 2008/09 financial year (303,900k, rather than 300,400k). This is the baseline used in other estimates of changes in primary care activity, reviewed in Appendix B of our report 146 (Bojke et al., 2017).
28 http://content.digital.nhs.uk/pubs/gpcons95-09

64 CHE Research Paper 152
The QResearch figures are broken down by:
1. type of consultation based on location (surgery, home, phone) and type of contact (GP, practice nurse, other) and
2. five-year age and gender bands, which indicate differences in the propensity to have contact with primary care.
No recent data are available for either breakdown, so both compositional mixes have been assumed unchanged over time. Changes in the frequency of primary care contacts
From 2008/09, we measured the frequency with which people had contact with primary care from annual national surveys. From 2008/09 we used the General Lifestyle Survey (GLS) and, from 2010/2011 onwards, the GP Patient Survey (GPPS) (Bojke et al., 2013). For the purposes of this historic series, we use the GPPS from 2008/09 to 2014/15. From 2009/10 we account for the year-on-year change in the percentage of respondents who reported that they had last seen or spoken to a GP in the preceding three months (using the 2008/09 GPPS responses as a baseline). From 2012/13, we additionally take account of the change in the percentage of respondents saying that they had seen or spoken to a practice nurse in the preceding three months (with the 2011/12 responses as a baseline). Information about contacts with practice nurses had not previously been available. Taken from the GPPS, columns 1 and 2 of Table D1 report the percentages response of visiting a GP or nurse in the preceding three months. We look at the percentage of survey respondents who answered they had seen or spoken to their GP (or practice nurse) in the last three months and compare this to the percentage from the previous year. This indicates how the frequency of primary care contacts has changed from one year to the next. This can be used to uplift the number of consultations in the previous year to the current year. The formulation is as follows:
�̃�𝑗𝑡 = 𝑝𝑡
𝑝𝑡−1�̃�𝑗𝑡−1 (D2)
Here, �̃�𝑗𝑡 is the estimated number of GP or nurse observations of type j in year t and pt is the
proportion of individuals who have seen a GP or nurse in the last three months in year t. The baseline for the number of consultations is 2008/09, this being the last year in which there was a QResearch measure of the number of consultations. As mentioned, we are forced to assume that the mix of consultation types (j) observed by QResearch in 2008/09 has not changed over time. From this baseline GPPS ratios are applied year-by-year to obtain annual estimates of the number of consultations in each subsequent year. The resulting numbers of contacts are reported in column 3 of Table D1. Changes in the size and composition of the population
The GPPS (and other such surveys) indicate how frequently a representative sample of the population has contact with primary care. But there will also be changes in the number of primary care contacts as a result of changes in the size and composition of the population. In our productivity calculations we started to take overall population growth into account in calculating primary care output growth from 2011/12 (Bojke et al., 2015), and took account of composition changes from

Productivity of the English NHS: 2015/16 update 65
2013/14 (Bojke et al., 2017). In constructing this historical series we account for changes in the size and composition of the population since 2008/09 in a consistent fashion. As can be seen in Figure 9, there has been a shift in the age composition of population which is now older. This also implies an increase in the number of consultations, as older people tend to have more consultations in a year. The QResearch data for 2008/09 provided a breakdown of consultation rates by five-year age and gender bands, there being marked differences in the propensity to contact primary care for different population sub-groups. Changes in the size and composition of the population are extrapolated forward from these propensities. For this historical series we account for changes since 2008/09 in the size and composition of the population, using data published by the Office of National Statistics.29 This allows us to derive a population-adjusted estimate of the volume of consultations. The formulation is as follows: 𝑥𝑗𝑡 = �̃�𝑗𝑡𝛿𝑔𝑡 (D3)
Where 𝛿𝑔𝑡 indicates population growth (from a baseline of 2008/09) for each (g=1…G) of the five-
year age/gender groups. The resulting numbers of population-adjusted contacts are reported in column 4 of Table D1. Changes in the quality of primary care
We account for changes in the quality of primary care using data captured as part of the Quality and Outcomes Framework (QOF), under which GPs are rewarded for achieving a range of diverse targets (Derbyshire et al., 2007). If disease management in primary care is improving over time, it suggests this will be reflected in reduced blood pressure for an increasing proportion of patients with Coronary Heart Disease (CHD), Stroke or Hypertension. Hence, primary care consultations are deemed to be 30% more valuable if a blood pressure reading equal or below the target of 150/90 is recorded. To incorporate these aspects of quality into an output index for primary care, information is required about the prevalence rate for each of these three conditions, the QOF success rate, and the value of a consultation where a successful (below target) blood pressure reading is taken relative to other consultations. So, the cost-weighted volume of primary care consultations is weighted upwards if any feature successful blood pressure management, with the quality adjustment for primary care in any particular year being formulated as:
𝑞𝑗𝑡 = 1 + [0.3 ∗ (∑ 𝑃𝑚𝑡𝑆𝑚𝑡3𝑚=1 )] (D4)
Where 𝑚 indexes the three conditions 𝑚 = 1 … 3, 𝑃𝑚 is the prevalence rate for condition 𝑚 and 𝑆𝑚 is the QOF success rate for condition 𝑚. The numbers for prevalence are obtained from Annex 1 of the QOF report.30 Data about success rates are obtained from the Clinical results tables, available in the same report. These data are summarised in Table D2.
Output growth in primary care
The Laspeyres growth rates for primary care based on this historical series are reported in Table D3, while the growth rates reported in previous productivity reports are show in Table D4. Table D5
29 https://www.ons.gov.uk/peoplepopulationandcommunity/populationandmigration/populationprojections 30 http://content.digital.nhs.uk/catalogue/PUB18887

66 CHE Research Paper 152
reports the difference between the two sets of annual growth rates and provides a comment on the reasons for the differences. These reasons are:
The use of QResearch data by financial year (FY) rather than calendar year (CY), as was originally used (Castelli et al., 2008).
The consequent move to using the 2008/09 FY estimate of 303,900k rather than 300,400k as the baseline for future projections.
The use of the GPPS to determine the frequency of primary care contacts – we had used the GLS for 2008/09 and 2009/10 (Bojke et al., 2012).
Use of changes in the size and age-gender composition of the population from 2009/10. In our previous productivity reports, we had performed a crude population adjustment from 2011/12 (Bojke et al., 2015), and an age-gender adjustment from 2013/14 (Bojke et al., 2017).
Inclusion of growth in contacts with practice nurses from 2012/13. Previously these were first introduced from 2013/140 (Bojke et al., 2017).
This series yields an estimate of 325,950k primary care consultations for 2015/16. This is considerably below the estimate for 2015/16 of 384,303k from a series produced by Deloitte (Deloitte, 2014). The Deloitte series should be treated with caution as it appears to be a simple linear trend, constructed by applying a forecast of population growth to the QResearch estimate of 303,900k consultations in 2008/09 (Bojke et al., 2017). Table D1 Growth in the volume of consultations, historical series
Year
Patients who report having seen a GP in previous 3
months
Patients who report having
seen a nurse in previous 3
months
Number of consultations
(000s)
Population adjusted
number of consultations
(000s)
Quality and population
adjusted number of
consultations (000s)
(1) (2) (3) (4) (5)
QR*
2004/05 264,900 273,735
2005/06 283,200 293,842
2006/07 291,500 303,950
2007/08 291,900 304,670
2008/09 303,900 317,476
GPPS with age & gender population adjustment
2009/10 55.15% 303,900 303,900 317,647
2010/11 52.37% 288,589 295,013 308,562
2011/12 54.00% 297,550 307,579 321,826
2012/13 54.83% 302,125 315,947 330,779
Allowing for consultations with a practice nurse
2012/13** 54.83% 35.80% 302,779 316,631 331,495
2013/14 54.28% 35.91% 301,253 318,249 333,484
2014/15 53.38% 35.86% 298,024 318,519 333,842
2015/16 51.47% 34.81% 288,092 311,103 325,950
* Number of consultations from 2004/05 to 2008/09 is taken from: Consultations Report 22 - QRESEARCH financial year consultations 2008/9 (http://www.qresearch.org) ** From 2012/13, the calculation now also includes those who'd seen a primary care nurse.

Productivity of the English NHS: 2015/16 update 67
Table D2: Quality adjustment for primary care (%)
Year Prevalence QOF achievement
CHD Stroke Hypertension CHD Stroke Hypertension
2004/05 3.57 1.63 11.06 78.60 73.13 64.33
2005/06 3.57 1.66 11.48 84.44 81.22 71.05
2006/07 3.54 1.61 12.49 88.86 86.92 77.62
2007/08 3.50 1.63 12.79 89.41 87.55 78.35
2008/09 3.47 1.66 13.13 89.68 87.88 78.56
2009/10 3.44 1.68 13.35 89.77 88.12 78.72
2010/11 3.40 1.71 13.52 90.16 88.58 79.30
2011/12 3.38 1.74 13.63 90.14 88.61 79.65
2012/13 3.40 1.70 13.68 90.57 89.26 80.79
2013/14 3.29 1.72 13.73 91.27 89.84 83.09
2014/15 3.25 1.73 13.79 91.98 88.17 83.61
2015/16 3.20 1.74 13.81 91.89 87.63 82.90
Box D1: Original sources of QOF data (links are not stable)
2003/4-2005/6 http://www.ic.nhs.uk/webfiles/QOF/2006-07/QResearch%202006-70%20QOF/Times%20Series%20Analysis%20for%20Selected%20Clinical%20Indicators%20from%20QOF%202001-2006%20-%20Tables%20%28v1-0%29.xls 2006/7 http://www.ic.nhs.uk/webfiles/QOF/2006-07/National%20QOF%20tables%202006-07%20-%20prevalence.xls 2007/8 http://www.ic.nhs.uk/webfiles/QOF/2007-08/NewFilesGS/National%20QOF%20tables%202007-08%20-%20prevalence.xls 2008/09 http://www.ic.nhs.uk/webfiles/QOF/2008-09/QOF%20Achievement%20and%20Prevalence%20Bulletin%202008-09.pdf 2010/11 http://www.ic.nhs.uk/statistics-and-data-collections/supporting-information/audits-and-performance/the-quality-and-outcomes-framework/qof-2010-11/qof-2010-11-data-tables/qof-prevalence-data-tables-2010-11 2011/12 http://content.digital.nhs.uk/catalogue/PUB08135 2012/13 http://content.digital.nhs.uk/catalogue/PUB12262 2013/14 http://content.digital.nhs.uk/catalogue/PUB15751 2014/15 http://content.digital.nhs.uk/catalogue/PUB18887 2015/16 https://digital.nhs.uk/catalogue/PUB22266

68 CHE Research Paper 152
Table D3: Laspeyres growth rates for primary care – historic series
Years Unadjusted Growth rate
Population adjusted growth rate
Population and quality-adjusted growth rate
2004/05-2005/06 6.91% 7.35%
2005/06-2006/07 2.93% 3.44%
2006/07-2007/08 0.14% 0.24%
2007/08-2008/09 4.11% 4.20%
2008/09-2009/10 0.00% 0.05%
2009/10 - 2010/11 -5.04% -2.92% -2.86%
2010/11 - 2011/12 3.11% 4.26% 4.30%
2011/12 - 2012/13 1.54% 2.72% 2.78%
2012/13 - 2013/14 -0.50% 0.51% 0.60%
2013/14 - 2014/15 -1.07% 0.08% 0.11%
2014/15 - 2015/16 -3.33% -2.33% -2.36%
Table D4: Laspeyres growth rates for primary care - from previous reports
Years Unadjusted Growth rate
Population adjusted growth rate
Population and quality-adjusted growth rate
2004/05-2005/06 6.59% 7.15%
2005/06-2006/07 3.50% 4.01%
2006/07-2007/08 -0.17% -0.07%
2007/08-2008/09 2.70% 2.79%
2008/09-2009/10 0.00% 0.06%
2009/10 - 2010/11 -2.29% NA -3.39%
2010/11 - 2011/12 3.51% NA 4.79%
2011/12 - 2012/13 1.54% 2.39% 2.45%
2012/13 - 2013/14 -1.01% 0.27% 0.37%
2013/14 - 2014/15 -1.07% -0.16% -0.14%
2014/15 - 2015/16 N/A N/A N/A
Source: (Bojke et al., 2017)
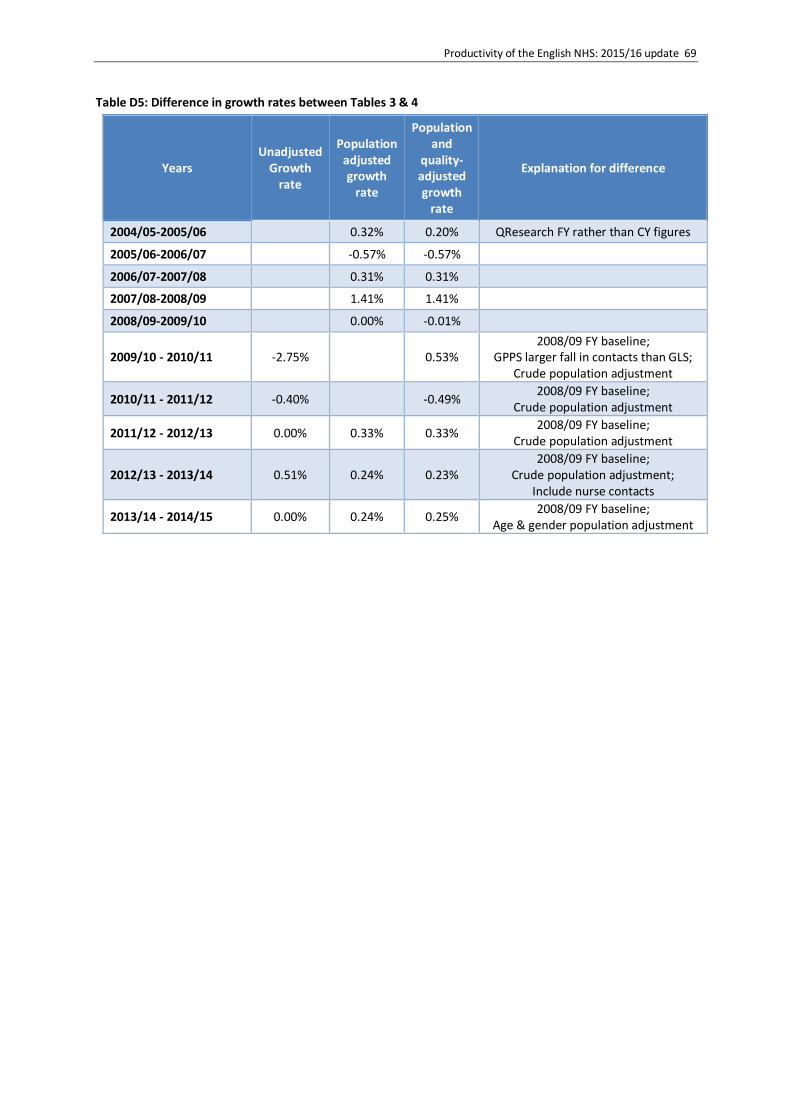
Productivity of the English NHS: 2015/16 update 69
Table D5: Difference in growth rates between Tables 3 & 4
Years Unadjusted
Growth rate
Population adjusted growth
rate
Population and
quality-adjusted growth
rate
Explanation for difference
2004/05-2005/06 0.32% 0.20% QResearch FY rather than CY figures
2005/06-2006/07 -0.57% -0.57%
2006/07-2007/08 0.31% 0.31%
2007/08-2008/09 1.41% 1.41%
2008/09-2009/10 0.00% -0.01%
2009/10 - 2010/11 -2.75% 0.53% 2008/09 FY baseline;
GPPS larger fall in contacts than GLS; Crude population adjustment
2010/11 - 2011/12 -0.40% -0.49% 2008/09 FY baseline;
Crude population adjustment
2011/12 - 2012/13 0.00% 0.33% 0.33% 2008/09 FY baseline;
Crude population adjustment
2012/13 - 2013/14 0.51% 0.24% 0.23% 2008/09 FY baseline;
Crude population adjustment; Include nurse contacts
2013/14 - 2014/15 0.00% 0.24% 0.25% 2008/09 FY baseline;
Age & gender population adjustment

70 CHE Research Paper 152
Appendix E
Deflators
We use various deflators to adjust our expenditure series, as shown in Table E1. We use the Hospital and Community Health Services (HCHS) prices index for deflating the expenditure on capital and material goods. For Primary Care expenditure, we use the HCHS pay and prices deflator, while we construct our own deflator for pharmaceutical expenditure. For labour and agency staff we originally used the HCHS pay deflator. The advent of the Electronic Staff Record data has allowed us to construct our own ESR pay deflator, which we have employed since 2011/12. The HCHS and ESR pay deflators are usually quite similar. Table E1: Deflators
Pay HCHS (ESR)
deflator Prices deflator
Pay and Prices deflator
Pharmaceuticals
2004/05 - 2005/06 4.7% 1.9% 3.7% -9.9%
2005/06 - 2006/07 -1.1% 3.0% 3.7% -3.4%
2006/07 - 2007/08 3.5% 1.8% 2.9% -6.2%
2007/08 - 2008/09 3.0% (3.33%) 5.2% 3.9% -5.2%
2008/09 - 2009/10 1.8% (2.38%) -1.3% 0.6% -3.7%
2009/10 - 2010/11 3.1% (1.19%) 2.8% 3.0% -1.7%
2010/11 - 2011/12 0.9% (2.8%) 4.1% 2.1% -4.4%
2011/12 - 2012/13 0.9% (0.8%) 3.1% 1.7% -7.2%
2012/13 - 2013/14 0.7% (0.5%) 1.8% 1.1% -1.5%
2013/14 - 2014/15 0.3% (0.5%) 1.7% 0.9% -1.31%
2014/15 - 2015/16 0.3% (1.9%) 2.70% 1.32% -0.07%
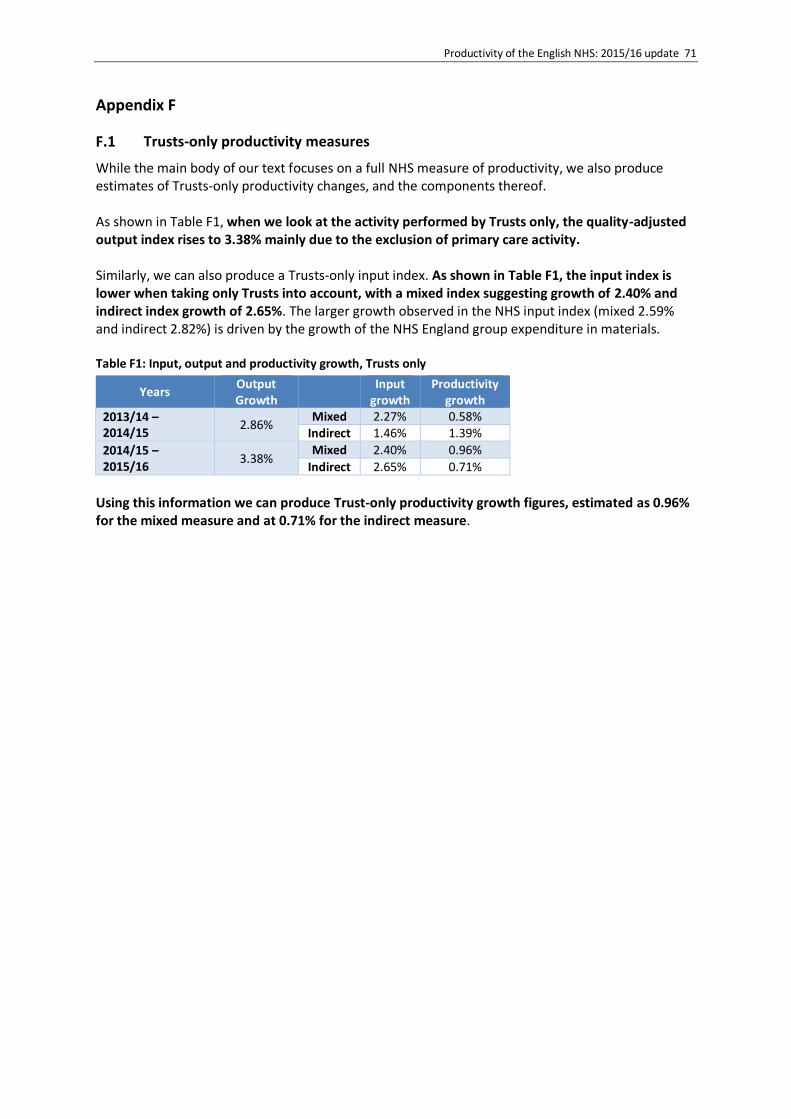
Productivity of the English NHS: 2015/16 update 71
Appendix F
Trusts-only productivity measures
While the main body of our text focuses on a full NHS measure of productivity, we also produce estimates of Trusts-only productivity changes, and the components thereof. As shown in Table F1, when we look at the activity performed by Trusts only, the quality-adjusted output index rises to 3.38% mainly due to the exclusion of primary care activity. Similarly, we can also produce a Trusts-only input index. As shown in Table F1, the input index is lower when taking only Trusts into account, with a mixed index suggesting growth of 2.40% and indirect index growth of 2.65%. The larger growth observed in the NHS input index (mixed 2.59% and indirect 2.82%) is driven by the growth of the NHS England group expenditure in materials. Table F1: Input, output and productivity growth, Trusts only
Years Output Growth
Input
growth Productivity
growth 2013/14 – 2014/15
2.86% Mixed 2.27% 0.58%
Indirect 1.46% 1.39%
2014/15 – 2015/16
3.38% Mixed 2.40% 0.96%
Indirect 2.65% 0.71%
Using this information we can produce Trust-only productivity growth figures, estimated as 0.96% for the mixed measure and at 0.71% for the indirect measure.