product and service quality improvement in …
TRANSCRIPT
Media Ekonomi dan Manajemen, Volume 36 Issue 1, January 2021, 76-88
76 p-ISSN: 0854-1442 (Print) e-ISSN: 2503-4464 (Online)
PRODUCT AND SERVICE QUALITY IMPROVEMENT IN MANUFACTURING:
A STUDY OF OPTICAL LENS MANUFACTURING IN INDONESIA
Refli Simbolon Master of Management Student, Mercubuana University, Jakarta Indonesia
email: [email protected]
Sugeng Santoso
Lecturer of Magister Management Program, Mercubuana University, Jakarta Indonesia
email: [email protected]
Received: October 2020; Accepted: January 2021; Available online: January 2021
Abstract
For optical lens manufacturing continuous improvement of product and service quality is key
in answering challenges in business competition in their field. To achieve this, optical
manufacturing forms a Kaizen work culture that is committed to sustainable development.
The Key Performance Indicator (KPI) specified of the product Rejected Rate is 3.5% and to
On Time Delivery (OTD) of the service is 4 days. Continuous Improvement Kaizen culture
with development methods through value chain analysis applied to achieve KPI targets in this
research succeeded in lowering the Rejected Rate KPI rate by 0.46% and increasing OTD by
2.22%. The method used in this study uses a qualitative approach with a review of literacy
studies, observations and direct interviews to plant managers of one of the largest optical lens
manufacturers in Indonesia using data comparisons in 2018 and 2020 as well as to 100 Store
managers & Optical Stores Customers.
Keywords: product and service quality; continuous improvement of Kaizen; optical lens
manufacturing.
Abstract
Bagi manufaktur lensa optik perbaikan terus-menerus terhadap kualitas produk dan layanan
adalah hal kunci dalam menjawab tantangan dalam persaingan bisnis di bidangnya. Untuk
mencapai hal tersebut manufaktur optik membentuk budaya kerja Kaizen yang berkomitmen
pengembangan berkelanjutan. Key Performance Indikator (KPI) yang ditetapkan dari
Rejected Rate produk adalah 3,5% dan pada On Time Delivery (OTD) dari layanan adalah 4
hari. Pengembangan berkelanjutan sesuai budaya Kaizen dengan metode pengembangan
melalui analisis rantai nilai yang diterapkan guna pencapaian target KPI dalam penelitian
ini berhasil menurunkan angka KPI Rejected Rate sebesar 0.46% dan menaikkan OTD
sebesar 2.22%. Metode yang digunakan dalam penelitian ini menggunakan pendekatan
kualitatif dengan tinjauan studi literasi, observasi dan wawancara langsung terhadap plant
manager salah satu manufaktur lensa optik terbesar di Indonesia dengan menggunakan
perbandingan data tahun 2018 dan tahun 2020 serta kepada 100 Store manajer & pelanggan
toko optik.
Kata kunci: kualitas produk dan layanan; perbaikan terus-menerus dari Kaizen; manufaktur
lensa optik.
How to Cite: Product and Service Quality Improvement in Manufacturing: a Study of Optical Lens Manufacturing in
Indonesia. Media Ekonomi dan Manajemen, 36(1), 76-88. doi: http://dx.doi.org/ 10.24856/mem.v36i1.1726.
Media Ekonomi dan Manajemen, Volume 36 Issue 1, January 2021, 76-88
p-ISSN: 0854-1442 (Print) e-ISSN: 2503-4464 (Online) 77
INTRODUCTION
To have an advantage in competing
in the optical lens industry, optical lens
manufacturing is required to produce
quality lenses in accordance with customer
expectations of what optical staff has
offered on the front line. But it doesn't just
stop there, the length of the work process
becomes added value from the services
offered. Of course, all customers want a
faster range of processing time because
glasses are a very vital aid that as soon as
possible wants to be used.
To produce a lens with good optical
quality requires a good production quality
standard. Each lens manufacturer has a
quality standard which is a shift to
measuring a product to be sent to the
customer or not. To keep product quality
maintained at its standards, the role of
Quality Control (QC) becomes very
important as a decision-maker whether a
product meets quality standards. QC also
plays an important role in continuous
improvement by communicating with each
issue to all relevant departments. Any
product that does not match the standard
must be rejected and restarted from the
beginning this will certainly be related to
operational costs. The failure of the
product will cause the time span of the
work process to be longer, surely this will
cause complaints to the customer and the
optical image ends that sell the lens
product from the manufacturing to be
poorly arranged by the customer and if so
too often, not a few optical companies
move to other optical lens manufacturers.
For these reasons, manufacturing must
always develop the system and its ability
to be able to compete. The improvement of
a manufacturing system is in one business
carried out by the company, in order to be
able to respond to changes that must be
controlled at all times to see market
conditions in the world (Hendri et al,
2020).
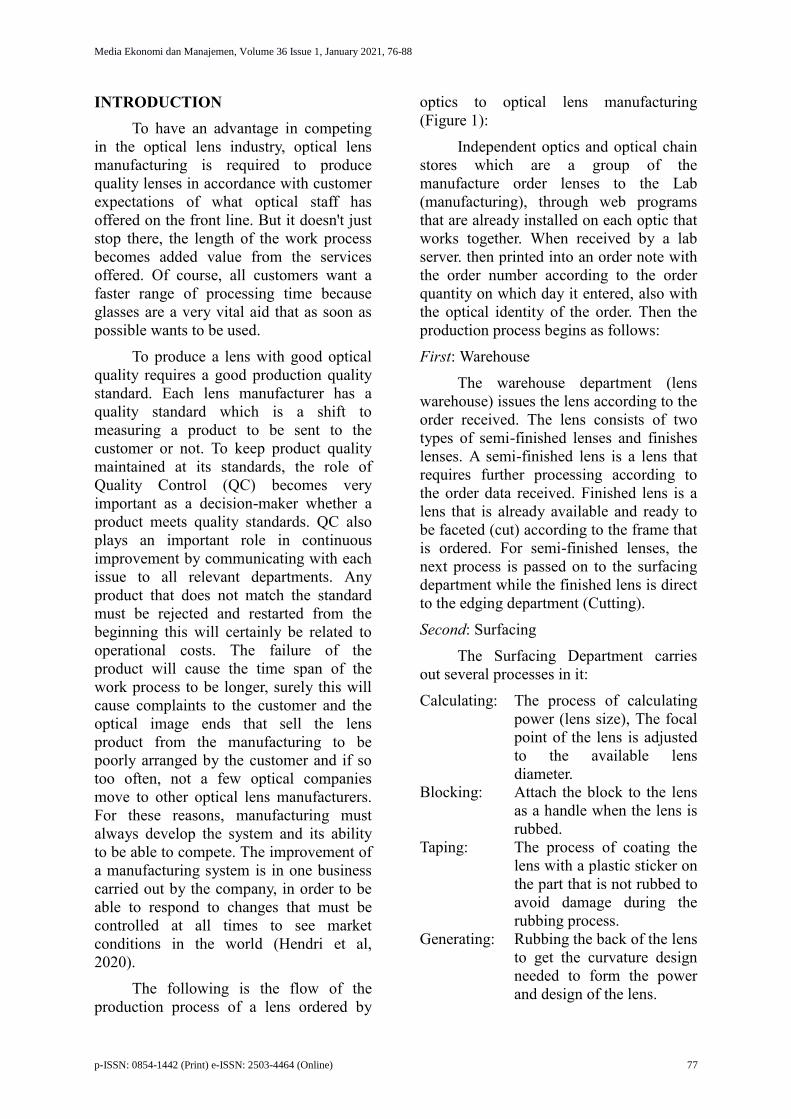
The following is the flow of the
production process of a lens ordered by
optics to optical lens manufacturing
(Figure 1):
Independent optics and optical chain
stores which are a group of the
manufacture order lenses to the Lab
(manufacturing), through web programs
that are already installed on each optic that
works together. When received by a lab
server. then printed into an order note with
the order number according to the order
quantity on which day it entered, also with
the optical identity of the order. Then the
production process begins as follows:
First: Warehouse
The warehouse department (lens
warehouse) issues the lens according to the
order received. The lens consists of two
types of semi-finished lenses and finishes
lenses. A semi-finished lens is a lens that
requires further processing according to
the order data received. Finished lens is a
lens that is already available and ready to
be faceted (cut) according to the frame that
is ordered. For semi-finished lenses, the
next process is passed on to the surfacing
department while the finished lens is direct
to the edging department (Cutting).
Second: Surfacing
The Surfacing Department carries
out several processes in it:
Calculating: The process of calculating
power (lens size), The focal
point of the lens is adjusted
to the available lens
diameter.
Blocking: Attach the block to the lens
as a handle when the lens is
rubbed.
Taping: The process of coating the
lens with a plastic sticker on
the part that is not rubbed to
avoid damage during the
rubbing process.
Generating: Rubbing the back of the lens
to get the curvature design
needed to form the power
and design of the lens.
Media Ekonomi dan Manajemen, Volume 36 Issue 1, January 2021, 76-88
78 p-ISSN: 0854-1442 (Print) e-ISSN: 2503-4464 (Online)
Engraving: The process of marking the
lens according to the brand
and type of lens using a
laser beam.
Polish: The process of cleaning the
lens from the remnants of
the material that is still
attached.
Deblocking: The process of removing
blocks mounted on the lens.
Third: Quality Control 1
QC1 is tasked with examining the
work of the surf department, whether it is
appropriate to continue the subsequent
provisions of the Coating. If the production
results do not meet the eating standard the
process is stopped and repeated from the
beginning again.
Fourth: Coating
Department Coating (layer) performs
several stages of the process:
Precleaning: Cleaning the lens before it is
cooked into a coating
machine.
Hardcoat: Coats the lens with a
hardcoat coating that
functions so that the lens
becomes more slippery and
becomes more scratch
resistant.
Multicoat: Coat lenses with various
layers (Coating) that comply
with lens specifications and
special orders.
Fifth: Quality Control 2
QC2 is tasked with examining the
work of the coating department, whether it
is appropriate to continue the subsequent
provisions of the edging. If the production
results do not meet the eating standard the
process is stopped and repeated from the
beginning again.
Sixth: Edging
The edging department cuts the lens
according to the frame order data received.
Seventh: Quality Control 3
QC3 is tasked with examining the
work of the Edging department, whether it
is appropriate to pass further provisions
namely packaging and shipping to optical
ordering. If the production results do not
meet the standard, then the process is
stopped and repeated from the beginning
again.
LITERATURE REVIEW
Product and Service Quality
Product quality is the characteristic
of a product or service that bear on its
ability to satisfy stated or implied customer
needs (Kotler & Amstrong, 2012). Ehsani
and Ehsani (2015), said that quality of
product is the customer's perception of the
overall quality or superiority of the product
or service, with respect to its intended
purpose, relative to alternatives. Garvin’s
eight dimensions of Product Quality in
Performance, Features, Reliability,
Conformance, Durability, Serviceability,
Aesthetics and Perceived quality are
dimensions of Product Quality that affect
Customer Satisfaction which impacts
Loyalty (Hoe & Mansori, 2018).
Definition of service quality
according to Tjiptono (2007), as an effort
to meet the needs and desires of consumers
and the accuracy of shipping in balancing
consumer expectations. service quality
dimensions are significant predictors of
customer satisfaction and loyalty with the
commitment dimension accounting for the
highest degree of this impact (Izogo &
Ogba, 2015).
Based on the above definition if
associated with this study, product quality
is the quality of the production of optical
lenses produced must be following the
standard that has been determined from the
power side and cosmetics, while service
quality is the acceleration of the period of
the eyeglass lens production process to
meet customer expectations and desires.

Media Ekonomi dan Manajemen, Volume 36 Issue 1, January 2021, 76-88
p-ISSN: 0854-1442 (Print) e-ISSN: 2503-4464 (Online) 79
Kaizen Work Culture for Continuous
Improvement with Value Chain
Analysis Method
An organization that developed and
developing an organization that managed
to build an ethos or culture of working
employees at all levels. Robbin (2002)
explains that the practical work culture
contains several definitions patterns of
values, attitudes, behaviors, intentions, and
results of the work, including instruments,
systems, technology, and the language it
uses. Meanwhile, according to Nawawi
(2003), understanding the working culture
is a habit that is run repeatedly by the
employees in an organization. There is a
very famous work culture of the State
Sakura Japanese Kaizen has also used as a
model the work culture in manufacturing
optical lenses as the research object that is
Kaizen. Kaizen by Imai (2008), is
"continuous progress and improvement in
one's life, family life, social life, and
working life". Kaizen is "a simple concept,
which is composed of two characters
namely: Kai meaning change and Zen
meaning well, so if combined into one
word then literally have to mean
"improvement ". Kaizen is a continuous
improvement that involves all members of
the company by creating new ways of
thinking and process-oriented management
systems that support and reward employee
efforts.
Kaizen is a Japanese word, which
implies any change for good. It implies
that continuously done small changes help
in improving manufacturing techniques
and processes (Kumar, 2019). Kaizen
focuses on simplification by breaking
down complex processes into sub-
processes and then fix it. Typically, Kaizen
started by producing efficiently with
limited resources; human, material,
machinery (Abdulmouti, 2018).
Continuous improvement is an
organized attempt to find out and apply
new ways of doing work for making
process improvements by bringing step by
step innovations to work and this could
be possible by Involving top to bottom
employees to bring new ideas to work
place (Khan et. al., 2018). According to
Joergensen, Boer and Laugen, (2006),
Continuous Improvement is the process of
planned, organized, and systematic
changes that are ongoing, gradual and
across the enterprise in practice running,
and aims to improve the performance of
the company. To continue to monitor the
results of improvement needs to be
monitored (monitoring) and auditing.
Results of monitoring and auditing can be
used as a reference for the development or
improvement of sustainable (Santoso &
Mayrifka, 2019).
According to Pearce and Robinson
(2013), the value chain is a method of
viewing the company as a decaying
activity that turns inputs into valuable
output for customers. Whereas according
to Porter (1985), Value chain is a series of
activities carried out by companies made
specifically to produce goods or services.
Porter further explained the understanding
of the value chain model, which is a tool to
identify various ways of generating value
or value for consumers, where this model
displays the overall value consisting of
various value and profit activities (margin).
This value activity is divided into five
main activities (Primary Activities) and
four supporting activities (Support
Activities).
Primary Activities consists of:
Inbound Logistics
Operations Management
Outbond Logistics
Marketing and sales
Service
Support Activities consist of:
Company infrastructure
Human resource management
Technology
Procurement
Competitive Advantage
Media Ekonomi dan Manajemen, Volume 36 Issue 1, January 2021, 76-88
80 p-ISSN: 0854-1442 (Print) e-ISSN: 2503-4464 (Online)
Market orientation is an
organizational culture that is most effective
and efficient at creating the necessary
behaviors for the creation of superior value
for customers so that they can generate
superior business performance on an
ongoing basis (Haryanto, 2019). The
competitive advantage gained when
organizations develop or acquire a set of
attributes (or action execution) that enable
it to outperform its peers (Wang, 2014). In
another sense, the competitive advantage is
visible when the activities of certain
organizations more profitable than
competitors' market or when outperform
those concerning to the results other
important activities (Huff et al., 2009). The
problem becomes even more important
competitive advantage as a result of
growing turbulence in the business
environment. As seen, today is the ability
of companies to adapt to the environment
will increase. Therefore, the source of
advantages such as flexibility or dynamic
capability will have a major role as well as
the values of the organization and learning
organizations, which have the character of
intangible (Cegliński 2016). The
framework research can be described in
Figure 2.
RESEARCH METHODS
This study uses a study of literacy
and qualitative approaches. Sugiyono
(2010), explains that the method of
qualitative research is a research method
that is based on the philosophy of post-
positivism, is used to examine the
condition of the object that is natural,
where researchers are a key instrument, a
sampling data source is purposive and
snowball, techniques of collecting by
triangulation (combined), data analysis is
inductive or qualitative and qualitative
research results further emphasize the
significance of the generalization.
According to Maleong, (in Herdiansyah
2010), Qualitative Methods is scientific
research that aims to understand a
phenomenon in social contact naturally
with the advanced process of interaction
between researcher in-depth communi-
cation with the phenomenon.
The Research was conducted on an
optical lens manufacturing in Jakarta,
which is a group of an optical retail
company in Indonesia. which has more
than 100 stores spread almost all over
Indonesia. Data were collected through
observation, documentation, and inter-
views with managers at the manufacturing
plant, as well as to 100 store managers &
optical stores customers.

Media Ekonomi dan Manajemen, Volume 36 Issue 1, January 2021, 76-88
p-ISSN: 0854-1442 (Print) e-ISSN: 2503-4464 (Online) 81
Figure 1. Flow of Lens Production Process
Figure 2. Framework Research
RESULT AND DISCUSSION
In 2018, manufacturing and move
into the new building, but it is still the
same in the city. In the new building began
the process of transformation of the
development of product quality and
service. Results of research conducted by
comparing the data in 2018, where the
process begins with the development of
KPI results in 2020. So, score a few in the
following findings:
Determination the Standard of KPI
KPIs are defined as strategic and
measurable measurements that reflect
critical business success factors (ISO
22400, 2014). is also a financial and non-
financial indicator used by organizations to
estimate and strengthen how successful
they are, which aims to achieve long-term
goals that have been previously set
(Velimirović et al, 2011). Whereas Warren
(2011), defining KPIs is a measurement
that assesses how an organization executes
its strategic vision. The intended strategic
Surfacing
Coating
QC1
Warehouse*
Optical Store
Lab. Server
Semi Finish Lens Finish Lens * Calculating
* Blocking
* Taping
* Generating
* Engraving
* Polish
* Deblocking
Reject
* Precleaning
* Hardcoat
* Multicoat
Edging
* Fullrim
* Halfrim
* Rimles
Delivery
* Packing
* Delivery
QC2
QC3
Reject
Reject
* Complaint
* Product Knowledge
* Order process
Customer Service
Product
Quality
Service
Quality
Continuous
Improvement
(Kaizen)
Value Chain
Analysis
Optical lens
Manufacturin
g
Competitive
Advantage
Media Ekonomi dan Manajemen, Volume 36 Issue 1, January 2021, 76-88
82 p-ISSN: 0854-1442 (Print) e-ISSN: 2503-4464 (Online)
vision refers to how the organizational
strategy is interactively integrated into the
overall organizational strategy. To make
the KPI Definition more appropriate in
evaluating operational performs in
industrial processes, it is necessary to
know how the industrial processes that
take place in converting raw materials into
finished goods (Li Zhu et. al., 2017).
Optical Lens Manufacturing which
was the object of this study had KPI
namely Rejected Rate and On-Time
Delivery (OTD. Rejected Rate is the KPI
used to measure the failure rate of the
production process compared to the total
amount of production for one month
(Percentage). Whereas On-Time Delivery
is measuring delays orders in one month
compared to total orders for one month.
The two KPIs above have linkages, the
production process that experiences many
failures will cause many orders that will be
delayed or in other words, the high
Rejected Rate will affect the On-Time
Delivery.
KPI is a means to be able to measure
the extent of the operational run following
the specified standards. In determining the
operational standards must be following
the organization's goals of providing better
quality and faster processing. Then in 2018
in ordain KPI for the standard process of
the lens. KPI setting process is to analyze
each stage of the production process (value
chain) with the following data:
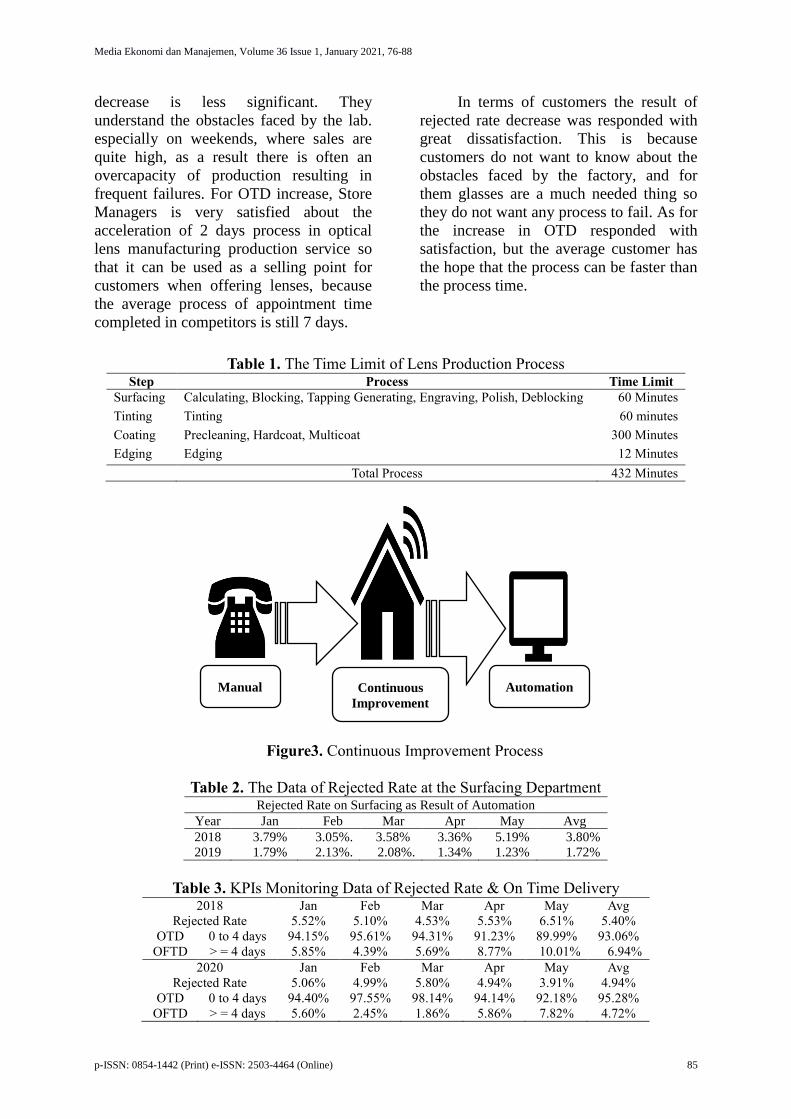
From the Table 1, it can be seen that
the pair of lenses takes 7.2 hours. Plus, the
administrative process when the server
receives data from the optical order of
about 15 minutes. So overall the average
total production was 7.5 hours. But the
total time the process has not counted the
long queue. The length of time the queue is
very dependent on the orders of the day.
So that the total processing time specified
in the KPI On-Time Delivery is 4 working
days and the KPI in the Rejected Rate is
set at 3.5%.
This designation is determined by
considering the cost of production due to
the number of the lens production process
that failed and the risk of delays in the
process of lens to customer orders and the
factors appointment time to customer
service is also being one of the key factors
of competitiveness of service to compe-
titors.
Application of Porter's Value Chain
Analysis to Continuous Improvement
One way that is used to achieve
sustainable development in manufacturing
is to implement Kaizen work culture.
Kaizen applied work culture makes the
development process continues to run.
Input improvement is based on the
complaints and feedback from the front
line of optical-optical collaboration with
manufacturing. The Input was discussed at
regular meetings weekly and monthly
action plan which is then used to plan
short-term and long-term.
The method used in making conti-
nuous improvement is by value chain
analysis from Porter. The analysis used in
this study is the use of a value chain model
proposed by Porter as follows:
Main Activities
Logistic Incoming
The quality of the lens raw materials,
it is greatly affecting the quality of
products. On manufacture make
arrangements with suppliers, which do not
meet quality lens will cut payment. But
less well-recognized lens quality is a lens
that has not entered the production process.
So that does is make Incoming Station for
checking the quality of lenses (cosmetic
qualities: scratches, spots, etc.) before
entering the production process.
Operations Management
Surely operations management has a
very vital role in the quality of production.
Media Ekonomi dan Manajemen, Volume 36 Issue 1, January 2021, 76-88
p-ISSN: 0854-1442 (Print) e-ISSN: 2503-4464 (Online) 83
For that management made several
strategic measures including:
Maintenance
Perform calibration of the machinery
of production and maintenance for all
production machines to ensure the
condition and quality of utilities, such as
water quality, humidity, cleanliness, air
pressure, room temperature, and the
temperature of cold water (chiller) to be
monitored.
Additions Production Line
As the number of good partners, the
optical optics group of companies as well
as independent optical line management
did increase production to 2 lines. This is
certainly a very significant increase in the
production capacity of the company which
led to an increase in the service order
process period and improve KPI On-Time
Delivery.
Logistics Exit
To ensure the products to customers in
addition to developing an internal
department that serves optical expedition
partners in the cities and provinces of
manufacturing also cooperate with
reputable external expeditions and
commitment are aligned.
Marketing & Sales
For marketing and sales activities to
the Independents optical, the management
of the sales department in charge of
marketing their products and maintain
good relations with the optical-optical
partner who has been working. The
marketing activities are carried out directly
by the optical-optical visit in all regions in
Indonesia and negotiate directly with the
owner. Branding activities also performed
well in print and on-line. And to increase
sales in the optical group company, joint
management incentive scheme suppliers
make a trip to the best sales team in sales
lens with defined KPI.
Services
Service is very considered, for the
improvement of customer services is done
by adding the line phone operator and also
build the information system checks the
order through the website that can be
accessed anytime and anywhere.
Supporting Activities
Infrastructure Company
For service, improvements can be
made quickly and effectively split the
management of the organization by
increasing the customer service
department.
Human Resource Management (HRM)
Development of HRM done by the
following methods:
Training
Provide basic and advanced
training for all employees to achieve
the appropriate competence and
expertise standards. For some
materials that advance, the
management also requested that the
supplier provide training to transfer
knowledge (Knowledge sharing) to
the operator.
Allowance
Since work on optics
manufacturing requires precision is
very high, especially in the QC, the
company provides free glasses for
employee benefits every year so that
maximum operator vision at work.
Recess Period
Create a schedule enough rest in
the morning and afternoon so
employees can rest the vision to be
able to return to work with high
precision.
Incentives and Penalties
Management also implemented
incentives and bonuses for
Media Ekonomi dan Manajemen, Volume 36 Issue 1, January 2021, 76-88
84 p-ISSN: 0854-1442 (Print) e-ISSN: 2503-4464 (Online)
employees who excel as well as fines
and penalties for employees who
often make mistakes in the work, it is
certainly very effective regards
motivate employees to work.
Technology
The use of technology in the
operations of a business becomes a
key success of companies in the face
of today's business competition. For
that management periodically renew
the production equipment with the
latest technology especially those
having artificial intelligence and
digital devices that can allow the
operator to work and reduce
production time. As a first example
of the calculation process is fully
carried by the operator so that the
error rate is high enough and long
enough processing time. Currently,
95% is done by a machine and the
results are very good and fast.
Information technology over the
Internet is also used for checking the
booking process and transmit a data-
order lens whenever and wherever.
From the data by utilizing the
calculation scrubbing technology in Table
2, the upgraded equipment surfacing
machine managed to lose rejected rate
from 3.80% to 1.72% which is equal to
2:08% in the surfacing department.
Procurement
Manufacturing selecting suppliers
with optical lens best brand in the world of
optical lens company coming from
Germany. The supplier is the leading lens
manufacturer in the world that has stood
since 1846. The quality of the optical
clarity of the lenses in the world no doubt,
even not just make lenses for eyeglasses
only, but for telescopes, microscopes, and
medical devices are extremely exacting in
its use.
KPI Monitoring Data
The progress of the continuous
improvement is monitored by using the
following KPIs described in Table 3. From
the table are rejected KPI rate reduction
rate is 0.46%. Namely, in the year 2018. by
an average of 5.40% and by 2020 become
4.94%. Then in IBC on time delivery
increased by 2.22%. Namely in 2018 on
average by 93.06% and by 2020 became
95.28%. From the results of the above
development has yet to reach the target
KPI that is made of 3.5% to Rejected Rate
and 4 days for On-Time Delivery on all
orders lens. For it was still a necessary step
of sustainable development so that all KPI
can be achieved and have a competitive
advantage in the optical lens manu-
facturing industry.
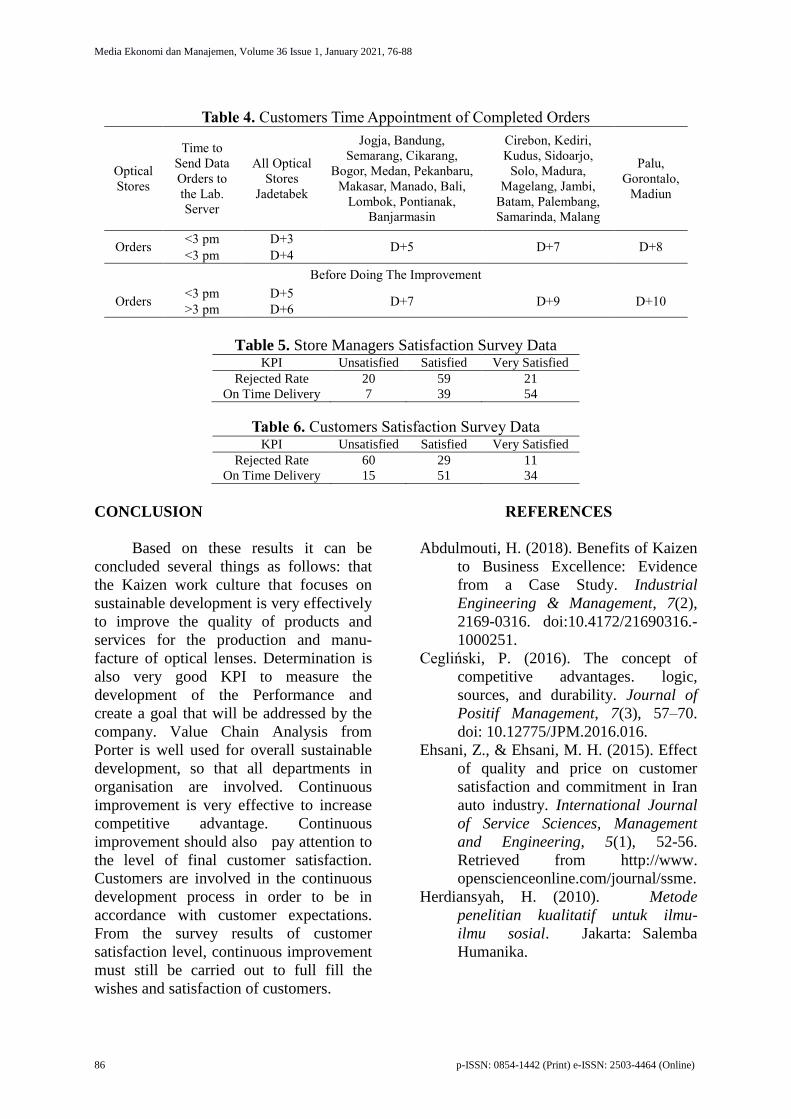
Based on these results promising
manufacturing successful order completion
process for the optical counterparts 2 days
faster than before. Such data can be seen in
the Table 4. The table shows the
manufacturing managed to increase
competitiveness in the competition by
cutting the lens order execution process
time compared to 2018 (before the
development) and by 2020 faster than 2
days. While the average manufacturing
optical lenses, others are still 5 working
days.
The results of continuous develop-
ment in Rejected Rate and OTD are used
as survey materials to 100 Store Managers
and Optical Store Customers to find out
the level of satisfaction felt to these results
(Table 5 and Table 6).
The conclusion of the survey results
is from the Store Managers side of the
optical partner who is in charge and the
head of the optical store that is often
directly related to the lab and also
customers. As people who understand very
well about the process of making optical
lenses in the lab., the store managers are
mostly satisfied about the achievement of
Rejected Rate which is down, although the
Media Ekonomi dan Manajemen, Volume 36 Issue 1, January 2021, 76-88
p-ISSN: 0854-1442 (Print) e-ISSN: 2503-4464 (Online) 85
decrease is less significant. They
understand the obstacles faced by the lab.
especially on weekends, where sales are
quite high, as a result there is often an
overcapacity of production resulting in
frequent failures. For OTD increase, Store
Managers is very satisfied about the
acceleration of 2 days process in optical
lens manufacturing production service so
that it can be used as a selling point for
customers when offering lenses, because
the average process of appointment time
completed in competitors is still 7 days.
In terms of customers the result of
rejected rate decrease was responded with
great dissatisfaction. This is because
customers do not want to know about the
obstacles faced by the factory, and for
them glasses are a much needed thing so
they do not want any process to fail. As for
the increase in OTD responded with
satisfaction, but the average customer has
the hope that the process can be faster than
the process time.
Table 1. The Time Limit of Lens Production Process Step Process Time Limit
Surfacing Calculating, Blocking, Tapping Generating, Engraving, Polish, Deblocking 60 Minutes
Tinting Tinting 60 minutes
Coating Precleaning, Hardcoat, Multicoat 300 Minutes
Edging Edging 12 Minutes
Total Process 432 Minutes
Figure3. Continuous Improvement Process
Table 2. The Data of Rejected Rate at the Surfacing Department Rejected Rate on Surfacing as Result of Automation
Year Jan Feb Mar Apr May Avg
2018 3.79% 3.05%. 3.58% 3.36% 5.19% 3.80%
2019 1.79% 2.13%. 2.08%. 1.34% 1.23% 1.72%
Table 3. KPIs Monitoring Data of Rejected Rate & On Time Delivery 2018 Jan Feb Mar Apr May Avg
Rejected Rate 5.52% 5.10% 4.53% 5.53% 6.51% 5.40%
OTD 0 to 4 days 94.15% 95.61% 94.31% 91.23% 89.99% 93.06%
OFTD > = 4 days 5.85% 4.39% 5.69% 8.77% 10.01% 6.94%
2020 Jan Feb Mar Apr May Avg
Rejected Rate 5.06% 4.99% 5.80% 4.94% 3.91% 4.94%
OTD 0 to 4 days 94.40% 97.55% 98.14% 94.14% 92.18% 95.28%
OFTD > = 4 days 5.60% 2.45% 1.86% 5.86% 7.82% 4.72%
Manual Automation Continuous
Improvement
Media Ekonomi dan Manajemen, Volume 36 Issue 1, January 2021, 76-88
86 p-ISSN: 0854-1442 (Print) e-ISSN: 2503-4464 (Online)
Table 4. Customers Time Appointment of Completed Orders
Optical
Stores
Time to
Send Data
Orders to
the Lab.
Server
All Optical
Stores
Jadetabek
Jogja, Bandung,
Semarang, Cikarang,
Bogor, Medan, Pekanbaru,
Makasar, Manado, Bali,
Lombok, Pontianak,
Banjarmasin
Cirebon, Kediri,
Kudus, Sidoarjo,
Solo, Madura,
Magelang, Jambi,
Batam, Palembang,
Samarinda, Malang
Palu,
Gorontalo,
Madiun
Orders <3 pm D+3
D+5 D+7 D+8 <3 pm D+4
Before Doing The Improvement
Orders <3 pm D+5
D+7 D+9 D+10 >3 pm D+6
Table 5. Store Managers Satisfaction Survey Data KPI Unsatisfied Satisfied Very Satisfied
Rejected Rate 20 59 21
On Time Delivery 7 39 54
Table 6. Customers Satisfaction Survey Data KPI Unsatisfied Satisfied Very Satisfied
Rejected Rate 60 29 11
On Time Delivery 15 51 34
CONCLUSION
Based on these results it can be
concluded several things as follows: that
the Kaizen work culture that focuses on
sustainable development is very effectively
to improve the quality of products and
services for the production and manu-
facture of optical lenses. Determination is
also very good KPI to measure the
development of the Performance and
create a goal that will be addressed by the
company. Value Chain Analysis from
Porter is well used for overall sustainable
development, so that all departments in
organisation are involved. Continuous
improvement is very effective to increase
competitive advantage. Continuous
improvement should also pay attention to
the level of final customer satisfaction.
Customers are involved in the continuous
development process in order to be in
accordance with customer expectations.
From the survey results of customer
satisfaction level, continuous improvement
must still be carried out to full fill the
wishes and satisfaction of customers.
REFERENCES
Abdulmouti, H. (2018). Benefits of Kaizen
to Business Excellence: Evidence
from a Case Study. Industrial
Engineering & Management, 7(2),
2169-0316. doi:10.4172/21690316.-
1000251.
Cegliński, P. (2016). The concept of
competitive advantages. logic,
sources, and durability. Journal of
Positif Management, 7(3), 57–70.
doi: 10.12775/JPM.2016.016.
Ehsani, Z., & Ehsani, M. H. (2015). Effect
of quality and price on customer
satisfaction and commitment in Iran
auto industry. International Journal
of Service Sciences, Management
and Engineering, 5(1), 52-56.
Retrieved from http://www.
openscienceonline.com/journal/ssme.
Herdiansyah, H. (2010). Metode
penelitian kualitatif untuk ilmu-
ilmu sosial. Jakarta: Salemba
Humanika.

Media Ekonomi dan Manajemen, Volume 36 Issue 1, January 2021, 76-88
p-ISSN: 0854-1442 (Print) e-ISSN: 2503-4464 (Online) 87
Hoe, L. C., & Mansori, S. (2018). The
effects of product quality on
customer satisfaction and loyalty:
evidence from Malaysian
engineering industri. International
Journal of Industrial Marketing,
3(1), 20-35. doi:10.5296/ijim.v3i1.
13959.
Huff, A. S., Floyd, S. W., Sherman, H. D.,
& Terjesen, S. (2009). Strategic
management. logic and action. New
York: John Wiley & Sons.
Imai, M. (2008). The Kaizen power. Alih
Bahasa: Sigit Pranowo, Yogyakarta.
Izogo, E. E., & Ogba, I. E. (2015). Ogba
service quality, customer satisfaction
and loyalty in automobile repair
services sector. International Journal
of Quality & Reliability Mana-
gement, 32(3), 250-269. doi.
10.1108/IJQRM-05-20130075.
ISO 22400 (2014). Automation systems
and integration - key performance
indicators (KPIs) for manufacturing
operations management.
Joergensen, F., Boer, H., & Laugen, B.T.
(2006). CI implementation: an
empirical test of the CI maturity
model. Creativity and Innovation
Management, 15(4), 328-337. doi:
10.1111/j.1467-8691.2006.00404.
Khan, H. U. Ali, S., & Hongqi, L. (2018).
Impact of continous improvement on
organization performance insight
from Pakistan : an empirical study.
International Journal of Innovation,
Management and Technology, 9(1),
7-14.
Kotler, P., & Amstrong, G. 2012. Principle
of marketing.14th edition. New
Jersey, Published by Prentice Hall.
Kumar, R. (2019). Kaizen a tool for
continuous quality improvement in
Indian manufacturing Organization.
International Journal of Mathe-
matical, Engineering and Mana-
gement Sciences 4(2), 452–459.
doi:10.33889/IJMEMS.2019.4.2-037
Li Zhu, C., Johnsson, J., Mejvik, M.,
Varisco, & Schiraldi, M. (2017). Key
performance indicators for manu-
facturing operations manage-ment in
the process industry, 2017 IEEE
International Conference on Indus-
trial Engineering and Engineering
Management (IEEM), 969-973. doi:
10.1109/IEEM.2017. 8290036.
Nawawi, H. (2003). Kepemimpinan
Mengefektifkan Organisasi. Yogya-
karta: Gajah Mada University Press.
Pearce, J. A., & Robinson, R. B. (2013).
Manajemen strategis: formulasi,
implementasi, dan pengendalian.
Jakarta: Salemba Empat.
Porter, E. M. (1985). Competitive
advantage-creating and sustaining
superior performance. New York:
Free Press.
Robbin P. S. (2002), Organizational
behavior principles (Fifth edition).
Jakarta: the publisher.
Santoso, S., & Mayrifka, D. (2019).
Analysis problem and improvement
of appearance aesthetics product
model HC C5 / XT with method of
Plan-Do-Check-Action (PDCA) in
PT. XXXX. International Journal of
Innovative Science and Research
Technology, 4(11), 2456-2165.
Sugiyono, S. (2010). Research method
quantitative and qualitative R&D.
Bandung: Alfabeta.
Tjiptono, F. (2008). Strategi pemasaran
(Edisi Kedua). Yogyakarta: Andi
Offset.
Velimirović, D., Velimirović, M. &
Stanković, R. (2011). Role and
importance of key performance
indicators measurement. Serbian
Journal of Management, 6(1), 63 -
72.
Wang, H. L. (2014). Theories for
competitive advantage, in: Hasan, H.
(Ed.), Being Practical with Theory:
A Window into Business Research,
Wollongong, Australia: Theory,
Australia, 33–43.

Media Ekonomi dan Manajemen, Volume 36 Issue 1, January 2021, 76-88
88 p-ISSN: 0854-1442 (Print) e-ISSN: 2503-4464 (Online)
Warren, J. (2011). Key performance
indicators (KPI) - definition and
action: integrating KPIs into your
company’s strategy. London: ATI.