improvement of industrial product quality
TRANSCRIPT

KAUNAS UNIVERSITY OF TECHNOLOGY
MECHANICAL ENGINEERING AND DESIGN FACULTY
MARIUS ŠUMANAS
IMPROVEMENT OF INDUSTRIAL PRODUCT QUALITY
Master’s Degree Final Project
KAUNAS, 2017
Supervisor
Assoc. prof. dr. Kazimieras Juzėnas

KAUNAS UNIVERSITY OF TECHNOLOGY
MECHANICAL ENGINEERING AND DESIGN FACULTY
IMPROVEMENT OF INDUSTRIAL PRODUCT QUALITY
Master’s Degree Final Project
Industrial Engineering and Management (621H77003)
Supervisor
(signature) Assoc. prof. dr. Kazimieras Juzėnas
(date)
Reviewer
(signature) Assoc. prof. dr. Paulius Griškevičius
(date)
Project made by
(signature) Marius Šumanas
(date)
KAUNAS, 2017

KAUNAS UNIVERSITY OF TECHNOLOGY
Faculty of Mechanical Engineering and Design
(Faculty)
Marius Šumanas
(Student's name, surname)
Industrial Engineering and Management - 621H77003
(Title and code of study programme)
"Title of Final Project"
DECLARATION OF ACADEMIC INTEGRITY
29 May 20 17
Kaunas
I confirm that the final project of mine, Marius Šumanas, on the subject “Improvement of
industrial product quality” is written completely by myself; all the provided data and research results
are correct and have been obtained honestly. None of the parts of this thesis have been plagiarized
from any printed, Internet-based or otherwise recorded sources. All direct and indirect quotations from
external resources are indicated in the list of references. No monetary funds (unless required by law)
have been paid to anyone for any contribution to this thesis.
I fully and completely understand that any discovery of any manifestations/case/facts of
dishonesty inevitably results in me incurring a penalty according to the procedure(s) effective at
Kaunas University of Technology.
(name and surname filled in by hand) (signature)

KAUNAS UN IVERSITY OF TECHNOLOGY
FACULTY OF MECHANICAL ENGINEERING AND DESIGN
Approved: Head of
Production engineering
Department
(Signature, date)
Kazimieras Juzėnas
(Name, Surname)
MASTER STUDIES FINAL PROJECT TASK ASSIGNMENT
Study programme INDUSTRIAL ENGINEERING AND MANAGEMENT
The final project of Master studies to gain the master qualification degree, is research or applied type
project, for completion and defence of which 30 credits are assigned. The final project of the student must
demonstrate the deepened and enlarged knowledge acquired in the main studies, also gained skills to formulate
and solve an actual problem having limited and (or) contradictory information, independently conduct scientific
or applied analysis and properly interpret data. By completing and defending the final project Master studies
student must demonstrate the creativity, ability to apply fundamental knowledge, understanding of social and
commercial environment, Legal Acts and financial possibilities, show the information search skills, ability to
carry out the qualified analysis, use numerical methods, applied software, common information technologies
and correct language, ability to formulate proper conclusions.
1. Title of the Project
Approved by the Dean Order No.V25-11-8, 21 April 2017
2. Aim of the project
3. Structure of the project
4. Requirements and conditions
5. This task assignment is an integral part of the final project
6. Project submission deadline: 2017 June 1 st.
Student Marius Šumanas _____________________ (Name, Surname of the Student) (Signature, date)
Supervisor Assoc. Prof. Kazimieras Juzėnas _____________________ (Position, Name, Surname) (Signature, date)
Improvement of industrial product quality
Analysis of quality improvement methods and formulations for product packaging improvement solution.
Summary, Introduction, 1. Analysis of methods and tools for quality improvement in industry, 2. Application
for quality improvement in production company 3. Design of specialized equipment, 4. Conclusions,
References.
To prepare final project according to KTU regulations and requirements

1
Marius, Šumanas. Improvement of industrial product quality. Master's degree Final Project /
supervisor assoc. prof. dr. Kazimieras Juzėnas; Faculty of Mechanical Engineering and Design,
Kaunas University of Technology.
Research field and area: Technological sciences, Production engineering
Keywords: Quality, improvement, sterilization, Pareto analysis, bio-fertilizers.
Kaunas, 2017. 62 p.
SUMMARY
The main objective raised to this project – research existing methods for quality improvement
in industry and adopt to existing manufacturing process of bio-fertilizers. The need occurred when
simple calculations for product reliability were incorrect and some of the customer expectations
were not met. Company had devoted budget for new machinery, facility’s and subdivision creation
to stand more competitive in new product market.
Product and process improved in creation of factory, but one factor left untouched –
packaging. Final stage of manufacturing process is pouring fertilizers in to containers. Because of
product sensitivity to medium around it, dirty environment reacts to bacteria in fertilizers and
reduces its activity. For this reason sterilization of packaging canisters is required to maintain
existing quality of product. Instant improvement in company is fatal for competitive market.
The creation of sterilization subdivision has three stages, but before that Pareto analysis was
made to find problem for product reliability loss. Sterilization method analysis helped to choose
best fitting substance to apply in sterilization. Next step is to design structure for mounting
canisters. For sterilization process optimal time and amount of canisters execution, stainless pipe
structure was made corresponding to the full height and width of chamber. For this Solid works
software where used.
Solid works add in Flow motion helped to calculate air flow in metal structure and choose
engine and confirm that designed pipe structure is correct and will work in existing conditions.
Calculations for project price where made to count expenses for implementation. To reach higher
level of company’s quality improvement implementation of reiterative canisters usage was
suggested.
2
Marius, Šumanas. Pramoninio produkto kokybės gerinimas. Magistro baigiamasis projektas /
vadovas doc. dr. Kazimieras Juzėnas; Kauno technologijos universitetas, Mechanikos inžinerijos ir
dizaino fakultetas.
Mokslo kryptis ir sritis: Technologijos mokslai, Gamybos inžinerija
Reikšminiai žodžiai: Kokybė, gerinimas, sterilizacija, Pareto analizė, biotrąšos.
Kaunas, 2017. 62 p.
SANTRAUKA
Pagrindinis darbui iškeltas tikslas – išanalizuoti esamus kokybės gerinimo metodus
pramonėje ir pritaikyti juos jau esamame bio trašų gamybos procese. Poreikis kilo kai paprastieji
skaičiavimai planuojant produkto naudą buvo neteisingi ir nepatenkino keletos klientų poreikių.
Siekiant būti konkurencingesniems gamintojas skyrė finansų naujai įrangai, patalpoms ir
papildomiems skyriams kurti.
Produktas ir gamybos procesai buvo patobulinti statant naują gamyklą tačiau vienas iš
faktoriu liko nepaliestas – pakavimo kanistrai. Galutinis gamybos veiksmas yra išpilstymas į
kanistrus. Kadangi produktas yra biologiškai aktyvus, t.y. bakterijos, jos jautriai reaguoja į aplinką
ir praranda savo savybes sumažindamos kokybę. Norint išlaikyti esamą produkto kokybę reikalinga
pakuočiu sterilizacija. Gamybinių ir vadybos procesų gerinimas, klaidų atpažinimas ir šalinimas
yra gyvybiškai svarbus konkurencingoje rinkoje.
Sterilizacijos padalinio sukūrimas turi tris etapus, tačiau prieš tai reikalingas konkrečios
problemos identifikavimas. Tam atliekama Pareto analizė patvirtinti ir nustatyti gamybinius
nesklandumus kurie įtakojo nuostolius kokybei. Pirmas etapas – sterilizacijos metodų analizė leido
pasirinkti vandenilio peroksido būdą kaip tinkamiausią tokio tipo pakuotėms sterilizuoti. Sekantys
punktai: technologiniai sprendimai. Metalinės konstrukcijos sukūrimas ir oro srauto tyrimas jos
viduje siekiant tilpti į kamerą ir išpildyti reikalavimus pripildyti visus kanistrus sterilizacijos garų.
Šiuos veiksmus atlikti buvo naudojama 3D modeliavimo programa SolidWorks. Apskaičiuoti
kaštai ir medžiagos reikalingos pasiekti norimą rezultatą. Taip pat SoliWorks papildinys
Flowmotion leido sukurti užduotį ir simuliuoti oro srautą metalinės konkstrukcijos viduje parenkant
tinkamo debeto variklį.

3
Table of contents
Introduction ......................................................................................................................................... 1
1. QUALITY IMPROVEMENT ......................................................................................................... 2
1.1 Eight quality management principles......................................................................................... 5
1.2 The revolution of techniques and tools for TQM ...................................................................... 7
1.3 Demings PDSA .......................................................................................................................... 8
1.4 Deming’s Fourteen Points of Quality ...................................................................................... 10
1.5 Pareto analysis ......................................................................................................................... 11
1.6 Kaizen principle ....................................................................................................................... 15
1.7 Kaizen events ........................................................................................................................... 16
1.8 Implementing Quality .............................................................................................................. 17
1.9 Seven unneeded activities in manufacturing............................................................................ 19
2. APPLICATION OF PRODUCT QUALITY IMPROVEMENT .................................................. 22
2.1 Introduction to Bio-energy ....................................................................................................... 22
2.2 The need of bio fertilizers products ......................................................................................... 23
2.3 The need for quality improvement ........................................................................................... 25
2.4 Analysis of final product reliability (Pareto analysis) ............................................................. 26
2.5 Possibilities to increase final product quality .......................................................................... 29
2.6 The basics of sterilization ........................................................................................................ 30
2.7 Sterilization Methods ............................................................................................................... 31
2.9 Sterilization quality Assurance ................................................................................................ 40
2.10 Sterilization chamber implementation in to existing manufacturing process ........................ 41
3. STERILIZATION CHAMBER DESIGN ..................................................................................... 42
3.1 Pipe structure design ................................................................................................................ 42
3.2 Calculations for material .......................................................................................................... 45
3.3 Flow analysis ........................................................................................................................... 46
3.4 Installing sterilization process in to manufacturing of bio fertilizers ...................................... 50
3.5 Additional value ....................................................................................................................... 52
Conclusions ....................................................................................................................................... 53
References ......................................................................................................................................... 54
Annexes ............................................................................................................................................. 57

4
List of figures
Figure 1. Demings PDSA cycle [9] ..................................................................................................... 9
Figure 2. Demings PDSA cycle diagram [9]. .................................................................................... 10
Figure 3. Pareto table of errors on order forms. [9] ........................................................................... 12
Figure 4. Pareto diagram of errors on order forms. [12] ................................................................... 13
Figure 5. Quality improvement roadmap. [12] .................................................................................. 14
Figure 6. Six Sigma visualization ...................................................................................................... 19
Figure 7. Bioenergy advertisement picture........................................................................................ 23
Figure 8. Manufacture of bio fertilizers process chart....................................................................... 24
Figure 9. Canister for bio fertilizers packaging ................................................................................. 25
Figure 10. Pareto analysis for final product realibility. ..................................................................... 27
Figure 11. Canister technical drawing and measurements. ............................................................... 30
Figure 12. Canister technical drawing and measurements ................................................................ 33
Figure 13. Dry heat sterilization chamber [25]. ................................................................................ 34
Figure 14. Liquid chemical sterilization [24]. ................................................................................... 36
Figure 15. Ozone sterilization process explanation [25] ................................................................... 38
Figure 16. Dry fog droplet action ...................................................................................................... 39
Figure 17. Dry Fog 2 System [26]. ................................................................................................... 40
Figure 18. Sketch with measurements for mainframe. ...................................................................... 43
Figure 19. Solid works drawing of pipe construction ....................................................................... 44
Figure 20. Pipe structure visualization. Half assembled with canisters ............................................ 45
Figure 21. Stainless steel pipe ........................................................................................................... 45
Figure 22. Air flow simulation in structure ....................................................................................... 47
Figure 23. Air flow in A side oputlets (30 min) ................................................................................ 48
Figure 24. Air flow in B side oputlets (30 min) ................................................................................ 48
Figure 25. Air flow in each outlet 60 min side A .............................................................................. 49
Figure 26. Air flow in each outlet 60 min side B .............................................................................. 49
Figure 27. Canal ventilator DOSPEL WK100 .................................................................................. 50
Figure 28. Product packages movement in factory ........................................................................... 51
List of tables

5
Table 1. Reasons of product quality loss ........................................................................................... 28
Table 2. Canisters measurements ...................................................................................................... 42
Table 3. The measurements of stainless steel needed. ...................................................................... 46
Table 4. Air flow results in each outlet (30 min / 60 min) ................................................................ 57
Table 5. Test results of final product reliability ................................................................................ 59
Table 6. Lodging number and sizes ................................................................................................... 61

1
Introduction
In the new rapidly growing market, the speed of your product improvement can be
determined which part of the pie company will get in the beginning of the race. Velocity of market
penetration with customer satisfaction can make a big gap between you and your competitors.
My research is targeted to product quality improvement. When the new innovation or
product is created and introduced to market competitors starts to grow exponential. Thus the leading
company or creator of product (if innovation cannot be patented) has to improve quality of product,
quality of service, marketing and so on to be in the lead. The companies who is starting new product
is ahead by main uniqueness – know how. Manufacturing, supply chain line, first feedback from
customer gives opportunity to improve product and stay in the lead.
Marketing principles can be used to take market share, to reach results, but to truly be grounded in
the market place company has to build foundation for its success – product quality. This research is
focused on products quality improvement by studying various techniques used in industry and
business to reach next level, to keep up with the main principle of the market in capitalism society –
constant development and growth.
Aims of the project is Analysis of quality improvement methods and formulations for
product packaging improvement solution. Tasks to achieve this aim were formulated:
1. Analyse existing methods and techniques developed over the years regarding product or process
improvement and quality management. The industrial revolution grew rapidly, with it – improvement
of various different areas which makes influence for productivity of process making final product.
There is many activities which expands process time or uses recourses ineffectively. Identifying those
areas, noticing tendencies in processes and fixing or improving it rises quality.
2. Acknowledge company’s process and find weak spots to create plan for product improvement
generating bigger value in the market. Also making it bigger player in the market and harder to reach
for competitors, especially when new type of product is entering market.
3. Analyse methods of sterilizations and choose best fitting technique according to price and
implementation to existing conditions.
4. Design and calculate technical equipment needed for new subdivision implementation in
manufacturing process according to conditions existing, without destruction or redesign of existing
process. Manufacturing is not stopping.
5. Suggest improvements to existing manufacturing process to reach higher quality in long term.

2
1. QUALITY IMPROVEMENT
Quality Improvement is a simplified view point to the investigation of execution and step by step
actions to improve it. This subject covers variety of models implemented, most famous is, FADE
(focus, analyse, develop, execute), PDSA (plan, do study, act), Six Sigma or DMAIC, CQI -
Continuous Quality Improvement or TQM – Total quality management. These models with various
different actions is to get same goal - Improvement. They are forms of ongoing effort to make
performance better. There is so many disciplines to improve quality. It depends on product,
company’s structure, time and resources, especially human resources. [1]
Quality improvement has various tools, approaches and techniques and is used
worldwide. They are plain to understand and can used by any employee of the company, e.g. PDCA
cycle or Deming's circle. Of course there is very complex problems or processes and more
complicated (recourses and time consuming) methods is used - Six Sigma, Lean Sigma, Design for
Six Sigma or EFQM excellence model. It is fatal that correct methods and approaches must selected
for the eligible team and implemented correctly to the appropriate process. The successful execution
of methods hinge on information, knowledge and implementation in manufacturing or service
processes.[2]
Because of market grooving every day and becoming more and more competitive,
companies have to give more space to satisfaction of a customer in more diverse ways. Customer
satisfaction is a constant challenge for business, which if managed correctly determines is product
brought and how many times . Understanding and fulfilling customer needs has to be viewed as one
of the key principles for product or service design to take the lead sales. [3]
Quality in business
Creation of product or service, making something valuable means putting in input and
getting output by differentiating input. Because there is big amount different acts upon input, every
act has its influence to final outcome. Furthermore every act effects next step of differentiation and
goes on to massive algorithm. Managing those acts, compering, analysing one’s affect to other can
lead to new insights for improvement ideas and ways to make things better.
There could be two ways to improve product quality – reengineer improve product
feature/s (value that it is giving to the market) or generate new, cheaper, more productive ways of
manufacturing of the product. Both approaches has their methodologies.

3
The real quality is the perceiving what customer feels, the envision of products or
services quality comes from design manufacturer or service provider creates by developing his final
outcome. The late American Management guru Peter F. Drucker said, “Quality in a product or service
is not what the supplier puts in. It is what the customer gets out and is willing to pay for.” [4]
To be attractive to your customer (your product to be attractive) manufacturer had to
meet quality perception of your final customer. It isn‘t easy because customer not always car answer
directly or specify numeric values that makes them happy about the product. In long years when
capitalism was growing rapidly competitiveness grew too and business had to find more ways to
measure and reach better quality to stay in the lead or at least survive in the market. Business with
products which is introduced to the market for a long time had to find a methods to determine and
measure out quality so that products and services would have standards that their customers will
accept.
Measuring Quality
Quality is specification driven – does it meet the set requirements
Quality is measured at start of life – percent passing customer acceptance
Quality is observable by number of rejects from customers
The quality distinctiveness of a product or service can be called as ‘Determinants of
Quality’. They are the characteristics that buyers search for to make a decision - if it is a quality
product or service and buy it. People has many ways to name quality, each of them has core principal
that is important for customer. Manufacturer or service provider has to perceive it to understand and
make decisions to improve product quality. [5]
A degree of excellence
Conformance to requirements
Totality of characteristics which act to satisfy a need
Fitness for use
Fitness for purpose
Freedom from defects
Delighting customers
Is quality standards are clear and defined or known correctly there is last question to
answer – does product has those standards. If yes we can day that product or service is reliable
4
.Reliability means - achieving those quality standards. This means the level of quality produces its
equivalent reliability.
Definition of Reliability
Reliability is making product that correctly will generate value when needed, for the
period required in environment which is expected to be valuable in. For a manufactured product the
reliability comes from its construction, design, way it was manufactured correctly and accurately. For
the service industry, reliability is complexity of processes that is made for customer to reach result in
such a way that customer will be satisfied with time, although no side effects. Reliability for service
is to count and execute process strategically developed in best way with optimal expenses to reach
maximum quality.
Quality is valuable, because when you have it, it brings success to the customer, and
consequentially, to the business the customer buys from.
Measuring Reliability
Reliability is customer satisfaction driven – the User was successful when they used the
commodity. It is measured at the end of lifetime of product and it was functioning and producing
value that it was created for as expected of user or stated by manufacturer or producer. Reliability can
be measured by call outs from customer for maintenance or amount of product returned to warranty
department to be fixed or changed to new one for keeping promise to customer that it has to produce
expected value exchange to money paid by buyer.
Business and manufacturing processes without doubt has to be designed and analysed
daily, weekly, monthly and so forth in order to achieve quality and reliability of product and service
to meet intentions the customer has. Meeting expectations or in some marketing models giving more
value than customer expects will satisfy buyer and will keep him coming and promote in strongest
way – person to person.
Depended on the product or service high level of promotion is in social media. If quality
and reliability overcomes expected results manufacturer could get surprise promotion “bomb” from
customer – 5 stars video review. It could be strategic investment to reduce marketing expenses.
Everything is interrelated.

5
1.1 Eight quality management principles
Customer focus – everything that company does is to depended of their customers and
it is crucial to know the needs of customer. Also future changes and diversification of needs should
be considered. In order to strive requirements and customer expectations should be exceed. Managing
customer focus will increase revenue and market share. If the use of the organization's resources gets
better and more clever customer satisfaction can increase by lowering price or delivering time of the
product. If customer is satisfied he will come again, thus creating customer loyalty which leads to
repeat business deals. [6]
There systematic steps that should be taken to implement quality improvement by customer focus:
Analysing needs and expectations of a customer.
Ensuring that the processes in business are connected to customer needs and expectations.
Inside of company there should be communication of ensuring customer needs and meeting
expectations.
Measuring customer satisfaction and acting on the results.
Managing relationships with customers in accurate, systematic way.
There always have to be balance to ensure satisfaction of both interested parties, customer
and employee, owners.
Second principle is Leadership. People who are leading team makes unity of purpose and path of
for all people in organization. There should be created and kept functioning surroundings which
allows every person to act and move freely in order to be fully involved for achieving common
objectives of the business. Implementing this principle in company people will understand and be
motivated towards the organization's goals and objectives. Leaders generate and unifies ideas and
visions in different levels thus minimizing miscommunication between levels of company.[6]
Applying this principle, company starts to consider interests of all parties including suppliers,
financiers, local communities and society as a whole by establishing a clear vision and setting
challenging goals and targets for the organization's future.
By making and holding common values, fairness, exemplary people at all levels of the
organization excludes worry and creates trust among teams. Also giving Employees the required
resources, exercises, tasks and freedom to act with responsibility and accountability, leads to
inspiration, encouragement and recognition people's contributions.

6
Involvement of people is third principle. People who is creating organization as a whole
have to be fully involved, this enables their abilities to be used for the organization's benefit. It is a
challenge to motivate people, using this principle company will have motivated and committed people
within the team. Involvement increases in contribution for organization's purposes. People takes
responsibility to own results and aspire to take part in contribution to continual improvement.
Principle four is process approach. A wanted result is reached more effectively when
activities and related resources are managed as a process. Profit of process approach principle usually
include lower costs and shorter cycle times through effective use of resources, improved, consistent
and predictable results. By focusing and prioritizing opportunities of the company improves.
Results of integration principle four leads to systematically defining the activities
necessary to obtain a desired result and establishing clear responsibility and accountability for
managing key activities. By identifying and analysing the potency of key activities it becomes easy
to spot the interfaces of main activities within and between the functions of the organization. Also
dealing with the elements such as resources, methods, and materials can improve main activities of
the company. Estimating risk factors, results and impacts of activities on customers, suppliers and
other interested parties gives space to make more accurate planning and decisions with plan of risk
control.[6]
System approach to management – 5th principle. Determining, understanding and
managing common processes as a system leads to the business efficiency in achieving its goals.
Benefits of this principle is integration and uniting of the processes. With ability to focus effort on
the key functions wanted results are achieved faster. Also providing reliance to people who is
interested as to the consistency, effectiveness and efficiency of the organization.
Understanding the interdependencies between the processes of the system leads to
structuring system to achieve the organization's objectives in the most effective and efficient way.
System approach helps structure that harmonize and integrate processes. Giving clear understanding
of the roles and responsibilities which is necessary to achieve common objectives eliminates cross-
functional barriers. By understanding organizational capabilities establishes resource constraints prior
to action.
Continual improvement. By sixth principle the company’s whole execution should be a
main goal of the organization. This type of approach gives advantage through improved
organizational processes. Company’s flexibility to react quick rises with equalization of improvement
activities occurs at all levels to an organization's strategic intent. Implementing this principle should

7
lead to giving people training in the methods and tools of continual improvement and. Creating
objectives for guiding and conceding continual improvement
Principle 7 - Factual approach to decision making. Analyse information and data is
essential to make effective. Decisions have to be informed and based on actual information and will
lead to an increased ability to manifest the virtue of past decisions through reference to factual
records. Ability to review, challenge and change opinions and decisions increases. Applying the
principle of factual approach to decision making typically has to be relied on data and information
sufficiently accurate. In company data becomes available to those who need it. Information has to be
studied using tested and working methods, determining decisions and taking action based on that
analysis, of course intuition and experience is mixed in whole formula to reach maximum potential.
Mutually beneficial supplier relationships. Business consists of large amount of
interested parties as a whole, they are interdependent and a cooperation strengthens relationship,
enhances the ability of both to create value. They all should react and be flexible to changing of
customer needs. Using last principle contribute for optimization of costs and used resources:
Creating relationships balance with short-term gains and long-term considerations.
Connection with same or common goal having partners.
Determining and choosing key suppliers.
Clear and honest interaction.
Giving information also about future plans.
Establishing joint development activities.
Giving recognition about improvements and achievements by suppliers. [6]
1.2 The revolution of techniques and tools for TQM
The history of assurance conformity to desired reliability can be traced to the middle
ages. Craft Guilds has established standards for differentiation for their goods to get good reputation
of their trades. Tradesmen and craftsmen made inspections and analysis of products right on the
workbench. When manufacturing sizes was quite low-volume informal inspection of products,
checking and review of worker was enough. But when industrial revolution made its jump the need
of quality control with more effective operations became necessity.

8
By early 1911 concept of quality started to grow exponential. Frederick W. Taylor
published ‘The Principles of Scientific Management’. His first step was create framework for
improving workers productivity in manufacturing using statistical theory. Taylor created few
concepts which became basic foundation for future theory evolution:
Functional specialization – find and define tasks to be performed under standard
conditions
Process analysis of time and motion to increase productivity
Quality control – final product inspection, as distinct function conducted by person not
directly involved in production process.
Taylor’s complicity can be traced until now, some of this techniques are still used today like
beacon to several engineering tools and cycle time reduction methods. Frederic main goal was
productivity gain while in the 1920s, Dr. Walter Shewhart approached quality control as proactive
function embedded in the process, rather that act and make decisions only on inspection and
measurements of final product. Applying statistical theory to the management of quality, he
developed the first modern control chart and demonstrated that eliminating variation in the process
leads to a good standard of end products [8]. He blaze the trail Shewharts Learning and Improvement
cycle, which is greatly known as continuous steps leading to total quality improvement. These steps
is known as Plan, Do, study, act and in later time adapted by Deming as PDSA cycle.
1.3 Demings PDSA
Dr. W. Edwards Deming took importance for management in both individual and
company level when talking about quality. He stated that 80 % - 90 % of quality misfortune came
from poor management control. It made quite diverse approach for improving quality drawing out
organization-wide cultural change. Deming invited employees and management departments
cooperation approach as the way to achieve high quality. Plan, Do, Study, Act cycle has been
improved taking Shewart’s learning and improvement cycle as foundation of quality improvement
methodology. Its goal is to make it continual improvement by reducing difference between the
customer requirements and process performance.

9
To adopt PDCA cycle occurred highly more effective than using ‘right the first time’
technique. Plan, Do, Study, Act is method to continuously look for better ways to improve. It has
valuable feature that it can be used for manufacturing a product and managing a program. The PDCA
gives space to two kinds of corrective action – temporary and permanent. The temporary is focused
at results by practically tackling and fixing the problem and permanent corrective action, on the other
hand, consists of analysis and reducing the root causes and thus targets the sustainability of the
improved process.[2]
Figure 1. Demings PDSA cycle [9]
Deming developed a number of methodologies, most famous is System of Profound
Knowledge (theories of optimization, variation, knowledge and psychology). This is whole theory is
foundation to contribute for quality crises and also known as Deming’s 14 points of quality - plan
that he believed applied to any size or type organization.

10
Figure 2. Demings PDSA cycle diagram [9].
1.4 Deming’s Fourteen Points of Quality
1) Create constancy of purpose towards improvement of product and service, with the aim to become
competitive and to stay in business, and to provide jobs.
2) Adopt the new philosophy. We can no longer live with commonly accepted levels We are in a new
economic age. Western management must awaken to the challenge, must learn their responsibilities,
and take on leadership for change.
3) Cease dependence on inspection to achieve quality. Eliminate the need for inspection on a mass
basis by building quality into the product in the first place.
4) End the practice of awarding business on the basis of price tag. Instead, minimize total cost. Move
toward a single supplier for any one item, on a long-term relationship of loyalty and trust.
5) Improve constantly and forever the system of production and service, to improve quality and
productivity, and thus constantly decrease costs.
6) Create modern methods of training on the job.
7) Institute modern methods of supervision of production workers. The responsibility of foremen
must be changed from numbers to quality.
8) Eliminate fear, so that anyone can work effectively for the business.

11
9) Eliminate walls between departments. Employees in design, research, sales and marketing,
production, manufacturing, all must work as a team, to anticipate errors of production a product or
service.
10) Eliminate slogans, exhortations, and targets for the work force asking for zero defects and new
levels of productivity. Such exhortations only create adversarial relationships, as the bulk of the
causes of low quality and low productivity belong to the system and thus lie beyond the power of the
work force.
Eliminate work standards (quotas) on the factory floor. Substitute leadership.
Eliminate management by objective. Eliminate management by numbers, numerical goals.
Substitute leadership.
11) Destroy barriers that takes out the hourly worker of his right to pride of workmanship. The
responsibility of higher level worker has to be modified from absolute numbers to quality.
12) Remove barriers that rob people in management and in engineering of their right to pride of
workmanship.
13) Institute a vigorous program of education and self-improvement.
14) All employees of the company has to work to accomplish the transformation. The change is
everybody's job. [9]
Deming was working with Dr. Joseph Juran and he was quite big influencer to the
Japanese quality industry and big figure for evolution of quality management in the U.S. he is creator
of PARETO PRINCIPLE. It states that if you identify vital processes, which is most important you
will get bigger return – 80 % return comes from 20 % effort. Juran wrote famous book about quality
– „Quality control handbook“ and it serves as the basis for Lean, Six Sigma and other important
techniques and methodologies.
1.5 Pareto analysis
This is a tool used to establish priorities, dividing contributing effects into the “vital
few” and “useful many.” A Pareto diagram includes three basic elements:
The contributors to the total effect, ranked by the magnitude of contribution

12
The magnitude of the contribution of each expressed numerically
The cumulative-percent-of-total effect of the ranked contributors. Figure 4 shows a
Pareto table. Figure 5 shows the same data in a Pareto diagram. Note the three basic elements as
reflected in each figure. [10]
Pareto analysis can determine that a incommensurate improvement is reached by
ranking different causes of a problem and by giving most focus on those solutions or items with the
biggest impact. The main idea is that not all inputs have the same or even proportional impact on a
given output. This type of decision-making can be used in many fields of endeavor, from government
policy to individual business decisions.
Figure 3. Pareto table of errors on order forms. [9]

13
Figure 4. Pareto diagram of errors on order forms. [12]
Pareto principle is used in various different areas, it is quite universal. From
manufacturing till human recourse and logistics. Also it has been used in a variety of coaching and
customer relationship management software programs. The business is dependent on the advisor’s
ability to provide excellent customer service, as its fees rely on its customer’s satisfaction.
People that have used the Pareto principle felt enrichment in time management,
productivity and whole client satisfaction.
The Pareto principle can be applied to many businesses, especially those that are client-
service based. It also can be used on a personal level. This method is commonly used to time
management, most of their time is wasted on second rate actions instead of focusing on the most
important tasks.[11]
Dr. Joseph Juran approaches quality from customer point of view. He states that quality
satisfaction is in high level when number of features and values brought from product or service meet
customer expectations, mostly in design, availability, safety and comfort of use. Rather focusing on
just end customer we have to look to whole process more widely. Each person through whole chain,
from inside customers to the final user is and supplier and customer. Numerous theories was
developed but two concepts in particular serve as the basis for creation a traditional quality system
and supports strategic management of quality. Quality trilogy means quality planning, quality control
and quality improvement and his quality planning roadmap.

14
On planning stage, it is crucial to identify who your customers are and analyse out their
expectations. After this management company is able to define the exact needs and functions for
product / process / service / system, etc., and develop them.
On control step there has to be known what has to be measured and set a goals stated
for execution. The data by measuring actual results let us act on the gap between performance and
created goal. In Statistical Process Control (SPC), there are few methods that could be used in the
“control” phase of the Juran Trilogy: Pareto Analysis, flow diagrams, fishbone diagram, and control
charts.
In quality improvement stage there are four different “strategies” for improvement that
can be used to achieve result:
1. Repair: Reactive; fix what’s broken.
2. Refinement: Proactive; continually improve a process that isn’t broken (like the
continual pursuit of perfection in Lean)
3. Renovation: Improvement through innovation or technological advancement
4. Reinvention: Most demanding approach; start over with a clean slate.[12]
Figure 5. Quality improvement roadmap. [12]
Juran identified 8 milestones as integral to a quality planning roadmap:
Determine who are the customers.
Determine the needs of those customers.

15
Develop a product that responds to those needs.
Optimize the product features to meet your needs as well as customer needs.
Develop a process that is able to produce the product.
Optimize the process.
Prove that the process can produce the product under operating conditions.
Transfer the process to operations. [8]
When in 1950s and 60s, quality gurus brought their concepts to Japan where industry emerged
not only had great velocity to adopt and improve but also expounded on what became enduring
concepts. There was born and applied new principle – Kaizen.
1.6 Kaizen principle
It is core principle of quality management in general and is embedded within methods
of total quality management and lean manufacturing. It is like a philosophy, not only greater than any
method but it becomes a way of life, mostly seen in even in business vision an mission statements,
embedded to organizations core values.
Kaizen or continuous improvement is a method where labour at all levels of a business
work hand by hand to achieve every day improvements to the manufacturing process. It combines the
collective talents inside a departments to create a high synergy for improvement.[13]
Kaizen principle is philosophy and action plan in one. Talking from action plan
perspective Kaizen is about engineering events focused on improving tactical places within the
business. These events involve teams of employees at all levels, with an especially strong
accentuation on involving plant floor employees.
As a way of life, Kaizen is about creating environment where all people working with
each other are working with one idea, looking out, discussing and making improvements to the
organization. In business who truly adopts lean philosophy, it becomes a core type of thinking for all
levels of the company employees – from managers to plant floor workers.
Kaizen employing these key principles:
Every is a key word in Kaizen: improving everything that everyone does in every aspect of
the organization in every department, every minute of every day.

16
Evolution rather than revolution: making 1% improvements to 100 things is more effective,
less disruptive and more sustainable than improving 1 thing by 100% when need becomes
critical.
Everyone involved in a process or activity, however apparently insignificant, has valuable
knowledge and participates in a working team or Kaizen group.
Everyone is expected to participate, analysing, providing feedback and suggesting
improvements to their area of work. Management facilitates this empowerment.
Every employee is involved in the running of the company and is trained and informed about
the company, fostering commitment, interest and job satisfaction. [8]
1.7 Kaizen events
1. Set goals and provide any necessary background.
2. Review the current state and develop a plan for improvements.
3. Implement improvements.
4. Review and fix what doesn’t work.
5. Report results and determine any follow-up items.
After 1970’s success of Japanese industry of implementing quality management American
industry was forced to take example and implement know how and the knowledge to their industry
as well. Mostly in in the automobile and electronic sector because it industry and product demand
skyrocketed ant Japanese product started to grab bigger and bigger amounts of market shares offering
higher quality, production time and of course price of product. In U.S. it became economic crisis and
organizations and whole industry had to adopt and join quality movement. This led to bigger and
faster methodology improvement and development. The book Total Quality Control by Armand V.
Feigenbaum contributed to conceptual foundation and practical application of QM. He is considered
the originator of total quality management. Feigenbaum stressed a systems approach to quality and
focused on the costs of quality as separable into costs for prevention, appraisal and failures. Through
the late 70s and 1980s, Philip B. Crosby emerged as a quality leader, with seminal concepts such as
“Quality is Free” and “Zero Defects”. Crosby based his quality improvement process on “four
absolutes of quality”:

17
Quality is conformance to requirements
The system of quality is prevention
The performance standard is zero defect
The measurement of quality is the price of non-conformance
1.8 Implementing Quality
As many commonalities as there are in the philosophies of the “quality gurus”, it’s important to
realize there are also contradictions. As a result, there are MANY methods for quality improvement
in use today that cover product-, process- and/or people-based improvement, including:
ISO – Guidance on use for process improvement and process capability determination.
QFD – quality function deployment, also known as the House of Quality approach, that focuses
on customer wants or needs in the (re)design of a product or service.
Kaizen – Japanese for change for the better; the common English term is continuous
improvement.
Zero Defect Program – created by NEC Corporation of Japan, based upon statistical process
control and one of the inputs for the inventors of Six Sigma.
Six Sigma – combines established methods such as statistical process control, design of
experiments and failure mode and effects analysis (FMEA) in an overall framework.
PDCA – Shewhart / Deming's plan, do, check, act cycle for quality control purposes. Six Sigma's
DMAIC method (define, measure, analyze, improve, control) may be viewed as derivation of this.
Taguchi methods — statistical oriented methods including quality robustness, quality loss
function, and target specifications.
The Toyota Production System – reworked in the west into “Lean manufacturing”.
TQM – total quality management is a strategy aimed at embedding awareness of quality in all
organizational processes. First promoted in Japan with the Deming prize, it has been adapted in the
U.S. as the Malcolm Baldrige National Quality Award and in Europe as the European Foundation for
Quality Management award (each with their own variations).

18
BPR – business process reengineering, a management approach aiming at 'clean slate'
improvements (abandon existing practices). [8]
It has to be accurate strategic planning and analysing which methodology is best in one or different
way of business, also we have to keep in mind recourses to needed to reach results implementing
theory in to practice, does it align to goals and budget of the company.
For example Six sigma is a methodology which was created mobile company Motorola in 1986
with the purpose to improve their business by eliminating defects.
It has since evolved into a broadly used organizational approach that focuses on reducing
variations and achieving output improvements through problem solving. Six Sigma practitioners
utilize the DMAIC method (define [the problem], measure, analyze, improve, control). Features that
distinguish Six Sigma from earlier quality initiatives include:
• Achieving measurable financial returns from the project.
• Increased emphasis on passionate management leadership and support.
• A hierarchy of “Champions,” “Black Belts,” ‘Green Belts’, etc. to implement the Six Sigma
process.
• Making decisions on the basis of verifiable data, rather than assumptions.
Six Sigma is named after a statistical concept where a process only produces 3.4 defects per
million opportunities (DPMO). Six Sigma can therefore be also thought of as a goal, where processes
not only encounter less defects, but do so consistently (low variability). Basically, Six Sigma reduces
variation, so products or services can be delivered as expected reliably. [14]
The Six Sigma is based on statistical concept: defective items be minimized by maintaining 6
standard deviations (6 sigma’s) between the process mean (average) and its upper and lower
specification limits. Six sigma also accounts for the tendency of processes to degrade over the long
term. A six sigma process can tolerate a “shift” of 1.5 standard deviation and still maintain a safety
cushion between the process mean and its specification limits.

19
Figure 6. Six Sigma visualization
Six Sigma employs many widely used quality management tools, such as Design of Experiments,
Pareto charts, Chi-square test, Cost-benefit analysis, root cause and regression analyses, and more.
While the approach has achieved significant bottom-line results for many organizations, it has also
been criticized for potential negative effects such as ignoring the customer, stifling creativity
(especially in research) and being oversold or inappropriately applied by consultants. Still Motorola
managed to reach high performance and dominate market for the start of mobile business.
Some of methodologies cover each other and makes synergy to get better results. One of the
options is Lean Six Sigma.
1.9 Seven unneeded activities in manufacturing
All companies has one or more problems, but most painful is effectiveness, being more
accurate – absence of effectiveness. Word effectiveness in Lean system can be translated to -
unneeded activities, which is not bringing value to the company and customer isn’t willing to pay for
it elimination. Japanese call it “muda” [15]

20
Muda (無駄)
Eliminating waste is away to increase company efficiency. Add value to the product or
decrease waste. Word "muda” is waste in Japanese. Toyota company engineer Taiichi Ohno –If you
want to eliminate muda’s you have to know where and what they are. For every muda there is strategy
to eliminate it and make process more effective and sustainable. [15]
Overproduction - Making product which is not needed or cannot be sold in normal time
period. Overproduction is expensive to manufacturer because investment done and revenue not
coming back. Toyota system is called Just in time (JIT), every piece and part is made only then is
needed. To stop overproduction the production has to be stopped to locate problem. Main principal
is to plan and manufacture only what is needed and what can be sent or sold on sight.
Waiting - When part is not moving or to continue manufacturing process we need to
wait. Usually more than 99% products waits in front of other part to be tooled. This occurs from bad
process management, long distance from shops. Goldratt in his book “Theory of Constraints” said
that one hour downtime of main shop means wasted the whole hour for company and cant be brought
back. Connecting all processes in mind that each feeds the other can drastically reduce waiting.
Logistics - Moving product is also process, thus its not generating value to the product.
Vice versa usually transportation can make it worse. Reducing transportation isn’t possible, but
making a map of transportation can help to find most optimal way to reduce it.
Inappropriate treatment - Most of organizations is using expensive, high accuracy tools
and machinery even if they can get same results with simple tools with good management of the
placing for the shops. Toyota is well known for cheap tool automatization, perfect maintenance,
mostly for of old ones. Less investment means less loss.
Unneeded inventory - Unneeded inventory – result of overproduction and waiting. It
shows problems in manufacturing shops which has to be identified and taken care of. It expands the
time for product completion, uses much space, reduces communication.
Unneeded movement - The word for this would be – ergonomics. There has to be
counted every movement, eliminated unneeded motion, not contributing or harder than possible
movements. (Labour actions).

21
Defects - Direct effect to manufacture success or failure has defected parts or products.
All uncalculated and not expected time to rebuild or correct mistakes brings additional warehouse
space, repeated check for quality, additional planning, loss of productivity. Common expenses in
industry is defect riddance.
Unrealized labour - It is additional eight factor. In company there is working not just
active hands and legs of worker, but also productive, creative and seeking fulfilment people.
Managing creativeness of labour there can be eliminated other seven Muda’s [16].

22
2. APPLICATION OF PRODUCT QUALITY IMPROVEMENT
2.1 Introduction to Bio-energy
Bioenergy Group was founded in year 2003. It consists of companies that consult
farmers, produce and import bio fertilizers for soil ant plants.
It manufactures biological products that increase soil fertility, restore its natural balance
and increase plant productivity. Its main manufactured products consist of bacteria that fix nitrogen,
release phosphorus, increase potassium absorption and fight with plat diseases that are caused by
fungies.
The season of 2014 was a breaking point of Bio-energy, they started to increased
producing rates and invest in new technologies for even better quality of their products. In 2014
exported more that 1000 tons of bio fertilizers to 11 different countries.
Products are tested and used in many geographic and climatic conditions: from short
vegetation periods in Siberia up to hot and log summers in Bulgaria. Bio fertilizers are used in wheat,
rape, sugar beat, barley, corn crops. Trials also show great results in vegetables and fruits. For creating
products Bio-energy cooperate with 4 universities, more than 5 different laboratories and a huge
group of scientists. They are always looking for new solutions for the biggest problems that appear
in crop growing. 3 of our products are awarded as the best innovative fertilizers in the biggest agro
exhibition in Baltic region “Ka pasesi...”.
Company’s main goal is to restore natural balance in the soil and increase its fertility.
The product offers unique high quality bio fertilizers that can be used in all sorts of crops regardless
of the climate conditions, a business opportunity where the client is happier because it helps him to
grow a more economically efficient harvest, training of staff of farmers and helps in trials and
marketing.

23
Figure 7. Bioenergy advertisement picture.
2.2 The need of bio fertilizers products
The creation of a new product is responsibility of research and development division,
where microbiologists working together with team of agronomists.
For some farmers the biggest problem it is phosphorus deficiency, form some the
biggest problem is to low economical efficiency because of big inputs, for some moisture problems.
It is impossible to solve all problems at once, or even to solve one problem with a single use of a
biological fertilizer. It is a step by step process. For example: A Farmer has a filed with a high pH
level which is more than 7,5. Every year he is giving high amounts on NPK fertilizer but the plants
are always showing phosphorus deficiency. When the pH level is higher than 7 phosphorus in the soil
is being fixed by calcium. Calcium phosphate is a form of phosphorus that is not available for the
plants therefore plants show phosphorus deficiency. [17]
The solution came - FOSFIX is a bacterial fertilizer than consists of bacteria bacillus
megaterium var. phosphaticum, which after applied in the soil starts to release the plant unavailable
phosphorus and transform it to plant available form. After using FOSFIX within 2 months you can
increase up to 30% of plant available phosphorus in the soil. It is a very high percentage that can be
achieved not only in the trial stations, but more than 4 years of experience of reaching this number in
the farmers fields as well.
FOSFIX does not regulate the pH level of soil, this means if farmer wants to get the
same effect of a bigger amount of plant available phosphorus he should use it every year. Of course
to monitor those processes and make decisions regarding nutrition inputs Bio-energy always
recommend to have soil analysis done.

24
Today farmers with biological fertilizers can optimize their plat nutrition system,
decrease NPK inputs, reduce the amount of pathogens in the soil, improve plant residue
mineralization, improve soil quality, increase their yields and economical efficiency. [17]
As the agricultural technologies always improve, the BIOENERGY LT try to achieve
new thing as well. There was question created how to increase quality of these products and make it
better and of course more competitive in the market.
Because product is manufactured in biological basis this means that company sells a
living organism – bacteria. Manufacturing of bio-fertilizers starts in laboratory where clean and sterile
environment is main objective to produce product.
Process is quite simple first steps is to manage to grow small amount of bacteria family
in tubes. Later, when bacteria reaches stage of maturity it is introduced to various medium for
reproduce and sleep stage. This process is very sensitive to environment changes and reacts to
smallest temperature changes or introduction to outside substances.
After bacteria is in sleep stage it waits to be used. When is applied to the soil it reacts
to O2 and starts doing its nature process – to fixate nitrogen or release potassium (depends on which
bacteria is used).
Figure 8. Manufacture of bio fertilizers process chart.
•Bacteria family start
•Juvenescencestage
Laboratory
•Feeding stage
•Maturity stage
•Sleep stage
Incubator•Mixing with medium
•Puring up in canisters
•Sealing packages
Packaging
•Sales department
•Logistics
Distribution
•Introduced to the soil
Customer

25
2.3 The need for quality improvement
After 2015 market increase company had got solid amount of revenue. Ass market
increased as so and amount of competitors. In order to keep up in first place in Baltic states and reach
other markets product quality had to be improved as well.
Actions taken to improve quality started in every level of product manufacturing, also
to sales, marketing, logistics and human resources. But mainly the focus on quality improvement was
gathered to product quality improvement by reengineering of product manufacture plant. Studies was
done in more detailed way in different soils, different countries to study and make mixture more
active when process is used. After laboratory researches and analysis of results everything was
improved but one thing – packaging.
Because product is biological (living organisms) carried to final customer, the
environment in which it is held has quite big influence to final product quality. For company Bio-
energy, they choose plastic containers. There is two types for packaging (colour is not important) 10
litres and bigger one – 20 litres.
Figure 9. Canister for bio fertilizers packaging

26
2.4 Analysis of final product reliability (Pareto analysis)
Some of customers did not get expected result after using the products and was disappointed.
When the steps was taken to start analyse to improve quality, final product activity/reliability had to
be checked.
Plan for product quality check and increase
1. Analysis of a product quality with sterilization of packaging containers. Request a competent
facility (probably university with faculty of chemical science, KTU, ASU, ect.)
Make a research on bacteria efficiency placed in canisters with normal medium and sterilized one.
2. If sterilization makes a difference of final product quality - make presentation on need of
sterilization subdivision. Get approval.
3. Preparing for integration. Appoint person to be trustworthy and accountable for creation,
integration and management of sterilization subdivision.
4. Analysis of sterilization methods. Cooperating with scientists of chemistry and biology analyze
sterilization methods. Find devices needed. Request best price.
4.1 Choose best option.
4.2 Counting price of specific method integration.
4.3 Investment and value created ratio evaluation.
4.4 Ordering devices needed.
5. Creating subdivision. Building or managing manufacture process to integrate in premises for
subdivision.
5.1 Lean calculations for manufacturing process flow
5.2 Manufacture engineering parts. Create unique devices to make sterilization process fast and
efficient.
6. Adopting packaging division with sterilization chamber.
(4 and 5 closely interacts with each other, should be started in the same time)

27
As it was suspected the packaging canisters had affect to final product quality. There where taken
100 final packages tested bacteria activity level of substance.
Research in agronomical laboratory shown bacteria activity dropped in 15 canisters (table 4.) by
18 % after filling it to packaging containers. This means not all of, but significant amount of product
goes to customer not in full reliability and do not create value as it was calculated in sales stage when
customer is discussing with agronomist of sales department.
Figure 10. Pareto analysis for final product realibility.
77 % 77 % 69 % 77 %
84 %
77 %
67 %
80 % 68 % 71 % 80 % 80 %
75 %
72 %
70 %
Bac
teri
a ac
tivi
ty a
fter
pac
kagi
ng
(%)
Package 1 to 100
Pareto analysis. Product reliability test (bio fertilizers)
Azofix Fosfix90 % Norm

28
These non-compliances occurred in 15 canisters because of main 4 reasons:
Table 1. Reasons of product quality loss
Final product reliability Reason
77 % Muddy inside of packaging container
80 % Refuse in canister
68 % Muddy inside of packaging container
77 % Muddy inside of packaging container
69 % Not fully closed cap
71 % Muddy inside of packaging container
77 % Muddy inside of packaging container
80 % Holey canister
80 % Muddy inside of packaging container
84 % Muddy inside of packaging container
75 % Muddy inside of packaging container
77 % Refuse in canister
72 % Muddy inside of packaging container
70 % Muddy inside of packaging container
67 % Muddy inside of packaging container
1. Not fully closed cap allows air to get inside and react to product. Also when canisters are carried
to final customer it can spill around and make it dirty and reduces visual value of the product. Just
one was found dooring test.
2. Large refuse were found inside container mixed with product. With first perspective it seems that
refuse has organic origin – fragments of wood. The Action was taken and manufacturer of packaging
containers was informed with photos and notice of unwanted substances in canisters.
3. Also holey canister was noticed in examination of containers. Holes was small, but still allows air
to get in container thus activating product before it reaches and is used by customer loosing vast
amount of reliability. Some of product spilled through holes and reduced visible value of the product.

29
4. 73,3 % of canisters that was noticed with product quality loss had greasy medium inside which
reacted with product and activated bacteria before it reaches the soil. Main problem found – inside of
canisters had to be cleaned before pouring product and sealing it.
Bio-energy is not manufacturing containers, it buys them from Poland plastic manufacturer
company. It seems that the engineering process of those containers includes high levels of heat and
aggressive medium. In micro level some of chemical waste is left on inside walls of containers after
casting it.
The bacteria reacts to it and some of it dies, some become active (take in mind that it has to be in
sleep stage to have full strength when introduced to the soil). That means when product is filled in
containers it loses its quality. Customer gets product not in full value. He can not feel it because there
is no practice to compare it. Furthermore quality can be increased from manufacturers decision and
make product produce bigger value, making customer more satisfied and tear of competitors.
2.5 Possibilities to increase final product quality
The aim of project is to find solution for bio product sterile packaging. Many of bio product
are small or very small, micro level product like bacteria, spores micro level organism which is used
in various situations, as an end product or middle stage input to get final product or desired outcome.
All microorganisms has to be placed in some kind matrix (environment) to live, develop and
be prepared for function it was created. There has to be perfect food, temperature conditions, no
interaction with other aggressive substances that could harm product properties.
This type of bacteria is kept in 10 or 20 litter containers as final product and is distributed to
11 countries so far. In 2014 there was 1000 tons sold of this type of bacteria.
If by this projects implementation side by side would go management of customer waste
collecting, double value can be achieved. Canisters are made of plastic and could be reused.
The solution preventing impact is to change or clean containers. Choosing different container
is considered too expensive. Option for packaging would be glass bottles, which is very vulnerable
and price of these many packaging products would increase final price of the product.

30
Cleaning was chosen to be practical to reach desired outcome. Because it is in very
small, micro level, washing with simple water isn’t an option ether. Best method to clean inside of
containers is – sterilization.
Figure 11. Canister technical drawing and measurements.
2.6 The basics of sterilization
Sterilization is the process of destroying all kinds of microbial flora, including their spore
forms, and viruses through physical or chemical influences. It is considered to be sterile if the
probability of its bioburden is equal to or less than 10 to the power of -6. Sterilization should be
performed on medical products that come into contact with the patient's blood, contacting the wound
surface and contacting the mucosa and may cause damage to its integrity. Sterilization is a complex
mm mm mm mm

31
process, for the successful implementation analysis of sterilization product method has to be
considered.
Sterilization is a complex process. It is imperative that healthcare workers and technicians
involved in the reprocessing and sterilization of medical devices have a thorough knowledge and
understanding of the scientific principles and methods of sterilization utilized in today’s health care
settings.
To make sterilization process efficient main conditions and considerations has to made:
1) The sterilants and sterilizing equipment must be validated and appropriate in design and
operation to achieve the correct combination of temperature and sterilants combination to
be lethal to microorganisms.
2) Product or devices has to be properly cleaned from bioburden to make sterilization
effective in maximum level
3) To reach maximum sterilization there has to be conditions created to contact surface with
sterilant.
All methods of sterilization are made to reduce or eliminate microorganisms, that’s why
people using this method to clean surface have to have in mind that it could be harmful to person. To
reduce risk associated with different sterilants and equipment can be forsing staff education, using
suggested precaution, established policies and procedures and following the producer instructions for
use. [19]
2.7 Sterilization Methods
Sterilization is carried out by physical methods: steam, air, radiation, using infrared radiation,
and chemical methods: solutions of chemical agents and gases (In recent years, ozone (sterilizer C0-
01-SPB) and plasma sterilization ("Sterrad" installation) have been used, installations based on
ethylene oxide, formaldehyde vapors have been used. The choice of method of sterilization of
products depends on their resistance to sterilization methods.

32
Steam sterilization
Sterilization is carried out by physical methods: steam, air, radiation, using infrared radiation,
and chemical methods: solutions of chemical agents and gases (In recent years, ozone (sterilizer C0-
01-SPB) and plasma sterilization ("Sterrad" installation) have been used, installations based on
ethylene oxide, formaldehyde vapors have been used. The choice of method of sterilization of
products depends on their resistance to sterilization methods.
Steam sterilization
By a steam method, medical products, parts of instruments and apparatuses made of corrosion-
resistant metals, glass, surgical linen, dressing and suture material, rubber products (catheters, probes,
tubes), from latex, plastics are sterilized.
In the steam method, the sterilizing agent is water saturated steam at an excess pressure of
0.05 MPa - 0.21 MPa (1.1-2.0 bar) at a temperature of 110- 134 °C. The sterilization process takes
place in sterilizers (autoclaves). The complete cycle is from 5 to 180 minutes.
Despite the fact that steam treatment is quite effective, it can not always provide sterilization
of the tool. The reason for this is that the air cavities in the objects to be sterilized can serve as a
thermal insulator, such as dental turbine tips. To solve this problem in autoclaves, the function of
creating a preliminary vacuum in the pulsed mode is used. Advantages of the method - short cycle,
the possibility of sterilization of non-resistant products, the use of various types of packaging. The
disadvantage is the high cost of equipment.
This type of sterilization is useful for small products and is active for outside of product.
Unfortunately unsuitable for canisters inside sterilization. One of the key conditions is amount that
can be sterilised in one time. Processing one by one is not an option.

33
Figure 12. Canister technical drawing and measurements
Dry air sterilization
Sterilization with the air method is carried out by dry hot air at a temperature of 160 °,
180 ° and 200 ° C (table). The dry air method sterilizes medical products, parts of instruments and
apparatuses of corrosion-resistant metals, glasses marked 200 ° C, products made of silicone rubber.
Before sterilization by air, the products are pre-sterilized and must be dried in a drying
oven at a temperature of 85 ° C until the visible moisture disappears. The full cycle is up to 150
minutes. The advantage of hot air sterilization compared to the steam method is the low cost of
equipment. Disadvantages are: a long complete sterilization cycle (at least 30 minutes), the danger of
damage to instruments by high temperatures, the inability to sterilize tissues and plastics, only one
control parameter is temperature, high energy costs.

34
Figure 13. Dry heat sterilization chamber [25].
Gas sterilization method
For the gas method of sterilization, a mixture of ethylene oxide and methyl bromide is
used in a weight ratio of 1: 2.5 (OB), ethylene oxide, formaldehyde vapor in ethyl alcohol, ozone.
Sterilization with a mixture of OB and ethylene oxide is carried out at a temperature of
not less than 18 ° C, 35 ° C and 55 ° C, in pairs of formaldehyde solution in ethyl alcohol at a
temperature of 80 ° C. Before gas sterilization, the products are dried after pre-sterilization treatment
until the visible moisture disappears. Removal of moisture from the cavities of products is carried out
using a centralized vacuum, and in its absence by means of a water jet pump connected to a water
tap. When sterilizing OB and ethylene oxide, air is removed to a pressure of 0.9 kg/cm2. When using
a portable device after the end of sterilization it is kept in a fume hood for 5 hours.
Ozone produced in the ozone sterilizer C0-01-PBS sterilizes products of simple
configuration from corrosion-resistant steels and alloys, unpackaged at a temperature of no more than
40 ° C. The sterilization cycle (access to the regime, sterilization, decontamination) is 90 minutes.
After sterilization, the instruments are used for their intended purpose immediately without additional
ventilation. The shelf life of the products is 6 hours, subject to the rules of asepsis. When packaging
in sterile two-layer cotton fabric, the sterility period is 3 days, and when kept in a cell with bactericidal
irradiators - 7 days.

35
Because of strict conditions and very big aeration time this sterilization method doesn’t fit
existing conditions to sterilize fertilizers packages.
Infrared sterilization
New methods of sterilization are reflected in the sterilizer of infrared sterilization, intended
for sterilization treatment of metal medical instruments in dentistry, microsurgery, ophthalmology
and other fields of medicine.
The high efficiency of the IR sterilizing effect ensures complete destruction of all
microorganisms investigated, including such as: epidermidis, aureus, sarina flava, Citrobacter
diversus, Str. Pneumonia, Bacillus cereus.
Fast, within 30 seconds, the output to the mode of 200 ± 3 ° С, a short cycle of sterilization
treatment - from 1 to 10 minutes, depending on the chosen regime, along with low energy intensity.
Sterilizer IR sterilization is easy to operate, does not require specially trained operators, and
the method itself refers to environmentally friendly technologies. Unlike steam, air or glasperlene
sterilization, IR sterilization does not have an aggressive effect of the sterilizing agent.
Sterilization with chemical agents
This method is used for the sterilization of products whose materials are not thermally stable,
and the application of other officially recommended methods is impossible. The disadvantage of this
method is that the products can not be sterilized in the package and after the end of sterilization they
must be washed with a sterile liquid (water or 0.9% sodium chloride), which, if the rules of asepsis
are violated, can lead to secondary seeding with microorganisms of sterilized products.
For chemical agents, sterile containers of glass, heat-resistant plastics that can withstand steam
sterilization, metals coated with enamel are used. The temperature of the solutions, with the exception
of special regimes for the use of hydrogen peroxide and the lysoformin 3000, should be at least 20 °
C for aldehyde-containing agents and at least 18 ° C for the remaining agents.
The chemical method of sterilization is widely used to process "problematic equipment", for
example, for equipment with fiber optics, anesthesia equipment, pacemakers, dental instruments.
Such modern sterilizing agents as glutaraldehyde, orthophthalic and succinic acid derivatives,
oxygen-containing compounds and peracetic acid derivatives in the mode of express sterilization and
"Classical sterilization" are used.
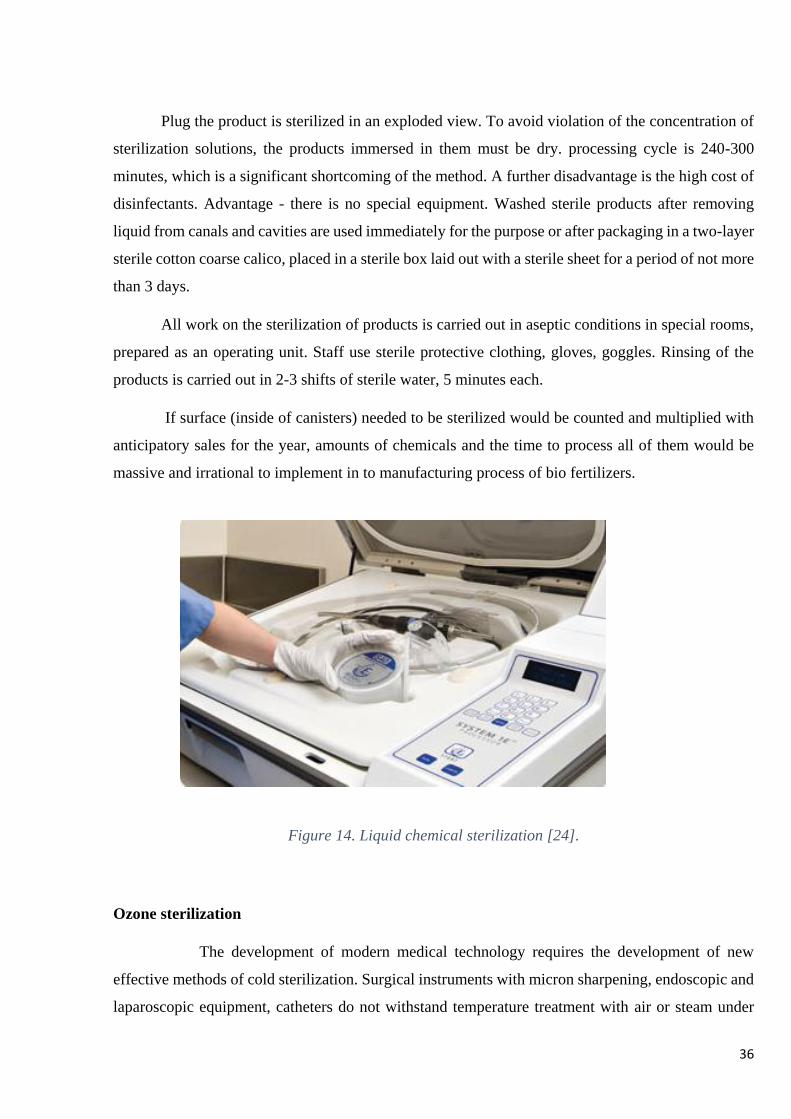
36
Plug the product is sterilized in an exploded view. To avoid violation of the concentration of
sterilization solutions, the products immersed in them must be dry. processing cycle is 240-300
minutes, which is a significant shortcoming of the method. A further disadvantage is the high cost of
disinfectants. Advantage - there is no special equipment. Washed sterile products after removing
liquid from canals and cavities are used immediately for the purpose or after packaging in a two-layer
sterile cotton coarse calico, placed in a sterile box laid out with a sterile sheet for a period of not more
than 3 days.
All work on the sterilization of products is carried out in aseptic conditions in special rooms,
prepared as an operating unit. Staff use sterile protective clothing, gloves, goggles. Rinsing of the
products is carried out in 2-3 shifts of sterile water, 5 minutes each.
If surface (inside of canisters) needed to be sterilized would be counted and multiplied with
anticipatory sales for the year, amounts of chemicals and the time to process all of them would be
massive and irrational to implement in to manufacturing process of bio fertilizers.
Figure 14. Liquid chemical sterilization [24].
Ozone sterilization
The development of modern medical technology requires the development of new
effective methods of cold sterilization. Surgical instruments with micron sharpening, endoscopic and
laparoscopic equipment, catheters do not withstand temperature treatment with air or steam under

37
pressure. Limited use of temperature treatment is associated with the widespread use in modern
medicine of polymers, optics, glue compounds. Plastics are also used for internal and external
prosthetics in dentistry, facial surgery, traumatology, etc.
At present, liquid and gas methods of cold sterilization based on highly toxic chlorine-
containing compounds, ethylene oxide, formaldehyde, hydrogen peroxide are used in the practice of
medical and prophylactic institutions, the use of which is associated with the following problems:
A long sterilization time (4-6 hours).
Difficulties in recycling of reagents, their adverse impact on the environment.
The need to remove traces of sterilizing agent from tools and equipment by washing in sterile
water or by prolonged aeration with sterile air.
Adverse effect of a number of sterilizing substances and their derivatives on the health of
personnel performing sterilization.
The use of liquid sterilization of medical instruments is also limited by the inability to use
packages and, therefore, simple methods of maintaining the sterility of products until they are
used.
Ozone sterilization has a low gas temperature during the sterilization cycle (up to 40 °
C), has a low energy consumption (120 W with a sterilization chamber volume of 10 liters), a
relatively short duration of the sterilization cycle, is easy to operate, can be installed directly in the
doctor's office, does not require consumables. Materials and chemically resistant disinfectants to be
recycled, does not require the washing of products or aeration after the sterilization cycle. Sterilization
occurs in ozone, which has a high oxidizing ability. Ozone is obtained from atmospheric oxygen and
at the end of the sterilization cycle is converted to oxygen.
Ozone sterilizer is successfully used in departments and offices of dentistry, laparoscopy,
endoscopy, microsurgery, urology, plastic surgery, reflexology, etc. For the sterilization of medical
instruments. Ozone sterilization cycle time is approximately 4.5 hours, at a temperature of 30 °C –
35 °C, unfortunately takes too long to implement to this project.

38
Figure 15. Ozone sterilization process explanation [25]
Hydrogen Peroxide Sterilization
This method using hydrogen peroxide creates a plasma cloud. This agent sterilizes by
oxidizing key cellular components, which inactivates the microorganisms.
Plasma cloud exists only when engine to generate it is turned on. When it is switched off it
creates water vapor and oxygen, arises in no toxic residues, harmful emissions, or the need for
environmental monitoring. Temperature for hydrogen peroxide sterilization has to be maintained in
the 40-50°C range, which makes it quite suitable for use with sensitive to heat and moisture
environment. [21]
Examined basic principles and methods of sterilization I have come to conclusion of best
method in my situation - Hydrogen Peroxide Sterilization. This method is safe and environment
friendly too. Consumables are not explosive, inflammable or toxic.

39
Hydrogen peroxide sterilize method has some minuses too. It is a strong oxidant, some
materials can not be reacting with it, such as paper products. Paper can not be sterilized because of
cellulostics in which the hydrogen peroxide would be completely absorbed by the paper.
This method does not require any additional material or lodging preparation, it is completely
nontoxic to engines, computers or other equipment. This allows to engineer easy chamber design for
sterilization process implementation. [17.]
After researching the available alternatives, the plant decided to investigate a dry
fogging approach. The technology selected — the Minncare Dry Fog (DF) System — produces very
fine droplets of disinfectant that are dispersed throughout a room. The disinfectant used by this system
is a proprietary cold sterilant solution consisting of a stable mixture of peracetic acid and H2O2 that
is bactericidal, fungicidal, virucidal, and sporicidal. During the DF process, the humidity level of the
room to be treated is first raised to 80%. Then the dry fog solution is evenly and completely dispersed
in the room.
The Minncare Dry Fog 2 system provides an easy to use, high technology solution for
clean room and critical area fogging. The combination of our highly effective Minncare Cold
Sterilant chemical and our state of the art Dry Fog delivery system enables users to
rapidly and safely deliver Minncare vapor to even the most complex areas. Its sanitary and
autoclavable design will permit its use in the most critical areas within pharmaceutical and other
industries concerned with maintaining the utmost levels of sterility.
The Minncare Dry Fog 2 System produces and ultrafine droplet size that tends to bounce
off of hard surfaces and thus avoid excessive condensation, corrosion and surface wetting issues
associated with a fine mist bio-decontamination procedure.
Figure 16. Dry fog droplet action

40
A single DF unit can disinfect rooms up to 1,000 cubic meters in size. Figure 26 shows
a sample DF system setup. The disinfectant droplets are only 7.5 microns in diameter, so they bounce
off solid surfaces and resist the excessive condensation, possible corrosion, and surface wetting
commonly associated with other fogging or manual cleaning procedures. The droplets eventually
evaporate and the vapor penetrates normally in accessible areas resulting in a more thorough
disinfection process. The chemical is fully biodegradable, requires a extremely short process time,
and is much less corrosive than aldehyde-based materials.
Dry fog system will be used not also to disinfect product packages, but make laboratory
sterile. It is hard to calculate what part of price goes to sterilization chamber. The clean working
environment for biological product is crucial and can not be ignored. Companies using methods and
ways to improve their product event without direct revenue count, in long run will reach higher quality
and trust of customers leading to bigger market share and stronger competitiveness.
Figure 17. Dry Fog 2 System [26].
2.9 Sterilization quality Assurance
Control of sterilization efficiency is carried out by physical, chemical and
bacteriological methods. The physical methods of control include: measurement of temperature,
pressure and time of application of sterilization.

41
For chemical control over decades, chemical substances having a melting point close to
the sterilization temperature were used. Such substances were: benzoic acid - for steam sterilization;
Sucrose, hydroquinone and some others for controlling air sterilization. If there was a melting and a
discoloration of these substances, the result of sterilization was considered satisfactory.
For this project there after sterilization chamber manufacturing simple ICPVS-Medtest
will be used to check level of moisture inside of canisters. [17]
2.10 Sterilization chamber implementation in to existing manufacturing process
The conditions are quite simple, in to existing manufacturing process, before purring in to
containers and moved to logistics sector, there has to be designed one more step for sterilization of
containers before final product is packaged. The manufacturing plant is quite big and not all space is
used, it allows easy implementation of additional division without moving or redesign existing
process and stopping manufacture.
The manufacturing process of bio fertilizers in Bio-energy already has lean system in order.
To add additional division to the plant and process makes sterilization chambers design bit difficult,
but hopefully sterilization of packages effects just last stages of manufacturing process, not touching
any existing algorithms. I am adding just one more chamber before pouring final product to canisters.
The sterilization gas is poured in to the chamber and effects everything around it. The problem occurs
from design of canister. The surface to be sterilized is inside and the only place to get in is small 52
mm diameter pouring cap. The idea is to design structure of pipes that on one side will be hocked up
with intake of sterilization gas and releasing through outlets where canisters will be hanged by
pouring caps. This way all the gas will go through structure and fill canisters inside with sterilization
gas and will make its purpose.
The research to for design has two stages:
1. Create structure design to fill chamber with many canisters ass possible to make process
maximum efficient in amount which can be sterilized on one circle.
2. Check flow of sterilization gas in outlets of pipe structure to be sure that all canisters will
get enough gas and will be sterilized fully in one process circle.

42
3. STERILIZATION CHAMBER DESIGN
3.1 Pipe structure design
The sterilization chamber has erea of 10,22 sq. meters. Measurements of inside of new lodging
is 220 cm height, 190 cm width. The goal is to create optimal way to sterilize maximum amount of
canisters in one process. The measurements is clear to use maximum height and width.
The constant is size of canisters:
Table 2. Canisters measurements
Canisters size
Lenght 300 mm
Widht 258 mm
Height 377 mm
To optimize the process there is maximum 6x6 canisters fitting on one side of structure,
which makes 36x2 (two sides) – 72 in total on one structure. By these measurements full structure
fits in the chamber almost perfectly, which means task one is complete – make optimal design to fit
maximum canisters using all the space.
The design is chosen to have main pipe in bigger diameter to spread sterilization gas
faster trough smaller ones. Air debit has to be around 400 m3 per hour so small pipe would overcharge
engine and not all or just small amount of few would get enough gas.
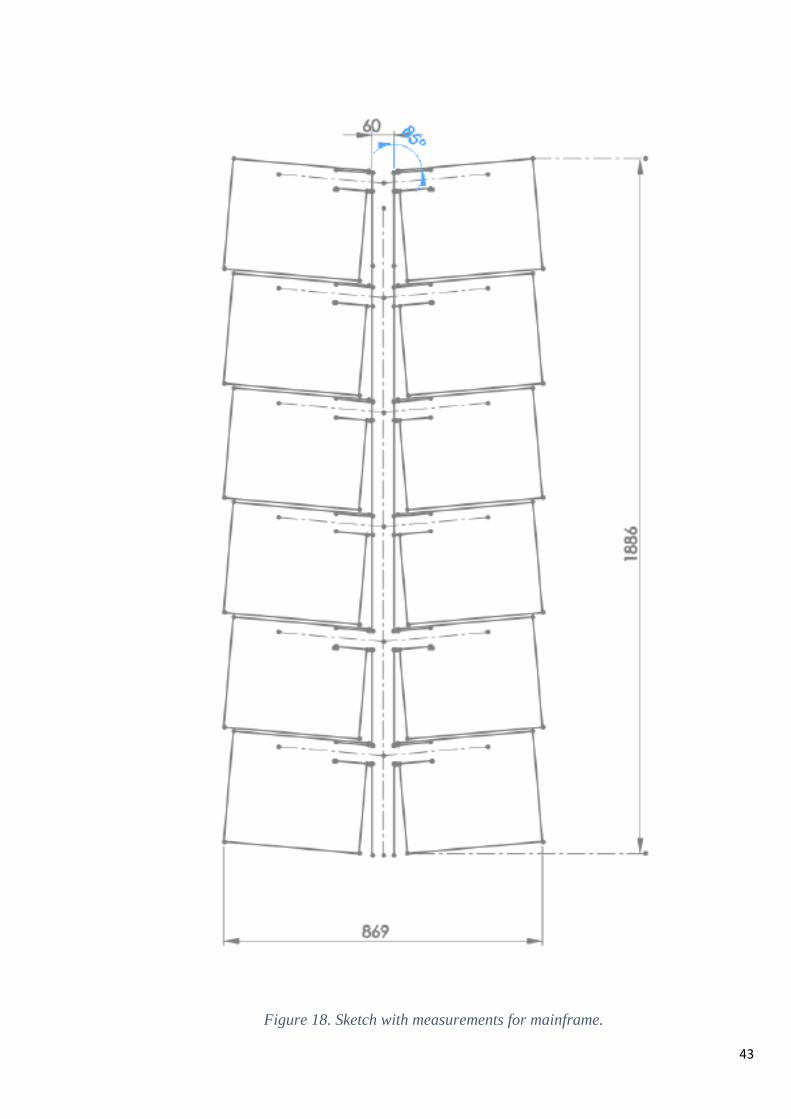
43
Figure 18. Sketch with measurements for mainframe.

44
Figure 19. Solid works drawing of pipe construction

45
Figure 20. Pipe structure visualization. Half assembled with canisters
3.2 Calculations for material
Main construction part is oval pipes. Three different diameters – 60 Ø mm holding
vertical pipes, 100 Ø mm main pipe and 40 Ø mm outlet pipes. The material will be used chromium
nickel stainless steel (04X18H10, 08X18H10T). Usually it is used for in chemical, food industry,
build reservoirs. It can handle more than 600 degrees temperature. Thin, will not allow structure to
rust because of hydrogen pumped through inside and quite light to easily move the construction
around.
Figure 21. Stainless steel pipe

46
Table 3. The measurements of stainless steel needed.
No. Type Diameter
inside (mm) Type
Length
(mm)
Amount
of pieces
Total
(mm)
1. Round 60 316 1890 2 3780
2. Round 60 316 1640 4 6560
3. Round 100 316 1690 1 1690
4. Round 40 316 150 72 10800
5. Square 20x40 316 1360 1 1360
6. square 20x40 316 876 2 1752
7. Sheet 1 316 120x120 4
The pipes for outlet and hanging of the canisters has to be 40 mm diameter to have
empty space for air overload inside canisters to come out. Different distance from air engine will
create different airflow and can not be made equal. The principle is to fill all canisters with at least
20 litres of air mixed with sterilization gas.
The price in Lithuanian market for these type of pipe is around 10,90 euros/m for 60 Ø
mm , 7,30 euro/m for 40 Ø mm and 13,90 euro/m for 100 Ø mm . Full length for pipes needed will
make a price for material – 77,80 euro total for pipe construction. Other material, like holding legs
and wheels for moving isn‘t calculated because factory has spare parts left fully functioning and
doable for the project. Welding is best option to connect all the pipes in to one structure. There is
space and machinery to cut, bend and weld in one division.
3.3 Flow analysis
Other objective of research project goal execution is to calculate what kind of engine
should be mounted on pipe construction and how much air has to be inflated in to structure to fill all
72 canisters with at least 20 litters of air with sterilization gas.

47
For this goal I used SolidWorks flow simulation ad in. There was made three different
calculations for three types of engines. The results had shown that to reach desired outcome in all
outlets it is enough to create 170 mᶟ/h air flow in to the system.
Figure 22. Air flow simulation in structure
The sterilization process is complete after 45 minutes. The whole process takes one
hour, from the start of mounting canisters on construction to filling it and tacking out of chamber.
Goal is to fill all canisters at least 20 litters.
The structure is symmetrical and has sides A and B. The simulation of air flow in it was
made in two conditions of time – 30 minutes and one hour. The results has shown that both side
outlets without exception had more than 20 cubic meters of air flowed through it. This come to
conclusion that this pipe structure is fulfilling the conditions and design is eligible for the project.
Results vary in different outlets, but still in acceptable range. This happens because of
pipe structure sharp corners and air flow is going inside bends and comes around or creates vortexes,
thus weakening flow in places there flow had to many obstacles to overcome.

48
Flow of 1 m3 equals to 1000 L, this means at least 0,2 m3 has to go out from each outlet.
For Inlet I chose 400 m3/h (0.111 mᶟ/s) ventilator as an engine to create flow. Results exceeds the
needs. Every canister will get sterilization fog from outside and will fulfil the aim of the project.
Result table is shown in Table 5 (page 60).
Figure 23. Air flow in A side oputlets (30 min)
Figure 24. Air flow in B side oputlets (30 min)
0
1
2
3
4
5
6
7
1 2 3 4 5 6 7 8 9 10 11 12 13 14 15 16 17 18 19 20 21 22 23 24 25 26 27 28 29 30 31 32 33 34 35 36
Air flow in each outlet 30 min (side A)
0
1
2
3
4
5
6
7
1 2 3 4 5 6 7 8 9 10 11 12 13 14 15 16 17 18 19 20 21 22 23 24 25 26 27 28 29 30 31 32 33 34 35 36
Air flow in each outlet 30 min side Bm3
m3

49
Figure 25. Air flow in each outlet 60 min side A
Figure 26. Air flow in each outlet 60 min side B
0
2
4
6
8
10
12
14
1 2 3 4 5 6 7 8 9 10 11 12 13 14 15 16 17 18 19 20 21 22 23 24 25 26 27 28 29 30 31 32 33 34 35 36
Air flow in each outlet 60 min side Am3
0
2
4
6
8
10
12
14
1 2 3 4 5 6 7 8 9 10 11 12 13 14 15 16 17 18 19 20 21 22 23 24 25 26 27 28 29 30 31 32 33 34 35 36
Air flow in each outlet 60 min side Bm3

50
Engine to fit requirements is Canal ventilator DOSPEL WK100.
Output 400m3/h
Pressure - 340Pa
Noise 60dB/1
Power - 70 W
Price – 70,10 EUR
Figure 27. Canal ventilator DOSPEL WK100
The price for all project material is:
𝑆𝑢𝑚 = 209,80 + 71,10 + 11,200 (𝑃𝑟𝑖𝑐𝑒 𝑜𝑓 𝑓𝑜𝑔 𝑚𝑎𝑐ℎ𝑖𝑛𝑒) = 11348,90 𝐸𝑈𝑅
3.4 Installing sterilization process in to manufacturing of bio fertilizers
The sterilization division is one of the final processes towards product manufacturing.
After it only comes pouring and logistics by the marketing, which is not directly connected to product
development. The difference from before will be just simple process for packages to go thru
sterilization chamber. Other processes will not be effected or redesigned.
Sterilization of 72 canisters will take around 60 minutes from start of the process:
Preparations (mounting canisters on pipe structure) – 10 min

51
In the same time sterilization chamber is filled with hydrogen peroxide gas – 10 min.
30 min takes to fully reach all canisters and sterilize inside of each and one of them.
20 minutes left for evaporate chamber, pushout structure, and unmount canisters ready to fill
with product
Figure 28. Product packages movement in factory
Number 26 is warehouse for containers. From Poland it is delivered every month
according to order plan given by sales department. Before filling with product containers is mounted
on pipe structure and sterilization chamber (27) is filled with hydrogen peroxide. The process takes
45 minutes from the start of filling room till taking canisters out to corridor to pouring room (28) –
the final stage for product manufacturing.
Loading to carrier
27 Mounting canisters
on pipe structure
Canisters from
manufacturer
Final
product
Filling to
canisters

52
3.5 Additional value
To reach maximum quality using Kaizen principle in this project there is one more step
to be taken to increase value in bio-fertilizers manufacturing – reusable packaging.
If sterilization chamber will be successful integrated the sales and marketing department
will create new approach to customer with more environment friendly ideas and sales pitch.
Marketing will have one more argument to dictate our mission statement – “everything for Her –
everything for the earth”.
To calculate project return ratio, reused packages should be counted. Problem occurs to
communicate with final customer to bring him in to cooperation with manufacturer and manage his
time to agree on the time when exact time product will be used, or bring the product to farmer just in
time so packages can be brought back not injured and able to reuse it again. With sterilisation chamber
in manufacturing process, prices for packaging could become absolute or reduced significantly.
The final customer has to get lower prices or other attractive deal to join the reusable
containers project, but still for the company it will be profitable reuse packages as much as the
marketing sides increased arguments and “value for nature” generating profile.
Other idea for quality improvement of company was created doing this project –
automatic calculation for anticipation for next year yield. Aleksandras Stulginskis university
programmes usually consists of agronomist studies which using biological factors can calculate future
yield depending on conditions of existing soil (bacteria, humus, previous fertilizer norms), adding
existing features to the formula of seed breed and variate in fertilizers norms anticipation for next
year yield is accurate in around 70 %.
This is easy way to add algorithm to application and distribute it though customers like
innovation with commercial of existing products in Bio-energy product line.

53
Conclusions
1. After analysis of existing quality improvement methods I suggest to use Pareto analysis to
find and identify existing errors in manufacturing process. Quality improvement will lead to
increased competiveness of company and keep one step ahead in new market when new
competitors occurs rapidly.
2. Because of high technological and financial advantage comparing to other new players in the
market Bio-energy invested to research and develop product quality improvement project. To
improve product Pareto analysis was made and was found a packaging problem which reduces
biological product activity thus - reliability of a product.
3. To improve quality the decision to sterilize packages (containers) was initiated. Most reliable
method to achieve goal is hydrogen peroxide. Filling chamber with H2O2 eliminates
microorganism on every surface fog settles on. This is very cheap and easy to use method.
The need of technological solution occurred because surface to sterilize is inside of packaging
container. Only through small cap fog can reach inside wall of canister. The structure was
designed according to sterilisation chamber measurements, to fit maximum canisters in one
process.
4. I have designed system, hollow pipe structure for optimal mounting of the packaging
containers, made air flow simulation inside it. This let me to choose right engine for air flow
to mount on the system. The structure allows to sterilize 72 canisters in one process and
engine ensures minimal requirements for project – 20 liters flow inside canisters. SolidWorks
software where used in both steps of research project mechanical part design creation. It
makes more accurate calculations to achieve goals right first time.
5. Integrating sterilisation chamber in to manufacturing does not interact with existing
manufacturing process and will increase customer satisfaction about the product generated
value. If reusable packaging project will be success company will detach from competitors
with high jump and will make profits to grow by exponential curve.
6. Possibility to integrate packages reuse project occurred. Involvement of sales department –
employs who have direct communication could offer to carefully use product without
damaging canisters thus reuse it again in further sales. This could reduce price of the project
and bring more value and close connection to the customer. Also it could lead to contribution
of plastic waste reduction and will make company more environment

54
References
1. HRSA. Q QU UA AL LI IT TY Y I IM MP PR RO OV VE EM ME EN NT T. [online].
2011. [Accessed 22 May 2017]. Available from:
https://www.hrsa.gov/quality/toolbox/508pdfs/qualityimprovement.pdf
2. PIPAN, Karmen Kern. Quality improvement methodologies - PDCA cycle , RADAR matrix
, DMAIC and DFSS Quality Improvement Methodologies – PDCA Cycle , RADAR Matrix ,
DMAIC and DFSS. . 2010. No. November.
3. XU, Qianli, JIAO, Roger J, YANG, Xi, HELANDER, Martin, KHALID, Halimahtun M and
OPPERUD, Anders. An analytical Kano model for customer need analysis. Design Studies
[online]. 2009. Vol. 30, no. 1, p. 87–110. DOI 10.1016/j.destud.2008.07.001. Available from:
http://dx.doi.org/10.1016/j.destud.2008.07.001
4. DRUCKER:, Peter F. and CUSTOMERS, Delivering Value to. Peter F. Drucker: delivering
value to customers. Measuring Business Excellence [online]. 2002. Vol. 6, no. 4,
p. mbe.2002.26706dae.007. DOI 10.1108/mbe.2002.26706dae.007. Available from:
http://www.emeraldinsight.com/doi/10.1108/mbe.2002.26706dae.007
5. The Relationship between Customer Satisfaction and Service Quality: a study of three
Service sectors in Umeå. [online]. [Accessed 22 May 2017]. Available from:
http://www.diva-portal.org/smash/get/diva2:448657/FULLTEXT02.co
6. ISO. Quality management principles. 2015 [online]. 2015. P. 20. DOI ISBN 978-92-67-
10650-2. Available from: http://www.iso.org/iso/pub100080.pdf
7. MORPHOLOGY, Ling. Principle 1 : Principle 2 : Principle 3 : Principle 4 : [online]. 2010.
P. 1–2. Available from: http://www.iso.org/iso/qmp.htm
8. AGES, Middle. Quality Management : Then , Now and Toward the Future. . 1990.
9. W. E. DEMING INSTITUTE. Dr. Deming’s 14 Points for Management [online]. 2016.
[Accessed 1 May 2017]. Available from: https://deming.org/management-
system/fourteenpoints
10. QUALITY. [no date]. ISBN 007034003X.
11. Pareto Principle. [online]. [Accessed 1 May 2017]. Available from:

55
http://www.investopedia.com/terms/p/paretoprinciple.asp
12. The Juran Trilogy | Continuous Improvement Blog. [online]. [Accessed 1 May 2017].
Available from: https://blogs.mtu.edu/improvement/2014/02/27/the-juran-trilogy/
13. Kaizen Creates a Culture of Continuous Improvement. [online]. [Accessed 1 May 2017].
Available from: http://www.leanproduction.com/kaizen.html
14. The Basics of Lean Six Sigma. [online]. [Accessed 1 May 2017]. Available from:
https://goleansixsigma.com/wp-content/uploads/2012/02/The-Basics-of-Lean-Six-Sigma-
www.GoLeanSixSigma.com_.pdf
15. MELTON, T. THE BENEFITS OF LEAN MANUFACTURING What Lean Thinking has to
Offer the Process Industries. [online]. [Accessed 8 May 2017]. DOI 10.1205/cherd.04351.
Available from: http://www.mimesolutions.com/PDFs/WEB Trish Melton Lean
Manufacturing July 2005.pdf
16. MABIN, Victoria. Goldratt’s "Theory of Constraints" Thinking Processes: A
Systems Methodology linking Soft with Hard. [online]. [Accessed 8 May 2017]. Available
from: https://www.systemdynamics.org/conferences/1999/PAPERS/PARA104.PDF
17. Microbes Will Feed the World, or Why Real Farmers Grow Soil, Not Crops - Modern
Farmer. [online]. [Accessed 10 May 2017]. Available from:
http://modernfarmer.com/2014/04/microbes-will-feed-world-real-farmers-grow-soil-crops/
18. THE BASICS OF STERILIZATION. [online]. [Accessed 9 May 2017]. Available from:
http://www.casemed.com/caseacademy/downloads/CASDF003.pdf
19. 2. ASSOCIATION FOR THE ADVANCEMENT OF MEDICAL INSTRUMENTATION,
GUIDELINES FOR THE SELECTION AND USE OF REUSABLE RIGID
STERILIZATION CONTAINER SYSTEMS FOR ETHYLENE OXIDE STERILIZATION
IN HEALTH CARE FACILITIES, ANSI/AAMI ST33:1996. ANSI/AAMI ST77:2013 -
Containment devices for reusable medical device sterilization. 2013.
20. Training Manual for Health Care Central Service Technicians. [online].
[Accessed 9 May 2017]. Available from: https://leseprobe.buch.de/images-
adb/2d/68/2d68b595-878d-43f4-88a4-615e887afa68.pdf
21. ADAM, Everett E, CORBETT, Lawrence M, FLORES, Benito E, HARRISON, Norma J,
LEE, T S, RHO, Boo‐ho, RIBERA, Jaime, SAMSON, Danny and WESTBROOK, Roy.

56
International Journal of Operations & Production Management. International Journal of
Operations & Production Management International Journal of Operations &
Production Management Iss International Journal of Quality & Reliability Management
[online]. 1997. Vol. 17, no. 3, p. 842–873. [Accessed 22 April 2017].
DOI 10.1108/01443579710171190. Available from:
http://dx.doi.org/10.1108/01443579710171190

57
Annexes
Table 4. Air flow results in each outlet (30 min / 60 min)
Surfa
ce No.
Volume Flow Rate
[m3/s] side A II B
mᶟ / 30min
side A II B
mᶟ/h side A
II B
Litters/30 min
side A II B
Litters/h side
A II B
1 0,0013 0,0014 2,34 2,52 4,68 5,04 2340 2520 4680 5040
2 0,0013 0,0003 2,34 2,16 4,77 4,45 2001 2530 4580 4550
3 0,0014 0,0012 2,52 2,16 5,04 4,32 2520 2160 5040 4320
4 0,0015 0,0014 2,7 2,52 5,4 5,04 2700 2502 5400 5040
5 0,0004 0,0003 0,72 0,54 1,44 1,08 720 540 1440 1080
6 0,0013 0,0013 2,34 2,34 4,68 4,68 2340 2340 4680 4680
7 0,0015 0,0016 2,7 2,88 5,4 5,76 2700 2880 5400 5760
8 0,0014 0,0014 2,52 2,52 5,04 5,04 2520 2520 5040 5040
9 0,0011 0,0011 1,98 1,98 3,96 3,96 1980 1980 3960 3960
10 0,0011 0,0011 1,98 1,98 3,96 3,96 1980 1980 3960 3960
11 0,0015 0,0015 2,7 2,7 5,4 5,4 2700 2700 5400 5400
12 0,0015 0,0016 2,7 2,88 5,4 5,76 2700 2880 5400 5760
13 0,0014 0,0014 2,52 2,52 5,04 5,04 2520 2502 5040 5040
14 0,0014 0,0013 2,52 2,34 5,04 4,68 2520 2304 5040 4680
15 0,001 0,0009 1,8 1,62 3,6 3,24 1800 1602 3600 3240
16 0,001 0,0009 1,8 1,62 3,6 3,24 1800 1620 3600 3240
17 0,0014 0,0014 2,52 2,52 5,04 5,04 2520 2502 5040 5040
18 0,0013 0,0014 2,34 2,52 4,68 5,04 2340 2050 4680 5040
19 0,0015 0,0015 2,7 2,7 5,4 5,4 2700 2700 5400 5400
20 0,0014 0,0014 2,52 2,52 5,04 5,04 2520 2502 5040 5040
21 0,0011 0,0011 1,98 1,98 3,96 3,96 1980 1908 3960 3960
22 0,0011 0,001 1,98 1,8 3,96 3,6 1980 1800 3960 3600
23 0,0014 0,0014 2,52 2,52 5,04 5,04 2520 2520 5040 5040
24 0,0015 0,0015 2,7 2,7 5,4 5,4 2700 2700 5400 5400
25 0,0025 0,0025 4,5 4,5 9 9 4500 4500 9000 9000
26 0,0022 0,0021 3,96 3,78 7,92 7,56 3960 3780 7920 7560
27 0,0017 0,0017 3,06 3,06 6,12 6,12 3060 3060 6120 6120

58
28 0,0017 0,0016 3,06 2,88 6,12 5,76 3060 2808 6120 5760
29 0,002 0,002 3,6 3,6 7,2 7,2 3600 3600 7200 7200
30 0,0025 0,0025 4,5 4,5 9 9 4500 4500 9000 9000
31 0,0036 0,0036 6,48 6,48 12,9 12,9 6480 6408 1296 12960
32 0,0036 0,0036 6,48 6,48 12,9 12,9 6480 6048 1296 12960
33 0,0025 0,0025 4,5 4,5 9 9 4500 4500 9000 9000
34 0,0024 0,0024 4,32 4,32 8,64 8,64 4320 4302 8640 8640
35 0,0033 0,0033 5,94 5,94 11,8 11,8 5940 5940 1188 11880
36 0,0036 0,0036 6,48 6,48 12,9 12,9 6480 6480 1296 12960

59
Table 5. Test results of final product reliability
Bacteria activity after packaging (%) Azofix / Fosfix
Test No. Norm Azofix Fosfix Test No. Norm Azofix Fosfix
1 90 95 99 51 90 98 97
2 90 67 97 52 90 93 96
3 90 97 97 53 90 77 92
4 90 95 99 54 90 95 96
5 90 96 99 55 90 99 94
6 90 99 94 56 90 96 96
7 90 95 97 57 90 97 69
8 90 99 97 58 90 93 99
9 90 96 97 59 90 93 99
10 90 98 98 60 90 98 98
11 90 97 96 61 90 92 77
12 90 99 99 62 90 95 94
13 90 93 98 63 90 97 94
14 90 95 94 64 90 95 96
15 90 93 95 65 90 95 93
16 90 92 93 66 90 98 93
17 90 93 77 67 90 99 98
18 90 98 97 68 90 75 95
19 90 94 99 69 90 99 96
20 90 96 96 70 90 95 97
21 90 93 68 71 90 99 95
22 90 96 94 72 90 94 98
23 90 92 95 73 90 94 98
24 90 97 97 74 90 99 95
25 90 94 93 75 90 96 99
26 90 96 97 76 90 95 97
27 90 68 95 77 90 95 96
28 90 95 98 78 90 71 98
29 90 92 96 79 90 92 96
30 90 95 92 80 90 97 94
31 90 80 92 81 90 94 77
32 90 93 95 82 90 93 96
33 90 95 80 83 90 94 99
34 90 99 97 84 90 98 92
35 90 96 99 85 90 93 92
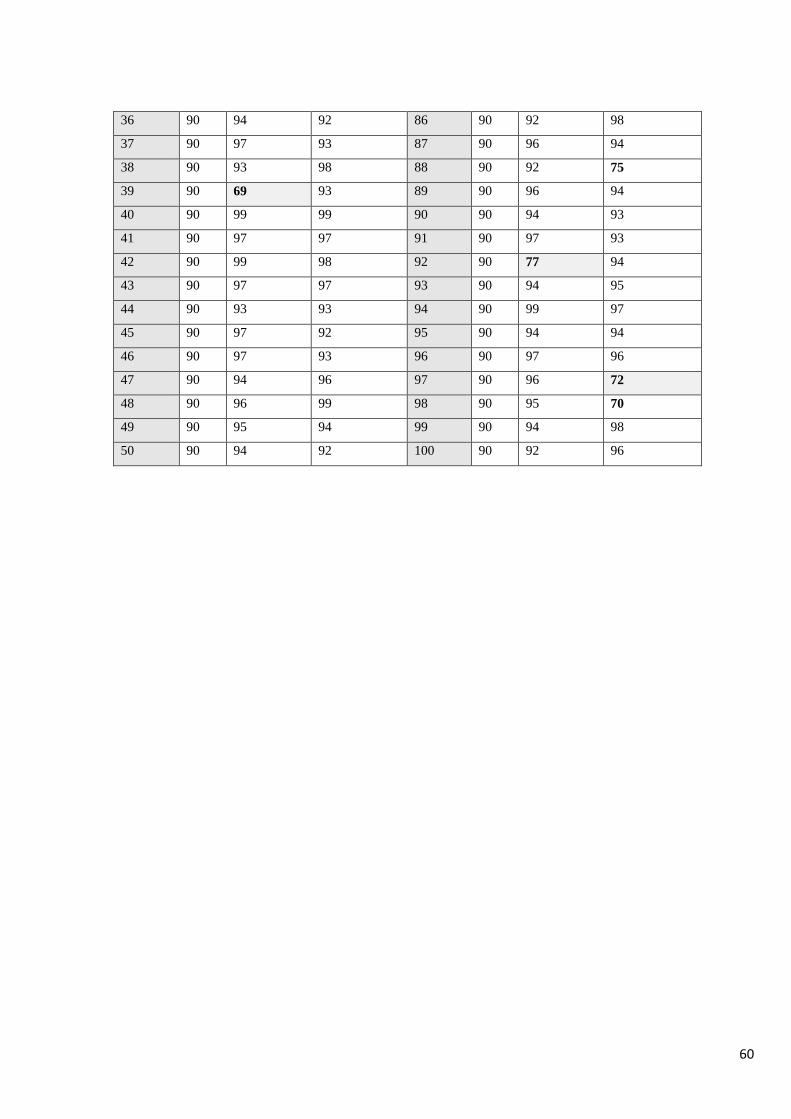
60
36 90 94 92 86 90 92 98
37 90 97 93 87 90 96 94
38 90 93 98 88 90 92 75
39 90 69 93 89 90 96 94
40 90 99 99 90 90 94 93
41 90 97 97 91 90 97 93
42 90 99 98 92 90 77 94
43 90 97 97 93 90 94 95
44 90 93 93 94 90 99 97
45 90 97 92 95 90 94 94
46 90 97 93 96 90 97 96
47 90 94 96 97 90 96 72
48 90 96 99 98 90 95 70
49 90 95 94 99 90 94 98
50 90 94 92 100 90 92 96

61
Table 6. Lodging number and sizes
No. Lodging Size m2
1. Cabinet 36,44 m2
2. Corridor 34,20 m2
3. Cabinet 16,96 m2
4. Cloakrooms 16,55 m2
5. WC 1,55 m2
6. WC 1,44 m2
7. Shower 2,09 m2
8. Shower 2,09 m2
9. Cloakrooms 8.26 m2
10. Kitchen 18,47 m2
11. Shower 2,06 m2
12. Shower 1,95 m2
13. Cloakrooms 9,48 m2
14. Cloakrooms 4,74 m2
15. Cloakrooms 3,98 m2
16. Cloakrooms 4,78 m2
17. Tambour 2,25 m2
18. Corridor 7,15 m2
19. Corridor 8,49 m2
20. Stock 15,27 m2
21. Tambour 3,63 m2
22. Spreads preparation room 17,91 m2
23. CP 27,56 m2
24. Finished goods warehouse 390,12 m2
25. Shower 3,23 m2
26. Warehouse for packaging containers 149,71 m2
27. STERILIZATION CHAMBER 10,22 m2
28. Packaging room 20.12 m2
29. Corridor 31.16 m2
30. Gas generator room 36,15 m2

62
31. Air compressor 35,40 m2
32. Warehouse 16,87 m2
33. Changing room 7,62 m2
34. Corridor 6,0 m2
35. WC 1,58 m2
36. Shower 2,06 m2
37. Laboratory 23,16 m2
38. Laboratory 11,2 m2
39. Autoclave 2,66 m2
40. Autoclave 2,66 m2
41. Washing room 12,86 m2
42. Corridor 5,17 m2
43. Laboratory 8,98 m2
44. Warehouse 1,66 m2
45. Changing room 6,04 m2
46. Operators room 16,22 m2
47. Manufacturing room 141,11 m2
48. Warehouse 3,12 m2
49. Packaging room 34,04 m2
50. Tambour 2,09 m2
51. Electricity room 2,0 m2
TOTAL: 1231,74 m2