2012/13 quality improvement plans: an analysis - … · 2012/13 quality improvement plans: an...
TRANSCRIPT
2012/13 Quality Improvement Plans: An Analysis for Improvement

2012/13 Quality improvement plans: an analysis for improvement
Table of Contents
Executive Summary . . . . . . . . . . . . . . . . . . . . . . . . . . . . . . . . . . . . . . . . . . . . . . . . . . . . . . . . . . . . . . . . . . . . . . . . . . . . 2
Background . . . . . . . . . . . . . . . . . . . . . . . . . . . . . . . . . . . . . . . . . . . . . . . . . . . . . . . . . . . . . . . . . . . . . . . . . . . . . . . . . . 3
Progress Achieved Over 2011/12 . . . . . . . . . . . . . . . . . . . . . . . . . . . . . . . . . . . . . . . . . . . . . . . . . . . . . . . . . . . . . . . . . 6
Overview: Priority Setting, Target Setting and Change Plans . . . . . . . . . . . . . . . . . . . . . . . . . . . . . . . . . . . . . . . . . . . 19
Quality Improvement by Indicator . . . . . . . . . . . . . . . . . . . . . . . . . . . . . . . . . . . . . . . . . . . . . . . . . . . . . . . . . . . . . . . . 30
Safety: Clostridium Difficile Infection (CDI) . . . . . . . . . . . . . . . . . . . . . . . . . . . . . . . . . . . . . . . . . . . . . . . . . . . . . . 31
Safety: Ventilator-Associated Pneumonia (VAP) . . . . . . . . . . . . . . . . . . . . . . . . . . . . . . . . . . . . . . . . . . . . . . . . . . 32
Safety: Hand Hygiene . . . . . . . . . . . . . . . . . . . . . . . . . . . . . . . . . . . . . . . . . . . . . . . . . . . . . . . . . . . . . . . . . . . . . . 33
Safety: Central Line Associated Blood Stream Infection (CLI) . . . . . . . . . . . . . . . . . . . . . . . . . . . . . . . . . . . . . . . 39
Safety: Pressure Ulcers . . . . . . . . . . . . . . . . . . . . . . . . . . . . . . . . . . . . . . . . . . . . . . . . . . . . . . . . . . . . . . . . . . . . . 40
Safety: Falls . . . . . . . . . . . . . . . . . . . . . . . . . . . . . . . . . . . . . . . . . . . . . . . . . . . . . . . . . . . . . . . . . . . . . . . . . . . . . . 41
Safety: Surgical Safety Checklist . . . . . . . . . . . . . . . . . . . . . . . . . . . . . . . . . . . . . . . . . . . . . . . . . . . . . . . . . . . . . 42
Safety: Physical Restraints . . . . . . . . . . . . . . . . . . . . . . . . . . . . . . . . . . . . . . . . . . . . . . . . . . . . . . . . . . . . . . . . . . 43
Effectiveness: Hospital Standardized Mortality Ratio (HSMR) . . . . . . . . . . . . . . . . . . . . . . . . . . . . . . . . . . . . . . . 44
Effectiveness: Hospital – Total Margin (OHRS) . . . . . . . . . . . . . . . . . . . . . . . . . . . . . . . . . . . . . . . . . . . . . . . . . . . 45
Access: 90th Percentile ED Length of Stay for Admitted Patients . . . . . . . . . . . . . . . . . . . . . . . . . . . . . . . . . . . 46
Patient-Centred: Patient Satisfaction . . . . . . . . . . . . . . . . . . . . . . . . . . . . . . . . . . . . . . . . . . . . . . . . . . . . . . . . . . 54
Integrated: 30-Day Readmission Rate to Any Facility (Specific Case Mix Groups) . . . . . . . . . . . . . . . . . . . . . . . 61
Integrated: Percentage of Alternate Level of Care (ALC) Days . . . . . . . . . . . . . . . . . . . . . . . . . . . . . . . . . . . . . . . 62
Conclusion . . . . . . . . . . . . . . . . . . . . . . . . . . . . . . . . . . . . . . . . . . . . . . . . . . . . . . . . . . . . . . . . . . . . . . . . . . . . . . . . . . 71
Appendix A: Suite of Capacity-Building Supports . . . . . . . . . . . . . . . . . . . . . . . . . . . . . . . . . . . . . . . . . . . . . . . . . . . 72
Appendix B: Technical Report . . . . . . . . . . . . . . . . . . . . . . . . . . . . . . . . . . . . . . . . . . . . . . . . . . . . . . . . . . . . . . . . . . . 74
2 2012/13 Quality improvement plans: an analysis for improvement
Executive Summary
In April 2012, Ontario hospitals submitted their Quality
Improvement Plans (QIPs) for 2012/13, the second year
of provincially mandated QIPs under the Excellent Care
for All Act (ECFAA), 2010 . It was recommended that
hospitals focus on five key attributes of quality care —
safety, effectiveness, access, patient-centred and
integrated — and to include at least one core recom-
mended indicator from each of these attributes .
Indicators were to be assigned a priority of 1, 2 or 3 .
Hospitals’ executive compensation is linked to the
achievement of quality improvement goals . This
requirement drives both improvement and accountability
for the delivery of QIPs, and increases motivation at
all levels of the organization to achieve agrressive, but
realizable, targets . Hospitals were also asked to provide
a report on the progress made since the 2011/12 QIPs .
This analysis of the 143 QIPs submitted includes the
background to QIPs under ECFAA, looks at the progress
achieved over 2011/12 and outlines key findings regarding
priority setting, detailing how many hospitals selected
each indicator and how targets were set as compared
to current performance . A selection of good change
ideas is provided for four of the most selected indicators .
In 2012, Health Quality Ontario (HQO) put forward a new
Strategic Plan, or roadmap, to guide the agency as it
works to achieve an overarching quality aim in Ontario’s
healthcare system — better outcomes, better experience,
better value for money . Analysis and feedback on QIPs
are key ways that HQO can assist individual hospitals
to achieve and exceed their improvement targets: If the
majority of hospitals meet or exceed targets in key
areas, there is an opportunity to push the provincial
average to new (and better) levels of performance . For
patients and staff, this means better patient outcomes
and more reliable care delivery .
This analysis also serves as a learning tool for hospitals
going forward: It will help them share innovative change
ideas, effective strategies and success stories; commu-
nicate progress achieved; and highlight continued areas
for improvement . The appendices include a summary
of the suite of supports available to hospitals as they
complete their QIPs, and a technical report .
Overall, hospitals made progress since the initial year
for submitting QIPs under ECFAA, 2011/12 . Three key
areas of progress include:
• A perfect compliance rate with submitting QIPs and
progress reports, as well as more consistency in
completing specific elements of the QIPs .
• Clear aims aligned with hospitals’ strategic priorities,
which were identified by a number of hospitals and
included appropriate measures and motivational
targets, and change plans that the hospitals intend
to implement to achieve their aims .
• Innovative and thought-provoking change ideas,
which were submitted by a number of hospitals .
While the completeness of QIPs has improved this year,
there were still gaps in some plans, including targets
that did not appear to be stretch targets and instances
where little or no detail was provided about change
ideas . In the spirit of quality improvement, hospitals are
encouraged to review their existing plans and compare
them to the exemplary plans identified in this document,
and to look for opportunities to adopt the best practices
for QIP development that their peers are using .
2012/13 Quality improvement plans: an analysis for improvement 3
Background
Quality improvement plans (Qips): What
they are, Why they matter and hQo’s role
Under the Excellent Care for All Act (ECFAA), 2010,
every hospital in Ontario (as defined in the Public
Hospitals Act) must submit an annual QIP . The QIP
is a tool that enables hospitals to identify, report on
and achieve QI objectives in a structured way . The
improvement attained by hospitals is the result of
clearly and consistently focusing on the principles
outlined in the Model for Improvement (see page 4) .
Each hospital’s Quality Committee oversees the
preparation of the QIP, which must be certified by the
Board Chair and the Chief Executive Officer, submitted
to HQO and made available to the public . The Ministry
of Health and Long-Term Care (MOHLTC) has compiled
a number of resources to support Quality Committees
(see http://www .health .gov .on .ca/en/ms/ecfa/pro/
updates/qualitycommittee/bp_resources .aspx) .
In 2012, HQO set in place a new Strategic Plan, or
roadmap, for moving ahead with our mandate . This plan
is a transformative document for HQO . It consolidates
and makes explicit the agency’s raison d’être: to work
with others to drive a quality agenda for Ontario that
is provincial in scope, rooted in collaboration and
supportive of integrated and coordinated efforts
across all segments of the healthcare system .
Hospital QIPs are the key way in which HQO works
with its hospital partners to drive improvement in the
system and to help hospitals measure success, introduce
innovative change ideas and reach excellence in care .
The transformative objectives outlined in the Strategic
Plan include an overarching quality aim in Ontario’s
healthcare system — better outcomes, better experience,
better value for money .
Health Quality Ontario, together with its partners
across the system, has been the driving force behind
making the quality of healthcare in Ontario an explicit
and shared priority supported by system leaders,
providers and patients . QIPs are one important
component of change, but they are by no means
the only one: HQO is a key catalyst of system-wide
change . Moving forward, HQO will:
• Focus the system on a common quality agenda
(establish priorities, goals and targets and mobilize
system leadership around a common agenda) .
• Build evidence and knowledge (generate or access
the evidence and knowledge needed to provide
quality care and improve population health) .
• Broker improvement (develop the tools and supports
needed to accelerate the adoption of evidence-
based best practice, and foster the development of
quality improvement capacity in the system) .
• Catalyze spread (guide, support and collaborate
within the system to spread knowledge about best
practices, measurement tools and implementation
strategies) .
• Evaluate progress (provide timely and relevant health
system monitoring, measurement and reporting, and
assess progress and report to the public) .
ECFAA lays the groundwork for a significant cultural
shift in Ontario’s healthcare system . Excellent QIPs and
well-executed improvement plans will strengthen the
hospital sector’s ability to deliver high-quality patient
care . The goal of the legislation is to blend quality and
value in such a way that patients move to the centre of
the healthcare system – their needs are prioritized and
services are designed to meet these needs . Ontarians
should expect high-quality, person-centred care now,
and in the future . Patient outcomes, patient experiences
and the quality of care delivered will drive the way
services are delivered, the way the system plans
services and how it is held accountable .
4 2012/13 Quality improvement plans: an analysis for improvement
Developing and implementing QIPs should ultimately
help create a healthcare system that focuses on keeping
Ontarians healthy, provides appropriate and timely
access to excellent primary healthcare, and provides
the right care at the right time in the right place, all the
while promoting focused improvement, building capacity
to deliver person-centred care, and striving to meet
theoretical best .
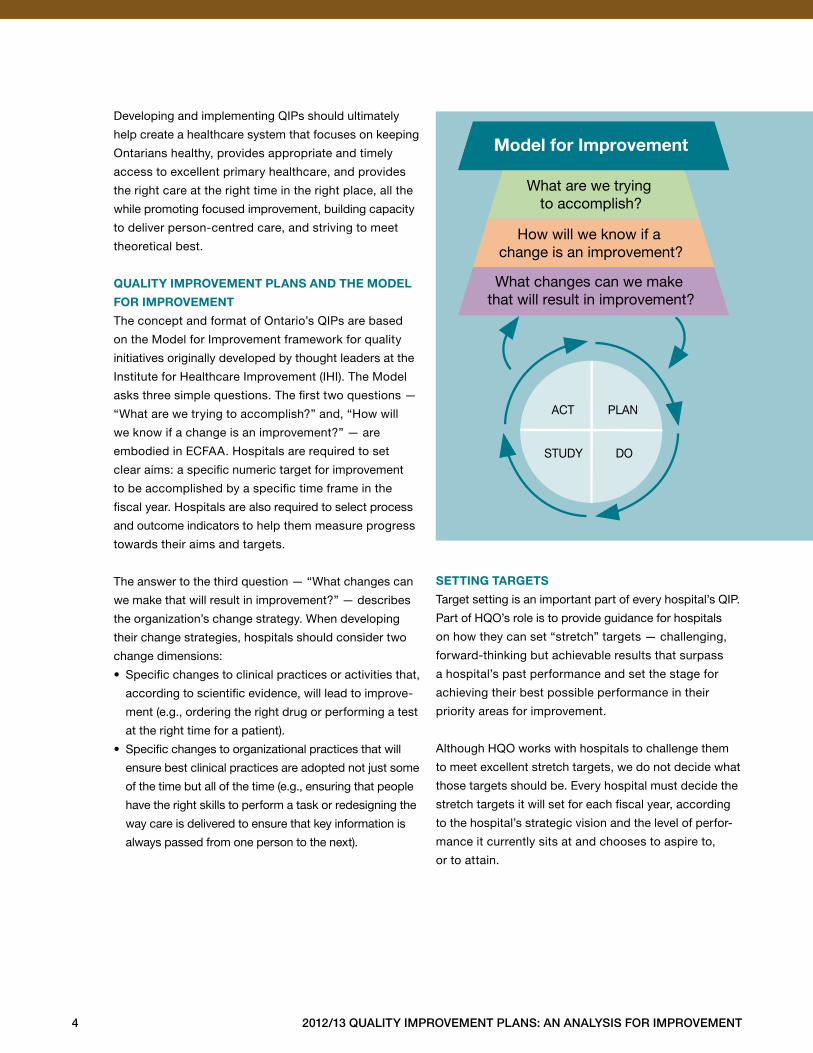
Quality improvement plans and the model
for improvement
The concept and format of Ontario’s QIPs are based
on the Model for Improvement framework for quality
initiatives originally developed by thought leaders at the
Institute for Healthcare Improvement (IHI) . The Model
asks three simple questions . The first two questions —
“What are we trying to accomplish?” and, “How will
we know if a change is an improvement?” — are
embodied in ECFAA . Hospitals are required to set
clear aims: a specific numeric target for improvement
to be accomplished by a specific time frame in the
fiscal year . Hospitals are also required to select process
and outcome indicators to help them measure progress
towards their aims and targets .
The answer to the third question — “What changes can
we make that will result in improvement?” — describes
the organization’s change strategy . When developing
their change strategies, hospitals should consider two
change dimensions:
• Specific changes to clinical practices or activities that,
according to scientific evidence, will lead to improve-
ment (e .g ., ordering the right drug or performing a test
at the right time for a patient) .
• Specific changes to organizational practices that will
ensure best clinical practices are adopted not just some
of the time but all of the time (e .g ., ensuring that people
have the right skills to perform a task or redesigning the
way care is delivered to ensure that key information is
always passed from one person to the next) .
setting targets
Target setting is an important part of every hospital’s QIP .
Part of HQO’s role is to provide guidance for hospitals
on how they can set “stretch” targets — challenging,
forward-thinking but achievable results that surpass
a hospital’s past performance and set the stage for
achieving their best possible performance in their
priority areas for improvement .
Although HQO works with hospitals to challenge them
to meet excellent stretch targets, we do not decide what
those targets should be . Every hospital must decide the
stretch targets it will set for each fiscal year, according
to the hospital’s strategic vision and the level of perfor-
mance it currently sits at and chooses to aspire to,
or to attain .
STUDY DO
ACT PLAN
Model for Improvement
What are we trying to accomplish?
How will we know if a change is an improvement?
What changes can we make that will result in improvement?
2012/13 Quality improvement plans: an analysis for improvement 5
Health Quality Ontario encourages hospitals to consider
what level of performance is acceptable to them and to
their patients, and what it will take to achieve this level .
Hospitals need to ask themselves if maintaining the
same level of performance from one year to the next is
good enough: Is being at or below the provincial average
acceptable to the patients they serve and the staff
who provide these services? Hospitals will be asked to
include their rationale for selecting targets on priority
indicators . (Note: some thought-provoking questions
can be found in the charts that are included for each
of the indicators, beginning on page 31 .)
For a more detailed understanding of stretch targets,
and why they are important, see page 24 .
analysis of 2012/13 Qips: year-tWo successes
and challenges
In this second year of ECFAA implementation, hospitals
were asked to focus on five key attributes of quality
care: safety, effectiveness, access, patient-centred and
integrated . It was recommended that at least one core
indicator be included from each of these attributes and
that indicators be assigned a priority of 1, 2 or 3 . Hospitals’
executive compensation is linked to the achievement of
quality improvement goals . This requirement drives both
improvement and accountability for the delivery of QIPs,
and increases motivation at all levels of the organization
to achieve agrressive, but realizable, targets . A description
of planned improvement initiatives (change ideas) was
requested for objectives where hospitals intended to
improve quality . Hospitals were also asked to provide a
report on the progress made since their 2011/12 QIPs .
Health Quality Ontario received and reviewed the QIPs
and progress reports submitted by 143 hospitals this
year,i which provided a snapshot of hospital activity
and performance across the province .
This year’s plans were stronger overall than last year’s
in terms of their completeness and the robustness of
change plans; a selection of change ideas has been
shared within this report . In the spirit of quality improve-
ment, we have also identified areas for improvement
that could increase the impact of the QIP as a QI tool .
purpose of the analysis for improvement
This analysis of the 2012/13 QIPs is designed to be
a learning tool . Its purpose is to:
• Disseminate innovative change ideas, and highlight
strong improvement plans and success stories from
the field .
• Communicate progress achieved from year one
(2011/12) .
• Highlight examples of plans that fulfill the Model
for Improvement’s components and adhere to quality
improvement science .
• Highlight continued areas for improvement in QIPs .
The analysis examines the following aspects of quality
improvement plans:
• progress achieved: What improvements were
sustained over 2011/12? What changes led to
improvement?
• priority setting: How many priorities did hospitals
typically choose in their QIPs, and what topics did
they choose?
• target setting: What types of targets did hospitals
set? Are there examples of well-articulated “stretch”
targets? How can hospitals improve their target
setting?
• change plans: What types of change ideas do
hospitals describe? How can hospitals strengthen
their change ideas?
i This number is lower than last year’s 152 plans due to a number of mergers in the hospital sector.
hospital
Baseline
(Jan.–dec.
2010)
target for
2011/2012
change ideas
result
(Jan.–dec.
2011)
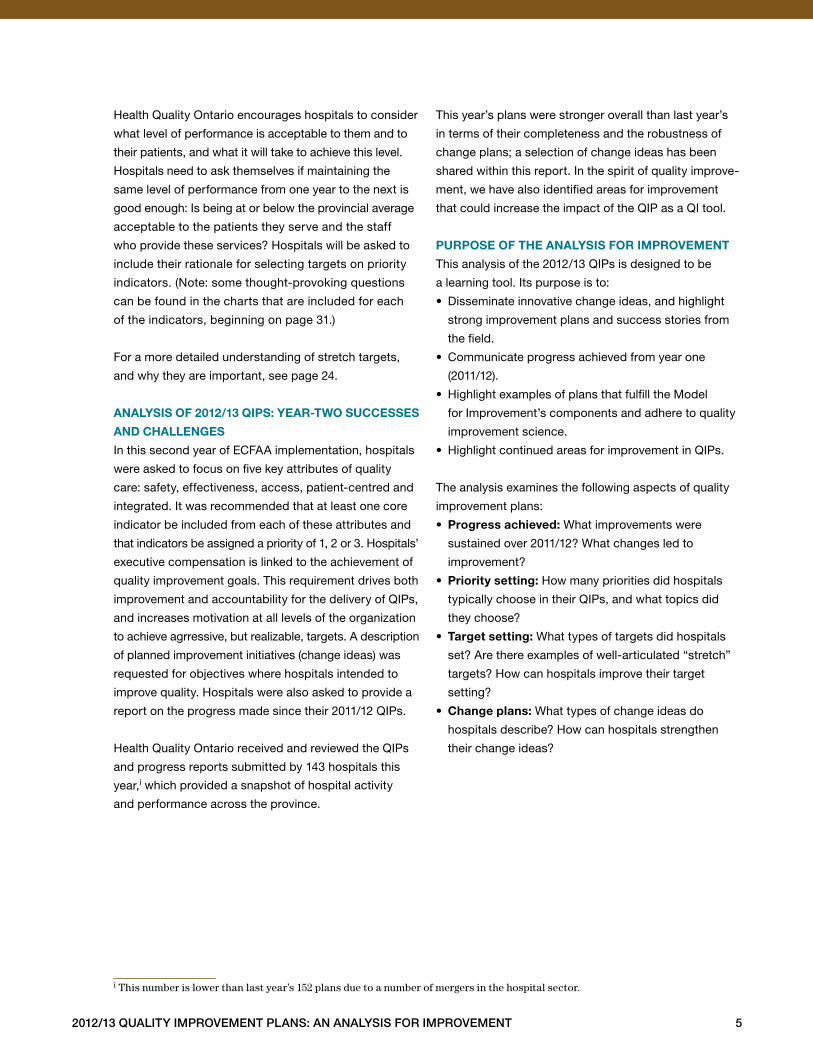
The Scarborough
Hospital*
(large community)
1 .93 0 .75 • Ongoing monitoring of Safer
Healthcare Now! insertion and
maintenance bundle .
• Chlohexidine dressings to help
prevent CLIs .
• Chlorhexidine baths for high-risk
patients and those with central
lines in situ .
• Establish percentage of infected
central lines by line type .
• Establish percentage of infected
central lines by patient type .
1 .14
taBle 1: success example† — central line associated Blood stream infection
6 2012/13 Quality improvement plans: an analysis for improvement
Progress Achieved Over 2011/12
Hospitals made progress this year . In April 2012,
hospitals reported interim results on indicators chosen
in their 2011/12 QIPs . The tables below highlight examples
from those progress reports, where hospitals had
clear strategies for change and achieved important
improvements . Given that the reporting periods for
some indicators fell within 2010/11 or Q1 2011/12 and
would not have reflected changes implemented in 2011/12,
some indicators — pressure ulcers, falls, HSMR and
readmission — have not been included within this section
of the report . A complete analysis of the progress
achieved will be possible once end-of-fiscal-year data
become available, and will be shared with hospitals in
next year’s analysis . The final results will likely be even
better than these interim results .
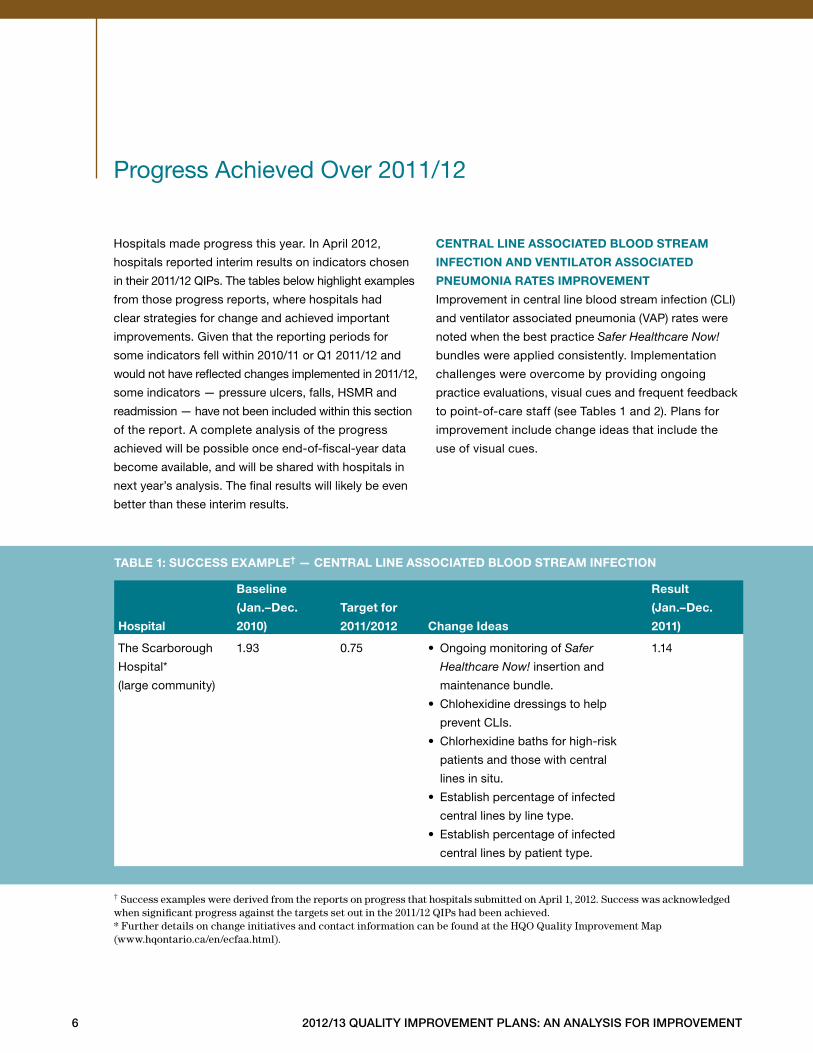
central line associated Blood stream
infection and ventilator associated
pneumonia rates improvement
Improvement in central line blood stream infection (CLI)
and ventilator associated pneumonia (VAP) rates were
noted when the best practice Safer Healthcare Now!
bundles were applied consistently . Implementation
challenges were overcome by providing ongoing
practice evaluations, visual cues and frequent feedback
to point-of-care staff (see Tables 1 and 2) . Plans for
improvement include change ideas that include the
use of visual cues .
† Success examples were derived from the reports on progress that hospitals submitted on April 1, 2012. Success was acknowledged when significant progress against the targets set out in the 2011/12 QIPs had been achieved.* Further details on change initiatives and contact information can be found at the HQO Quality Improvement Map(www.hqontario.ca/en/ecfaa.html).
2012/13 Quality improvement plans: an analysis for improvement 7
* Further details on change initiatives and contact information can be found at the HQO Quality Improvement Map (www.hqontario.ca/en/ecfaa.html).
hospital
Baseline
(Jan.–dec.
2010)
target for
2011/2012
change ideas
result
(Jan.–dec.
2011)
Kingston General
Hospital*
(acute teaching)
2 .02 1 .82 • Consistent application of VAP
prevention bundle .
• Checklist placed at every bedside
and discussed on multidisciplinary
rounds .
• Daily physician champion assigned .
• Preprinted admission order set
developed .
• Oversight of data/trends by patient
safety coordinator .
• Review on quarterly basis by critical
care program, QI and safety
committee .
• Celebration held during patient
safety week
1
London Health
Sciences Centre
(acute teaching)
1 .6 0 .99 • Full implementation of the Safer
Healthcare Now! bundle .
• Statistics, checklists and case
reviews by critical care staff and
physicians .
0 .31
Toronto East
General Hospital
(large community)
4 .47 4 .25 • Publicly post hand hygiene audit
rates in the ICU .
• Develop a strategy to identify points
of transmission .
• Develop a strategy to standardize
knowledge about and implementation
of the sedation vacation protocol .
• Investigate the feasibility of using
subglottic trach tubes .
• Determine incidence of ICU patients
without oral gastric tubes .
1 .96
taBle 2: success examples — ventilator associated pneumonia
8 2012/13 Quality improvement plans: an analysis for improvement
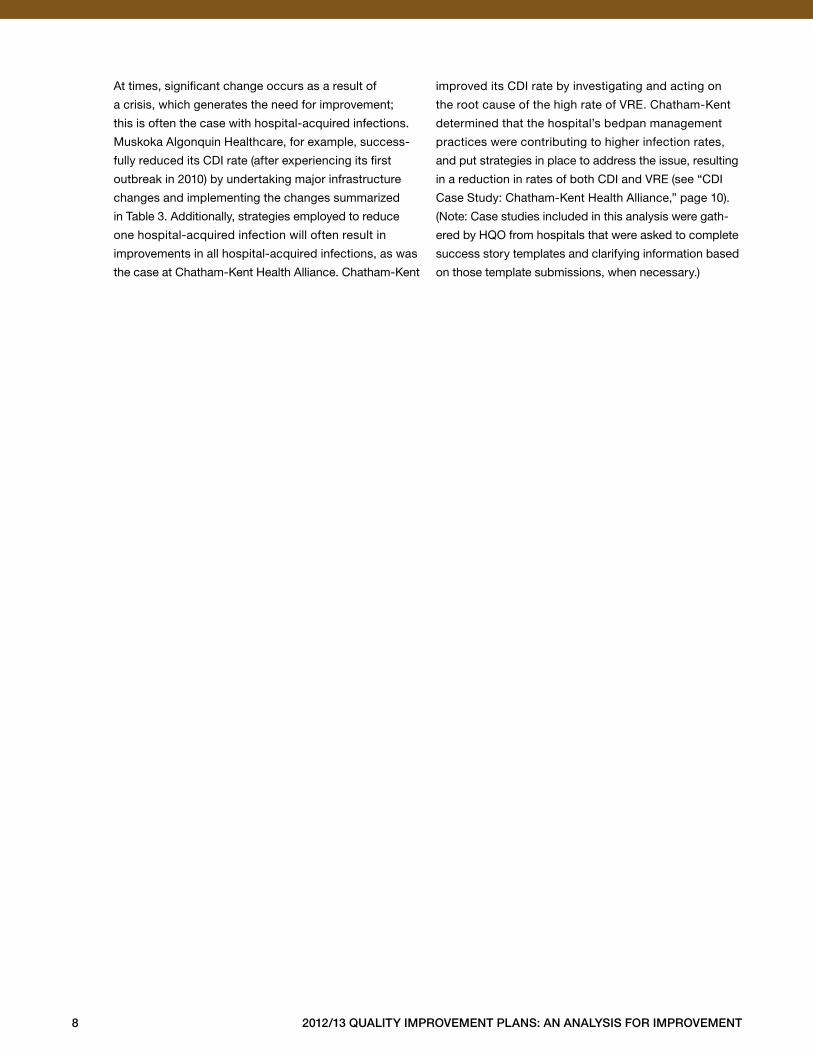
At times, significant change occurs as a result of
a crisis, which generates the need for improvement;
this is often the case with hospital-acquired infections .
Muskoka Algonquin Healthcare, for example, success-
fully reduced its CDI rate (after experiencing its first
outbreak in 2010) by undertaking major infrastructure
changes and implementing the changes summarized
in Table 3 . Additionally, strategies employed to reduce
one hospital-acquired infection will often result in
improvements in all hospital-acquired infections, as was
the case at Chatham-Kent Health Alliance . Chatham-Kent
improved its CDI rate by investigating and acting on
the root cause of the high rate of VRE . Chatham-Kent
determined that the hospital’s bedpan management
practices were contributing to higher infection rates,
and put strategies in place to address the issue, resulting
in a reduction in rates of both CDI and VRE (see “CDI
Case Study: Chatham-Kent Health Alliance,” page 10) .
(Note: Case studies included in this analysis were gath-
ered by HQO from hospitals that were asked to complete
success story templates and clarifying information based
on those template submissions, when necessary .)
2012/13 Quality improvement plans: an analysis for improvement 9
hospital
Baseline
(Jan.–dec.
2010)
target for
2011/2012
change ideas
result
(Jan.–dec.
2011)
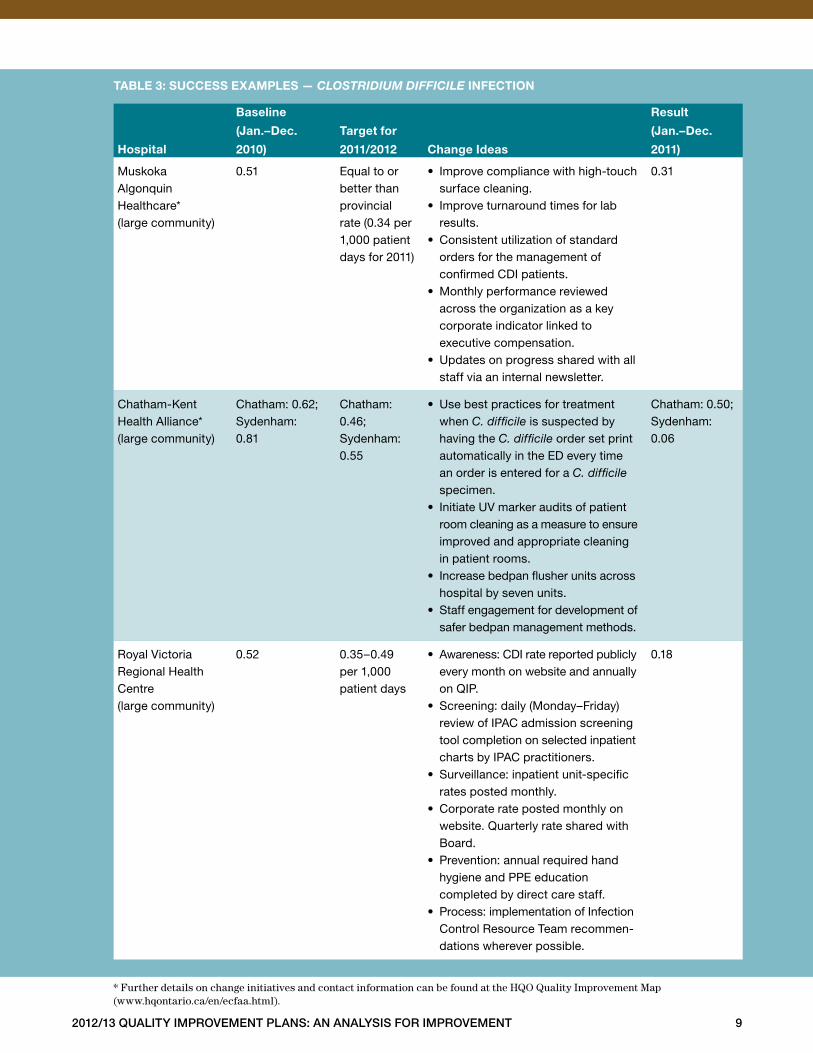
Muskoka Algonquin Healthcare* (large community)
0 .51 Equal to or better than provincial rate (0 .34 per 1,000 patient days for 2011)
• Improve compliance with high-touch surface cleaning .
• Improve turnaround times for lab results .
• Consistent utilization of standard orders for the management of confirmed CDI patients .
• Monthly performance reviewed across the organization as a key corporate indicator linked to executive compensation .
• Updates on progress shared with all staff via an internal newsletter .
0 .31
Chatham-Kent Health Alliance* (large community)
Chatham: 0 .62;Sydenham: 0 .81
Chatham: 0 .46;Sydenham: 0 .55
• Use best practices for treatment when C. difficile is suspected by having the C. difficile order set print automatically in the ED every time an order is entered for a C. difficile specimen .
• Initiate UV marker audits of patient room cleaning as a measure to ensure improved and appropriate cleaning in patient rooms .
• Increase bedpan flusher units across hospital by seven units .
• Staff engagement for development of safer bedpan management methods .
Chatham: 0 .50;Sydenham: 0 .06
Royal Victoria Regional Health Centre (large community)
0 .52 0 .35–0 .49 per 1,000 patient days
• Awareness: CDI rate reported publicly every month on website and annually on QIP .
• Screening: daily (Monday–Friday) review of IPAC admission screening tool completion on selected inpatient charts by IPAC practitioners .
• Surveillance: inpatient unit-specific rates posted monthly .
• Corporate rate posted monthly on website . Quarterly rate shared with Board .
• Prevention: annual required hand hygiene and PPE education completed by direct care staff .
• Process: implementation of Infection Control Resource Team recommen-dations wherever possible .
0 .18
taBle 3: success examples — Clostridium diffiCile infection
* Further details on change initiatives and contact information can be found at the HQO Quality Improvement Map(www.hqontario.ca/en/ecfaa.html).
10 2012/13 Quality improvement plans: an analysis for improvement
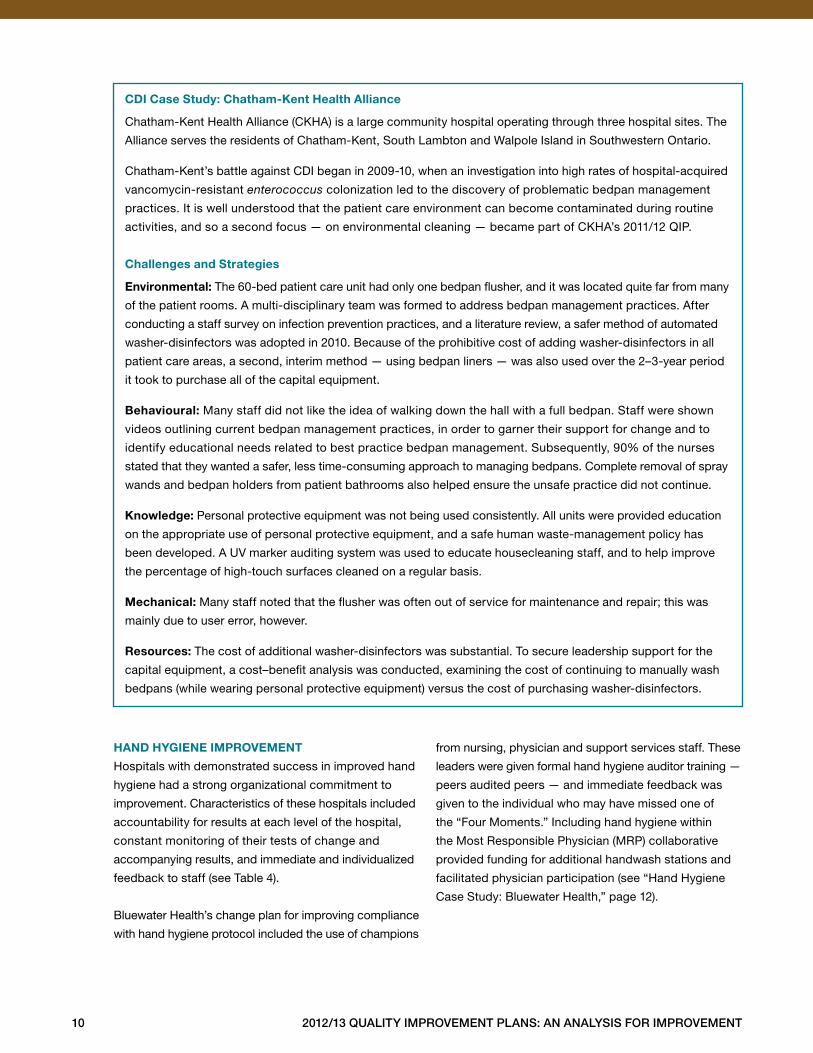
cdi case study: chatham-Kent health alliance
Chatham-Kent Health Alliance (CKHA) is a large community hospital operating through three hospital sites . The
Alliance serves the residents of Chatham-Kent, South Lambton and Walpole Island in Southwestern Ontario .
Chatham-Kent’s battle against CDI began in 2009-10, when an investigation into high rates of hospital-acquired
vancomycin-resistant enterococcus colonization led to the discovery of problematic bedpan management
practices . It is well understood that the patient care environment can become contaminated during routine
activities, and so a second focus — on environmental cleaning — became part of CKHA’s 2011/12 QIP .
challenges and strategies
environmental: The 60-bed patient care unit had only one bedpan flusher, and it was located quite far from many
of the patient rooms . A multi-disciplinary team was formed to address bedpan management practices . After
conducting a staff survey on infection prevention practices, and a literature review, a safer method of automated
washer-disinfectors was adopted in 2010 . Because of the prohibitive cost of adding washer-disinfectors in all
patient care areas, a second, interim method — using bedpan liners — was also used over the 2–3-year period
it took to purchase all of the capital equipment .
Behavioural: Many staff did not like the idea of walking down the hall with a full bedpan . Staff were shown
videos outlining current bedpan management practices, in order to garner their support for change and to
identify educational needs related to best practice bedpan management . Subsequently, 90% of the nurses
stated that they wanted a safer, less time-consuming approach to managing bedpans . Complete removal of spray
wands and bedpan holders from patient bathrooms also helped ensure the unsafe practice did not continue .
Knowledge: Personal protective equipment was not being used consistently . All units were provided education
on the appropriate use of personal protective equipment, and a safe human waste-management policy has
been developed . A UV marker auditing system was used to educate housecleaning staff, and to help improve
the percentage of high-touch surfaces cleaned on a regular basis .
mechanical: Many staff noted that the flusher was often out of service for maintenance and repair; this was
mainly due to user error, however .
resources: The cost of additional washer-disinfectors was substantial . To secure leadership support for the
capital equipment, a cost–benefit analysis was conducted, examining the cost of continuing to manually wash
bedpans (while wearing personal protective equipment) versus the cost of purchasing washer-disinfectors .
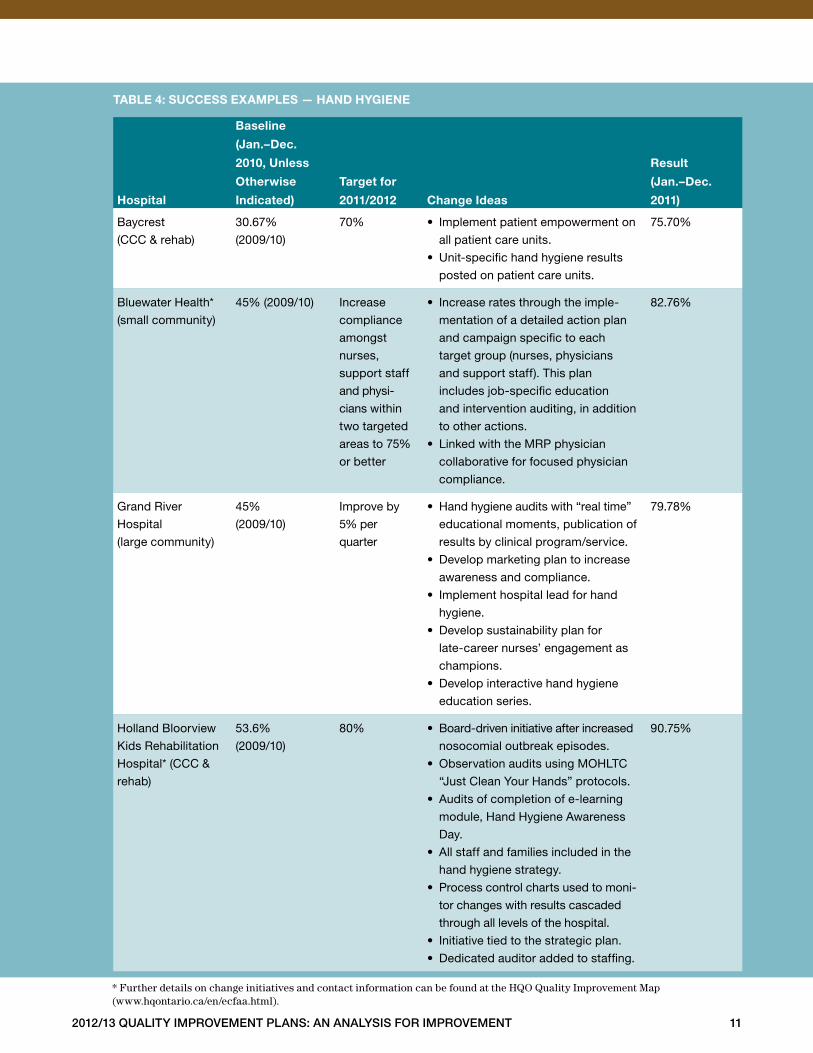
hand hygiene improvement
Hospitals with demonstrated success in improved hand
hygiene had a strong organizational commitment to
improvement . Characteristics of these hospitals included
accountability for results at each level of the hospital,
constant monitoring of their tests of change and
accompanying results, and immediate and individualized
feedback to staff (see Table 4) .
Bluewater Health’s change plan for improving compliance
with hand hygiene protocol included the use of champions
from nursing, physician and support services staff . These
leaders were given formal hand hygiene auditor training —
peers audited peers — and immediate feedback was
given to the individual who may have missed one of
the “Four Moments .” Including hand hygiene within
the Most Responsible Physician (MRP) collaborative
provided funding for additional handwash stations and
facilitated physician participation (see “Hand Hygiene
Case Study: Bluewater Health,” page 12) .
2012/13 Quality improvement plans: an analysis for improvement 11
hospital
Baseline
(Jan.–dec.
2010, unless
otherwise
indicated)
target for
2011/2012
change ideas
result
(Jan.–dec.
2011)
Baycrest
(CCC & rehab)
30 .67%
(2009/10)
70% • Implement patient empowerment on
all patient care units .
• Unit-specific hand hygiene results
posted on patient care units .
75 .70%
Bluewater Health*
(small community)
45% (2009/10) Increase
compliance
amongst
nurses,
support staff
and physi-
cians within
two targeted
areas to 75%
or better
• Increase rates through the imple-
mentation of a detailed action plan
and campaign specific to each
target group (nurses, physicians
and support staff) . This plan
includes job-specific education
and intervention auditing, in addition
to other actions .
• Linked with the MRP physician
collaborative for focused physician
compliance .
82 .76%
Grand River
Hospital
(large community)
45%
(2009/10)
Improve by
5% per
quarter
• Hand hygiene audits with “real time”
educational moments, publication of
results by clinical program/service .
• Develop marketing plan to increase
awareness and compliance .
• Implement hospital lead for hand
hygiene .
• Develop sustainability plan for
late-career nurses’ engagement as
champions .
• Develop interactive hand hygiene
education series .
79 .78%
Holland Bloorview
Kids Rehabilitation
Hospital* (CCC &
rehab)
53 .6%
(2009/10)
80% • Board-driven initiative after increased
nosocomial outbreak episodes .
• Observation audits using MOHLTC
“Just Clean Your Hands” protocols .
• Audits of completion of e-learning
module, Hand Hygiene Awareness
Day .
• All staff and families included in the
hand hygiene strategy .
• Process control charts used to moni-
tor changes with results cascaded
through all levels of the hospital .
• Initiative tied to the strategic plan .
• Dedicated auditor added to staffing .
90 .75%
taBle 4: success examples — hand hygiene
* Further details on change initiatives and contact information can be found at the HQO Quality Improvement Map(www.hqontario.ca/en/ecfaa.html).
12 2012/13 Quality improvement plans: an analysis for improvement
hand hygiene case study: Bluewater health
Bluewater Health is a small community hospital comprising Bluewater Health in Sarnia and Charlotte Eleanor
Englehart Hospital in Petrolia .
Despite intensive efforts, year after year, Bluewater’s annual overall hand hygiene compliance rates remained
stubbornly low . While numerous strategies to influence compliance had resulted in small gains, Bluewater was
struggling to sustain those successes and achieve further improvements, including hand hygiene within the
Most Responsible Physician (MRP) collaborative facilitated physician participation .
challenges and strategies
Behavioural: It was difficult to change employees’ habits . The plan implemented in 2011/12 was different from
previous approaches in that it had three distinct yet coordinated streams of focus, targeting the different employee
groups — nursing, physician and support service staff . The hand hygiene initiative partnered with the MRP
collaborative and developed a focused action plan to improve physician compliance . To test intensive actions
across all three streams, Bluewater further focused on the rehab and surgical in-patient units . Hand hygiene
champions were identified within each stream and provided with formal hand hygiene auditor training — peers
audited peers, and immediate feedback was given to the individual who may have missed an opportunity .
Leaders within the targeted areas were given specialized education on how to model the right behaviours,
and a checklist was provided to the leaders to remind them of key activities . Hand hygiene reminders on the
“Four Moments” were added to existing safety briefings, and the briefings’ data sheets were monitored to
ensure hand hygiene was listed as a topic for discussion . A Pin Campaign was also added, to recognize good
hand hygiene practices .
environmental: The number and location of handwash stations were insufficient . Approximately 200 alcohol
hand-rub stations were added throughout the organization . The locations of these stations were based on
physician input, for improved visibility and ease of use .
Knowledge: Many staff were unaware of their lack of compliance with the Four Moments . The infection
prevention and control team (IPAC) provided targeted education for each stream on the importance and
expectations for hand hygiene compliance . They also shared stories, to help convey why staff should
be concerned . IPAC addressed specific questions pertinent to the staff group — for example, What are the
hand hygiene expectations during delivery of meal trays? Education packages about hand hygiene were
delivered to each physician . A new Winning with Hand Hygiene contest ran every three months; it drove
staff to the Intranet, where they received information on the Four Moments before accessing and printing
ballots . A standardized quarterly report detailing major activities and a summary of the compliance results
by employee stream were broadly shared across the organization .
resources: The cost of developing and implementing the QI project was re-examined . CEO and executive
compensation was tied to improving hand hygiene compliance, which helped garner leadership support and
interest in the progress of the initiative, including hand hygiene within the Most Responsible Physician (MRP)
collaborative facilitated physician participation .
2012/13 Quality improvement plans: an analysis for improvement 13
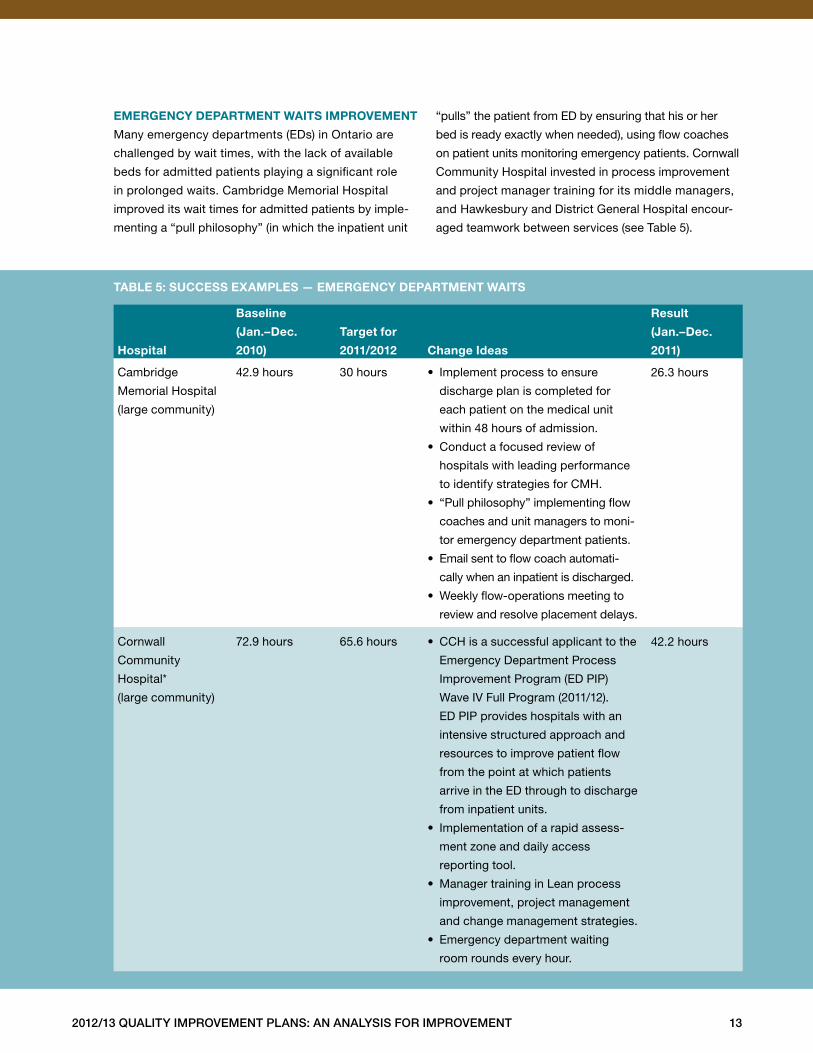
emergency department Waits improvement
Many emergency departments (EDs) in Ontario are
challenged by wait times, with the lack of available
beds for admitted patients playing a significant role
in prolonged waits . Cambridge Memorial Hospital
improved its wait times for admitted patients by imple-
menting a “pull philosophy” (in which the inpatient unit
“pulls” the patient from ED by ensuring that his or her
bed is ready exactly when needed), using flow coaches
on patient units monitoring emergency patients . Cornwall
Community Hospital invested in process improvement
and project manager training for its middle managers,
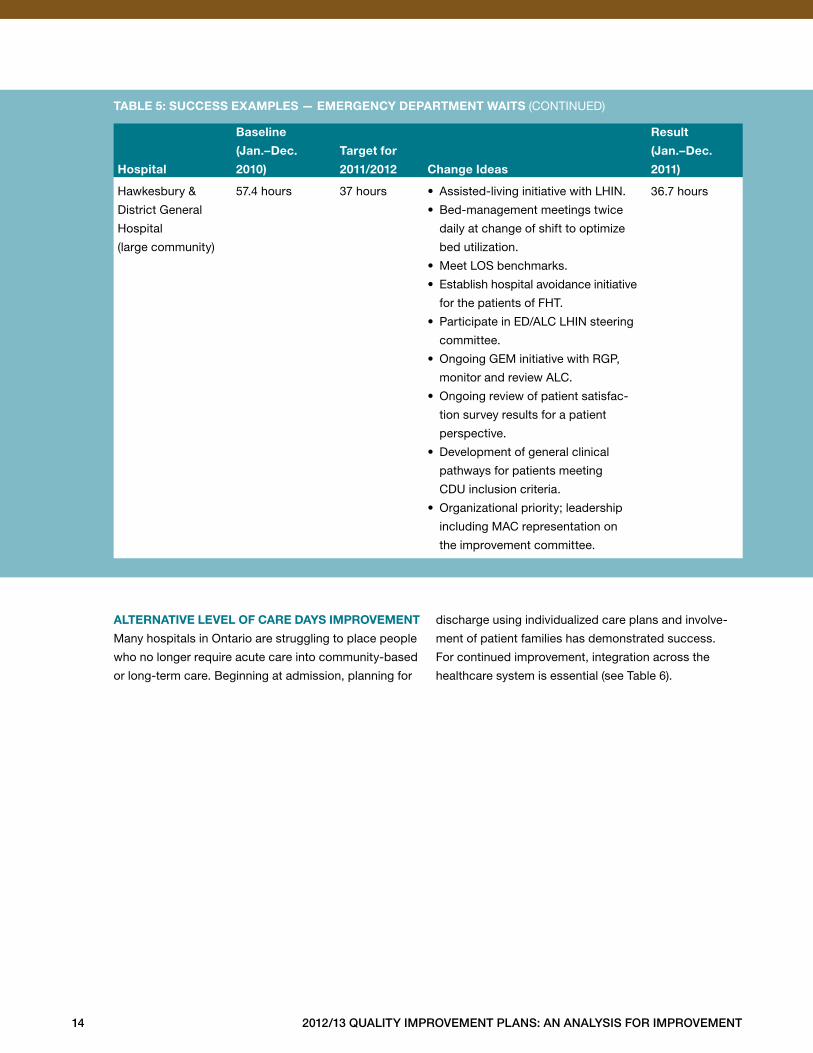
and Hawkesbury and District General Hospital encour-
aged teamwork between services (see Table 5) .
hospital
Baseline
(Jan.–dec.
2010)
target for
2011/2012
change ideas
result
(Jan.–dec.
2011)
Cambridge
Memorial Hospital
(large community)
42 .9 hours 30 hours • Implement process to ensure
discharge plan is completed for
each patient on the medical unit
within 48 hours of admission .
• Conduct a focused review of
hospitals with leading performance
to identify strategies for CMH .
• “Pull philosophy” implementing flow
coaches and unit managers to moni-
tor emergency department patients .
• Email sent to flow coach automati-
cally when an inpatient is discharged .
• Weekly flow-operations meeting to
review and resolve placement delays .
26 .3 hours
Cornwall
Community
Hospital*
(large community)
72 .9 hours 65 .6 hours • CCH is a successful applicant to the
Emergency Department Process
Improvement Program (ED PIP)
Wave IV Full Program (2011/12) .
ED PIP provides hospitals with an
intensive structured approach and
resources to improve patient flow
from the point at which patients
arrive in the ED through to discharge
from inpatient units .
• Implementation of a rapid assess-
ment zone and daily access
reporting tool .
• Manager training in Lean process
improvement, project management
and change management strategies .
• Emergency department waiting
room rounds every hour .
42 .2 hours
taBle 5: success examples — emergency department Waits
14 2012/13 Quality improvement plans: an analysis for improvement
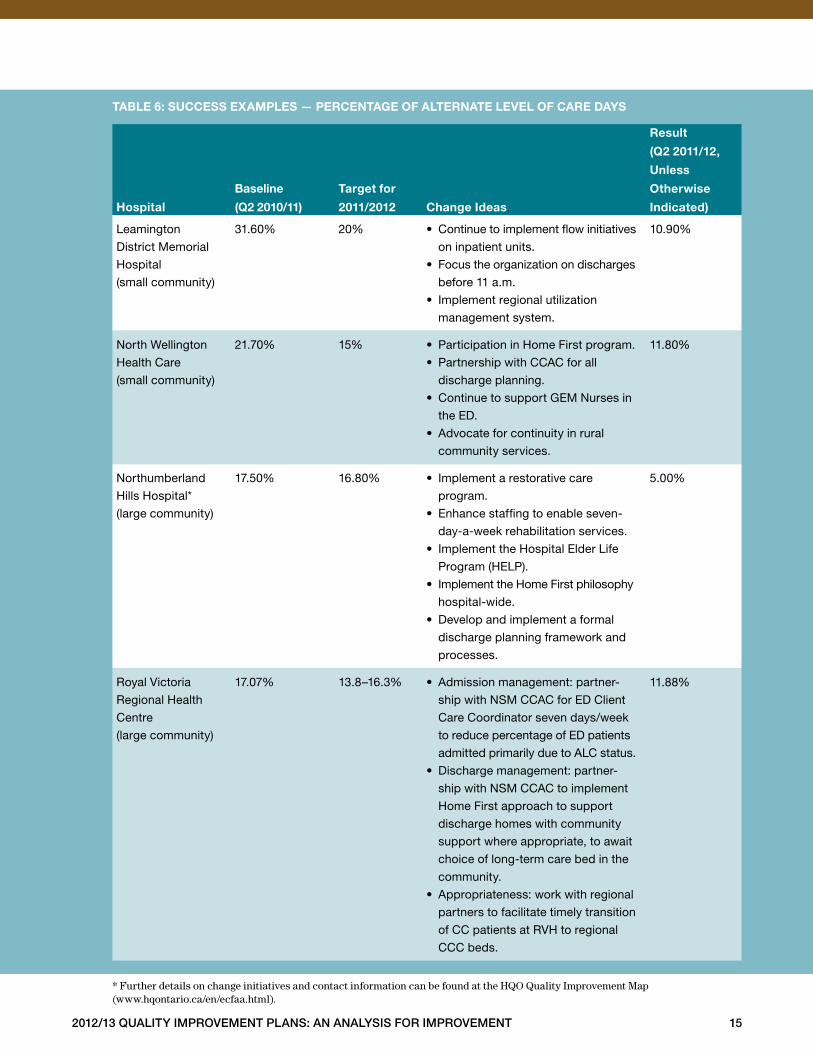
alternative level of care days improvement
Many hospitals in Ontario are struggling to place people
who no longer require acute care into community-based
or long-term care . Beginning at admission, planning for
discharge using individualized care plans and involve-
ment of patient families has demonstrated success .
For continued improvement, integration across the
healthcare system is essential (see Table 6) .
hospital
Baseline
(Jan.–dec.
2010)
target for
2011/2012
change ideas
result
(Jan.–dec.
2011)
Hawkesbury &
District General
Hospital
(large community)
57 .4 hours 37 hours • Assisted-living initiative with LHIN .
• Bed-management meetings twice
daily at change of shift to optimize
bed utilization .
• Meet LOS benchmarks .
• Establish hospital avoidance initiative
for the patients of FHT .
• Participate in ED/ALC LHIN steering
committee .
• Ongoing GEM initiative with RGP,
monitor and review ALC .
• Ongoing review of patient satisfac-
tion survey results for a patient
perspective .
• Development of general clinical
pathways for patients meeting
CDU inclusion criteria .
• Organizational priority; leadership
including MAC representation on
the improvement committee .
36 .7 hours
taBle 5: success examples — emergency department Waits (CONTINUED)
2012/13 Quality improvement plans: an analysis for improvement 15
hospital
Baseline
(Q2 2010/11)
target for
2011/2012
change ideas
result
(Q2 2011/12,
unless
otherwise
indicated)
Leamington
District Memorial
Hospital
(small community)
31 .60% 20% • Continue to implement flow initiatives
on inpatient units .
• Focus the organization on discharges
before 11 a .m .
• Implement regional utilization
management system .
10 .90%
North Wellington
Health Care
(small community)
21 .70% 15% • Participation in Home First program .
• Partnership with CCAC for all
discharge planning .
• Continue to support GEM Nurses in
the ED .
• Advocate for continuity in rural
community services .
11 .80%
Northumberland
Hills Hospital*
(large community)
17 .50% 16 .80% • Implement a restorative care
program .
• Enhance staffing to enable seven-
day-a-week rehabilitation services .
• Implement the Hospital Elder Life
Program (HELP) .
• Implement the Home First philosophy
hospital-wide .
• Develop and implement a formal
discharge planning framework and
processes .
5 .00%
Royal Victoria
Regional Health
Centre
(large community)
17 .07% 13 .8–16 .3% • Admission management: partner-
ship with NSM CCAC for ED Client
Care Coordinator seven days/week
to reduce percentage of ED patients
admitted primarily due to ALC status .
• Discharge management: partner-
ship with NSM CCAC to implement
Home First approach to support
discharge homes with community
support where appropriate, to await
choice of long-term care bed in the
community .
• Appropriateness: work with regional
partners to facilitate timely transition
of CC patients at RVH to regional
CCC beds .
11 .88%
taBle 6: success examples — percentage of alternate level of care days
* Further details on change initiatives and contact information can be found at the HQO Quality Improvement Map(www.hqontario.ca/en/ecfaa.html).
16 2012/13 Quality improvement plans: an analysis for improvement
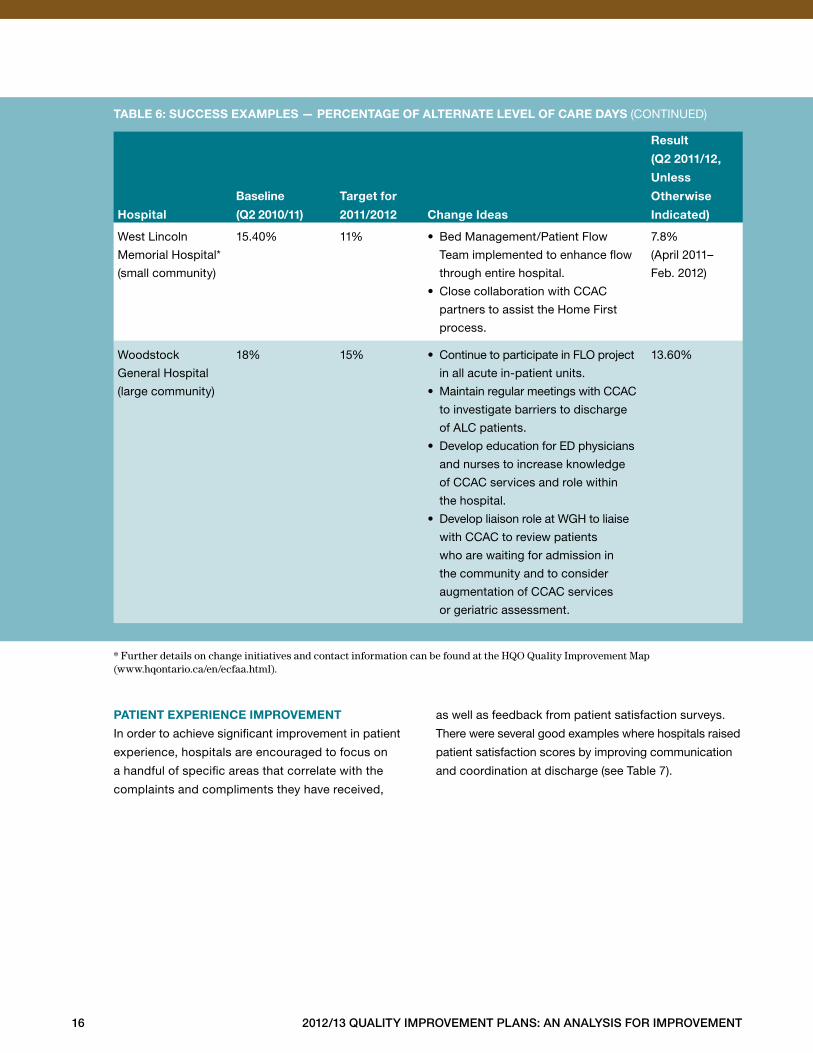
patient experience improvement
In order to achieve significant improvement in patient
experience, hospitals are encouraged to focus on
a handful of specific areas that correlate with the
complaints and compliments they have received,
as well as feedback from patient satisfaction surveys .
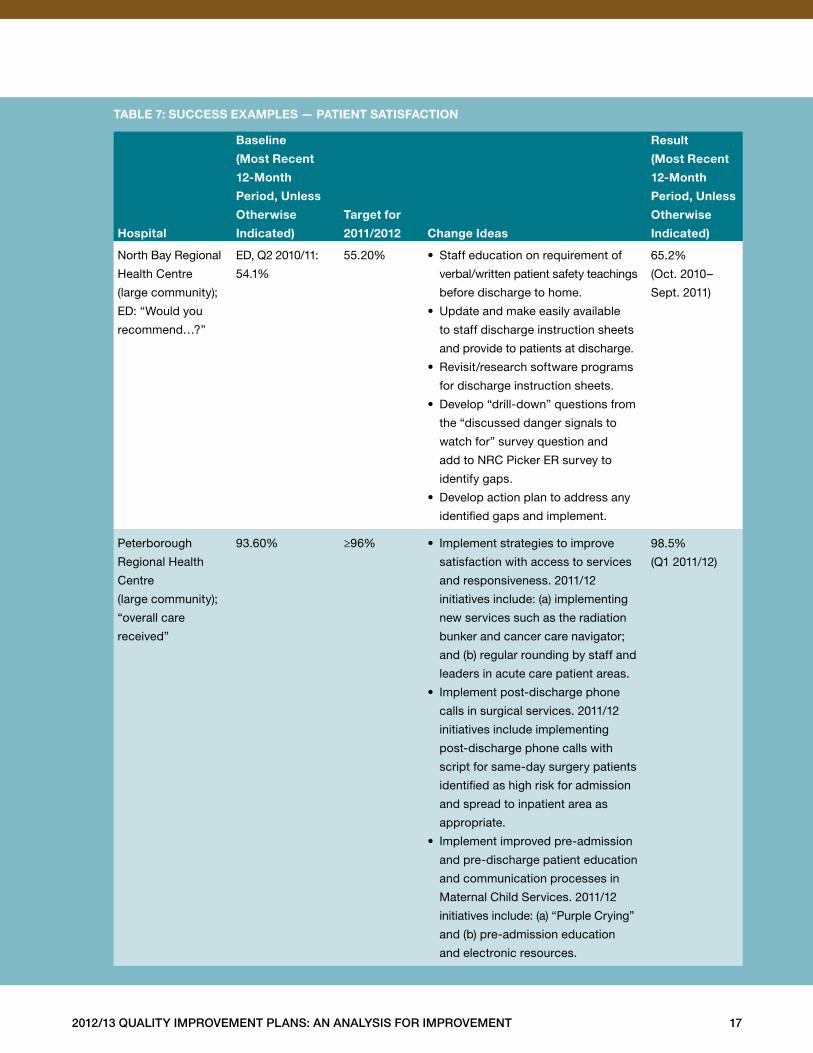
There were several good examples where hospitals raised
patient satisfaction scores by improving communication
and coordination at discharge (see Table 7) .
hospital
Baseline
(Q2 2010/11)
target for
2011/2012
change ideas
result
(Q2 2011/12,
unless
otherwise
indicated)
West Lincoln
Memorial Hospital*
(small community)
15 .40% 11% • Bed Management/Patient Flow
Team implemented to enhance flow
through entire hospital .
• Close collaboration with CCAC
partners to assist the Home First
process .
7 .8%
(April 2011–
Feb . 2012)
Woodstock
General Hospital
(large community)
18% 15% • Continue to participate in FLO project
in all acute in-patient units .
• Maintain regular meetings with CCAC
to investigate barriers to discharge
of ALC patients .
• Develop education for ED physicians
and nurses to increase knowledge
of CCAC services and role within
the hospital .
• Develop liaison role at WGH to liaise
with CCAC to review patients
who are waiting for admission in
the community and to consider
augmentation of CCAC services
or geriatric assessment .
13 .60%
taBle 6: success examples — percentage of alternate level of care days (CONTINUED)
* Further details on change initiatives and contact information can be found at the HQO Quality Improvement Map(www.hqontario.ca/en/ecfaa.html).
2012/13 Quality improvement plans: an analysis for improvement 17
hospital
Baseline
(most recent
12-month
period, unless
otherwise
indicated)
target for
2011/2012
change ideas
result
(most recent
12-month
period, unless
otherwise
indicated)
North Bay Regional
Health Centre
(large community);
ED: “Would you
recommend…?”
ED, Q2 2010/11:
54 .1%
55 .20% • Staff education on requirement of
verbal/written patient safety teachings
before discharge to home .
• Update and make easily available
to staff discharge instruction sheets
and provide to patients at discharge .
• Revisit/research software programs
for discharge instruction sheets .
• Develop “drill-down” questions from
the “discussed danger signals to
watch for” survey question and
add to NRC Picker ER survey to
identify gaps .
• Develop action plan to address any
identified gaps and implement .
65 .2%
(Oct . 2010–
Sept . 2011)
Peterborough
Regional Health
Centre
(large community);
“overall care
received”
93 .60% ≥96% • Implement strategies to improve
satisfaction with access to services
and responsiveness . 2011/12
initiatives include: (a) implementing
new services such as the radiation
bunker and cancer care navigator;
and (b) regular rounding by staff and
leaders in acute care patient areas .
• Implement post-discharge phone
calls in surgical services . 2011/12
initiatives include implementing
post-discharge phone calls with
script for same-day surgery patients
identified as high risk for admission
and spread to inpatient area as
appropriate .
• Implement improved pre-admission
and pre-discharge patient education
and communication processes in
Maternal Child Services . 2011/12
initiatives include: (a) “Purple Crying”
and (b) pre-admission education
and electronic resources .
98 .5%
(Q1 2011/12)
taBle 7: success examples — patient satisfaction
18 2012/13 Quality improvement plans: an analysis for improvement
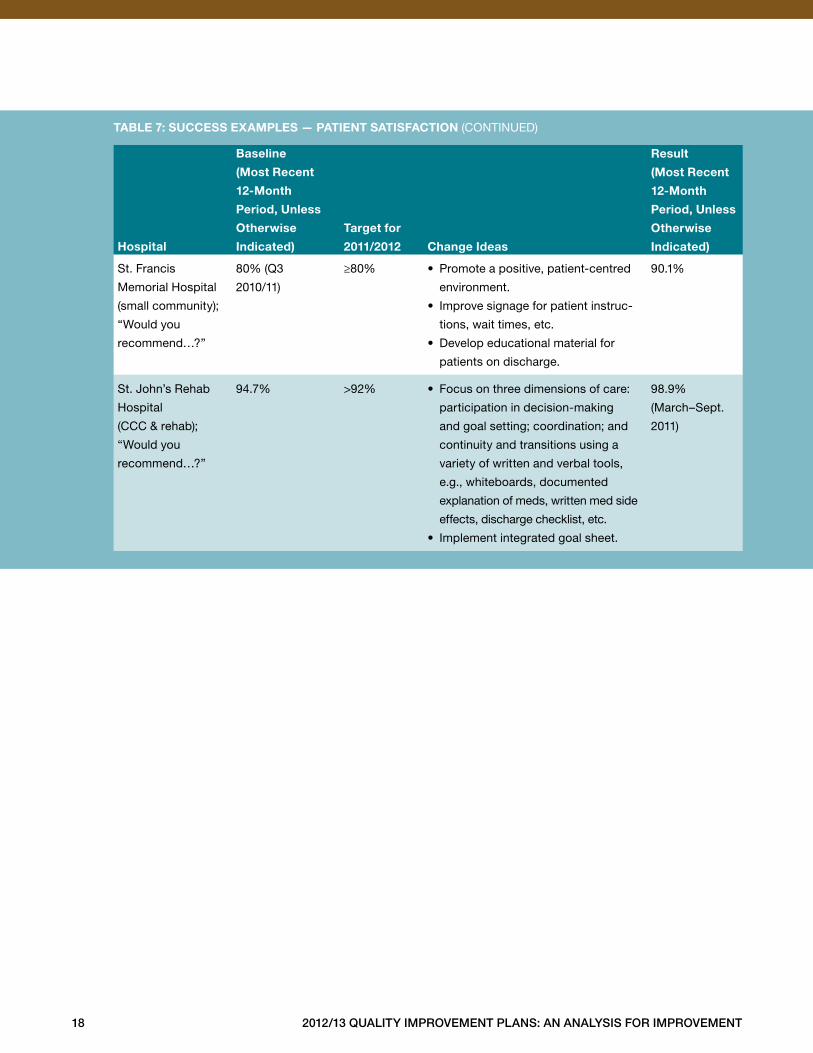
hospital
Baseline
(most recent
12-month
period, unless
otherwise
indicated)
target for
2011/2012
change ideas
result
(most recent
12-month
period, unless
otherwise
indicated)
St . Francis
Memorial Hospital
(small community);
“Would you
recommend…?”
80% (Q3
2010/11)
≥80% • Promote a positive, patient-centred
environment .
• Improve signage for patient instruc-
tions, wait times, etc .
• Develop educational material for
patients on discharge .
90 .1%
St . John’s Rehab
Hospital
(CCC & rehab);
“Would you
recommend…?”
94 .7% >92% • Focus on three dimensions of care:
participation in decision-making
and goal setting; coordination; and
continuity and transitions using a
variety of written and verbal tools,
e .g ., whiteboards, documented
explanation of meds, written med side
effects, discharge checklist, etc .
• Implement integrated goal sheet .
98 .9%
(March–Sept .
2011)
taBle 7: success examples — patient satisfaction (CONTINUED)
2012/13 Quality improvement plans: an analysis for improvement 19
Overview: Priority Setting, Target Setting and Change Plans
priority setting
A QIP is an important place to identify key priorities for
improvement . Priorities help organizations focus on what
they want to accomplish . Hospitals have the option of
designating a priority level of 1, 2 or 3 to the objectives
identified in their QIPs . It is recommended that indicators
where performance has been below organizational goals
be given the strongest consideration as Priority 1 or 2 .
Priority 1 indicators must be closely aligned with orga-
nizational strategic priorities, and will receive a greater
emphasis in terms of change plans and resources for
implementation than lower-priority indicators . When
results have been sustained at rates that are consistent
with organizational goals, or performance is at or near
theoretical best, a Priority 3 rating should be considered .
considerations When setting priorities
Priority setting can be a complex process that requires
organizations to consider and balance a number of
different factors . Organizations often consider the
following issues when choosing topic areas as priorities:
• How does the proposed topic align with our strategic
objectives?
• In which areas are we currently performing below
desired performance?
• Which quality problems are occurring most frequently,
and what are the most serious consequences when
they do occur?
Many hospitals did a good job explaining how their QIPs
aligned with their strategic priorities within the Part A
Short Form, including Lady Minto Hospital, Lake of the
Woods District Hospital, The Royal Ottawa Health Care
Group, St . Joseph’s Continuing Care Centre of Sudbury,
Listowel Memorial Hospital and Providence Care . (This
is not a comprehensive list, but rather a selection of
good narratives .)
excerpts from Qip part a short forms
The Quality Improvement Plan and selected
indicators are aligned with the NELHIN [North
East Local Health Integration Network]
Integrated Health Services Plan, Hospital
Service Accountability Agreement, Network
13 Strategic Plan, our community partners’
strategic plans, Accreditation Canada and the
MIC Group of Health Services Strategic Plan.
– Lady Minto Hospital
The LWDH Quality Improvement Plan for
2012/13 is in alignment with LHIN objectives
and the H-SAA agreement with the MOHLTC.
It is coordinated with organizational strategic
goals, the mission/vision/values of the organi-
zation and the LWDH Integrated Quality/Risk
Framework. It is also aligned with governance
policies and ends of the Board of Directors.
The Quality Improvement Plan supports best
practices as defined by Accreditation Canada.
The plan incorporates consultation with and
participation by our health care partners to
achieve the planned objectives.
– Lake of the Woods District Hospital
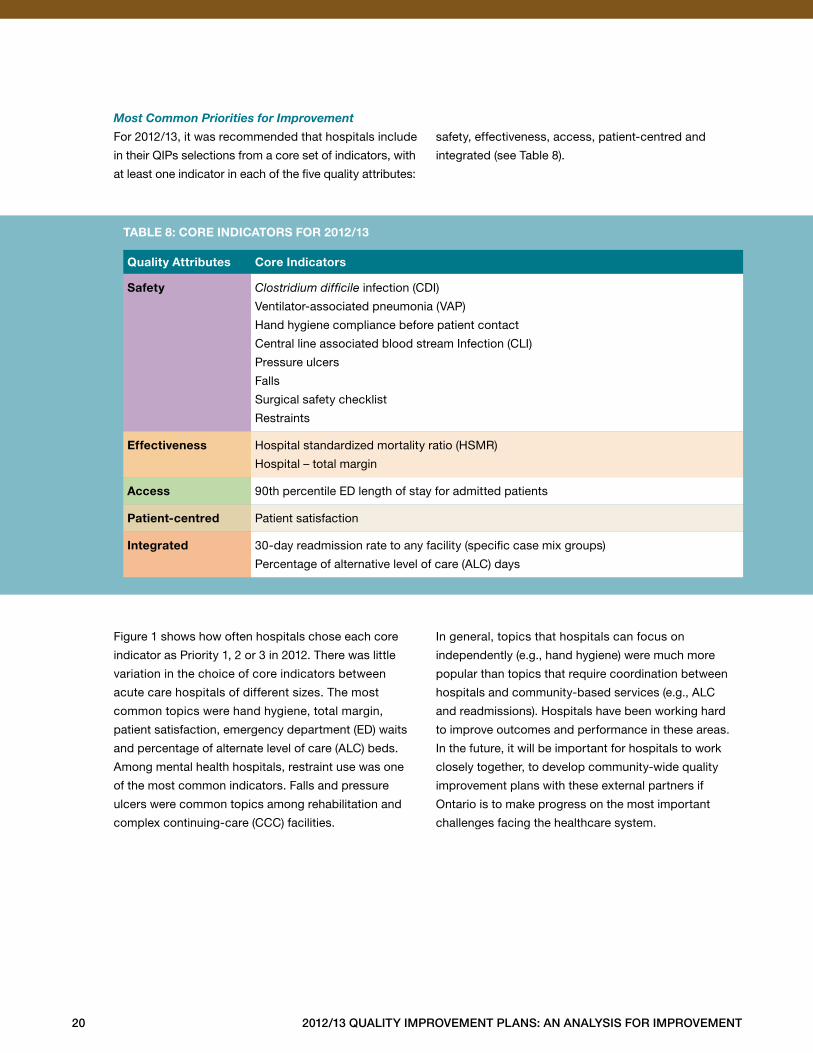
Quality attributes core indicators
safety Clostridium difficile infection (CDI)
Ventilator-associated pneumonia (VAP)
Hand hygiene compliance before patient contact
Central line associated blood stream Infection (CLI)
Pressure ulcers
Falls
Surgical safety checklist
Restraints
effectiveness Hospital standardized mortality ratio (HSMR)
Hospital – total margin
access 90th percentile ED length of stay for admitted patients
patient-centred Patient satisfaction
integrated 30-day readmission rate to any facility (specific case mix groups)
Percentage of alternative level of care (ALC) days
taBle 8: core indicators for 2012/13
20 2012/13 Quality improvement plans: an analysis for improvement
Most Common Priorities for ImprovementFor 2012/13, it was recommended that hospitals include
in their QIPs selections from a core set of indicators, with
at least one indicator in each of the five quality attributes:
safety, effectiveness, access, patient-centred and
integrated (see Table 8) .
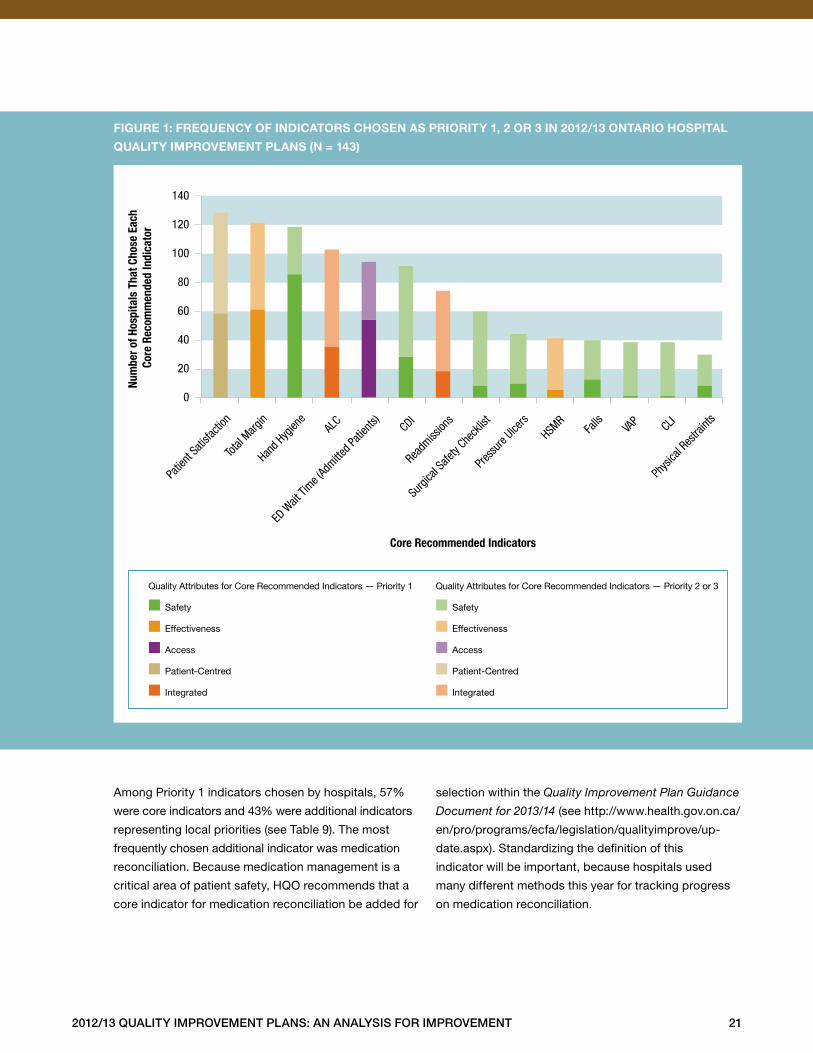
Figure 1 shows how often hospitals chose each core
indicator as Priority 1, 2 or 3 in 2012 . There was little
variation in the choice of core indicators between
acute care hospitals of different sizes . The most
common topics were hand hygiene, total margin,
patient satisfaction, emergency department (ED) waits
and percentage of alternate level of care (ALC) beds .
Among mental health hospitals, restraint use was one
of the most common indicators . Falls and pressure
ulcers were common topics among rehabilitation and
complex continuing-care (CCC) facilities .
In general, topics that hospitals can focus on
independently (e .g ., hand hygiene) were much more
popular than topics that require coordination between
hospitals and community-based services (e .g ., ALC
and readmissions) . Hospitals have been working hard
to improve outcomes and performance in these areas .
In the future, it will be important for hospitals to work
closely together, to develop community-wide quality
improvement plans with these external partners if
Ontario is to make progress on the most important
challenges facing the healthcare system .
2012/13 Quality improvement plans: an analysis for improvement 21
0
20
40
60
80
100
120
140
Patie
nt Sa
tisfac
tion
Total
Margin
Hand H
ygien
e AL
C
ED W
ait Ti
me (Ad
mitted P
atien
ts) CDI
Readm
ission
s
Surgi
cal S
afety
Check
list
Press
ure Ulce
rs
HSMR
Falls
VA
P CLI
Phys
ical R
estra
ints
Core Recommended Indicators
Num
ber o
f Hos
pita
ls T
hat C
hose
Eac
h Co
re R
ecom
men
ded
Indi
cato
r
Quality Attributes for Core Recommended Indicators
Safety
Effectiveness
Access
Patient-Centred
Integrated
Quality Attributes for Core Recommended Indicators — Priority 1
■ Safety
■ Effectiveness
■ Access
■ Patient-Centred
■ Integrated
Quality Attributes for Core Recommended Indicators — Priority 2 or 3
■ Safety
■ Effectiveness
■ Access
■ Patient-Centred
■ Integrated
Pri 2 or 3 ■ ■ Pri 1
figure 1: freQuency of indicators chosen as priority 1, 2 or 3 in 2012/13 ontario hospital
Quality improvement plans (n = 143)
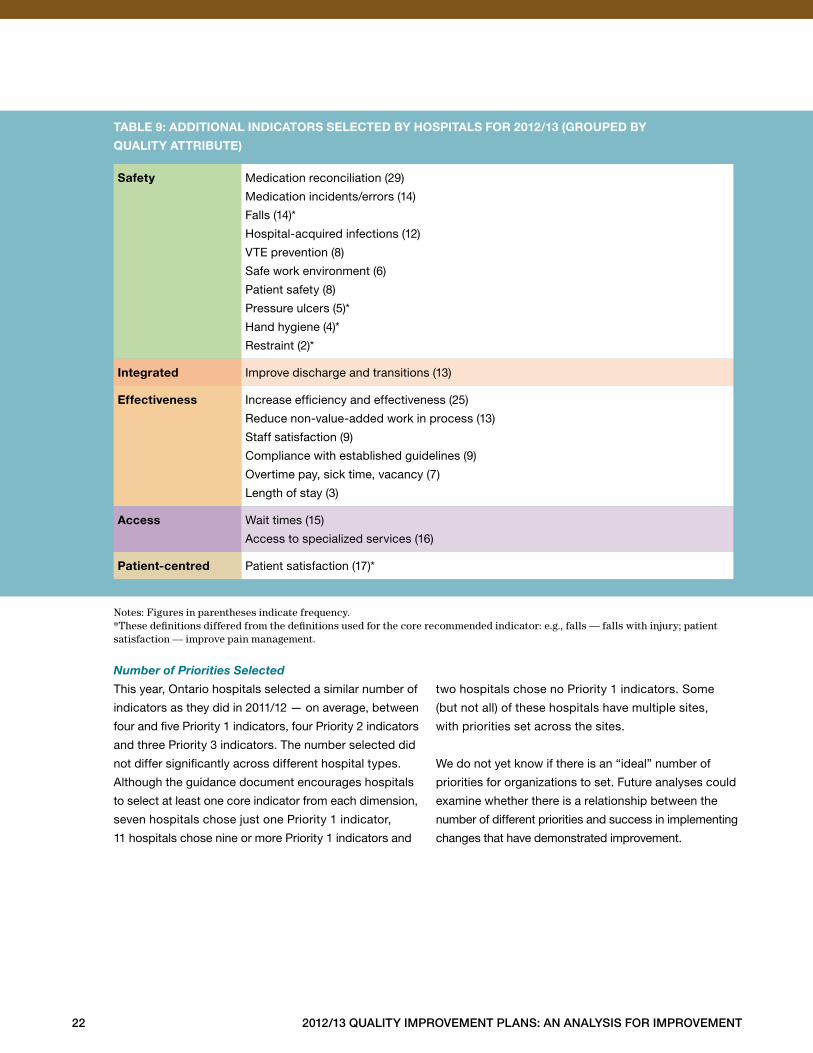
Among Priority 1 indicators chosen by hospitals, 57%
were core indicators and 43% were additional indicators
representing local priorities (see Table 9) . The most
frequently chosen additional indicator was medication
reconciliation . Because medication management is a
critical area of patient safety, HQO recommends that a
core indicator for medication reconciliation be added for
selection within the Quality Improvement Plan Guidance
Document for 2013/14 (see http://www .health .gov .on .ca/
en/pro/programs/ecfa/legislation/qualityimprove/up-
date .aspx) . Standardizing the definition of this
indicator will be important, because hospitals used
many different methods this year for tracking progress
on medication reconciliation .
safety Medication reconciliation (29)
Medication incidents/errors (14)
Falls (14)*
Hospital-acquired infections (12)
VTE prevention (8)
Safe work environment (6)
Patient safety (8)
Pressure ulcers (5)*
Hand hygiene (4)*
Restraint (2)*
integrated Improve discharge and transitions (13)
effectiveness Increase efficiency and effectiveness (25)
Reduce non-value-added work in process (13)
Staff satisfaction (9)
Compliance with established guidelines (9)
Overtime pay, sick time, vacancy (7)
Length of stay (3)
access Wait times (15)
Access to specialized services (16)
patient-centred Patient satisfaction (17)*
taBle 9: additional indicators selected By hospitals for 2012/13 (grouped By
Quality attriBute)
22 2012/13 Quality improvement plans: an analysis for improvement
Notes: Figures in parentheses indicate frequency. *These definitions differed from the definitions used for the core recommended indicator: e.g., falls — falls with injury; patient satisfaction — improve pain management.
Number of Priorities SelectedThis year, Ontario hospitals selected a similar number of
indicators as they did in 2011/12 — on average, between
four and five Priority 1 indicators, four Priority 2 indicators
and three Priority 3 indicators . The number selected did
not differ significantly across different hospital types .
Although the guidance document encourages hospitals
to select at least one core indicator from each dimension,
seven hospitals chose just one Priority 1 indicator,
11 hospitals chose nine or more Priority 1 indicators and
two hospitals chose no Priority 1 indicators . Some
(but not all) of these hospitals have multiple sites,
with priorities set across the sites .
We do not yet know if there is an “ideal” number of
priorities for organizations to set . Future analyses could
examine whether there is a relationship between the
number of different priorities and success in implementing
changes that have demonstrated improvement .
2012/13 Quality improvement plans: an analysis for improvement 23
target setting
Target setting is an important component of QIPs:
Organizations are more likely to achieve major
improvement when they set a stretch target — that is,
one that is challenging but achievable . Stretch targets
can be inspirational . They motivate staff and, when
accomplished, can engender confidence in staff’s
ability to tackle the next major challenge .
Determining an appropriate stretch target is a challenging
exercise: What constitutes significant change, but not
so much change that it will be impossible to implement?
Hospitals are encouraged to develop target setting
processes that engage all stakeholders, including
front-line staff . Modelling of different scenarios may be
helpful for hospitals to project the impact of planned
changes, allowing hospitals to set targets with greater
confidence .
The relentless pursuit of excellence underpins the
Excellent Care for All Act and is a central tenet of quality
improvement . Setting aspirational improvement and/or
performance targets is a critical first step . Excellence can
only occur when hospitals are fully accountable — to
the public, their staff, their boards and their peers —
to achieve the targets articulated in their QIPs and
continually strive to achieve higher levels of performance .
Hospitals should distinguish target setting for
accountability agreements from target setting for
quality improvement . Targets contained in accountability
agreements represent the basic level of quality for an
organization that must be achieved . Setting targets for
quality improvement is about challenging providers and
staff, your organization as a whole and eventually the
system to achieve higher levels of performance and to
reliably deliver high-quality care .
areas for improvement identified in target setting
for Qips
The careful consideration that went into target setting
in many hospitals was evident within the 2012/13 QIPs .
Some suggestions are offered for hospitals with plans
that had missing baseline measures or targets, missing
or unclear target justification or targets set at or below
baseline performance .
1. missing Baseline measures or targets
In some cases, hospitals did not provide a figure for
baseline performance . This occurred most commonly
when a hospital was aiming to improve in an area where
no data had previously been collected . Lack of baseline
data makes it difficult to set a realistic target .
In other cases, hospitals did not set a specific numeric
target . Instead, they stated that the target was to be
“better,” “meet the average” or, “reduce by X cases .”
In most cases, the hospitals did not provide a clear
justification for the lack of a numeric target .
SuggestionsIf a hospital does not have baseline data, it could
consider including a data collection plan in its QIP
along with specific timelines pinpointing when it will
finish collecting the baseline data, and make an updated
plan with a numeric target available to the public and
to staff .
Having a clear, numeric target and setting a specific time
frame within which to reach that target are essential to
success . When the target is vague (e .g ., “just do your
best” or, “do better”), there is no shared understanding
amongst staff of what success means .
2. missing or unclear target Justification
For some targets, hospitals did not provide a clear
indication of how their target was selected . In some
cases hospitals stated what target was selected but did
not reflect on why the target was selected . For example,
“We have set a target of 5% improvement” provides
no information about how this target was selected .
A well-written target justification might read as follows:
“Given current performance of 60% for hand hygiene,
we are targeting 80%, in order to cut our defect rate
in half . We believe this is an aspirational target that
can be achieved through concerted effort to implement
our change plan .”
24 2012/13 Quality improvement plans: an analysis for improvement
SuggestionsIt is recommended that hospitals clearly describe the
rationale for the targets set in the target justification
component of their QIPs, in order to ensure a consistent
process for target setting .
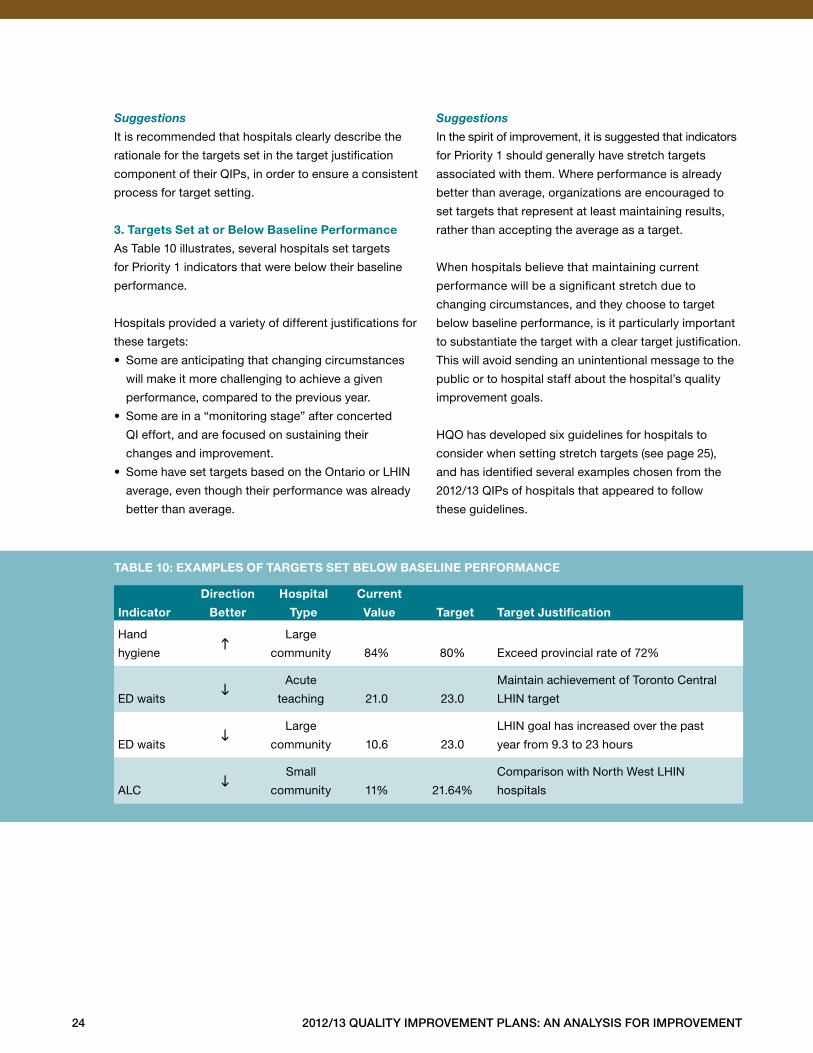
3. targets set at or Below Baseline performance
As Table 10 illustrates, several hospitals set targets
for Priority 1 indicators that were below their baseline
performance .
Hospitals provided a variety of different justifications for
these targets:
• Some are anticipating that changing circumstances
will make it more challenging to achieve a given
performance, compared to the previous year .
• Some are in a “monitoring stage” after concerted
QI effort, and are focused on sustaining their
changes and improvement .
• Some have set targets based on the Ontario or LHIN
average, even though their performance was already
better than average .
SuggestionsIn the spirit of improvement, it is suggested that indicators
for Priority 1 should generally have stretch targets
associated with them . Where performance is already
better than average, organizations are encouraged to
set targets that represent at least maintaining results,
rather than accepting the average as a target .
When hospitals believe that maintaining current
performance will be a significant stretch due to
changing circumstances, and they choose to target
below baseline performance, is it particularly important
to substantiate the target with a clear target justification .
This will avoid sending an unintentional message to the
public or to hospital staff about the hospital’s quality
improvement goals .
HQO has developed six guidelines for hospitals to
consider when setting stretch targets (see page 25),
and has identified several examples chosen from the
2012/13 QIPs of hospitals that appeared to follow
these guidelines .
indicator
direction
Better
hospital
type
current
value
target
target Justification
Hand
hygieneh
Large
community
84%
80% Exceed provincial rate of 72%
ED waitsi
Acute
teaching
21 .0 23 .0
Maintain achievement of Toronto Central
LHIN target
ED waitsi
Large
community
10 .6 23 .0
LHIN goal has increased over the past
year from 9 .3 to 23 hours
ALCi
Small
community
11% 21 .64%
Comparison with North West LHIN
hospitals
taBle 10: examples of targets set BeloW Baseline performance
2012/13 Quality improvement plans: an analysis for improvement 25
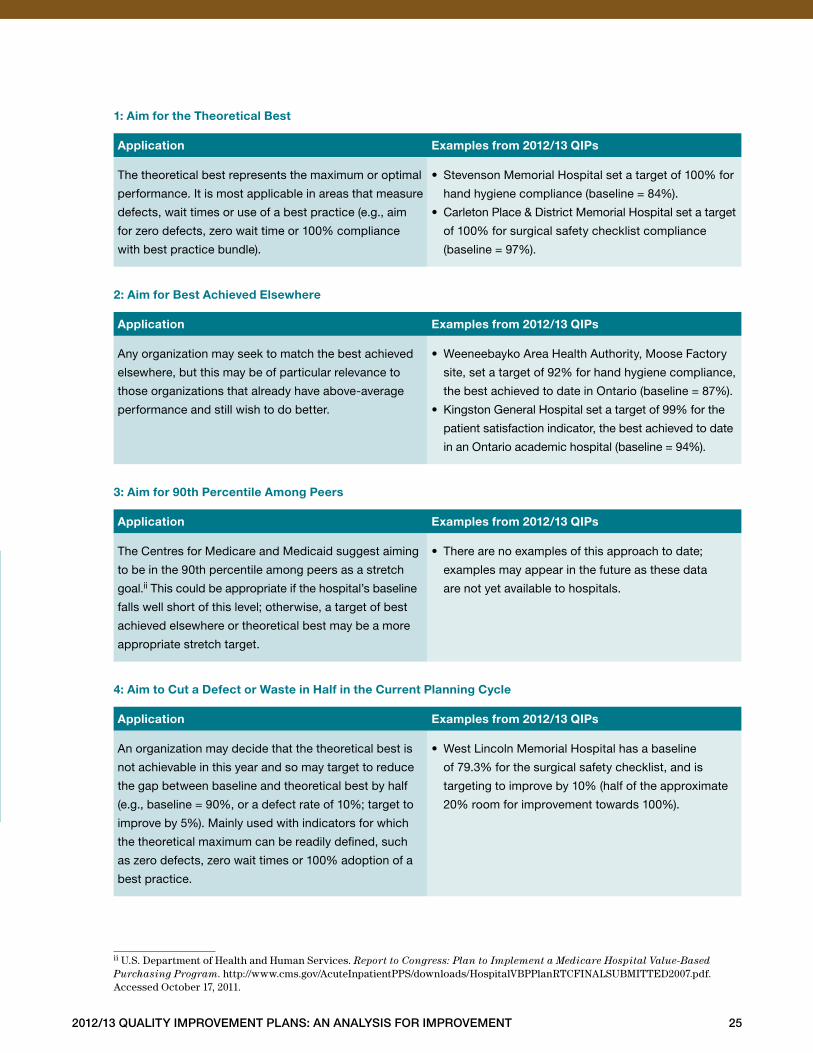
1: aim for the theoretical Best
application examples from 2012/13 Qips
The theoretical best represents the maximum or optimal
performance . It is most applicable in areas that measure
defects, wait times or use of a best practice (e .g ., aim
for zero defects, zero wait time or 100% compliance
with best practice bundle) .
• Stevenson Memorial Hospital set a target of 100% for
hand hygiene compliance (baseline = 84%) .
• Carleton Place & District Memorial Hospital set a target
of 100% for surgical safety checklist compliance
(baseline = 97%) .
2: aim for Best achieved elsewhere
application examples from 2012/13 Qips
Any organization may seek to match the best achieved
elsewhere, but this may be of particular relevance to
those organizations that already have above-average
performance and still wish to do better .
• Weeneebayko Area Health Authority, Moose Factory
site, set a target of 92% for hand hygiene compliance,
the best achieved to date in Ontario (baseline = 87%) .
• Kingston General Hospital set a target of 99% for the
patient satisfaction indicator, the best achieved to date
in an Ontario academic hospital (baseline = 94%) .
3: aim for 90th percentile among peers
application examples from 2012/13 Qips
The Centres for Medicare and Medicaid suggest aiming
to be in the 90th percentile among peers as a stretch
goal .ii This could be appropriate if the hospital’s baseline
falls well short of this level; otherwise, a target of best
achieved elsewhere or theoretical best may be a more
appropriate stretch target .
• There are no examples of this approach to date;
examples may appear in the future as these data
are not yet available to hospitals .
4: aim to cut a defect or Waste in half in the current planning cycle
application examples from 2012/13 Qips
An organization may decide that the theoretical best is
not achievable in this year and so may target to reduce
the gap between baseline and theoretical best by half
(e .g ., baseline = 90%, or a defect rate of 10%; target to
improve by 5%) . Mainly used with indicators for which
the theoretical maximum can be readily defined, such
as zero defects, zero wait times or 100% adoption of a
best practice .
• West Lincoln Memorial Hospital has a baseline
of 79 .3% for the surgical safety checklist, and is
targeting to improve by 10% (half of the approximate
20% room for improvement towards 100%) .
ii U.S. Department of Health and Human Services. Report to Congress: Plan to Implement a Medicare Hospital Value-Based Purchasing Program. http://www.cms.gov/AcuteInpatientPPS/downloads/HospitalVBPPlanRTCFINALSUBMITTED2007.pdf. Accessed October 17, 2011.
26 2012/13 Quality improvement plans: an analysis for improvement
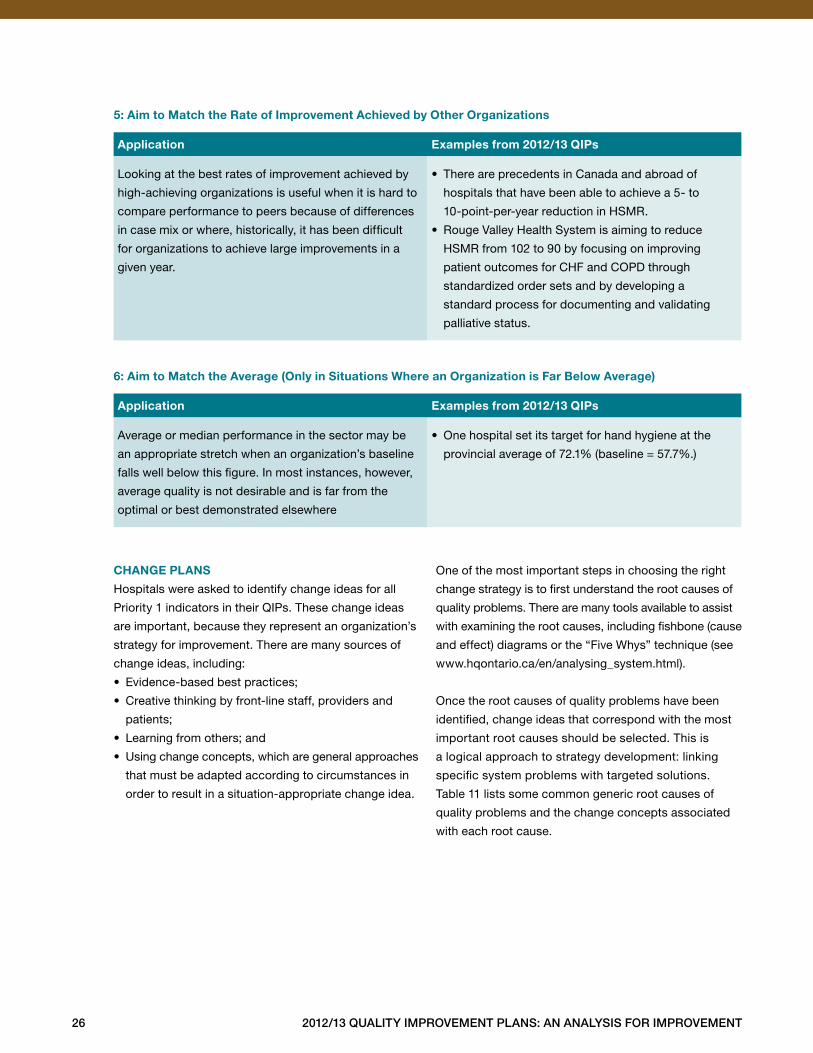
5: aim to match the rate of improvement achieved by other organizations
application examples from 2012/13 Qips
Looking at the best rates of improvement achieved by
high-achieving organizations is useful when it is hard to
compare performance to peers because of differences
in case mix or where, historically, it has been difficult
for organizations to achieve large improvements in a
given year .
• There are precedents in Canada and abroad of
hospitals that have been able to achieve a 5- to
10-point-per-year reduction in HSMR .
• Rouge Valley Health System is aiming to reduce
HSMR from 102 to 90 by focusing on improving
patient outcomes for CHF and COPD through
standardized order sets and by developing a
standard process for documenting and validating
palliative status .
6: aim to match the average (only in situations Where an organization is far Below average)
application examples from 2012/13 Qips
Average or median performance in the sector may be
an appropriate stretch when an organization’s baseline
falls well below this figure . In most instances, however,
average quality is not desirable and is far from the
optimal or best demonstrated elsewhere
• One hospital set its target for hand hygiene at the
provincial average of 72 .1% (baseline = 57 .7% .)
change plans
Hospitals were asked to identify change ideas for all
Priority 1 indicators in their QIPs . These change ideas
are important, because they represent an organization’s
strategy for improvement . There are many sources of
change ideas, including:
• Evidence-based best practices;
• Creative thinking by front-line staff, providers and
patients;
• Learning from others; and
• Using change concepts, which are general approaches
that must be adapted according to circumstances in
order to result in a situation-appropriate change idea .
One of the most important steps in choosing the right
change strategy is to first understand the root causes of
quality problems . There are many tools available to assist
with examining the root causes, including fishbone (cause
and effect) diagrams or the “Five Whys” technique (see
www .hqontario .ca/en/analysing_system .html) .
Once the root causes of quality problems have been
identified, change ideas that correspond with the most
important root causes should be selected . This is
a logical approach to strategy development: linking
specific system problems with targeted solutions .
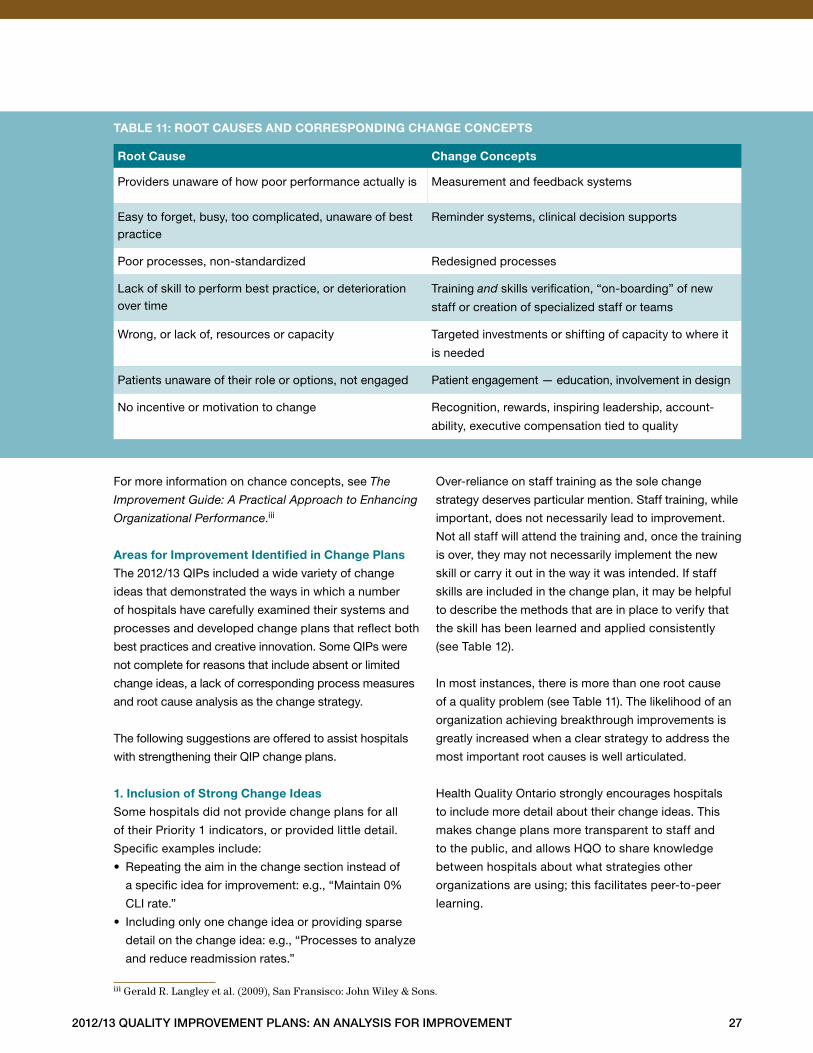
Table 11 lists some common generic root causes of
quality problems and the change concepts associated
with each root cause .
2012/13 Quality improvement plans: an analysis for improvement 27
For more information on chance concepts, see The
Improvement Guide: A Practical Approach to Enhancing
Organizational Performance .iii
areas for improvement identified in change plans
The 2012/13 QIPs included a wide variety of change
ideas that demonstrated the ways in which a number
of hospitals have carefully examined their systems and
processes and developed change plans that reflect both
best practices and creative innovation . Some QIPs were
not complete for reasons that include absent or limited
change ideas, a lack of corresponding process measures
and root cause analysis as the change strategy .
The following suggestions are offered to assist hospitals
with strengthening their QIP change plans .
1. inclusion of strong change ideas
Some hospitals did not provide change plans for all
of their Priority 1 indicators, or provided little detail .
Specific examples include:
• Repeating the aim in the change section instead of
a specific idea for improvement: e .g ., “Maintain 0%
CLI rate .”
• Including only one change idea or providing sparse
detail on the change idea: e .g ., “Processes to analyze
and reduce readmission rates .”
Over-reliance on staff training as the sole change
strategy deserves particular mention . Staff training, while
important, does not necessarily lead to improvement .
Not all staff will attend the training and, once the training
is over, they may not necessarily implement the new
skill or carry it out in the way it was intended . If staff
skills are included in the change plan, it may be helpful
to describe the methods that are in place to verify that
the skill has been learned and applied consistently
(see Table 12) .
In most instances, there is more than one root cause
of a quality problem (see Table 11) . The likelihood of an
organization achieving breakthrough improvements is
greatly increased when a clear strategy to address the
most important root causes is well articulated .
Health Quality Ontario strongly encourages hospitals
to include more detail about their change ideas . This
makes change plans more transparent to staff and
to the public, and allows HQO to share knowledge
between hospitals about what strategies other
organizations are using; this facilitates peer-to-peer
learning .
taBle 11: root causes and corresponding change concepts
root cause change concepts
Providers unaware of how poor performance actually is Measurement and feedback systems
Easy to forget, busy, too complicated, unaware of best practice
Reminder systems, clinical decision supports
Poor processes, non-standardized Redesigned processes
Lack of skill to perform best practice, or deterioration over time
Training and skills verification, “on-boarding” of new
staff or creation of specialized staff or teams
Wrong, or lack of, resources or capacity Targeted investments or shifting of capacity to where it
is needed
Patients unaware of their role or options, not engaged Patient engagement — education, involvement in design
No incentive or motivation to change Recognition, rewards, inspiring leadership, account-
ability, executive compensation tied to quality
iii Gerald R. Langley et al. (2009), San Fransisco: John Wiley & Sons.
28 2012/13 Quality improvement plans: an analysis for improvement
See the “Quality Improvement by Indicator” section
for examples of good change ideas submitted in this
year’s QIPs for four of the most selected indicators:
hand hygiene, patient satisfaction, ALC and ED waits .
2. root cause analysis as a Key part of the change
strategy
In some QIPs, hospitals did not specify any change
ideas . Instead, they set out a plan to collect data, do a
root cause analysis and then identify change ideas — for
example, “Analyze data from client experience survey .”
While it is good practice to identify root causes before
specifying a change strategy, we recommend that this
process be done before hospitals complete their QIPs .
If this is not possible, then hospitals may consider
specifying a target date for when specific change ideas
will be put forward, and then commit to making them
public at that time .
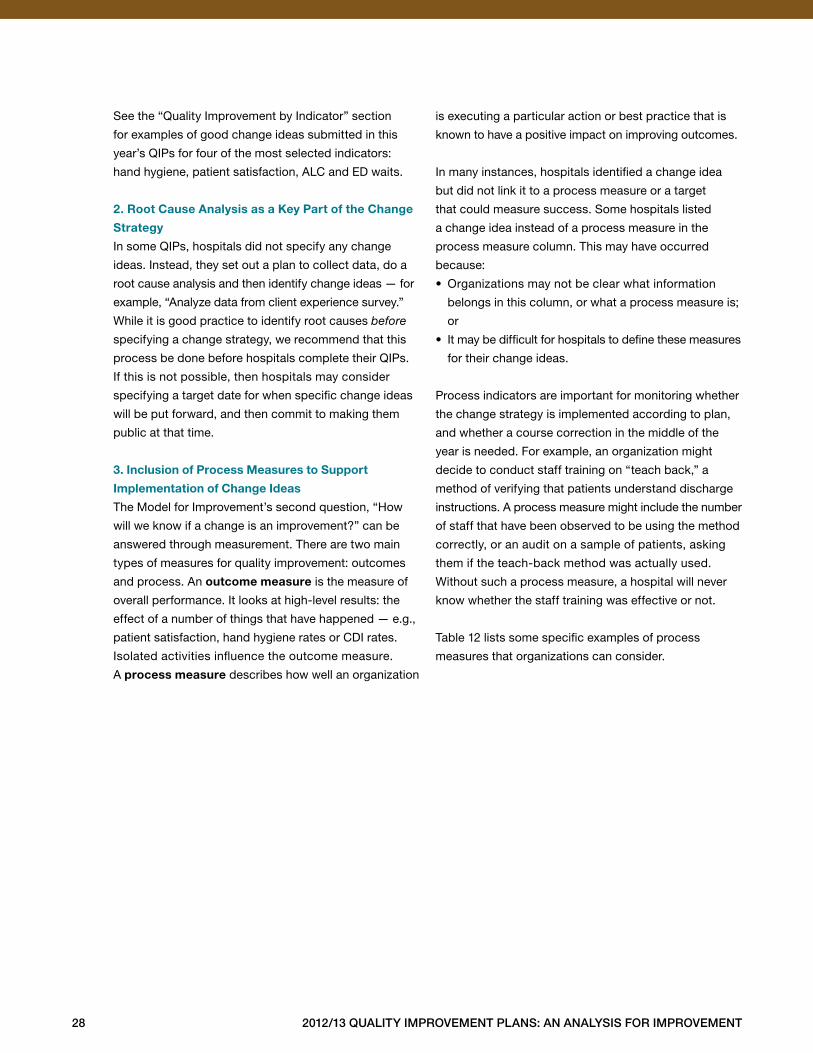
3. inclusion of process measures to support
implementation of change ideas
The Model for Improvement’s second question, “How
will we know if a change is an improvement?” can be
answered through measurement . There are two main
types of measures for quality improvement: outcomes
and process . An outcome measure is the measure of
overall performance . It looks at high-level results: the
effect of a number of things that have happened — e .g .,
patient satisfaction, hand hygiene rates or CDI rates .
Isolated activities influence the outcome measure .
A process measure describes how well an organization
is executing a particular action or best practice that is
known to have a positive impact on improving outcomes .
In many instances, hospitals identified a change idea
but did not link it to a process measure or a target
that could measure success . Some hospitals listed
a change idea instead of a process measure in the
process measure column . This may have occurred
because:
• Organizations may not be clear what information
belongs in this column, or what a process measure is;
or
• It may be difficult for hospitals to define these measures
for their change ideas .
Process indicators are important for monitoring whether
the change strategy is implemented according to plan,
and whether a course correction in the middle of the
year is needed . For example, an organization might
decide to conduct staff training on “teach back,” a
method of verifying that patients understand discharge
instructions . A process measure might include the number
of staff that have been observed to be using the method
correctly, or an audit on a sample of patients, asking
them if the teach-back method was actually used .
Without such a process measure, a hospital will never
know whether the staff training was effective or not .
Table 12 lists some specific examples of process
measures that organizations can consider .
2012/13 Quality improvement plans: an analysis for improvement 29
taBle 12: examples of potential process measures per change concept
change concepts example of process measure
Measurement and feedback
systems
Number of leadership walkabouts per month, number of audits performed
per month, number of on-the-spot feedbacks provided per month
Reminder systems, clinical
decision supports
Percentage of time reminder system was used, number of times
decision-support system used per day
Redesigned processes Percentage of time the “new” process was used appropriately, or
implemented correctly the first time (i .e ., first-time pass)
Training and skills verification,
“on-boarding” of new staff or
creation of specialized staff
or teams
Percentage of staff that attend training, percentage of staff that pass
the quiz/test, percentage of staff observed performing skill correctly
“on the job”
Targeted investments or shifting
of capacity to where it is needed
Percentage of patients admitted with assessments complete, percentage
of patients seen by appropriate triage team, number of appropriate referrals
received per month
Patient engagement —
education, involvement
in design
Percentage of patients that can “teach back” to healthcare provider,
percentage of patients/families that receive educational brochure, number
of outreach sessions provided per month
Recognition, rewards,
inspiring leadership,
accountability, executive
compensation tied to quality
Number of rewards distributed quarterly, number of success stories printed
in hospital newsletter per month, number of champion roles developed
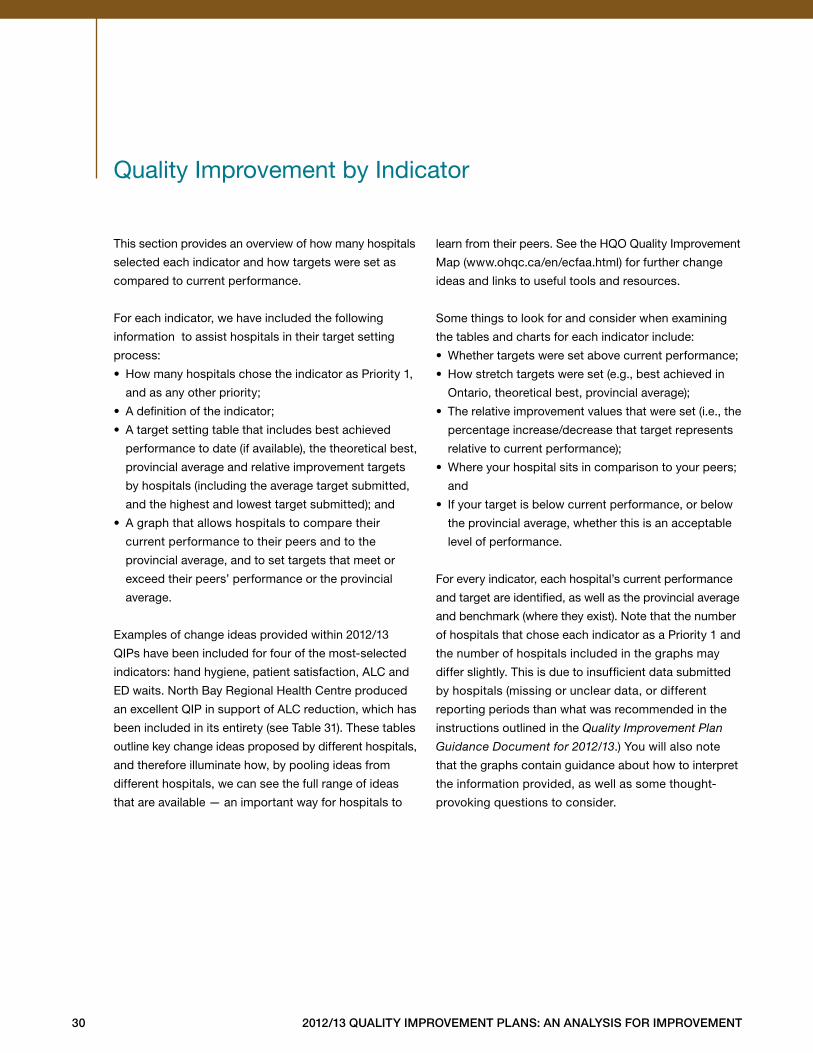
30 2012/13 Quality improvement plans: an analysis for improvement
Quality Improvement by Indicator
This section provides an overview of how many hospitals
selected each indicator and how targets were set as
compared to current performance .
For each indicator, we have included the following
information to assist hospitals in their target setting
process:
• How many hospitals chose the indicator as Priority 1,
and as any other priority;
• A definition of the indicator;
• A target setting table that includes best achieved
performance to date (if available), the theoretical best,
provincial average and relative improvement targets
by hospitals (including the average target submitted,
and the highest and lowest target submitted); and
• A graph that allows hospitals to compare their
current performance to their peers and to the
provincial average, and to set targets that meet or
exceed their peers’ performance or the provincial
average .
Examples of change ideas provided within 2012/13
QIPs have been included for four of the most-selected
indicators: hand hygiene, patient satisfaction, ALC and
ED waits . North Bay Regional Health Centre produced
an excellent QIP in support of ALC reduction, which has
been included in its entirety (see Table 31) . These tables
outline key change ideas proposed by different hospitals,
and therefore illuminate how, by pooling ideas from
different hospitals, we can see the full range of ideas
that are available — an important way for hospitals to
learn from their peers . See the HQO Quality Improvement
Map (www .ohqc .ca/en/ecfaa .html) for further change
ideas and links to useful tools and resources .
Some things to look for and consider when examining
the tables and charts for each indicator include:
• Whether targets were set above current performance;
• How stretch targets were set (e .g ., best achieved in
Ontario, theoretical best, provincial average);
• The relative improvement values that were set (i .e ., the
percentage increase/decrease that target represents
relative to current performance);
• Where your hospital sits in comparison to your peers;
and
• If your target is below current performance, or below
the provincial average, whether this is an acceptable
level of performance .
For every indicator, each hospital’s current performance
and target are identified, as well as the provincial average
and benchmark (where they exist) . Note that the number
of hospitals that chose each indicator as a Priority 1 and
the number of hospitals included in the graphs may
differ slightly . This is due to insufficient data submitted
by hospitals (missing or unclear data, or different
reporting periods than what was recommended in the
instructions outlined in the Quality Improvement Plan
Guidance Document for 2012/13 .) You will also note
that the graphs contain guidance about how to interpret
the information provided, as well as some thought-
provoking questions to consider .
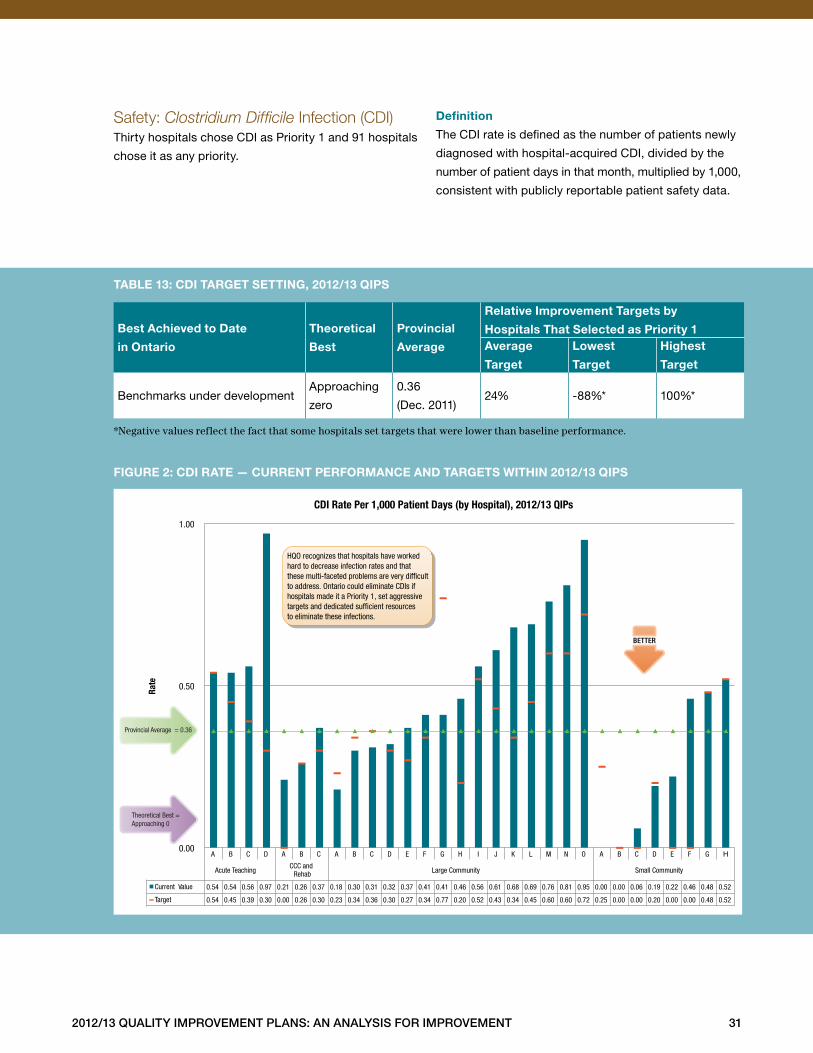
2012/13 Quality improvement plans: an analysis for improvement 31
Safety: Clostridium Difficile Infection (CDI)Thirty hospitals chose CDI as Priority 1 and 91 hospitals
chose it as any priority .
definition
The CDI rate is defined as the number of patients newly
diagnosed with hospital-acquired CDI, divided by the
number of patient days in that month, multiplied by 1,000,
consistent with publicly reportable patient safety data .
Best achieved to date
in ontario
theoretical
Best
provincial
average
relative improvement targets by
hospitals that selected as priority 1average
target
lowest
target
highest
target
Benchmarks under developmentApproaching
zero
0 .36
(Dec . 2011)24% -88%* 100%*
*Negative values reflect the fact that some hospitals set targets that were lower than baseline performance.
taBle 13: cdi target setting, 2012/13 Qips
figure 2: cdi rate — current performance and targets Within 2012/13 Qips
A B C D A B C A B C D E F G H I J K L M N O A B C D E F G H
Acute Teaching CCC and
Rehab Large Community Small Community
Current Value 0.54 0.54 0.56 0.97 0.21 0.26 0.37 0.18 0.30 0.31 0.32 0.37 0.41 0.41 0.46 0.56 0.61 0.68 0.69 0.76 0.81 0.95 0.00 0.00 0.06 0.19 0.22 0.46 0.48 0.52
Target 0.54 0.45 0.39 0.30 0.00 0.26 0.30 0.23 0.34 0.36 0.30 0.27 0.34 0.77 0.20 0.52 0.43 0.34 0.45 0.60 0.60 0.72 0.25 0.00 0.00 0.20 0.00 0.00 0.48 0.52
0.00
0.50
1.00
Rate
CDI Rate Per 1,000 Patient Days (by Hospital), 2012/13 QIPs
BETTER
Provincial Average = 0.36
Theoretical Best = Approaching 0
HQO recognizes that hospitals have worked hard to decrease infection rates and that these multi-faceted problems are very dif�cult to address. Ontario could eliminate CDIs if hospitals made it a Priority 1, set aggressive targets and dedicated suf�cient resources to eliminate these infections.
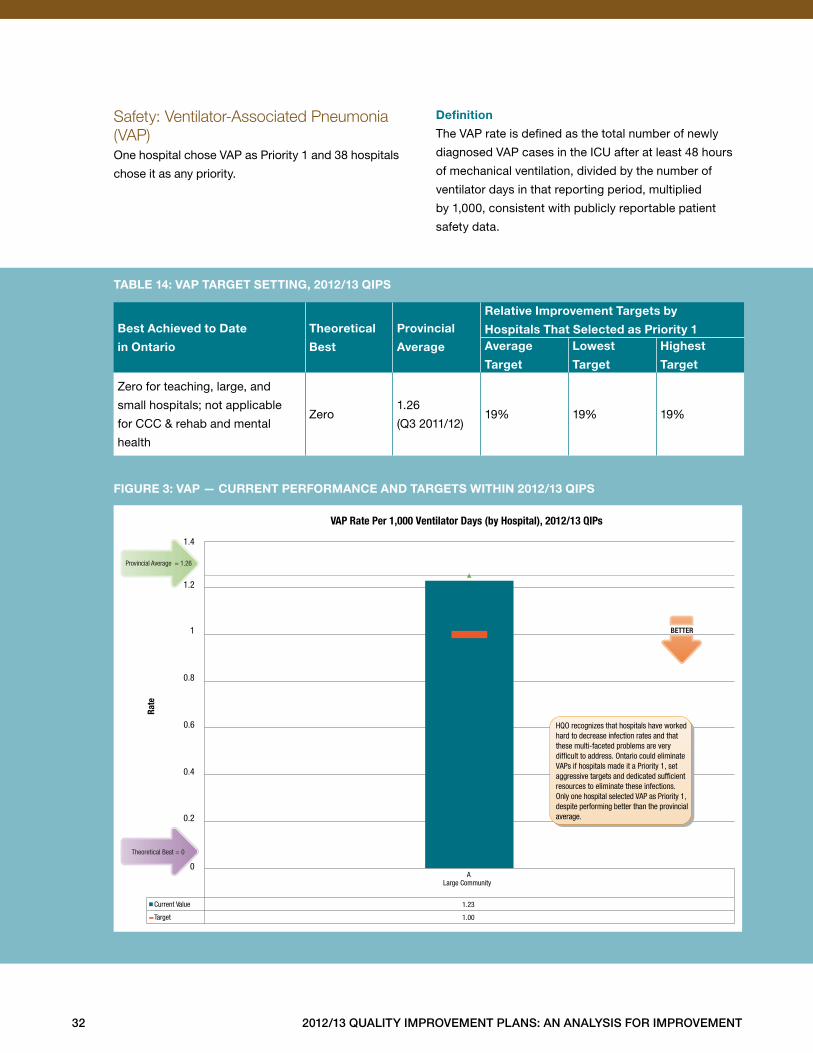
32 2012/13 Quality improvement plans: an analysis for improvement
Safety: Ventilator-Associated Pneumonia (VAP)One hospital chose VAP as Priority 1 and 38 hospitals
chose it as any priority .
definition
The VAP rate is defined as the total number of newly
diagnosed VAP cases in the ICU after at least 48 hours
of mechanical ventilation, divided by the number of
ventilator days in that reporting period, multiplied
by 1,000, consistent with publicly reportable patient
safety data .
Best achieved to date
in ontario
theoretical
Best
provincial
average
relative improvement targets by
hospitals that selected as priority 1average
target
lowest
target
highest
target
Zero for teaching, large, and
small hospitals; not applicable
for CCC & rehab and mental
health
Zero1 .26
(Q3 2011/12)19% 19% 19%
taBle 14: vap target setting, 2012/13 Qips
figure 3: vap — current performance and targets Within 2012/13 Qips
A Large Community
Current Value 1.23
Target 1.00
0.6
1.4
1.2
1
0.8
0.4
0.2
0
Rate
VAP Rate Per 1,000 Ventilator Days (by Hospital), 2012/13 QIPs
Provincial Average = 1.26
Theoretical Best = 0
BETTER
HQO recognizes that hospitals have worked hard to decrease infection rates and that these multi-faceted problems are very dif�cult to address. Ontario could eliminate VAPs if hospitals made it a Priority 1, set aggressive targets and dedicated suf�cient resources to eliminate these infections. Only one hospital selected VAP as Priority 1, despite performing better than the provincial average.
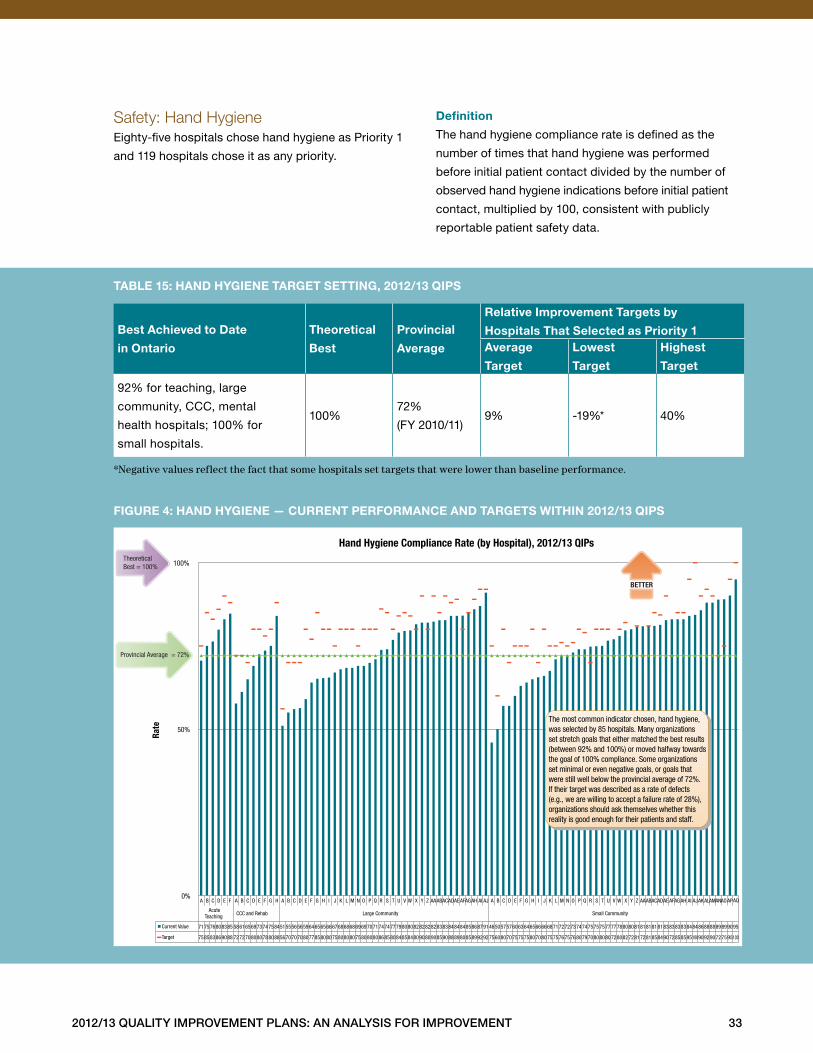
2012/13 Quality improvement plans: an analysis for improvement 33
Safety: Hand HygieneEighty-five hospitals chose hand hygiene as Priority 1
and 119 hospitals chose it as any priority .
definition
The hand hygiene compliance rate is defined as the
number of times that hand hygiene was performed
before initial patient contact divided by the number of
observed hand hygiene indications before initial patient
contact, multiplied by 100, consistent with publicly
reportable patient safety data .
Best achieved to date
in ontario
theoretical
Best
provincial
average
relative improvement targets by
hospitals that selected as priority 1average
target
lowest
target
highest
target
92% for teaching, large
community, CCC, mental
health hospitals; 100% for
small hospitals .
100%72%
(FY 2010/11)9% -19%* 40%
*Negative values reflect the fact that some hospitals set targets that were lower than baseline performance.
taBle 15: hand hygiene target setting, 2012/13 Qips
figure 4: hand hygiene — current performance and targets Within 2012/13 Qips
A B C D E F A B C D E F G H A B C D E F G H I J K L M N O P Q R S T U V W X Y Z AA AB AC AD AE AF AG AH AI AJ A B C D E F G H I J K L M N O P Q R S T U V W X Y Z AA AB AC AD AE AF AG AH AI AJ AK AL AM AN AO AP AQ
Acute Teaching CCC and Rehab Large Community Small Community
Current Value 71 75 76 80 83 85 58 61 65 69 73 74 75 84 51 55 56 56 59 64 65 65 66 67 68 68 68 69 69 70 71 74 74 77 79 80 80 82 82 82 82 83 83 84 84 84 85 86 87 91 46 50 57 57 60 63 64 65 66 66 68 71 72 72 73 74 74 75 75 75 77 77 78 80 80 81 81 81 81 81 83 83 83 83 84 84 86 88 88 89 89 90 95
Target 75 85 83 86 90 88 72 72 70 80 80 78 80 88 56 70 70 70 80 77 85 80 80 75 80 80 80 75 80 80 80 86 85 80 84 85 84 80 90 80 90 85 90 88 89 80 85 89 92 92 75 60 80 70 75 75 75 80 70 80 75 75 76 75 76 80 79 70 80 80 80 72 80 82 72 81 72 81 85 84 90 72 85 85 95 100 90 92 90 72 75 95 100
0%
50%
100%
Rate
Hand Hygiene Compliance Rate (by Hospital), 2012/13 QIPs
Provincial Average = 72%
Theoretical Best = 100%
BETTER
The most common indicator chosen, hand hygiene, was selected by 85 hospitals. Many organizations set stretch goals that either matched the best results (between 92% and 100%) or moved halfway towards the goal of 100% compliance. Some organizations set minimal or even negative goals, or goals that were still well below the provincial average of 72%. If their target was described as a rate of defects (e.g., we are willing to accept a failure rate of 28%), organizations should ask themselves whether this reality is good enough for their patients and staff.
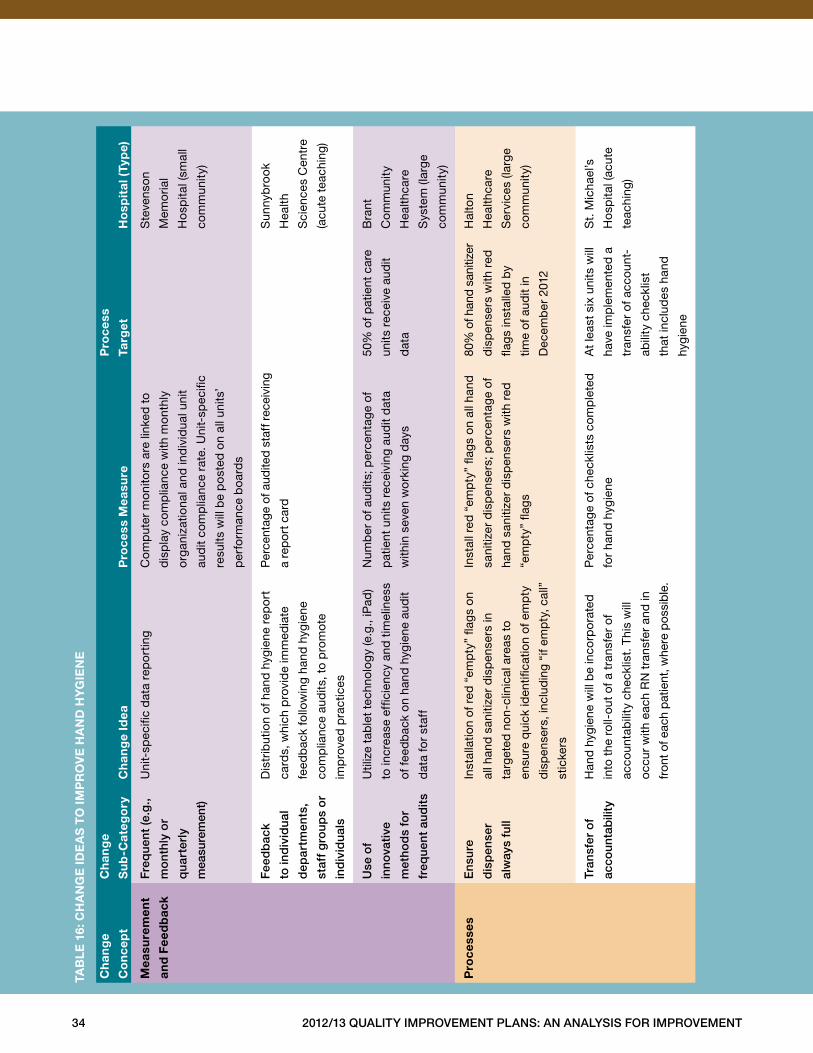
34 2012/13 Quality improvement plans: an analysis for improvement
ch
ang
e
co
nce
pt
ch
ang
e
su
b-c
ateg
ory
ch
ang
e id
ea
pro
cess
mea
sure
pro
cess
targ
et
ho
spit
al (
typ
e)
mea
sure
men
t
and
fee
db
ack
freq
uent
(e.g
.,
mo
nthl
y o
r
qu
arte
rly
mea
sure
men
t)
Uni
t-sp
ecifi
c d
ata
rep
ort
ing
Com
put
er m
onito
rs a
re li
nked
to
dis
pla
y co
mp
lianc
e w
ith m
onth
ly
org
aniz
atio
nal a
nd in
div
idua
l uni
t
aud
it co
mp
lianc
e ra
te . U
nit-
spec
ific
resu
lts w
ill b
e p
ost
ed o
n al
l uni
ts’
per
form
ance
boa
rds
Ste
vens
on
Mem
oria
l
Ho
spita
l (sm
all
com
mun
ity)
fee
db
ack
to in
div
idu
al
dep
artm
ents
,
staf
f g
roup
s o
r
ind
ivid
ual
s
Dis
trib
utio
n of
han
d h
ygie
ne r
epo
rt
card
s, w
hich
pro
vid
e im
med
iate
feed
bac
k fo
llow
ing
hand
hyg
iene
com
plia
nce
aud
its, t
o p
rom
ote
imp
rove
d p
ract
ices
Per
cent
age
of a
udite
d st
aff r
ecei
ving
a re
por
t car
d
Sun
nyb
rook
Hea
lth
Sci
ence
s C
entr
e
(acu
te t
each
ing)
use
of
inno
vati
ve
met
hod
s fo
r
freq
uent
au
dit
s
Util
ize
tab
let
tech
nolo
gy
(e .g
., iP
ad)
to in
crea
se e
ffici
ency
and
tim
elin
ess
of fe
edb
ack
on h
and
hyg
iene
aud
it
dat
a fo
r st
aff
Num
ber
of a
udits
; per
cent
age
of
pat
ient
uni
ts r
ecei
ving
aud
it d
ata
with
in s
even
wo
rkin
g d
ays
50%
of p
atie
nt c
are
units
rec
eive
aud
it
dat
a
Bra
nt
Co
mm
unity
Hea
lthca
re
Sys
tem
(lar
ge
com
mun
ity)
pro
cess
ese
nsur
e
dis
pen
ser
alw
ays
full
Inst
alla
tion
of r
ed “
emp
ty”
flag
s on
all h
and
san
itize
r d
isp
ense
rs in
targ
eted
non
-clin
ical
are
as t
o
ensu
re q
uick
iden
tifica
tion
of e
mp
ty
dis
pen
sers
, inc
lud
ing
“if e
mp
ty, c
all”
stic
kers
Inst
all r
ed “
emp
ty”
flag
s on
all
hand
sani
tizer
dis
pen
sers
; per
cent
age
of
hand
san
itize
r d
isp
ense
rs w
ith r
ed
“em
pty
” fla
gs
80%
of h
and
sani
tizer
dis
pen
sers
with
red
flag
s in
stal
led
by
time
of a
udit
in
Dec
emb
er 2
012
Hal
ton
Hea
lthca
re
Ser
vice
s (la
rge
com
mun
ity)
tran
sfer
of
acco
unta
bili
ty
Han
d h
ygie
ne w
ill b
e in
corp
ora
ted
into
the
rol
l-ou
t of
a t
rans
fer
of
acco
unta
bili
ty c
heck
list .
Thi
s w
ill
occ
ur w
ith e
ach
RN
tra
nsfe
r an
d in
fron
t of e
ach
pat
ient
, whe
re p
ossi
ble
.
Per
cent
age
of c
heck
lists
com
ple
ted
for
hand
hyg
iene
At
leas
t si
x un
its w
ill
have
imp
lem
ente
d a
tran
sfer
of a
ccou
nt-
abili
ty c
heck
list
that
incl
udes
han
d
hygi
ene
St .
Mic
hael
’s
Ho
spita
l (ac
ute
teac
hing
)
taB
le
16:
ch
an
ge
ide
as
to
imp
ro
ve
ha
nd
hy
gie
ne
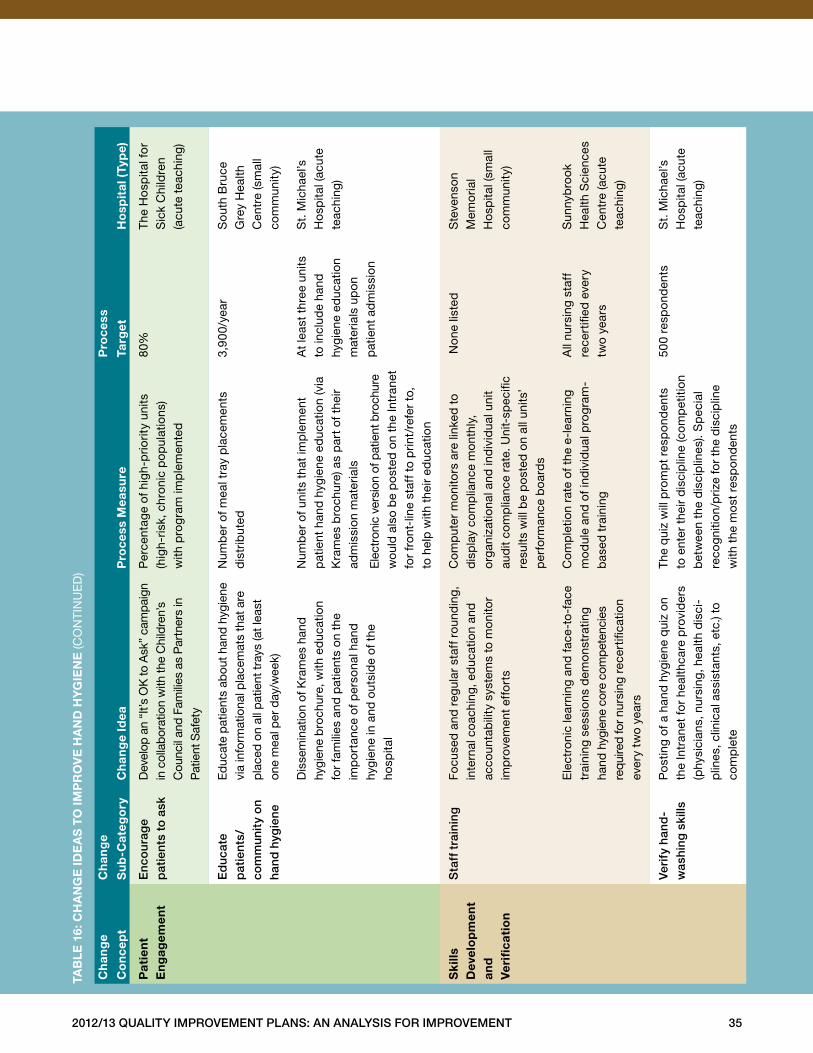
2012/13 Quality improvement plans: an analysis for improvement 35
ch
ang
e
co
nce
pt
ch
ang
e
su
b-c
ateg
ory
ch
ang
e id
ea
pro
cess
mea
sure
pro
cess
targ
et
ho
spit
al (
typ
e)
pat
ien
t
en
gag
emen
te
nco
urag
e
pat
ient
s to
ask
Dev
elop
an
“It’s
OK
to A
sk”
cam
paig
n in
col
lab
orat
ion
with
the
Chi
ldre
n’s
Cou
ncil
and
Fam
ilies
as
Par
tner
s in
P
atie
nt S
afet
y
Per
cent
age
of h
igh-
prio
rity
units
(h
igh-
risk,
chr
onic
pop
ulat
ions
) w
ith p
rog
ram
imp
lem
ente
d
80%
The
Ho
spita
l fo
r S
ick
Chi
ldre
n (a
cute
tea
chin
g)
ed
ucat
e
pat
ient
s/
com
mun
ity
on
hand
hyg
iene
Ed
ucat
e p
atie
nts
abou
t han
d hy
gien
e vi
a in
form
atio
nal p
lace
mat
s th
at a
re
pla
ced
on a
ll p
atie
nt tr
ays
(at l
east
on
e m
eal p
er d
ay/w
eek)
Num
ber
of m
eal t
ray
pla
cem
ents
d
istr
ibut
ed3,
900/
year
Sou
th B
ruce
G
rey
Hea
lth
Cen
tre
(sm
all
com
mun
ity)
Dis
sem
inat
ion
of K
ram
es h
and
hy
gien
e b
roch
ure,
with
ed
ucat
ion
fo
r fa
mili
es a
nd p
atie
nts
on t
he
imp
ort
ance
of p
erso
nal h
and
hy
gien
e in
and
out
sid
e of
the
ho
spita
l
Num
ber
of u
nits
tha
t im
ple
men
t p
atie
nt h
and
hyg
iene
ed
ucat
ion
(via
K
ram
es b
roch
ure)
as
par
t of
the
ir ad
mis
sion
mat
eria
ls
Ele
ctro
nic
vers
ion
of p
atie
nt b
roch
ure
wou
ld a
lso
be
po
sted
on
the
Intr
anet
fo
r fr
ont-
line
staf
f to
prin
t/re
fer
to,
to h
elp
with
the
ir ed
ucat
ion
At
leas
t th
ree
units
to
incl
ude
hand
hy
gien
e ed
ucat
ion
m
ater
ials
up
on
p
atie
nt a
dm
issi
on
St .
Mic
hael
’s
Ho
spita
l (ac
ute
teac
hing
)
sk
ills
d
evel
op
men
t an
d
ver
ifica
tio
n
sta
ff t
rain
ing
Focu
sed
and
reg
ular
sta
ff r
ound
ing,
in
tern
al c
oach
ing,
ed
ucat
ion
and
ac
coun
tab
ility
sys
tem
s to
mon
itor
imp
rove
men
t ef
fort
s
Com
put
er m
onito
rs a
re li
nked
to
d
isp
lay
com
plia
nce
mon
thly
, o
rgan
izat
iona
l and
ind
ivid
ual u
nit
aud
it co
mp
lianc
e ra
te . U
nit-
spec
ific
resu
lts w
ill b
e p
ost
ed o
n al
l uni
ts’
per
form
ance
boa
rds
No
ne li
sted
Ste
vens
on
M
emo
rial
Ho
spita
l (sm
all
com
mun
ity)
Ele
ctro
nic
lear
ning
and
face
-to
-fac
e tr
aini
ng s
essi
ons
dem
onst
ratin
g ha
nd h
ygie
ne c
ore
com
pet
enci
es
requ
ired
for n
ursi
ng r
ecer
tifica
tion
ever
y tw
o ye
ars
Com
ple
tion
rate
of t
he e
-lea
rnin
g m
od
ule
and
of i
ndiv
idua
l pro
gra
m-
bas
ed t
rain
ing
All
nurs
ing
staf
f re
cert
ified
eve
ry
two
year
s
Sun
nyb
rook
H
ealth
Sci
ence
s C
entr
e (a
cute
te
achi
ng)
veri
fy h
and
-w
ashi
ng s
kills
Po
stin
g of
a h
and
hyg
iene
qui
z on
th
e In
tran
et fo
r he
alth
care
pro
vid
ers
(phy
sici
ans,
nur
sing
, hea
lth d
isci
-p
lines
, clin
ical
ass
ista
nts,
etc
.) to
co
mp
lete
The
qui
z w
ill p
rom
pt
resp
ond
ents
to
ent
er t
heir
dis
cip
line
(com
pet
ition
b
etw
een
the
dis
cip
lines
) . S
pec
ial
reco
gniti
on/p
rize
for
the
dis
cip
line
w
ith t
he m
ost
res
pon
den
ts
500
resp
ond
ents
St .
Mic
hael
’s
Ho
spita
l (ac
ute
teac
hing
)
taB
le
16:
ch
an
ge
ide
as
to
imp
ro
ve
ha
nd
hy
gie
ne
(CO
NTI
NU
ED
)
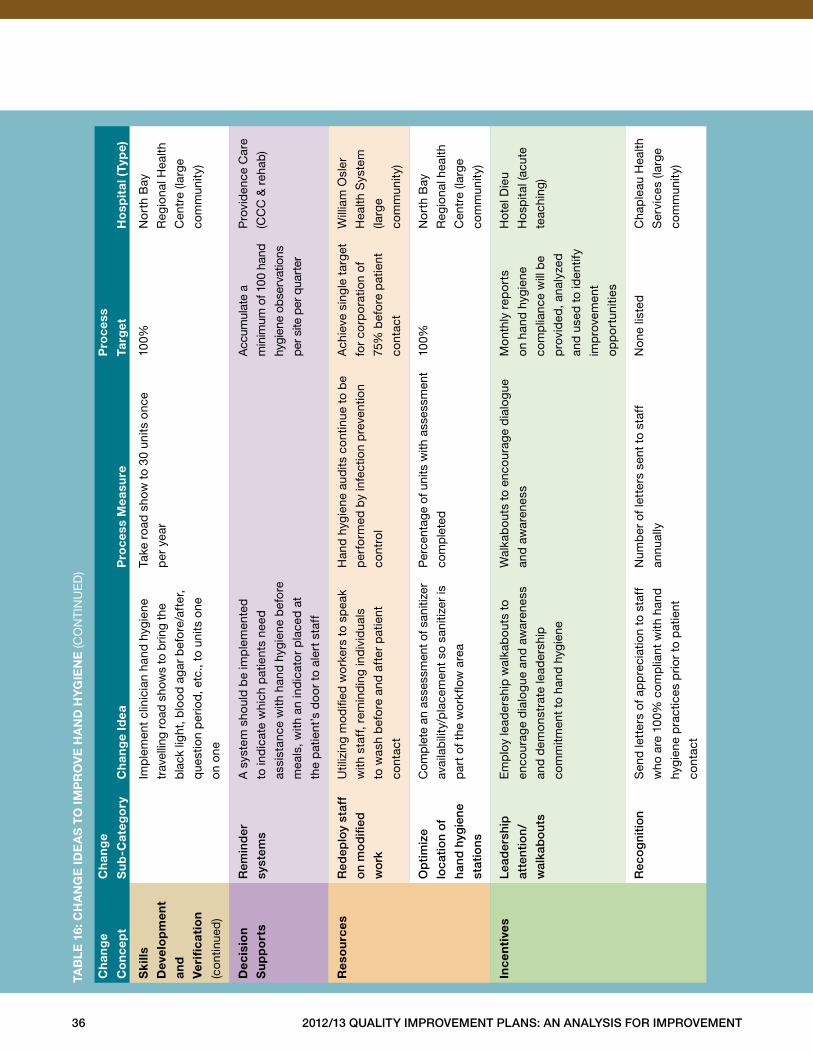
36 2012/13 Quality improvement plans: an analysis for improvement
ch
ang
e
co
nce
pt
ch
ang
e
su
b-c
ateg
ory
ch
ang
e id
ea
pro
cess
mea
sure
pro
cess
targ
et
ho
spit
al (
typ
e)
sk
ills
dev
elo
pm
ent
and
ver
ifica
tio
n
(con
tinue
d)
Imp
lem
ent
clin
icia
n ha
nd h
ygie
ne
trav
ellin
g ro
ad s
how
s to
brin
g th
e
bla
ck li
ght,
blo
od
aga
r b
efo
re/a
fter
,
que
stio
n p
erio
d, e
tc .,
to u
nits
one
on o
ne
Take
roa
d s
how
to
30 u
nits
onc
e
per
yea
r
100%
No
rth
Bay
Reg
iona
l Hea
lth
Cen
tre
(larg
e
com
mun
ity)
dec
isio
n
su
pp
ort
s
rem
ind
er
syst
ems
A s
yste
m s
houl
d b
e im
ple
men
ted
to in
dic
ate
whi
ch p
atie
nts
need
assi
stan
ce w
ith h
and
hyg
iene
bef
ore
mea
ls, w
ith a
n in
dic
ato
r p
lace
d a
t
the
pat
ient
’s d
oo
r to
ale
rt s
taff
Acc
umul
ate
a
min
imum
of 1
00 h
and
hygi
ene
obse
rvat
ions
per
site
per
qua
rter
Pro
vid
ence
Car
e
(CC
C &
reh
ab)
res
ou
rces
red
eplo
y st
aff
on
mo
difi
ed
wo
rk
Util
izin
g m
od
ified
wo
rker
s to
sp
eak
with
sta
ff, r
emin
din
g in
div
idua
ls
to w
ash
bef
ore
and
aft
er p
atie
nt
cont
act
Han
d h
ygie
ne a
udits
con
tinue
to
be
per
form
ed b
y in
fect
ion
pre
vent
ion
cont
rol
Ach
ieve
sin
gle
targ
et
for
corp
ora
tion
of
75%
bef
ore
pat
ient
cont
act
Will
iam
Osl
er
Hea
lth S
yste
m
(larg
e
com
mun
ity)
op
tim
ize
loca
tio
n o
f
hand
hyg
iene
stat
ions
Com
ple
te a
n as
sess
men
t of s
aniti
zer
avai
lab
ility
/pla
cem
ent
so s
aniti
zer
is
par
t of
the
wo
rkflo
w a
rea
Per
cent
age
of u
nits
with
ass
essm
ent
com
ple
ted
100%
No
rth
Bay
Reg
iona
l hea
lth
Cen
tre
(larg
e
com
mun
ity)
ince
nti
ves
lead
ersh
ip
atte
ntio
n/
wal
kab
ou
ts
Em
plo
y le
ader
ship
wal
kab
outs
to
enco
urag
e d
ialo
gue
and
aw
aren
ess
and
dem
onst
rate
lead
ersh
ip
com
mitm
ent
to h
and
hyg
iene
Wal
kab
outs
to
enco
urag
e d
ialo
gue
and
aw
aren
ess
Mo
nthl
y re
po
rts
on h
and
hyg
iene
com
plia
nce
will
be
pro
vid
ed, a
naly
zed
and
use
d t
o id
entif
y
imp
rove
men
t
opp
ort
uniti
es
Hot
el D
ieu
Ho
spita
l (ac
ute
teac
hing
)
rec
og
niti
on
Sen
d le
tter
s of
ap
pre
ciat
ion
to s
taff
who
are
100
% c
omp
liant
with
han
d
hygi
ene
pra
ctic
es p
rior
to p
atie
nt
cont
act
Num
ber
of l
ette
rs s
ent
to s
taff
annu
ally
Non
e lis
ted
Cha
ple
au H
ealth
Ser
vice
s (la
rge
com
mun
ity)
taB
le
16:
ch
an
ge
ide
as
to
imp
ro
ve
ha
nd
hy
gie
ne
(CO
NTI
NU
ED
)
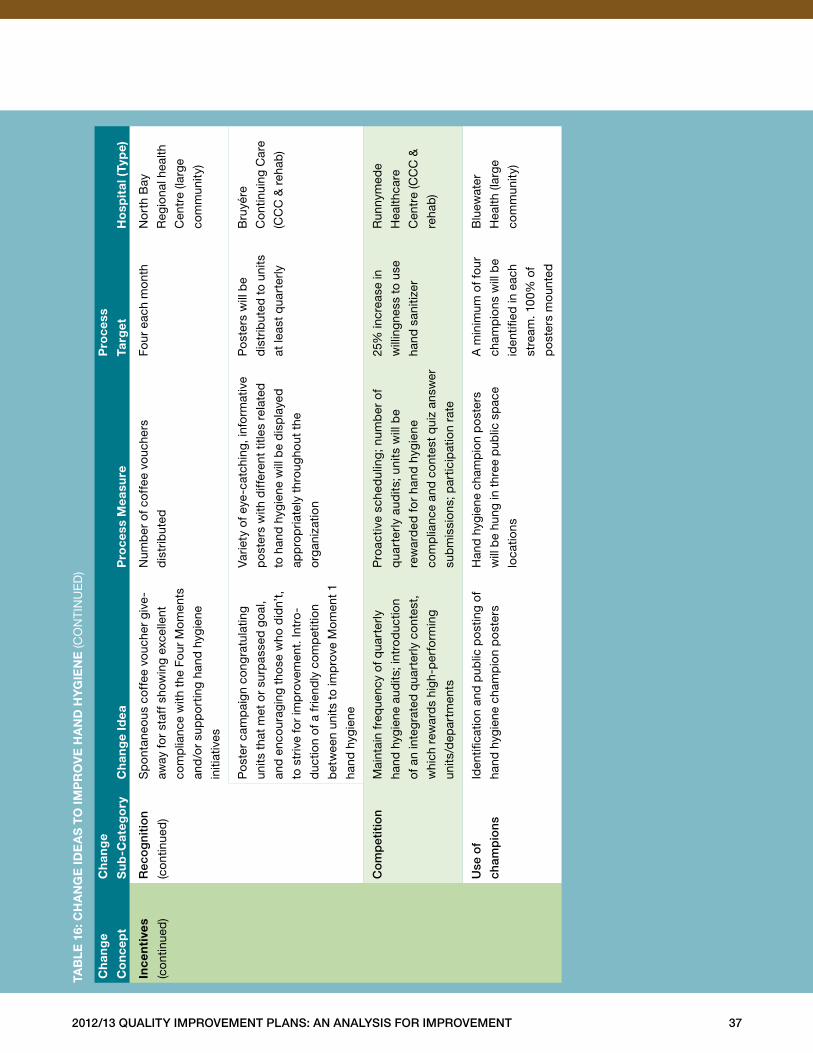
2012/13 Quality improvement plans: an analysis for improvement 37
ch
ang
e
co
nce
pt
ch
ang
e
su
b-c
ateg
ory
ch
ang
e id
ea
pro
cess
mea
sure
pro
cess
targ
et
ho
spit
al (
typ
e)
ince
nti
ves
(con
tinue
d)
rec
og
niti
on
(con
tinue
d)
Sp
onta
neou
s co
ffee
vou
cher
giv
e-
away
for
staf
f sho
win
g ex
celle
nt
com
plia
nce
with
the
Fou
r M
omen
ts
and
/or
sup
po
rtin
g ha
nd h
ygie
ne
initi
ativ
es
Num
ber
of c
offe
e vo
uche
rs
dis
trib
uted
Four
eac
h m
ont
hN
ort
h B
ay
Reg
iona
l hea
lth
Cen
tre
(larg
e
com
mun
ity)
Po
ster
cam
pai
gn c
ong
ratu
latin
g
units
tha
t m
et o
r su
rpas
sed
goa
l,
and
enc
oura
ging
tho
se w
ho d
idn’
t,
to s
triv
e fo
r im
pro
vem
ent .
Intr
o-
duc
tion
of a
frie
ndly
com
pet
ition
bet
wee
n un
its t
o im
pro
ve M
omen
t 1
hand
hyg
iene
Varie
ty o
f eye
-cat
chin
g, in
form
ativ
e
po
ster
s w
ith d
iffer
ent
title
s re
late
d
to h
and
hyg
iene
will
be
dis
pla
yed
app
rop
riate
ly t
hrou
ghou
t th
e
org
aniz
atio
n
Po
ster
s w
ill b
e
dis
trib
uted
to
units
at le
ast
qua
rter
ly
Bru
yére
Con
tinui
ng C
are
(CC
C &
reh
ab)
Co
mp
etit
ion
Mai
ntai
n fr
eque
ncy
of q
uart
erly
hand
hyg
iene
aud
its; i
ntro
duc
tion
of a
n in
teg
rate
d q
uart
erly
con
test
,
whi
ch r
ewar
ds
high
-per
form
ing
units
/dep
artm
ents
Pro
activ
e sc
hed
ulin
g; n
umb
er o
f
qua
rter
ly a
udits
; uni
ts w
ill b
e
rew
ard
ed f
or
hand
hyg
iene
com
plia
nce
and
con
test
qui
z an
swer
sub
mis
sion
s; p
artic
ipat
ion
rate
25%
incr
ease
in
will
ingn
ess
to u
se
hand
san
itize
r
Run
nym
ede
Hea
lthca
re
Cen
tre
(CC
C &
reha
b)
use
of
cham
pio
ns
Iden
tifica
tion
and
pub
lic p
ost
ing
of
hand
hyg
iene
cha
mp
ion
po
ster
s
Han
d h
ygie
ne c
ham
pio
n p
ost
ers
will
be
hung
in t
hree
pub
lic s
pac
e
loca
tions
A m
inim
um o
f fou
r
cham
pio
ns w
ill b
e
iden
tified
in e
ach
stre
am . 1
00%
of
po
ster
s m
ount
ed
Blu
ewat
er
Hea
lth (l
arg
e
com
mun
ity)
taB
le
16:
ch
an
ge
ide
as
to
imp
ro
ve
ha
nd
hy
gie
ne
(CO
NTI
NU
ED
)
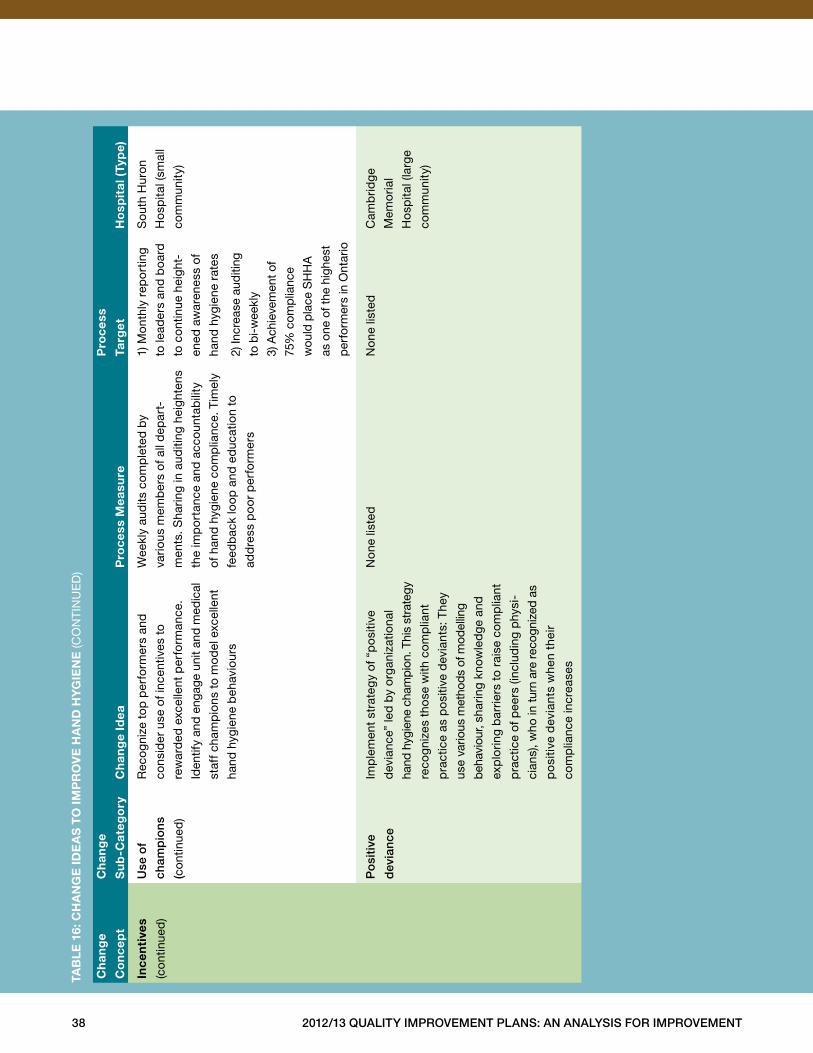
38 2012/13 Quality improvement plans: an analysis for improvement
ch
ang
e
co
nce
pt
ch
ang
e
su
b-c
ateg
ory
ch
ang
e id
ea
pro
cess
mea
sure
pro
cess
targ
et
ho
spit
al (
typ
e)
ince
nti
ves
(con
tinue
d)
use
of
cham
pio
ns
(con
tinue
d)
Rec
ogn
ize
top
per
form
ers
and
cons
ider
use
of i
ncen
tives
to
rew
ard
ed e
xcel
lent
per
form
ance
.
Iden
tify
and
enga
ge u
nit a
nd m
edic
al
staf
f cha
mp
ions
to
mo
del
exc
elle
nt
hand
hyg
iene
beh
avio
urs
Wee
kly
aud
its c
omp
lete
d b
y
vario
us m
emb
ers
of a
ll d
epar
t-
men
ts . S
harin
g in
aud
iting
hei
ghte
ns
the
imp
ort
ance
and
acc
ount
abili
ty
of h
and
hyg
iene
com
plia
nce .
Tim
ely
feed
bac
k lo
op a
nd e
duc
atio
n to
add
ress
po
or
per
form
ers
1) M
ont
hly
rep
ort
ing
to le
ader
s an
d b
oard
to c
ontin
ue h
eigh
t-
ened
aw
aren
ess
of
hand
hyg
iene
rat
es
2) In
crea
se a
uditi
ng
to b
i-w
eekl
y
3) A
chie
vem
ent o
f
75%
com
plia
nce
wou
ld p
lace
SH
HA
as o
ne o
f the
hig
hest
per
form
ers
in O
ntar
io
Sou
th H
uro
n
Ho
spita
l (sm
all
com
mun
ity)
po
siti
ve
dev
ianc
e
Imp
lem
ent
stra
teg
y of
“p
osi
tive
dev
ianc
e” le
d b
y o
rgan
izat
iona
l
hand
hyg
iene
cha
mpi
on . T
his
stra
tegy
reco
gniz
es t
hose
with
com
plia
nt
pra
ctic
e as
po
sitiv
e d
evia
nts:
The
y
use
vario
us m
etho
ds o
f mod
ellin
g
beh
avio
ur, s
harin
g kn
owle
dge
and
exp
lorin
g b
arrie
rs t
o ra
ise
com
plia
nt
pra
ctic
e of
pee
rs (i
nclu
din
g p
hysi
-
cian
s), w
ho in
turn
are
rec
ogni
zed
as
po
sitiv
e d
evia
nts
whe
n th
eir
com
plia
nce
incr
ease
s
Non
e lis
ted
Non
e lis
ted
Cam
brid
ge
Mem
oria
l
Ho
spita
l (la
rge
com
mun
ity)
taB
le
16:
ch
an
ge
ide
as
to
imp
ro
ve
ha
nd
hy
gie
ne
(CO
NTI
NU
ED
)
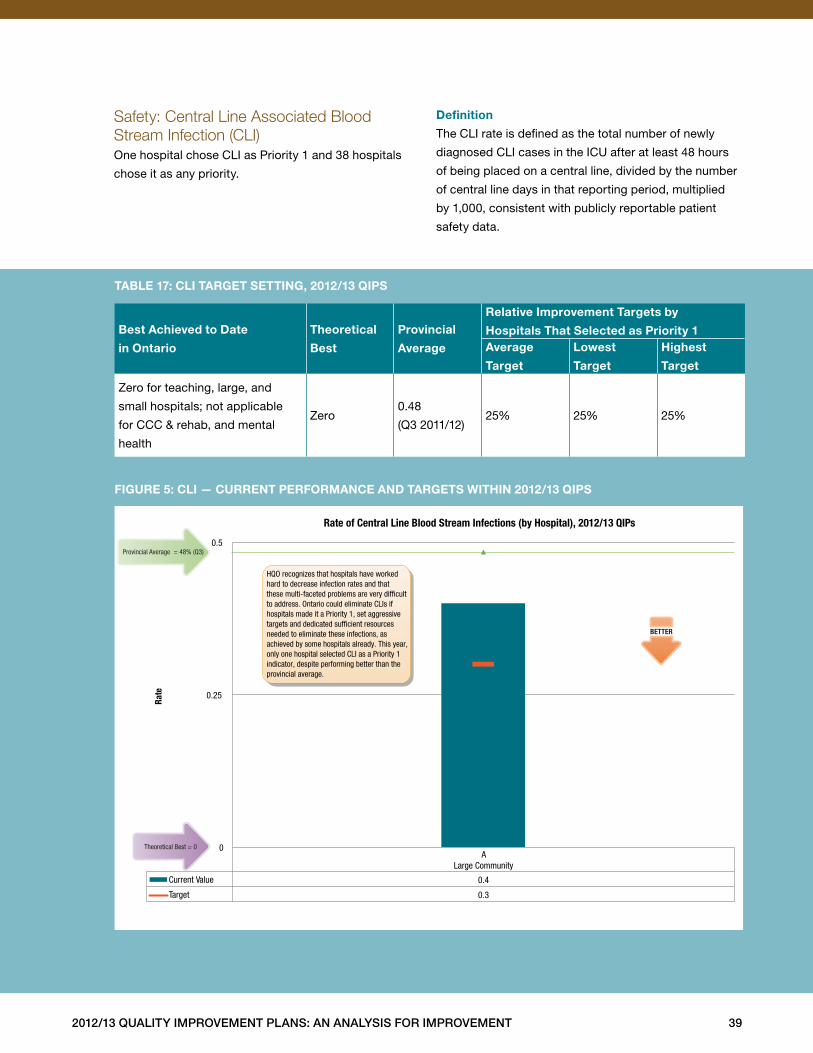
2012/13 Quality improvement plans: an analysis for improvement 39
Safety: Central Line Associated Blood Stream Infection (CLI)One hospital chose CLI as Priority 1 and 38 hospitals
chose it as any priority .
definition
The CLI rate is defined as the total number of newly
diagnosed CLI cases in the ICU after at least 48 hours
of being placed on a central line, divided by the number
of central line days in that reporting period, multiplied
by 1,000, consistent with publicly reportable patient
safety data .
Best achieved to date
in ontario
theoretical
Best
provincial
average
relative improvement targets by
hospitals that selected as priority 1average
target
lowest
target
highest
target
Zero for teaching, large, and
small hospitals; not applicable
for CCC & rehab, and mental
health
Zero0 .48
(Q3 2011/12)25% 25% 25%
taBle 17: cli target setting, 2012/13 Qips
figure 5: cli — current performance and targets Within 2012/13 Qips
A Large Community
Current Value 0.4
Target 0.3
0
0.25
0.5
Rate
Rate of Central Line Blood Stream Infections (by Hospital), 2012/13 QIPs
BETTER
Provincial Average = 48% (Q3)
Theoretical Best = 0
HQO recognizes that hospitals have worked hard to decrease infection rates and that these multi-faceted problems are very dif�cult to address. Ontario could eliminate CLIs if hospitals made it a Priority 1, set aggressive targets and dedicated suf�cient resources needed to eliminate these infections, as achieved by some hospitals already. This year, only one hospital selected CLI as a Priority 1 indicator, despite performing better than the provincial average.
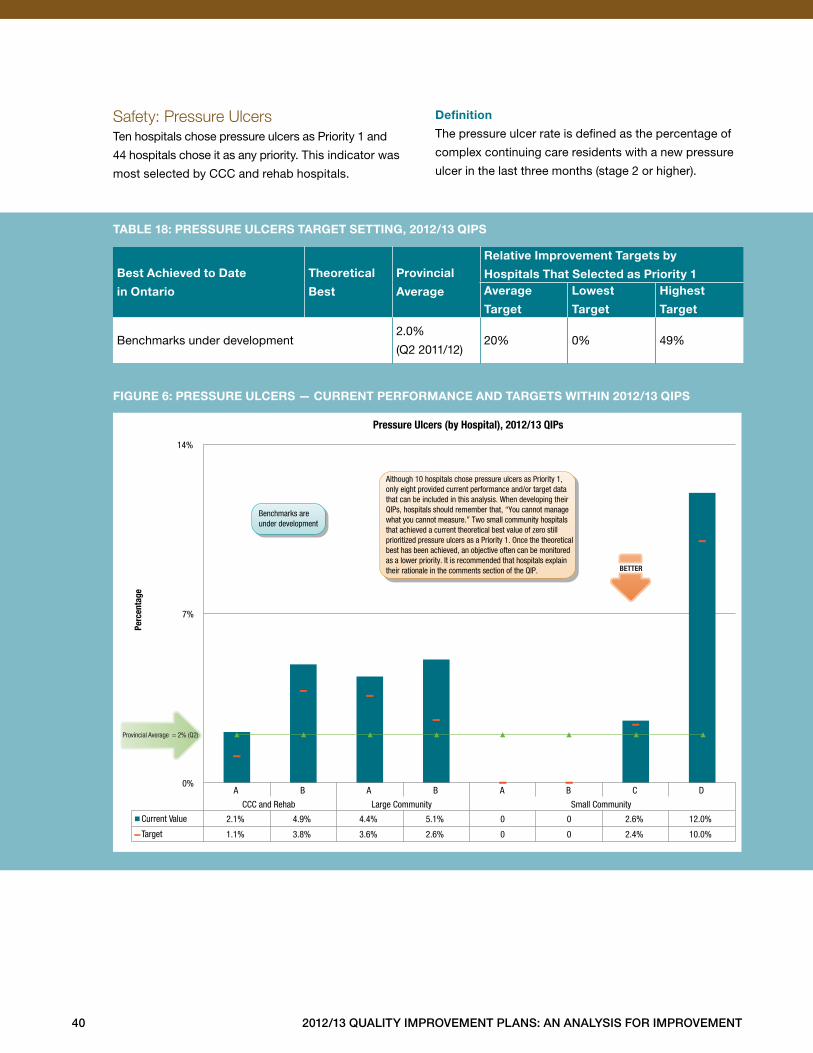
40 2012/13 Quality improvement plans: an analysis for improvement
Safety: Pressure UlcersTen hospitals chose pressure ulcers as Priority 1 and
44 hospitals chose it as any priority . This indicator was
most selected by CCC and rehab hospitals .
definition
The pressure ulcer rate is defined as the percentage of
complex continuing care residents with a new pressure
ulcer in the last three months (stage 2 or higher) .
Best achieved to date
in ontario
theoretical
Best
provincial
average
relative improvement targets by
hospitals that selected as priority 1average
target
lowest
target
highest
target
Benchmarks under development2 .0%
(Q2 2011/12)20% 0% 49%
taBle 18: pressure ulcers target setting, 2012/13 Qips
figure 6: pressure ulcers — current performance and targets Within 2012/13 Qips
A B A B A B C D
CCC and Rehab Large Community Small Community
Current Value 2.1% 4.9% 4.4% 5.1% 0 0 2.6% 12.0%
Target 1.1% 3.8% 3.6% 2.6% 0 0 2.4% 10.0%
0%
7%
14%
Perc
enta
ge
Pressure Ulcers (by Hospital), 2012/13 QIPs
Provincial Average = 2% (Q2)
Although 10 hospitals chose pressure ulcers as Priority 1, only eight provided current performance and/or target data that can be included in this analysis. When developing their QIPs, hospitals should remember that, “You cannot manage what you cannot measure.” Two small community hospitals that achieved a current theoretical best value of zero still prioritized pressure ulcers as a Priority 1. Once the theoretical best has been achieved, an objective often can be monitored as a lower priority. It is recommended that hospitals explain their rationale in the comments section of the QIP. BETTER
Benchmarks are under development
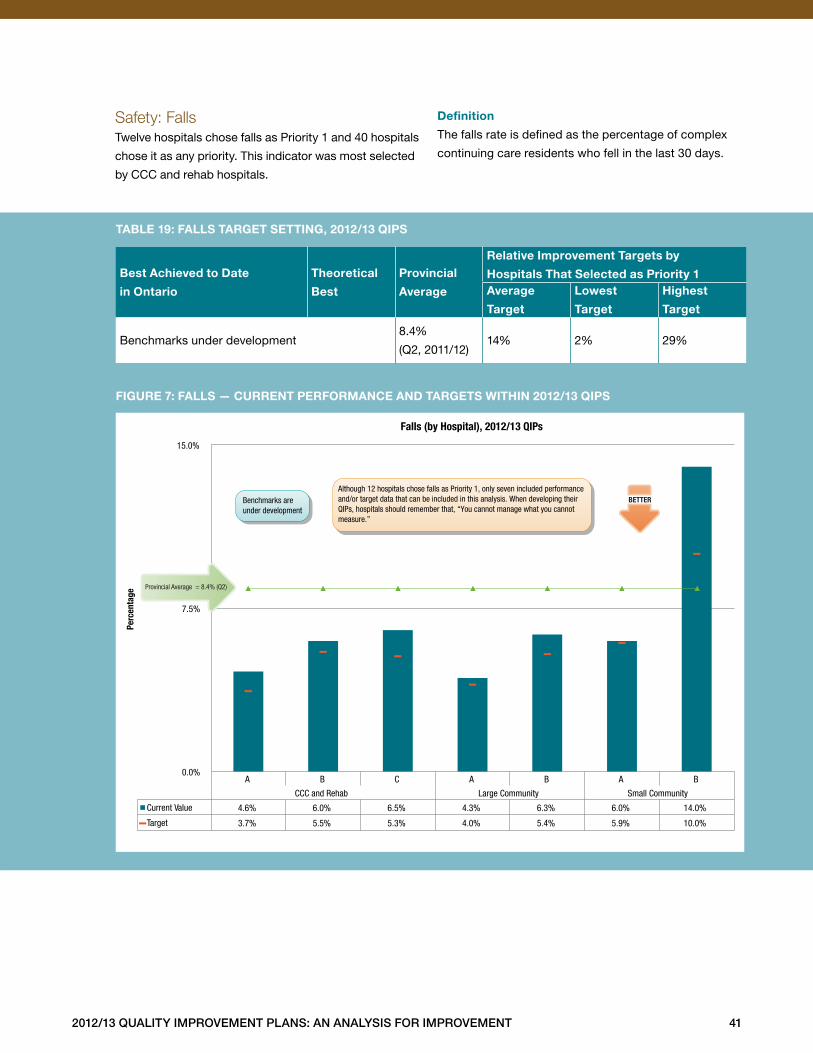
2012/13 Quality improvement plans: an analysis for improvement 41
Safety: FallsTwelve hospitals chose falls as Priority 1 and 40 hospitals
chose it as any priority . This indicator was most selected
by CCC and rehab hospitals .
definition
The falls rate is defined as the percentage of complex
continuing care residents who fell in the last 30 days .
Best achieved to date
in ontario
theoretical
Best
provincial
average
relative improvement targets by
hospitals that selected as priority 1average
target
lowest
target
highest
target
Benchmarks under development8 .4%
(Q2, 2011/12)14% 2% 29%
taBle 19: falls target setting, 2012/13 Qips
figure 7: falls — current performance and targets Within 2012/13 Qips
A B C A B A B
CCC and Rehab Large Community Small Community
Current Value 4.6% 6.0% 6.5% 4.3% 6.3% 6.0% 14.0%
Target 3.7% 5.5% 5.3% 4.0% 5.4% 5.9% 10.0%
0.0%
7.5%
15.0%
Perc
enta
ge
Falls (by Hospital), 2012/13 QIPs
BETTERAlthough 12 hospitals chose falls as Priority 1, only seven included performance and/or target data that can be included in this analysis. When developing their QIPs, hospitals should remember that, “You cannot manage what you cannot measure.”
Benchmarks are under development
Provincial Average = 8.4% (Q2)
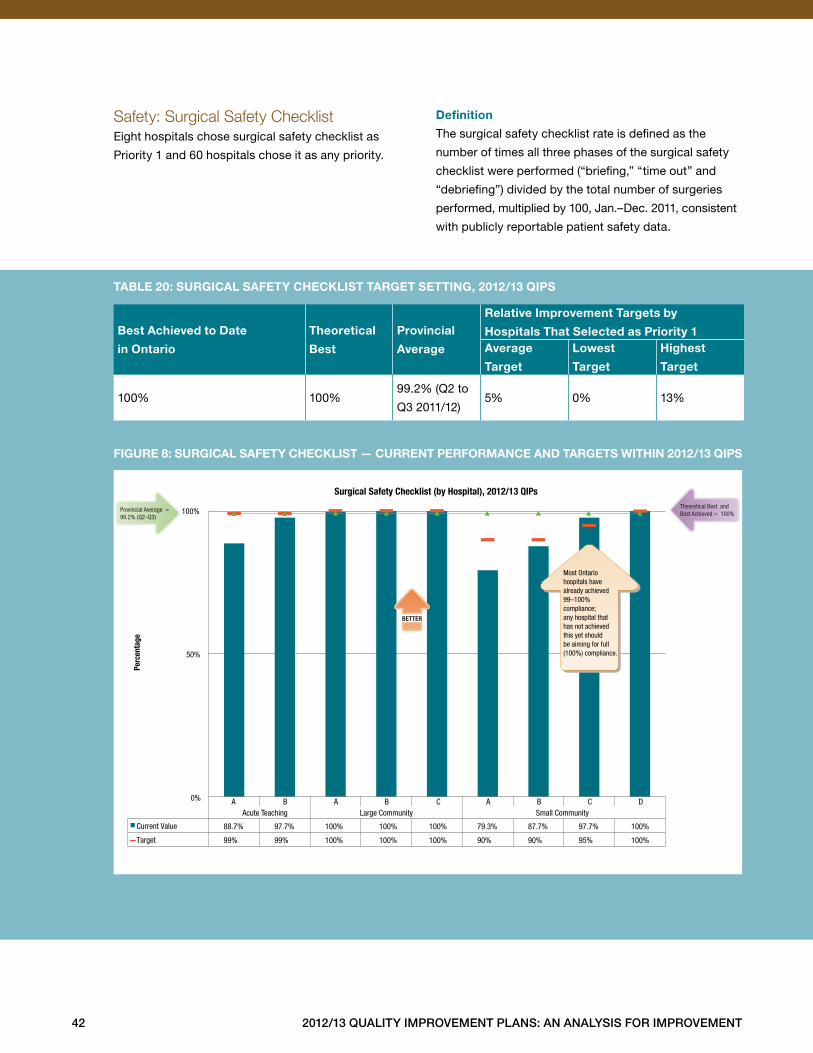
42 2012/13 Quality improvement plans: an analysis for improvement
Safety: Surgical Safety ChecklistEight hospitals chose surgical safety checklist as
Priority 1 and 60 hospitals chose it as any priority .
definition
The surgical safety checklist rate is defined as the
number of times all three phases of the surgical safety
checklist were performed (“briefing,” “time out” and
“debriefing”) divided by the total number of surgeries
performed, multiplied by 100, Jan .–Dec . 2011, consistent
with publicly reportable patient safety data .
Best achieved to date
in ontario
theoretical
Best
provincial
average
relative improvement targets by
hospitals that selected as priority 1average
target
lowest
target
highest
target
100% 100%99 .2% (Q2 to
Q3 2011/12)5% 0% 13%
taBle 20: surgical safety checKlist target setting, 2012/13 Qips
figure 8: surgical safety checKlist — current performance and targets Within 2012/13 Qips
Current Value 88.7% 97.7% 100% 100% 100% 79.3% 87.7% 97.7% 100%
Target 99% 99% 100% 100% 100% 90% 90% 95% 100%
A B A B C A B C DAcute Teaching Large Community Small Community
0%
50%
100% Provincial Average = 99.2% (Q2–Q3)
Theoretical Best and Best Achieved = 100%
BETTER
Most Ontario hospitals have already achieved 99–100% compliance; any hospital that has not achieved this yet should be aiming for full (100%) compliance.
Surgical Safety Checklist (by Hospital), 2012/13 QIPs
Perc
enta
ge
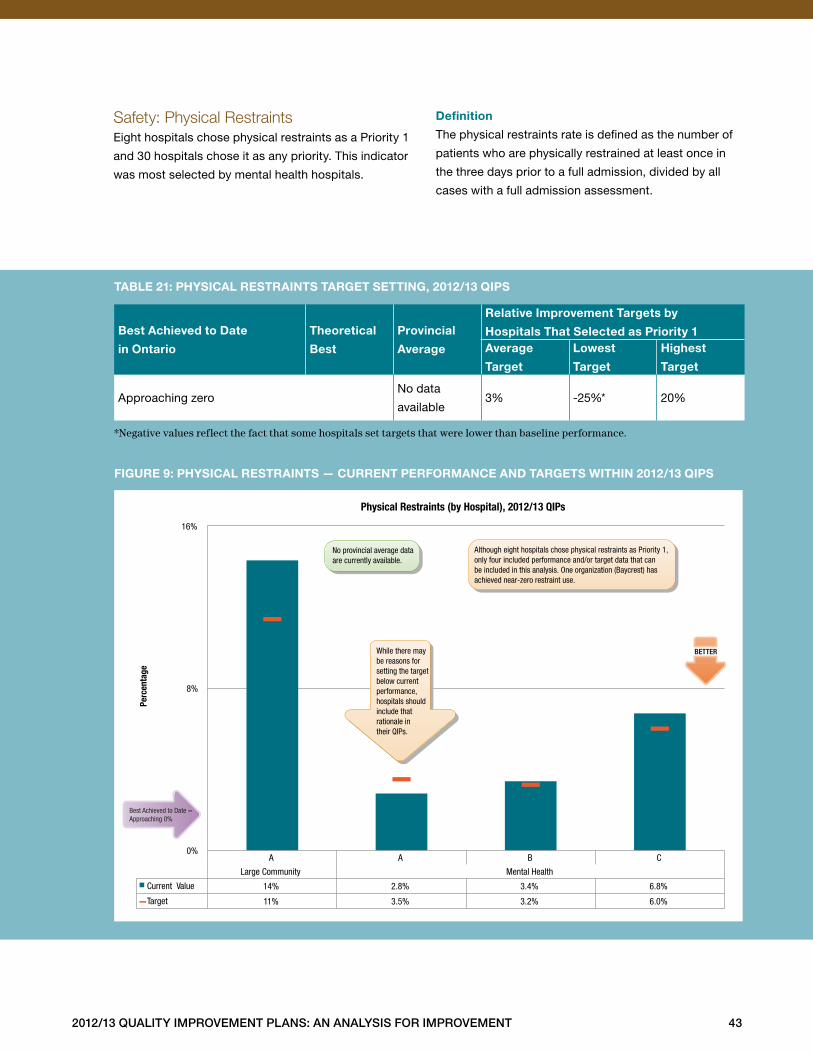
2012/13 Quality improvement plans: an analysis for improvement 43
Safety: Physical RestraintsEight hospitals chose physical restraints as a Priority 1
and 30 hospitals chose it as any priority . This indicator
was most selected by mental health hospitals .
definition
The physical restraints rate is defined as the number of
patients who are physically restrained at least once in
the three days prior to a full admission, divided by all
cases with a full admission assessment .
Best achieved to date
in ontario
theoretical
Best
provincial
average
relative improvement targets by
hospitals that selected as priority 1average
target
lowest
target
highest
target
Approaching zeroNo data
available3% -25%* 20%
*Negative values reflect the fact that some hospitals set targets that were lower than baseline performance.
taBle 21: physical restraints target setting, 2012/13 Qips
figure 9: physical restraints — current performance and targets Within 2012/13 Qips
A A B C
Large Community Mental Health
Current Value 14% 2.8% 3.4% 6.8%
Target 11% 3.5% 3.2% 6.0%
0%
8%
16%
Perc
enta
ge
Physical Restraints (by Hospital), 2012/13 QIPs
BETTER
No provincial average data are currently available.
Best Achieved to Date = Approaching 0%
While there may be reasons for setting the target below current performance, hospitals should include that rationale in their QIPs.
Although eight hospitals chose physical restraints as Priority 1, only four included performance and/or target data that can be included in this analysis. One organization (Baycrest) has achieved near-zero restraint use.
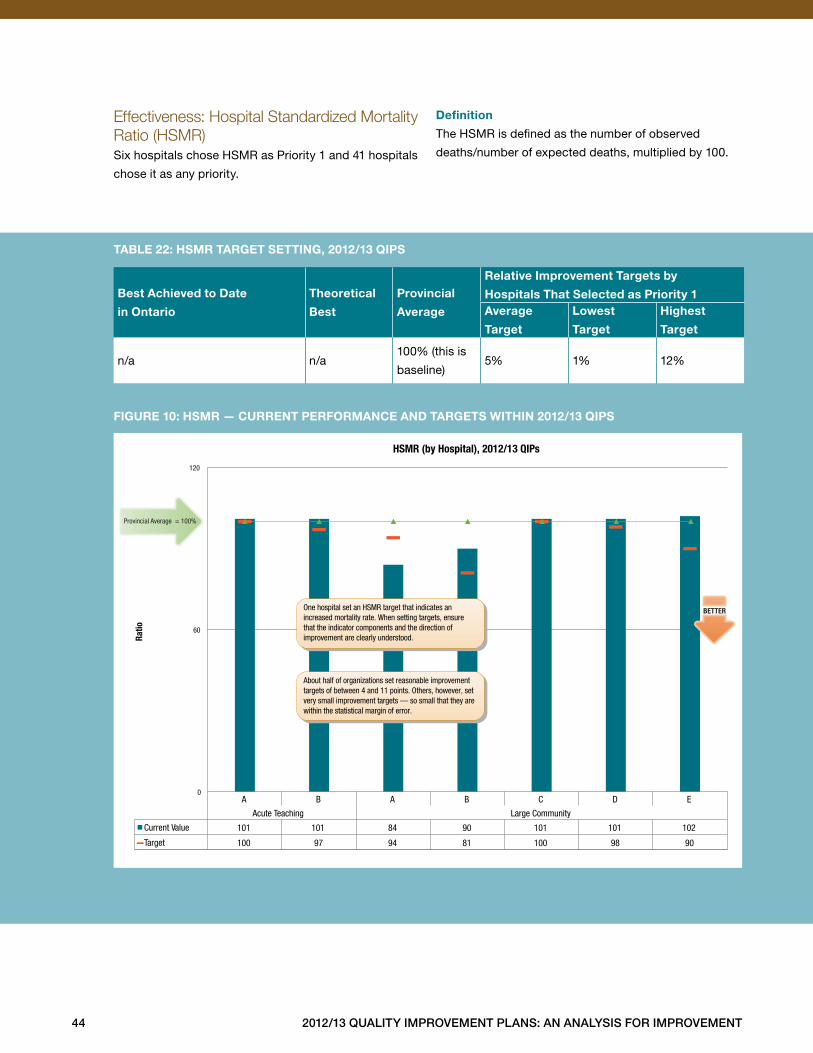
44 2012/13 Quality improvement plans: an analysis for improvement
Effectiveness: Hospital Standardized Mortality Ratio (HSMR)Six hospitals chose HSMR as Priority 1 and 41 hospitals
chose it as any priority .
definition
The HSMR is defined as the number of observed
deaths/number of expected deaths, multiplied by 100 .
Best achieved to date
in ontario
theoretical
Best
provincial
average
relative improvement targets by
hospitals that selected as priority 1average
target
lowest
target
highest
target
n/a n/a100% (this is
baseline)5% 1% 12%
taBle 22: hsmr target setting, 2012/13 Qips
figure 10: hsmr — current performance and targets Within 2012/13 Qips
A B A B C D E
Acute Teaching Large Community
Current Value 101 101 84 90 101 101 102
Target 100 97 94 81 100 98 90
0
60
120
Ratio
HSMR (by Hospital), 2012/13 QIPs
Provincial Average = 100%
BETTER
About half of organizations set reasonable improvement targets of between 4 and 11 points. Others, however, set very small improvement targets — so small that they are within the statistical margin of error.
One hospital set an HSMR target that indicates an increased mortality rate. When setting targets, ensure that the indicator components and the direction of improvement are clearly understood.
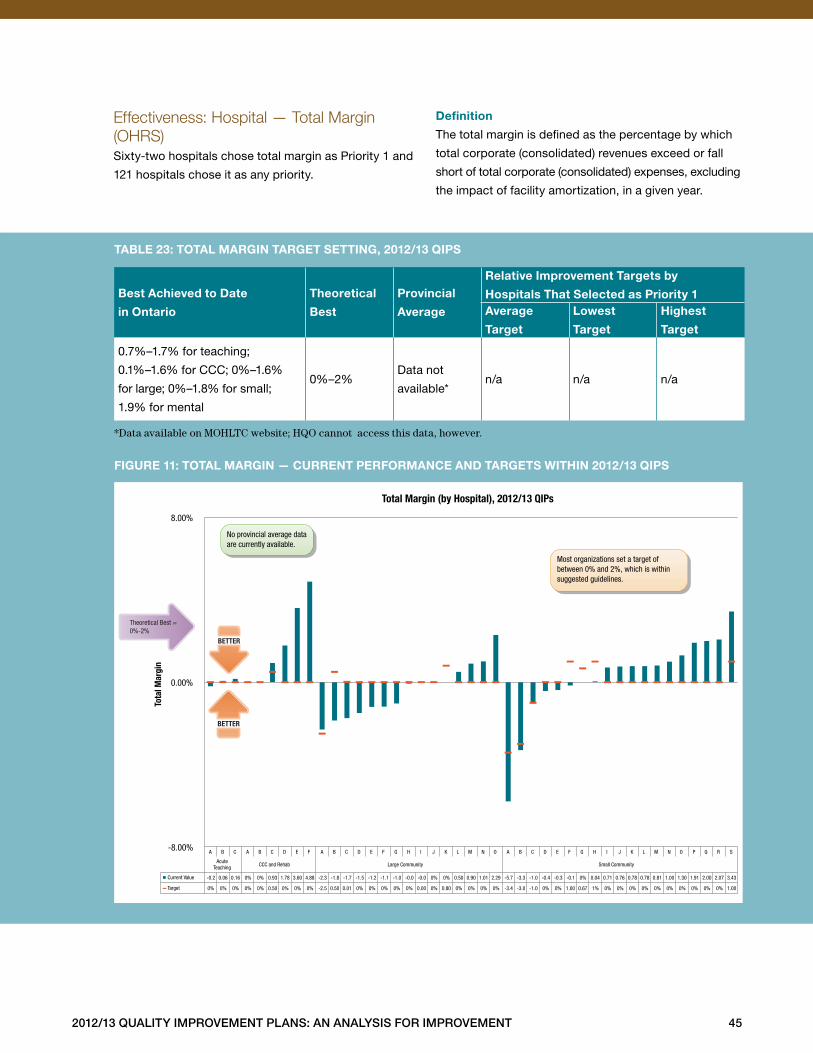
2012/13 Quality improvement plans: an analysis for improvement 45
Effectiveness: Hospital — Total Margin (OHRS)Sixty-two hospitals chose total margin as Priority 1 and
121 hospitals chose it as any priority .
definition
The total margin is defined as the percentage by which
total corporate (consolidated) revenues exceed or fall
short of total corporate (consolidated) expenses, excluding
the impact of facility amortization, in a given year .
Best achieved to date
in ontario
theoretical
Best
provincial
average
relative improvement targets by
hospitals that selected as priority 1average
target
lowest
target
highest
target
0 .7%–1 .7% for teaching;
0 .1%–1 .6% for CCC; 0%–1 .6%
for large; 0%–1 .8% for small;
1 .9% for mental
0%–2%Data not
available*n/a n/a n/a
*Data available on MOHLTC website; HQO cannot access this data, however.
taBle 23: total margin target setting, 2012/13 Qips
figure 11: total margin — current performance and targets Within 2012/13 Qips
A B C A B C D E F A B C D E F G H I J K L M N O A B C D E F G H I J K L M N O P Q R S
Acute Teaching CCC and Rehab Large Community Small Community
Current Value -0.2 0.06 0.16 0% 0% 0.93 1.78 3.60 4.88 -2.3 -1.8 -1.7 -1.5 -1.2 -1.1 -1.0 -0.0 -0.0 0% 0% 0.50 0.90 1.01 2.29 -5.7 -3.3 -1.0 -0.4 -0.3 -0.1 0% 0.04 0.71 0.76 0.78 0.78 0.81 1.00 1.30 1.91 2.00 2.07 3.43
Target 0% 0% 0% 0% 0% 0.50 0% 0% 0% -2.5 0.50 0.01 0% 0% 0% 0% 0% 0.00 0% 0.80 0% 0% 0% 0% -3.4 -3.0 -1.0 0% 0% 1.00 0.67 1% 0% 0% 0% 0% 0% 0% 0% 0% 0% 0% 1.00
-8.00%
0.00%
8.00%
Tota
l Mar
gin
Total Margin (by Hospital), 2012/13 QIPs
No provincial average data are currently available.
Most organizations set a target of between 0% and 2%, which is within suggested guidelines.
Theoretical Best = 0%-2%
BETTER
BETTER
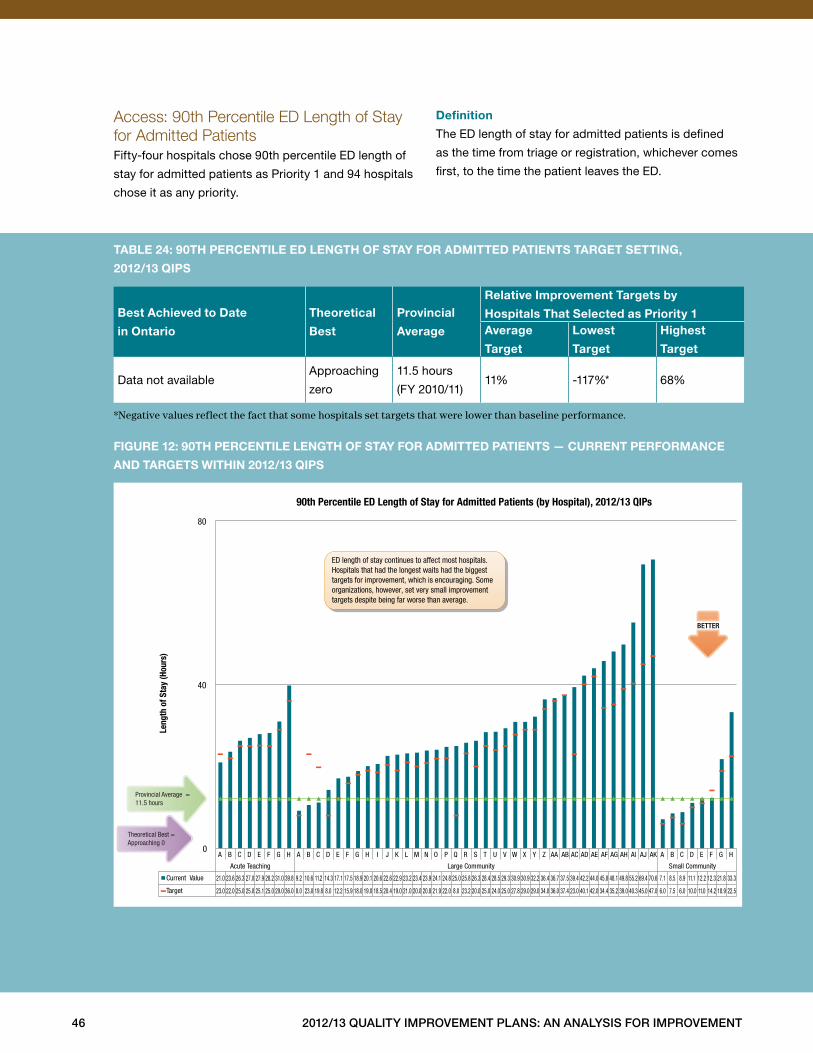
46 2012/13 Quality improvement plans: an analysis for improvement
Access: 90th Percentile ED Length of Stay for Admitted Patients Fifty-four hospitals chose 90th percentile ED length of
stay for admitted patients as Priority 1 and 94 hospitals
chose it as any priority .
definition
The ED length of stay for admitted patients is defined
as the time from triage or registration, whichever comes
first, to the time the patient leaves the ED .
Best achieved to date
in ontario
theoretical
Best
provincial
average
relative improvement targets by
hospitals that selected as priority 1average
target
lowest
target
highest
target
Data not availableApproaching
zero
11 .5 hours
(FY 2010/11)11% -117%* 68%
*Negative values reflect the fact that some hospitals set targets that were lower than baseline performance.
taBle 24: 90th percentile ed length of stay for admitted patients target setting,
2012/13 Qips
figure 12: 90th percentile length of stay for admitted patients — current performance
and targets Within 2012/13 Qips
A B C D E F G H A B C D E F G H I J K L M N O P Q R S T U V W X Y Z AA AB AC AD AE AF AG AH AI AJ AK A B C D E F G H
Acute Teaching Large Community Small Community
Current Value 21.0 23.6 26.3 27.0 27.9 28.2 31.0 39.8 9.2 10.6 11.2 14.3 17.1 17.5 18.9 20.1 20.6 22.6 22.9 23.2 23.4 23.9 24.1 24.8 25.0 25.8 26.3 28.4 28.5 29.3 30.9 30.9 32.2 36.4 36.7 37.5 39.4 42.2 44.0 45.8 48.1 49.8 55.2 69.4 70.6 7.1 8.5 8.9 11.1 12.2 12.3 21.8 33.3
Target 23.0 22.0 25.0 25.0 25.1 25.0 29.0 36.0 8.0 23.0 19.8 8.0 12.2 15.9 18.0 19.0 18.5 20.4 19.0 21.0 20.0 20.8 21.9 22.0 8.0 23.2 20.0 25.0 24.0 25.0 27.8 29.0 29.0 34.0 36.0 37.4 23.0 40.1 42.0 34.4 35.2 39.0 40.3 45.0 47.0 6.0 7.5 6.0 10.0 11.0 14.2 18.9 22.5
0
40
80
Leng
th o
f Sta
y (H
ours
)
90th Percentile ED Length of Stay for Admitted Patients (by Hospital), 2012/13 QIPs
BETTER
Provincial Average = 11.5 hours
Theoretical Best = Approaching 0
ED length of stay continues to affect most hospitals. Hospitals that had the longest waits had the biggest targets for improvement, which is encouraging. Some organizations, however, set very small improvement targets despite being far worse than average.
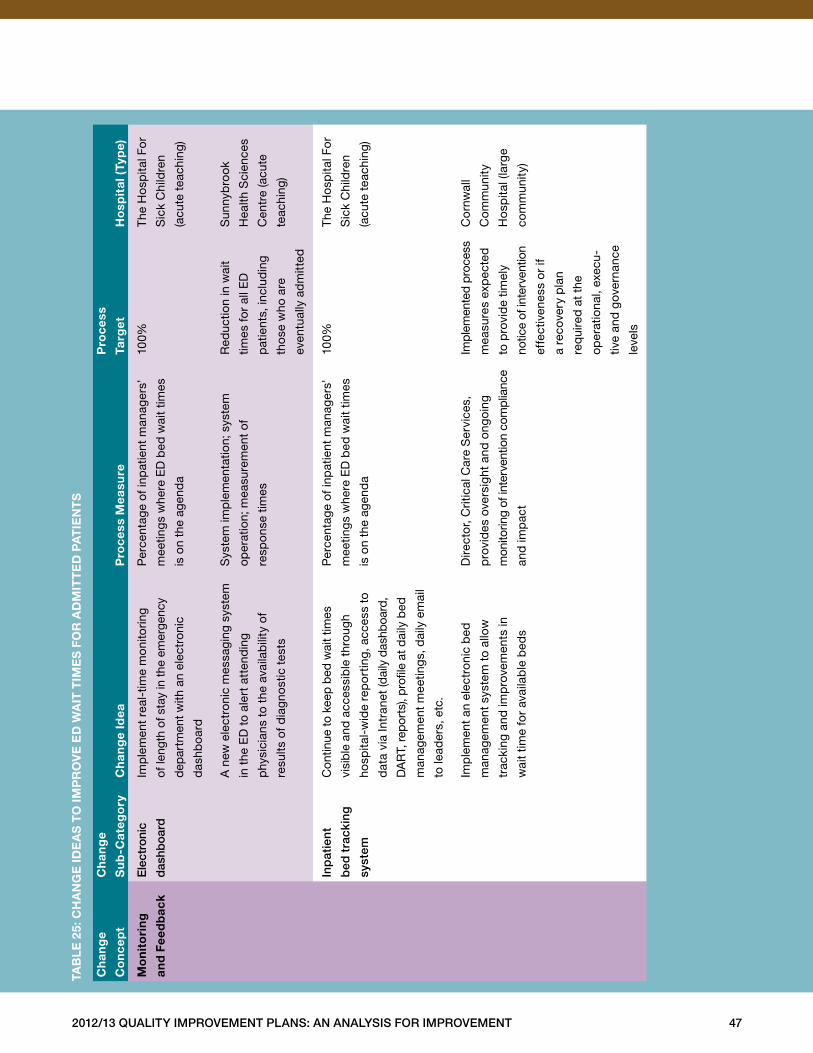
2012/13 Quality improvement plans: an analysis for improvement 47
ch
ang
e
co
nce
pt
ch
ang
e
su
b-c
ateg
ory
ch
ang
e id
ea
pro
cess
mea
sure
pro
cess
targ
et
ho
spit
al (
typ
e)
mo
nit
ori
ng
and
fee
db
ack
ele
ctro
nic
das
hboa
rd
Imp
lem
ent
real
-tim
e m
onito
ring
of le
ngth
of s
tay
in th
e em
erge
ncy
dep
artm
ent w
ith a
n el
ectr
onic
das
hboa
rd
Per
cent
age
of in
pat
ient
man
ager
s’
mee
ting
s w
here
ED
bed
wai
t tim
es
is o
n th
e ag
end
a
100%
The
Ho
spita
l Fo
r
Sic
k C
hild
ren
(acu
te t
each
ing)
A n
ew e
lect
roni
c m
essa
ging
sys
tem
in t
he E
D t
o al
ert
atte
ndin
g
phy
sici
ans
to t
he a
vaila
bili
ty o
f
resu
lts o
f dia
gno
stic
tes
ts
Sys
tem
imp
lem
enta
tion;
sys
tem
oper
atio
n; m
easu
rem
ent
of
resp
onse
tim
es
Red
uctio
n in
wai
t
times
for
all E
D
pat
ient
s, in
clud
ing
tho
se w
ho a
re
even
tual
ly a
dm
itted
Sun
nyb
rook
Hea
lth S
cien
ces
Cen
tre
(acu
te
teac
hing
)
inp
atie
nt
bed
tra
ckin
g
syst
em
Con
tinue
to k
eep
bed
wai
t tim
es
visi
ble
and
acc
essi
ble
thr
ough
hosp
ital-
wid
e re
po
rtin
g, a
cces
s to
dat
a vi
a In
tran
et (d
aily
das
hboa
rd,
DA
RT,
rep
orts
), p
rofil
e at
dai
ly b
ed
man
agem
ent
mee
ting
s, d
aily
em
ail
to le
ader
s, e
tc .
Per
cent
age
of in
pat
ient
man
ager
s’
mee
ting
s w
here
ED
bed
wai
t tim
es
is o
n th
e ag
end
a
100%
The
Ho
spita
l Fo
r
Sic
k C
hild
ren
(acu
te t
each
ing)
Imp
lem
ent
an e
lect
roni
c b
ed
man
agem
ent
syst
em t
o al
low
trac
king
and
imp
rove
men
ts in
wai
t tim
e fo
r av
aila
ble
bed
s
Dire
cto
r, C
ritic
al C
are
Ser
vice
s,
pro
vid
es o
vers
ight
and
ong
oing
mon
itorin
g of
inte
rven
tion
com
plia
nce
and
imp
act
Impl
emen
ted
pro
cess
mea
sure
s ex
pec
ted
to p
rovi
de
timel
y
notic
e of
inte
rven
tion
effe
ctiv
enes
s o
r if
a re
cove
ry p
lan
req
uire
d a
t th
e
oper
atio
nal,
exec
u-
tive
and
gov
erna
nce
leve
ls
Co
rnw
all
Co
mm
unity
Ho
spita
l (la
rge
com
mun
ity)
taB
le
25:
ch
an
ge
ide
as
to
imp
ro
ve
ed
Wa
it t
ime
s f
or
ad
mit
te
d p
at
ien
ts
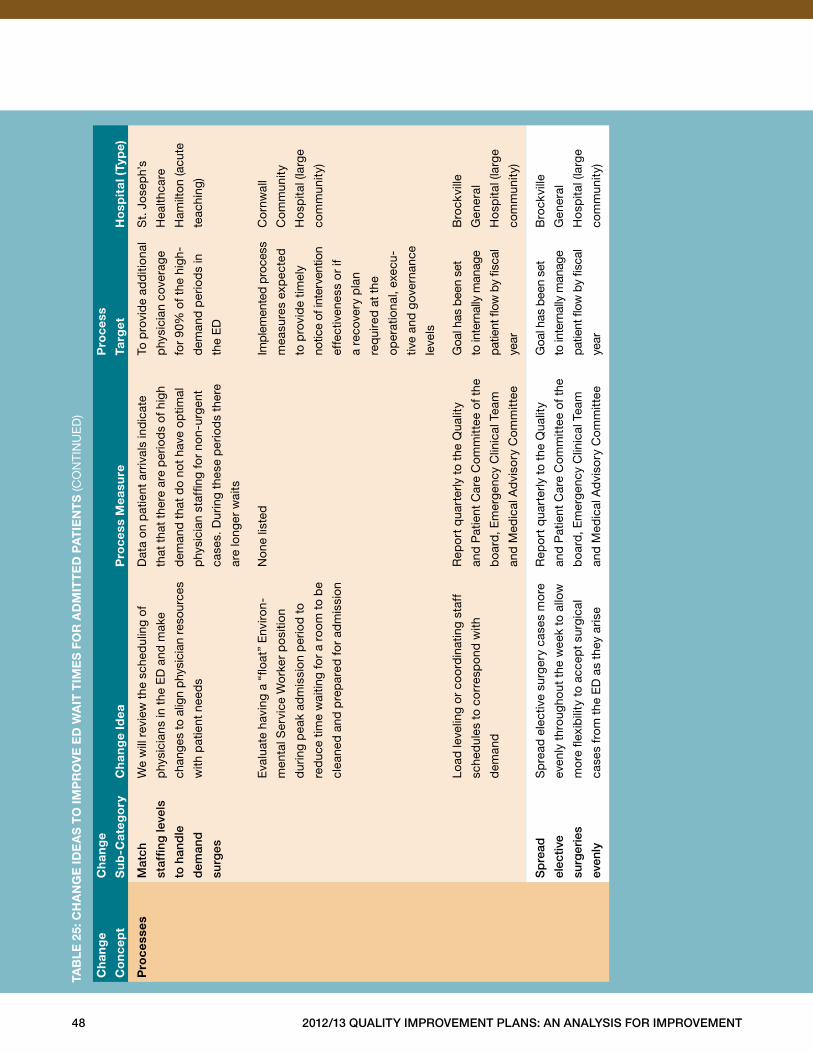
48 2012/13 Quality improvement plans: an analysis for improvement
ch
ang
e
co
nce
pt
ch
ang
e
su
b-c
ateg
ory
ch
ang
e id
ea
pro
cess
mea
sure
pro
cess
targ
et
ho
spit
al (
typ
e)
pro
cess
esm
atch
staf
fing
leve
ls
to h
and
le
dem
and
surg
es
We
will
rev
iew
the
sch
edul
ing
of
phy
sici
ans
in t
he E
D a
nd m
ake
chan
ges
to a
lign
phy
sici
an r
esou
rces
with
pat
ient
nee
ds
Dat
a on
pat
ient
arr
ival
s in
dic
ate
that
tha
t th
ere
are
per
iod
s of
hig
h
dem
and
tha
t d
o no
t ha
ve o
ptim
al
phy
sici
an s
taffi
ng fo
r no
n-ur
gent
case
s . D
urin
g th
ese
per
iod
s th
ere
are
long
er w
aits
To p
rovi
de
add
ition
al
phy
sici
an c
over
age
for
90%
of t
he h
igh-
dem
and
per
iod
s in
the
ED
St .
Jo
sep
h’s
Hea
lthca
re
Ham
ilto
n (a
cute
teac
hing
)
Eva
luat
e ha
ving
a “
float
” E
nviro
n-
men
tal S
ervi
ce W
ork
er p
osi
tion
dur
ing
pea
k ad
mis
sion
per
iod
to
red
uce
time
wai
ting
for
a ro
om t
o b
e
clea
ned
and
pre
par
ed fo
r ad
mis
sion
Non
e lis
ted
Impl
emen
ted
pro
cess
mea
sure
s ex
pec
ted
to p
rovi
de
timel
y
notic
e of
inte
rven
tion
effe
ctiv
enes
s o
r if
a re
cove
ry p
lan
req
uire
d a
t th
e
oper
atio
nal,
exec
u-
tive
and
gov
erna
nce
leve
ls
Co
rnw
all
Co
mm
unity
Ho
spita
l (la
rge
com
mun
ity)
Load
leve
ling
or
coo
rdin
atin
g st
aff
sche
dul
es t
o co
rres
pon
d w
ith
dem
and
Rep
ort
qua
rter
ly t
o th
e Q
ualit
y
and
Pat
ient
Car
e C
omm
ittee
of t
he
boa
rd, E
mer
genc
y C
linic
al T
eam
and
Med
ical
Ad
viso
ry C
omm
ittee
Goa
l has
bee
n se
t
to in
tern
ally
man
age
patie
nt fl
ow b
y fis
cal
year
Bro
ckvi
lle
Gen
eral
Ho
spita
l (la
rge
com
mun
ity)
sp
read
elec
tive
surg
erie
s
even
ly
Sp
read
ele
ctiv
e su
rger
y ca
ses
mo
re
even
ly t
hrou
ghou
t th
e w
eek
to a
llow
mo
re fl
exib
ility
to
acce
pt
surg
ical
case
s fr
om t
he E
D a
s th
ey a
rise
Rep
ort
qua
rter
ly t
o th
e Q
ualit
y
and
Pat
ient
Car
e C
omm
ittee
of t
he
boa
rd, E
mer
genc
y C
linic
al T
eam
and
Med
ical
Ad
viso
ry C
omm
ittee
Goa
l has
bee
n se
t
to in
tern
ally
man
age
patie
nt fl
ow b
y fis
cal
year
Bro
ckvi
lle
Gen
eral
Ho
spita
l (la
rge
com
mun
ity)
taB
le
25:
ch
an
ge
ide
as
to
imp
ro
ve
ed
Wa
it t
ime
s f
or
ad
mit
te
d p
at
ien
ts
(CO
NTI
NU
ED
)
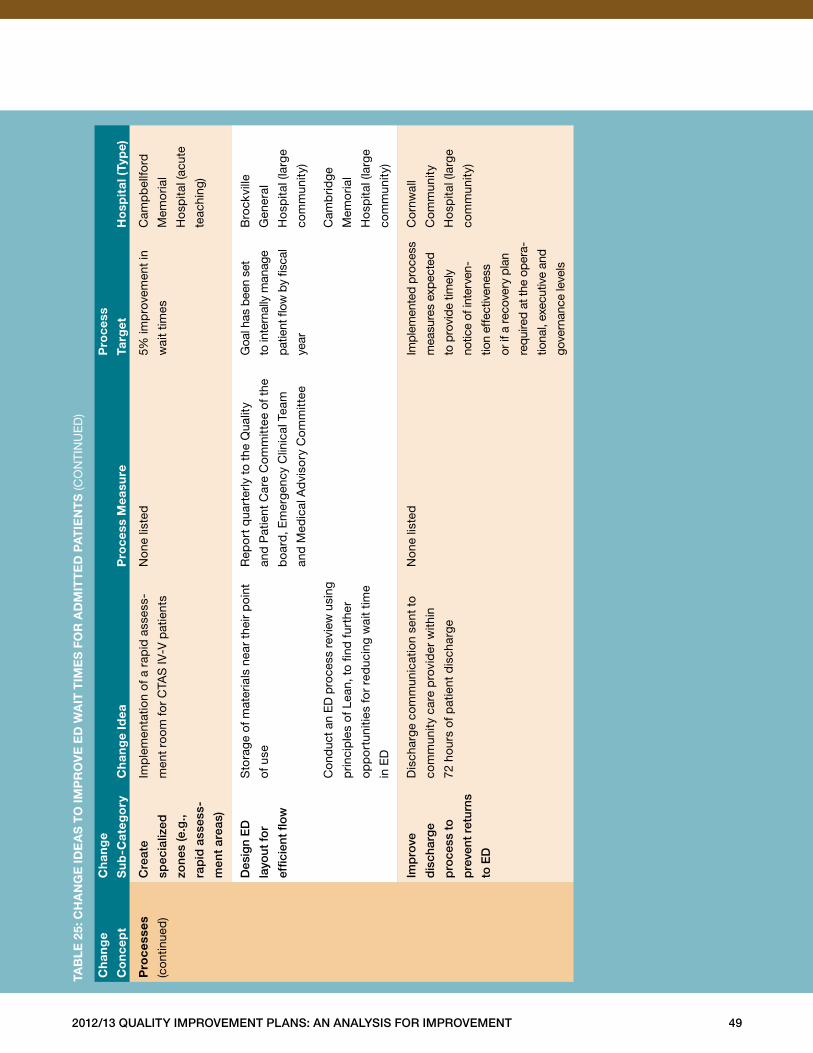
2012/13 Quality improvement plans: an analysis for improvement 49
ch
ang
e
co
nce
pt
ch
ang
e
su
b-c
ateg
ory
ch
ang
e id
ea
pro
cess
mea
sure
pro
cess
targ
et
ho
spit
al (
typ
e)
pro
cess
es
(con
tinue
d)
Cre
ate
spec
ializ
ed
zone
s (e
.g.,
rap
id a
sses
s-
men
t ar
eas)
Imp
lem
enta
tion
of a
rap
id a
sses
s-
men
t ro
om fo
r C
TAS
IV-V
pat
ient
s
Non
e lis
ted
5% im
pro
vem
ent
in
wai
t tim
es
Cam
pb
ellfo
rd
Mem
oria
l
Ho
spita
l (ac
ute
teac
hing
)
Des
ign
eD
layo
ut fo
r
effic
ient
flow
Sto
rage
of m
ater
ials
nea
r th
eir
poi
nt
of u
se
Rep
ort
qua
rter
ly t
o th
e Q
ualit
y
and
Pat
ient
Car
e C
omm
ittee
of t
he
boa
rd, E
mer
genc
y C
linic
al T
eam
and
Med
ical
Ad
viso
ry C
omm
ittee
Goa
l has
bee
n se
t
to in
tern
ally
man
age
patie
nt fl
ow b
y fis
cal
year
Bro
ckvi
lle
Gen
eral
Ho
spita
l (la
rge
com
mun
ity)
Con
duc
t an
ED
pro
cess
rev
iew
usi
ng
prin
cip
les
of L
ean,
to
find
fur
ther
opp
ort
uniti
es fo
r re
duc
ing
wai
t tim
e
in E
D
Cam
brid
ge
Mem
oria
l
Ho
spita
l (la
rge
com
mun
ity)
imp
rove
dis
char
ge
pro
cess
to
pre
vent
ret
urns
to e
D
Dis
char
ge c
omm
unic
atio
n se
nt t
o
com
mun
ity c
are
pro
vid
er w
ithin
72 h
ours
of p
atie
nt d
isch
arge
Non
e lis
ted
Impl
emen
ted
pro
cess
mea
sure
s ex
pec
ted
to p
rovi
de ti
mel
y
notic
e of
inte
rven
-
tion
effe
ctiv
enes
s
or if
a re
cove
ry p
lan
requ
ired
at th
e op
era-
tiona
l, ex
ecut
ive
and
gove
rnan
ce le
vels
Co
rnw
all
Co
mm
unity
Ho
spita
l (la
rge
com
mun
ity)
taB
le
25:
ch
an
ge
ide
as
to
imp
ro
ve
ed
Wa
it t
ime
s f
or
ad
mit
te
d p
at
ien
ts
(CO
NTI
NU
ED
)
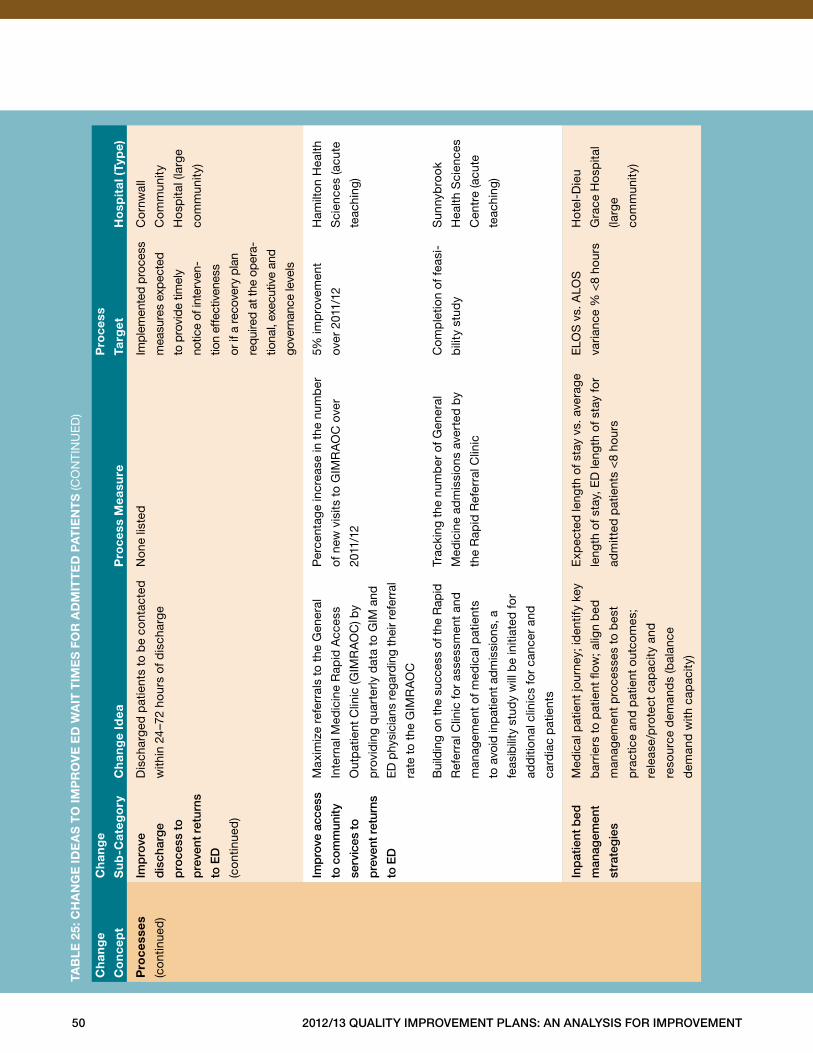
50 2012/13 Quality improvement plans: an analysis for improvement
ch
ang
e
co
nce
pt
ch
ang
e
su
b-c
ateg
ory
ch
ang
e id
ea
pro
cess
mea
sure
pro
cess
targ
et
ho
spit
al (
typ
e)
pro
cess
es
(con
tinue
d)
imp
rove
dis
char
ge
pro
cess
to
pre
vent
ret
urns
to e
D
(con
tinue
d)
Dis
char
ged
pat
ient
s to
be
cont
acte
d
with
in 2
4–7
2 ho
urs
of d
isch
arge
Non
e lis
ted
Impl
emen
ted
pro
cess
mea
sure
s ex
pec
ted
to p
rovi
de ti
mel
y
notic
e of
inte
rven
-
tion
effe
ctiv
enes
s
or if
a re
cove
ry p
lan
requ
ired
at th
e op
era-
tiona
l, ex
ecut
ive
and
gove
rnan
ce le
vels
Co
rnw
all
Co
mm
unity
Ho
spita
l (la
rge
com
mun
ity)
imp
rove
acc
ess
to c
omm
unity
serv
ices
to
pre
vent
ret
urns
to e
D
Max
imiz
e re
ferr
als
to t
he G
ener
al
Inte
rnal
Med
icin
e R
apid
Acc
ess
Out
pat
ient
Clin
ic (G
IMR
AO
C) b
y
pro
vid
ing
qua
rter
ly d
ata
to G
IM a
nd
ED
phy
sici
ans
rega
rdin
g th
eir
refe
rral
rate
to
the
GIM
RA
OC
Per
cent
age
incr
ease
in t
he n
umb
er
of n
ew v
isits
to
GIM
RA
OC
ove
r
2011
/12
5% im
pro
vem
ent
over
201
1/12
Ham
ilto
n H
ealth
Sci
ence
s (a
cute
teac
hing
)
Bui
ldin
g on
the
succ
ess
of th
e R
apid
Ref
erra
l Clin
ic fo
r as
sess
men
t an
d
man
agem
ent
of m
edic
al p
atie
nts
to a
void
inp
atie
nt a
dm
issi
ons,
a
feas
ibili
ty s
tud
y w
ill b
e in
itiat
ed fo
r
add
ition
al c
linic
s fo
r ca
ncer
and
card
iac
pat
ient
s
Trac
king
the
num
ber
of G
ener
al
Med
icin
e ad
mis
sion
s av
erte
d b
y
the
Rap
id R
efer
ral C
linic
Co
mp
letio
n of
feas
i-
bili
ty s
tud
y
Sun
nyb
rook
Hea
lth S
cien
ces
Cen
tre
(acu
te
teac
hing
)
inp
atie
nt b
ed
man
agem
ent
stra
teg
ies
Med
ical
pat
ient
jour
ney;
iden
tify
key
bar
riers
to
pat
ient
flow
; alig
n b
ed
man
agem
ent
pro
cess
es t
o b
est
pra
ctic
e an
d p
atie
nt o
utco
mes
;
rele
ase/
pro
tect
cap
acity
and
reso
urce
dem
and
s (b
alan
ce
dem
and
with
cap
acity
)
Exp
ecte
d le
ngth
of s
tay
vs . a
vera
ge
leng
th o
f sta
y, E
D le
ngth
of s
tay
for
adm
itted
pat
ient
s <
8 ho
urs
ELO
S v
s . A
LOS
varia
nce
% <
8 ho
urs
Hot
el-D
ieu
Gra
ce H
osp
ital
(larg
e
com
mun
ity)
taB
le
25:
ch
an
ge
ide
as
to
imp
ro
ve
ed
Wa
it t
ime
s f
or
ad
mit
te
d p
at
ien
ts
(CO
NTI
NU
ED
)
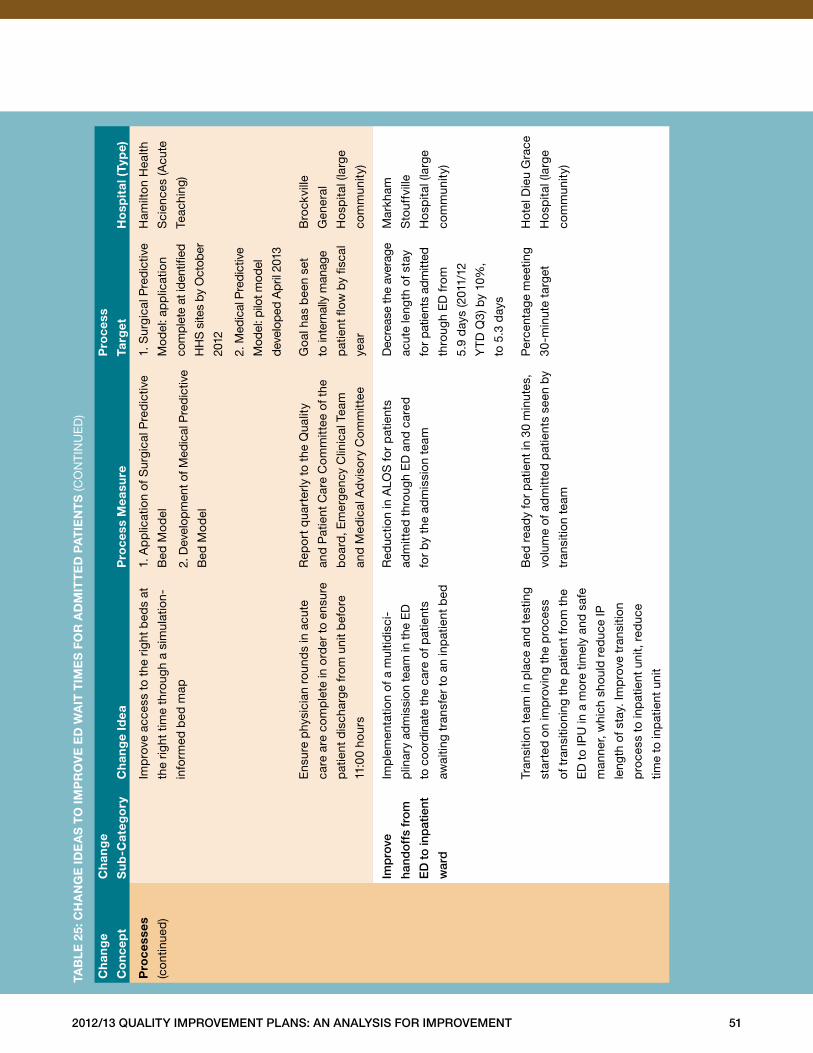
2012/13 Quality improvement plans: an analysis for improvement 51
ch
ang
e
co
nce
pt
ch
ang
e
su
b-c
ateg
ory
ch
ang
e id
ea
pro
cess
mea
sure
pro
cess
targ
et
ho
spit
al (
typ
e)
pro
cess
es
(con
tinue
d)
Imp
rove
acc
ess
to t
he r
ight
bed
s at
the
right
tim
e th
roug
h a
sim
ulat
ion-
info
rmed
bed
map
1 . A
pp
licat
ion
of S
urgi
cal P
red
ictiv
e
Bed
Mo
del
2 . D
evel
opm
ent o
f Med
ical
Pre
dic
tive
Bed
Mo
del
1 . S
urgi
cal P
red
ictiv
e
Mod
el: a
pp
licat
ion
com
plet
e at
iden
tified
HH
S s
ites
by O
ctob
er
2012
2 . M
edic
al P
redi
ctiv
e
Mod
el: p
ilot m
odel
deve
lop
ed A
pril
201
3
Ham
ilto
n H
ealth
Sci
ence
s (A
cute
Teac
hing
)
Ens
ure
phy
sici
an r
ound
s in
acu
te
care
are
com
ple
te in
ord
er t
o en
sure
pat
ient
dis
char
ge f
rom
uni
t b
efo
re
11:0
0 ho
urs
Rep
ort
qua
rter
ly t
o th
e Q
ualit
y
and
Pat
ient
Car
e C
omm
ittee
of t
he
boa
rd, E
mer
genc
y C
linic
al T
eam
and
Med
ical
Ad
viso
ry C
omm
ittee
Goa
l has
bee
n se
t
to in
tern
ally
man
age
pat
ient
flow
by
fisca
l
year
Bro
ckvi
lle
Gen
eral
Ho
spita
l (la
rge
com
mun
ity)
imp
rove
hand
off
s fr
om
eD
to
inp
atie
nt
war
d
Imp
lem
enta
tion
of a
mul
tidis
ci-
plin
ary
adm
issi
on te
am in
the
ED
to c
oord
inat
e th
e ca
re o
f pat
ient
s
awai
ting
tran
sfer
to
an in
pat
ient
bed
Red
uctio
n in
ALO
S fo
r p
atie
nts
adm
itted
thr
ough
ED
and
car
ed
for
by
the
adm
issi
on t
eam
Dec
reas
e th
e av
erag
e
acut
e le
ngth
of s
tay
for
patie
nts
adm
itted
thro
ugh
ED
fro
m
5 .9
day
s (2
011/
12
YT
D Q
3) b
y 10
%,
to 5
.3 d
ays
Mar
kham
Sto
uffv
ille
Ho
spita
l (la
rge
com
mun
ity)
Tran
sitio
n te
am in
pla
ce a
nd t
estin
g
star
ted
on
imp
rovi
ng t
he p
roce
ss
of t
rans
ition
ing
the
pat
ient
fro
m t
he
ED
to
IPU
in a
mo
re t
imel
y an
d s
afe
man
ner,
whi
ch s
houl
d r
educ
e IP
leng
th o
f sta
y . Im
pro
ve t
rans
ition
pro
cess
to
inp
atie
nt u
nit,
red
uce
time
to in
pat
ient
uni
t
Bed
rea
dy
for
pat
ient
in 3
0 m
inut
es,
volu
me
of a
dm
itted
pat
ient
s se
en b
y
tran
sitio
n te
am
Per
cent
age
mee
ting
30-m
inut
e ta
rget
Hot
el D
ieu
Gra
ce
Ho
spita
l (la
rge
com
mun
ity)
taB
le
25:
ch
an
ge
ide
as
to
imp
ro
ve
ed
Wa
it t
ime
s f
or
ad
mit
te
d p
at
ien
ts
(CO
NTI
NU
ED
)
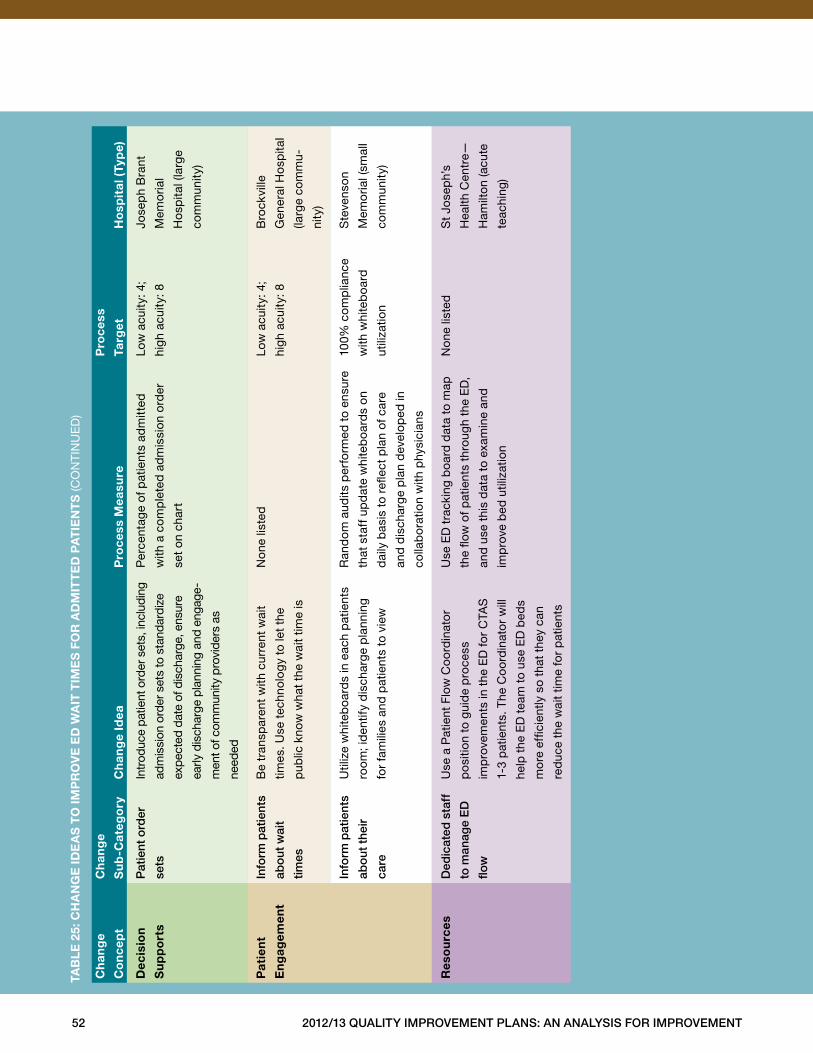
52 2012/13 Quality improvement plans: an analysis for improvement
ch
ang
e
co
nce
pt
ch
ang
e
su
b-c
ateg
ory
ch
ang
e id
ea
pro
cess
mea
sure
pro
cess
targ
et
ho
spit
al (
typ
e)
dec
isio
n
su
pp
ort
s
pat
ient
ord
er
sets
Intr
oduc
e pa
tient
ord
er s
ets,
incl
udin
g
adm
issi
on o
rder
set
s to
sta
ndar
dize
exp
ecte
d da
te o
f dis
char
ge, e
nsur
e
early
dis
char
ge p
lann
ing
and
enga
ge-
men
t of c
omm
unity
pro
vide
rs a
s
need
ed
Per
cent
age
of p
atie
nts
adm
itted
with
a c
omp
lete
d a
dm
issi
on o
rder
set
on c
hart
Low
acu
ity: 4
;
high
acu
ity: 8
Jose
ph
Bra
nt
Mem
oria
l
Ho
spita
l (la
rge
com
mun
ity)
pat
ien
t
en
gag
emen
t
info
rm p
atie
nts
abo
ut w
ait
times
Be
tran
spar
ent
with
cur
rent
wai
t
times
. Use
tec
hnol
og
y to
let
the
pub
lic k
now
wha
t th
e w
ait
time
is
Non
e lis
ted
Low
acu
ity: 4
;
high
acu
ity: 8
Bro
ckvi
lle
Gen
eral
Ho
spita
l
(larg
e co
mm
u-
nity
)
info
rm p
atie
nts
abo
ut t
heir
care
Util
ize
whi
teb
oard
s in
eac
h p
atie
nts
room
; id
entif
y d
isch
arge
pla
nnin
g
for
fam
ilies
and
pat
ient
s to
vie
w
Ran
dom
aud
its p
erfo
rmed
to
ensu
re
that
sta
ff u
pd
ate
whi
teb
oard
s on
dai
ly b
asis
to
refle
ct p
lan
of c
are
and
dis
char
ge p
lan
dev
elop
ed in
colla
bo
ratio
n w
ith p
hysi
cian
s
100%
co
mp
lianc
e
with
whi
teb
oard
utili
zatio
n
Ste
vens
on
Mem
oria
l (sm
all
com
mun
ity)
res
ou
rces
Ded
icat
ed s
taff
to m
anag
e e
D
flow
Use
a P
atie
nt F
low
Co
ord
inat
or
po
sitio
n to
gui
de
pro
cess
imp
rove
men
ts in
the
ED
for
CTA
S
1-3
pat
ient
s . T
he C
oo
rdin
ato
r w
ill
help
the
ED
tea
m t
o us
e E
D b
eds
mo
re e
ffici
ently
so
that
the
y ca
n
red
uce
the
wai
t tim
e fo
r p
atie
nts
Use
ED
tra
ckin
g b
oard
dat
a to
map
the
flow
of p
atie
nts
thro
ugh
the
ED
,
and
use
thi
s d
ata
to e
xam
ine
and
imp
rove
bed
util
izat
ion
Non
e lis
ted
St
Jose
ph’
s
Hea
lth C
entr
e—
Ham
ilto
n (a
cute
teac
hing
)
taB
le
25:
ch
an
ge
ide
as
to
imp
ro
ve
ed
Wa
it t
ime
s f
or
ad
mit
te
d p
at
ien
ts
(CO
NTI
NU
ED
)
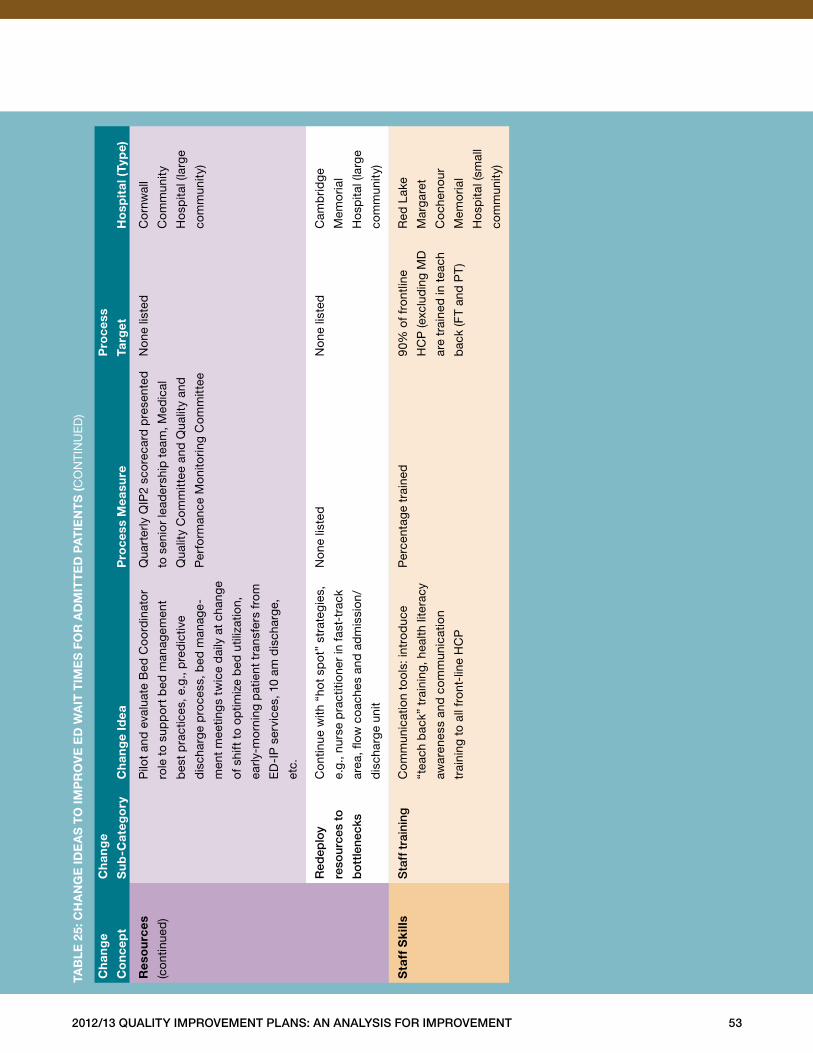
2012/13 Quality improvement plans: an analysis for improvement 53
ch
ang
e
co
nce
pt
ch
ang
e
su
b-c
ateg
ory
ch
ang
e id
ea
pro
cess
mea
sure
pro
cess
targ
et
ho
spit
al (
typ
e)
res
ou
rces
(con
tinue
d)
Pilo
t an
d e
valu
ate
Bed
Co
ord
inat
or
role
to
sup
po
rt b
ed m
anag
emen
t
bes
t p
ract
ices
, e .g
., p
red
ictiv
e
dis
char
ge p
roce
ss, b
ed m
anag
e-
men
t m
eetin
gs
twic
e d
aily
at
chan
ge
of s
hift
to
optim
ize
bed
util
izat
ion,
early
-mo
rnin
g p
atie
nt t
rans
fers
fro
m
ED
-IP
ser
vice
s, 1
0 am
dis
char
ge,
etc .
Qua
rter
ly Q
IP2
sco
reca
rd p
rese
nted
to s
enio
r le
ader
ship
tea
m, M
edic
al
Qua
lity
Com
mitt
ee a
nd Q
ualit
y an
d
Per
form
ance
Mon
itorin
g C
omm
ittee
Non
e lis
ted
Co
rnw
all
Co
mm
unity
Ho
spita
l (la
rge
com
mun
ity)
red
eplo
y
reso
urce
s to
bo
ttle
neck
s
Con
tinue
with
“ho
t sp
ot”
stra
tegi
es,
e .g .
, nur
se p
ract
ition
er in
fast
-tra
ck
area
, flow
coa
ches
and
ad
mis
sion
/
dis
char
ge u
nit
Non
e lis
ted
Non
e lis
ted
Cam
brid
ge
Mem
oria
l
Ho
spita
l (la
rge
com
mun
ity)
sta
ff s
kill
ss
taff
tra
inin
gC
omm
unic
atio
n to
ols:
intr
od
uce
“tea
ch b
ack”
tra
inin
g, h
ealth
lite
racy
awar
enes
s an
d c
omm
unic
atio
n
trai
ning
to
all f
ront
-lin
e H
CP
Per
cent
age
trai
ned
90%
of f
ront
line
HC
P (e
xclu
din
g M
D
are
trai
ned
in t
each
bac
k (F
T an
d P
T)
Red
Lak
e
Mar
gar
et
Co
chen
our
Mem
oria
l
Ho
spita
l (sm
all
com
mun
ity)
taB
le
25:
ch
an
ge
ide
as
to
imp
ro
ve
ed
Wa
it t
ime
s f
or
ad
mit
te
d p
at
ien
ts
(CO
NTI
NU
ED
)
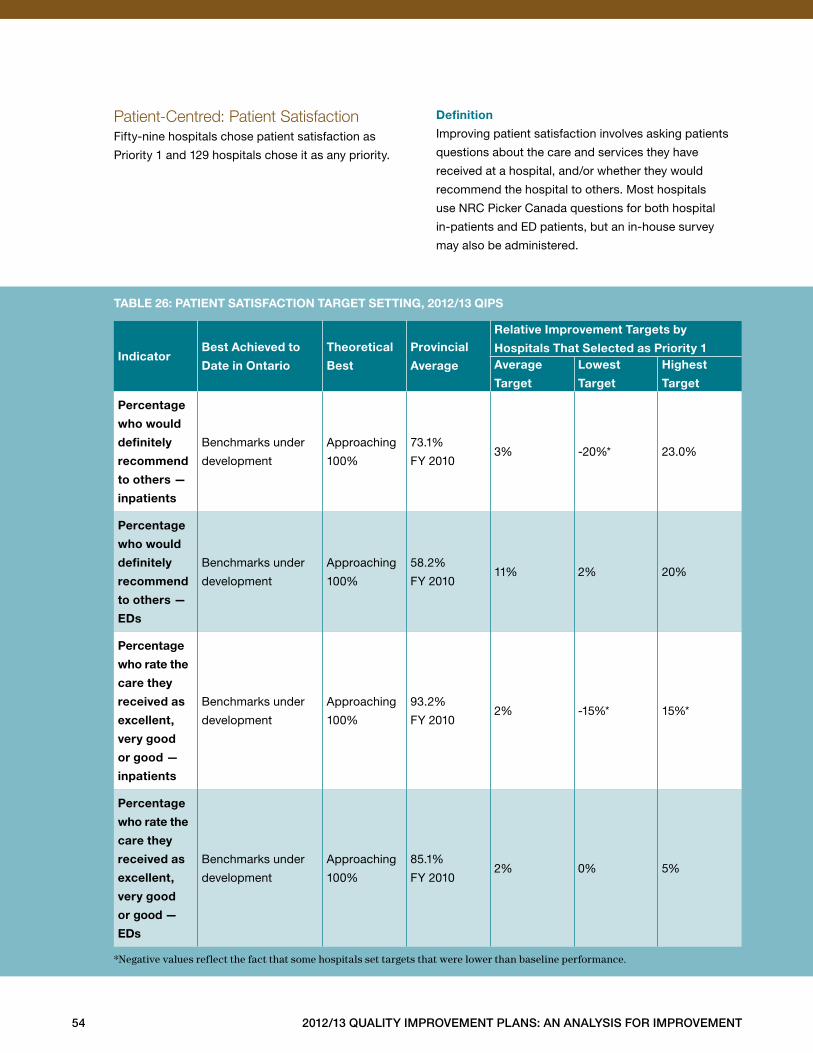
54 2012/13 Quality improvement plans: an analysis for improvement
Patient-Centred: Patient Satisfaction Fifty-nine hospitals chose patient satisfaction as
Priority 1 and 129 hospitals chose it as any priority .
definition
Improving patient satisfaction involves asking patients
questions about the care and services they have
received at a hospital, and/or whether they would
recommend the hospital to others . Most hospitals
use NRC Picker Canada questions for both hospital
in-patients and ED patients, but an in-house survey
may also be administered .
indicatorBest achieved to
date in ontario
theoretical
Best
provincial
average
relative improvement targets by
hospitals that selected as priority 1average
target
lowest
target
highest
target
percentage
who would
definitely
recommend
to others —
inpatients
Benchmarks under
development
Approaching
100%
73 .1%
FY 20103% -20%* 23 .0%
percentage
who would
definitely
recommend
to others —
eds
Benchmarks under
development
Approaching
100%
58 .2%
FY 201011% 2% 20%
percentage
who rate the
care they
received as
excellent,
very good
or good —
inpatients
Benchmarks under
development
Approaching
100%
93 .2%
FY 20102% -15%* 15%*
percentage
who rate the
care they
received as
excellent,
very good
or good —
eds
Benchmarks under
development
Approaching
100%
85 .1%
FY 20102% 0% 5%
*Negative values reflect the fact that some hospitals set targets that were lower than baseline performance.
taBle 26: patient satisfaction target setting, 2012/13 Qips
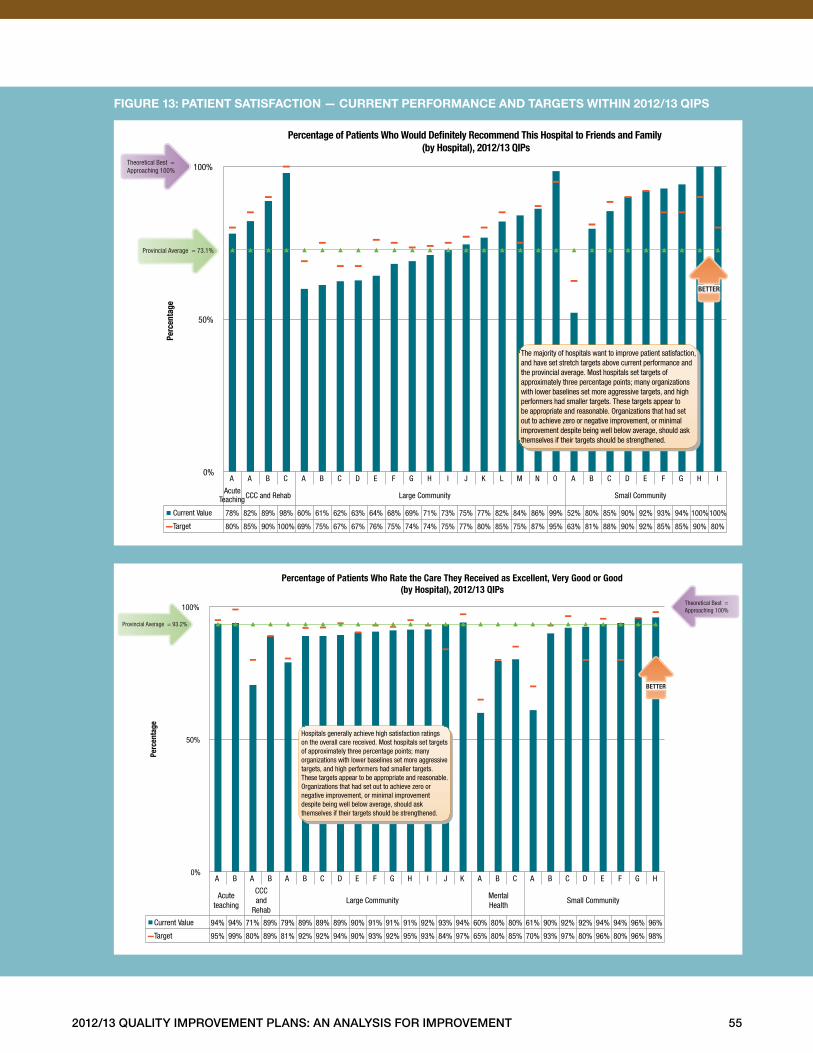
2012/13 Quality improvement plans: an analysis for improvement 55
figure 13: patient satisfaction — current performance and targets Within 2012/13 Qips
A A B C A B C D E F G H I J K L M N O A B C D E F G H I
Acute Teaching CCC and Rehab Large Community Small Community
Current Value 78% 82% 89% 98% 60% 61% 62% 63% 64% 68% 69% 71% 73% 75% 77% 82% 84% 86% 99% 52% 80% 85% 90% 92% 93% 94% 100%100%
Target 80% 85% 90% 100% 69% 75% 67% 67% 76% 75% 74% 74% 75% 77% 80% 85% 75% 87% 95% 63% 81% 88% 90% 92% 85% 85% 90% 80%
0%
50%
100% Pe
rcen
tage
Percentage of Patients Who Would De�nitely Recommend This Hospital to Friends and Family (by Hospital), 2012/13 QIPs
Provincial Average = 73.1%
Theoretical Best = Approaching 100%
The majority of hospitals want to improve patient satisfaction, and have set stretch targets above current performance and the provincial average. Most hospitals set targets of approximately three percentage points; many organizations with lower baselines set more aggressive targets, and high performers had smaller targets. These targets appear to be appropriate and reasonable. Organizations that had set out to achieve zero or negative improvement, or minimal improvement despite being well below average, should ask themselves if their targets should be strengthened.
BETTER
A B A B A B C D E F G H I J K A B C A B C D E F G H
Acute teaching
CCC and
Rehab Large Community
Mental Health
Small Community
Current Value 94% 94% 71% 89% 79% 89% 89% 89% 90% 91% 91% 91% 92% 93% 94% 60% 80% 80% 61% 90% 92% 92% 94% 94% 96% 96%
Target 95% 99% 80% 89% 81% 92% 92% 94% 90% 93% 92% 95% 93% 84% 97% 65% 80% 85% 70% 93% 97% 80% 96% 80% 96% 98%
0%
50%
100%
Perc
enta
ge
Percentage of Patients Who Rate the Care They Received as Excellent, Very Good or Good (by Hospital), 2012/13 QIPs
Hospitals generally achieve high satisfaction ratings on the overall care received. Most hospitals set targets of approximately three percentage points; many organizations with lower baselines set more aggressive targets, and high performers had smaller targets. These targets appear to be appropriate and reasonable. Organizations that had set out to achieve zero or negative improvement, or minimal improvement despite being well below average, should ask themselves if their targets should be strengthened.
Provincial Average = 93.2%
Theoretical Best = Approaching 100%
BETTER
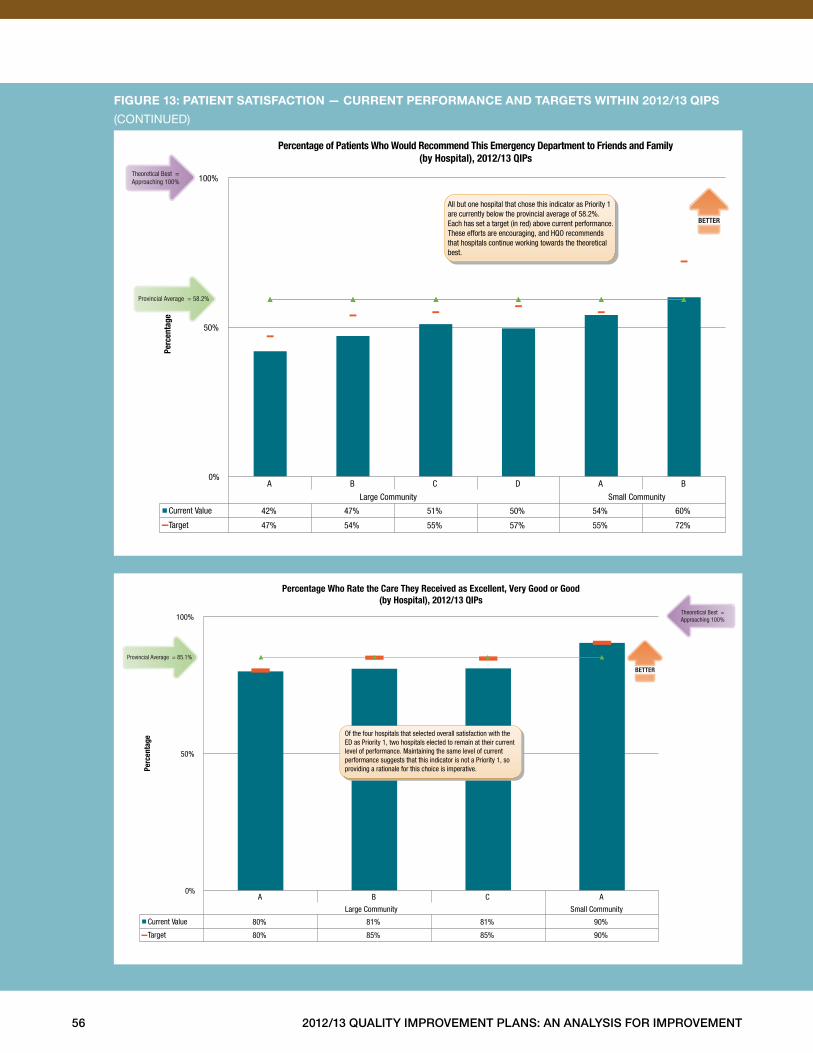
56 2012/13 Quality improvement plans: an analysis for improvement
figure 13: patient satisfaction — current performance and targets Within 2012/13 Qips
(CONTINUED)
A B C D A B
Large Community Small Community
Current Value 42% 47% 51% 50% 54% 60%
Target 47% 54% 55% 57% 55% 72%
0%
50%
100% Pe
rcen
tage
Percentage of Patients Who Would Recommend This Emergency Department to Friends and Family (by Hospital), 2012/13 QIPs
BETTER
All but one hospital that chose this indicator as Priority 1 are currently below the provincial average of 58.2%. Each has set a target (in red) above current performance. These efforts are encouraging, and HQO recommends that hospitals continue working towards the theoretical best.
Provincial Average = 58.2%
Theoretical Best = Approaching 100%
A B C A
Large Community Small Community
Current Value 80% 81% 81% 90%
Target 80% 85% 85% 90%
0%
50%
100%
Perc
enta
ge
Percentage Who Rate the Care They Received as Excellent, Very Good or Good(by Hospital), 2012/13 QIPs
BETTER
Provincial Average = 85.1%
Theoretical Best = Approaching 100%
Of the four hospitals that selected overall satisfaction with the ED as Priority 1, two hospitals elected to remain at their current level of performance. Maintaining the same level of current performance suggests that this indicator is not a Priority 1, so providing a rationale for this choice is imperative.
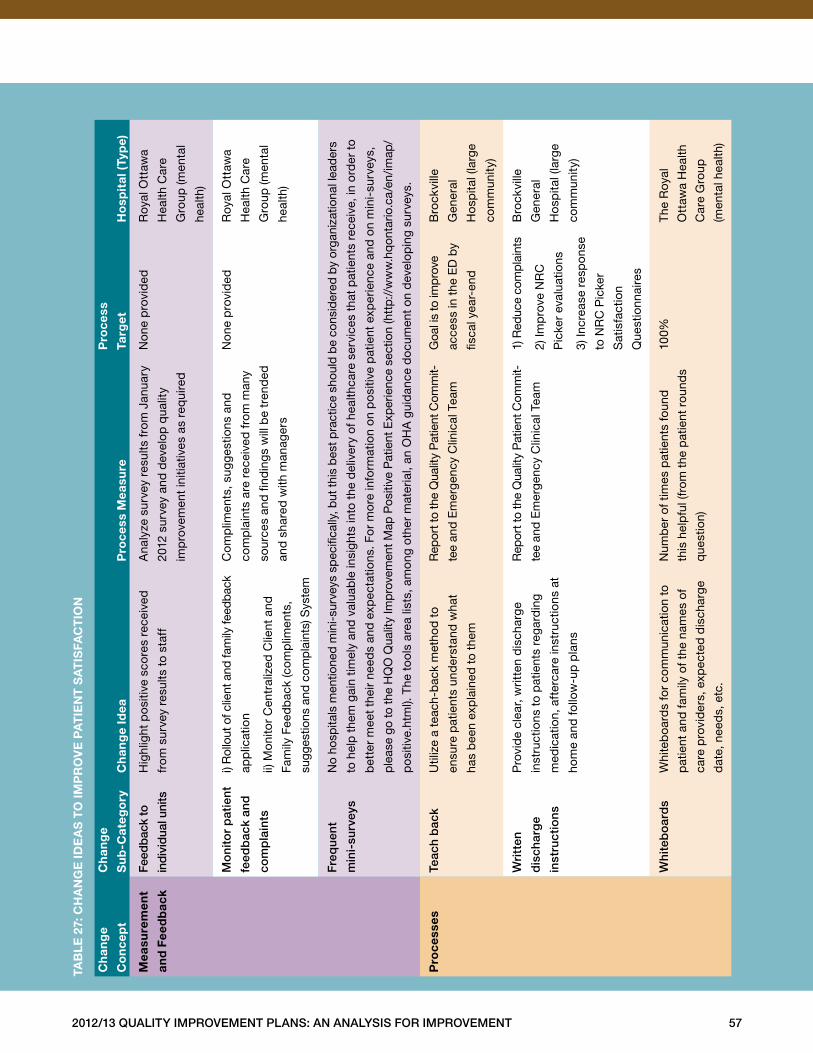
2012/13 Quality improvement plans: an analysis for improvement 57
ch
ang
e
co
nce
pt
ch
ang
e
su
b-c
ateg
ory
ch
ang
e id
ea
pro
cess
mea
sure
pro
cess
targ
et
ho
spit
al (
typ
e)
mea
sure
men
t
and
fee
db
ack
feed
bac
k to
ind
ivid
ual u
nits
Hig
hlig
ht p
osi
tive
sco
res
rece
ived
from
sur
vey
resu
lts t
o st
aff
Ana
lyze
sur
vey
resu
lts f
rom
Jan
uary
2012
sur
vey
and
dev
elop
qua
lity
imp
rove
men
t in
itiat
ives
as
req
uire
d
No
ne p
rovi
ded
Roy
al O
ttaw
a
Hea
lth C
are
Gro
up (m
enta
l
heal
th)
mo
nito
r p
atie
nt
feed
bac
k an
d
com
pla
ints
i) R
ollo
ut o
f clie
nt a
nd fa
mily
feed
back
app
licat
ion
ii) M
onito
r C
entr
aliz
ed C
lient
and
Fam
ily F
eed
bac
k (c
omp
limen
ts,
sugg
estio
ns a
nd c
omp
lain
ts) S
yste
m
Com
plim
ents
, sug
gest
ions
and
com
pla
ints
are
rec
eive
d f
rom
man
y
sour
ces
and
find
ing
s w
ill b
e tr
end
ed
and
sha
red
with
man
ager
s
No
ne p
rovi
ded
Roy
al O
ttaw
a
Hea
lth C
are
Gro
up (m
enta
l
heal
th)
freq
uent
min
i-su
rvey
s
No
hosp
itals
men
tione
d m
ini-
surv
eys
spec
ifica
lly, b
ut th
is b
est p
ract
ice
shou
ld b
e co
nsid
ered
by
orga
niza
tiona
l lea
der
s
to h
elp
the
m g
ain
timel
y an
d v
alua
ble
insi
ghts
into
the
del
iver
y of
hea
lthca
re s
ervi
ces
that
pat
ient
s re
ceiv
e, in
ord
er t
o
bet
ter
mee
t th
eir
need
s an
d e
xpec
tatio
ns . F
or
mo
re in
form
atio
n on
po
sitiv
e p
atie
nt e
xper
ienc
e an
d o
n m
ini-
surv
eys,
ple
ase
go to
the
HQ
O Q
ualit
y Im
pro
vem
ent M
ap P
ositi
ve P
atie
nt E
xper
ienc
e se
ctio
n (h
ttp:
//w
ww
.hq
onta
rio .c
a/en
/imap
/
po
sitiv
e .ht
ml) .
The
to
ols
area
list
s, a
mon
g ot
her
mat
eria
l, an
OH
A g
uid
ance
do
cum
ent
on
dev
elop
ing
surv
eys .
pro
cess
este
ach
bac
kU
tiliz
e a
teac
h-b
ack
met
hod
to
ensu
re p
atie
nts
und
erst
and
wha
t
has
bee
n ex
pla
ined
to
them
Rep
ort t
o th
e Q
ualit
y P
atie
nt C
omm
it-
tee
and
Em
erge
ncy
Clin
ical
Tea
m
Goa
l is
to im
pro
ve
acce
ss in
the
ED
by
fisca
l yea
r-en
d
Bro
ckvi
lle
Gen
eral
Ho
spita
l (la
rge
com
mun
ity)
Wri
tten
dis
char
ge
inst
ruct
ions
Pro
vid
e cl
ear,
writ
ten
dis
char
ge
inst
ruct
ions
to
pat
ient
s re
gard
ing
med
icat
ion,
aft
erca
re in
stru
ctio
ns a
t
hom
e an
d fo
llow
-up
pla
ns
Rep
ort t
o th
e Q
ualit
y P
atie
nt C
omm
it-
tee
and
Em
erge
ncy
Clin
ical
Tea
m
1) R
educ
e co
mp
lain
ts
2) Im
pro
ve N
RC
Pic
ker
eval
uatio
ns
3) In
crea
se r
esp
ons
e
to N
RC
Pic
ker
Sat
isfa
ctio
n
Que
stio
nnai
res
Bro
ckvi
lle
Gen
eral
Ho
spita
l (la
rge
com
mun
ity)
Whi
teb
oar
ds
Whi
teb
oard
s fo
r co
mm
unic
atio
n to
pat
ient
and
fam
ily o
f the
nam
es o
f
care
pro
vid
ers,
exp
ecte
d d
isch
arge
dat
e, n
eed
s, e
tc .
Num
ber
of t
imes
pat
ient
s fo
und
this
hel
pfu
l (fr
om t
he p
atie
nt r
ound
s
que
stio
n)
100%
The
Roy
al
Ott
awa
Hea
lth
Car
e G
roup
(men
tal h
ealth
)
taB
le
27:
ch
an
ge
ide
as
to
imp
ro
ve
pa
tie
nt
sa
tis
fac
tio
n
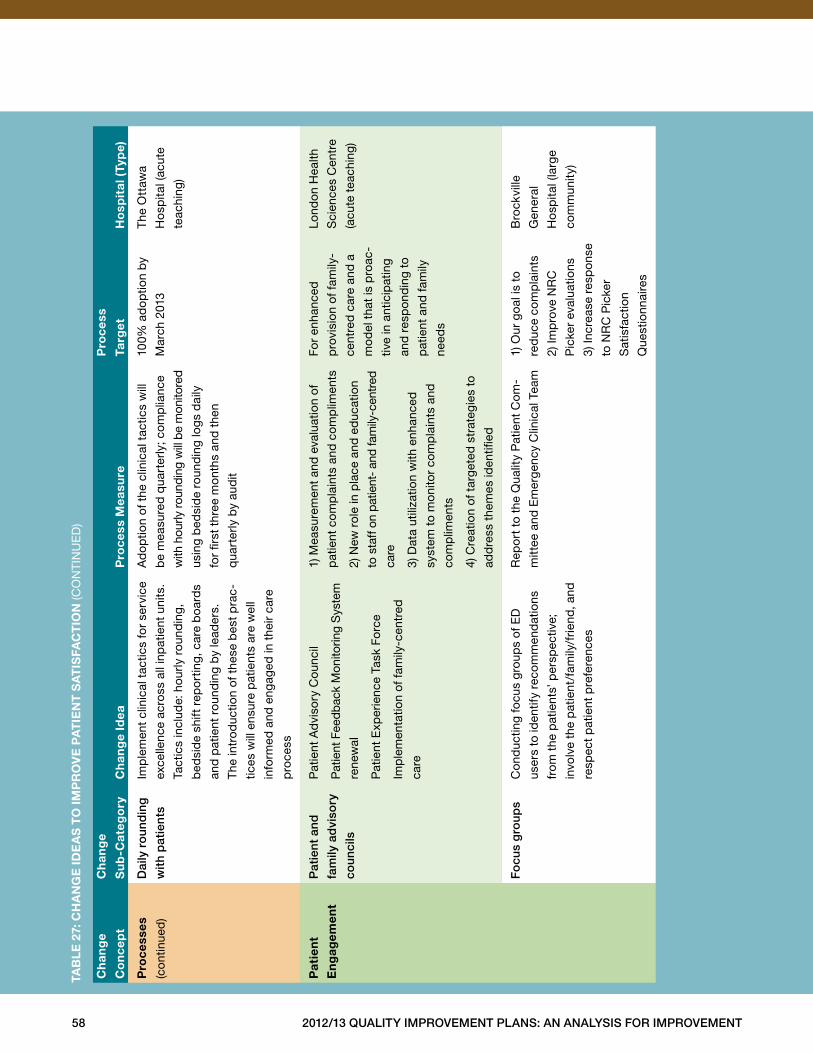
58 2012/13 Quality improvement plans: an analysis for improvement
ch
ang
e
co
nce
pt
ch
ang
e
su
b-c
ateg
ory
ch
ang
e id
ea
pro
cess
mea
sure
pro
cess
targ
et
ho
spit
al (
typ
e)
pro
cess
es
(con
tinue
d)
Dai
ly r
oun
din
g
wit
h p
atie
nts
Imp
lem
ent
clin
ical
tac
tics
for
serv
ice
exce
llenc
e ac
ross
all
inp
atie
nt u
nits
.
Tact
ics
incl
ude:
hou
rly r
ound
ing,
bed
sid
e sh
ift r
epo
rtin
g, c
are
boa
rds
and
pat
ient
rou
ndin
g b
y le
ader
s .
The
intr
od
uctio
n of
the
se b
est
pra
c-
tices
will
ens
ure
pat
ient
s ar
e w
ell
info
rmed
and
eng
aged
in t
heir
care
pro
cess
Ad
optio
n of
the
clin
ical
tac
tics
will
be
mea
sure
d q
uart
erly
; com
plia
nce
with
hou
rly ro
undi
ng w
ill b
e m
onito
red
usin
g b
edsi
de
roun
din
g lo
gs
dai
ly
for
first
thr
ee m
onth
s an
d t
hen
qua
rter
ly b
y au
dit
100%
ad
optio
n b
y
Mar
ch 2
013
The
Ott
awa
Ho
spita
l (ac
ute
teac
hing
)
pat
ien
t
en
gag
emen
t
pat
ient
and
fam
ily a
dvi
sory
coun
cils
Pat
ient
Ad
viso
ry C
ounc
il
Pat
ient
Fee
db
ack
Mon
itorin
g S
yste
m
rene
wal
Pat
ient
Exp
erie
nce
Task
Fo
rce
Imp
lem
enta
tion
of fa
mily
-cen
tred
care
1) M
easu
rem
ent
and
eva
luat
ion
of
pat
ient
com
pla
ints
and
com
plim
ents
2) N
ew r
ole
in p
lace
and
ed
ucat
ion
to s
taff
on
patie
nt-
and
fam
ily-c
entr
ed
care
3) D
ata
utili
zatio
n w
ith e
nhan
ced
syst
em t
o m
onito
r co
mp
lain
ts a
nd
com
plim
ents
4) C
reat
ion
of t
arge
ted
str
ateg
ies
to
add
ress
the
mes
iden
tified
For
enha
nced
pro
visi
on
of fa
mily
-
cent
red
car
e an
d a
mo
del
tha
t is
pro
ac-
tive
in a
ntic
ipat
ing
and
res
po
ndin
g to
pat
ient
and
fam
ily
need
s
Lond
on
Hea
lth
Sci
ence
s C
entr
e
(acu
te t
each
ing)
fo
cus
gro
ups
Con
duc
ting
focu
s g
roup
s of
ED
user
s to
iden
tify
reco
mm
end
atio
ns
from
the
pat
ient
s’ p
ersp
ectiv
e;
invo
lve
the
pat
ient
/fam
ily/f
riend
, and
resp
ect
pat
ient
pre
fere
nces
Rep
ort
to
the
Qua
lity
Pat
ient
Com
-
mitt
ee a
nd E
mer
genc
y C
linic
al T
eam
1) O
ur g
oal i
s to
red
uce
com
pla
ints
2) Im
pro
ve N
RC
Pic
ker
eval
uatio
ns
3) In
crea
se r
esp
ons
e
to N
RC
Pic
ker
Sat
isfa
ctio
n
Que
stio
nnai
res
Bro
ckvi
lle
Gen
eral
Ho
spita
l (la
rge
com
mun
ity)
taB
le
27:
ch
an
ge
ide
as
to
imp
ro
ve
pa
tie
nt
sa
tis
fac
tio
n (C
ON
TIN
UE
D)
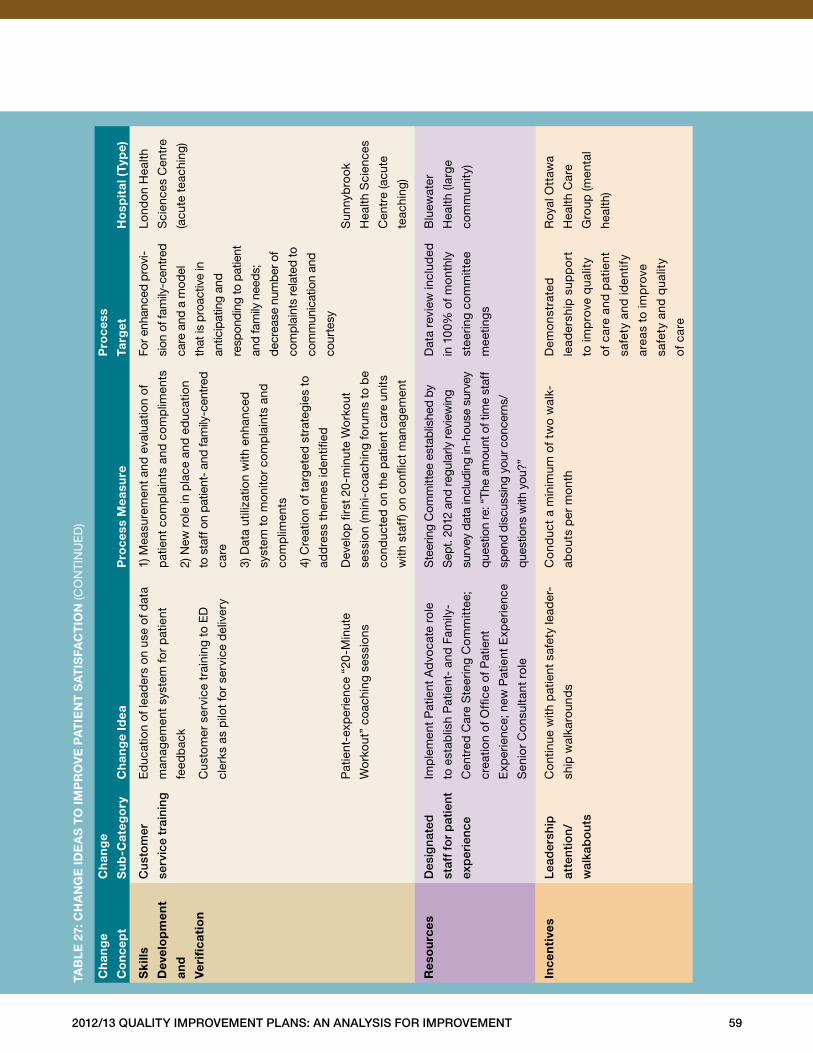
2012/13 Quality improvement plans: an analysis for improvement 59
ch
ang
e
co
nce
pt
ch
ang
e
su
b-c
ateg
ory
ch
ang
e id
ea
pro
cess
mea
sure
pro
cess
targ
et
ho
spit
al (
typ
e)
sk
ills
dev
elo
pm
ent
and
ver
ifica
tio
n
Cu
sto
mer
serv
ice
trai
ning
Ed
ucat
ion
of le
ader
s on
use
of d
ata
man
agem
ent
syst
em fo
r p
atie
nt
feed
bac
k
Cus
tom
er s
ervi
ce t
rain
ing
to E
D
cler
ks a
s p
ilot
for
serv
ice
del
iver
y
Pat
ient
-exp
erie
nce
“20
-Min
ute
Wo
rkou
t” c
oach
ing
sess
ions
1) M
easu
rem
ent
and
eva
luat
ion
of
pat
ient
com
pla
ints
and
com
plim
ents
2) N
ew r
ole
in p
lace
and
ed
ucat
ion
to s
taff
on
patie
nt-
and
fam
ily-c
entr
ed
care
3) D
ata
utili
zatio
n w
ith e
nhan
ced
syst
em t
o m
onito
r co
mp
lain
ts a
nd
com
plim
ents
4) C
reat
ion
of t
arge
ted
str
ateg
ies
to
add
ress
the
mes
iden
tified
Dev
elop
firs
t 20
-min
ute
Wo
rkou
t
sess
ion
(min
i-co
achi
ng fo
rum
s to
be
cond
ucte
d o
n th
e p
atie
nt c
are
units
with
sta
ff) o
n co
nflic
t m
anag
emen
t
For e
nhan
ced
pro
vi-
sion
of f
amily
-cen
tred
care
and
a m
odel
that
is p
roac
tive
in
antic
ipat
ing
and
resp
ondi
ng to
pat
ient
and
fam
ily n
eed
s;
decr
ease
num
ber
of
com
plai
nts
rela
ted
to
com
mun
icat
ion
and
cour
tesy
Lond
on
Hea
lth
Sci
ence
s C
entr
e
(acu
te t
each
ing)
Sun
nyb
rook
Hea
lth S
cien
ces
Cen
tre
(acu
te
teac
hing
)
res
ou
rces
Des
igna
ted
staf
f fo
r p
atie
nt
exp
erie
nce
Imp
lem
ent
Pat
ient
Ad
voca
te r
ole
to e
stab
lish
Pat
ient
- an
d F
amily
-
Cen
tred
Car
e S
teer
ing
Com
mitt
ee;
crea
tion
of O
ffice
of P
atie
nt
Exp
erie
nce;
new
Pat
ient
Exp
erie
nce
Sen
ior
Con
sulta
nt r
ole
Ste
erin
g C
omm
ittee
est
ablis
hed
by
Sep
t . 20
12 a
nd re
gula
rly re
view
ing
surv
ey d
ata
incl
udin
g in
-hou
se s
urve
y
ques
tion
re: “
The
amou
nt o
f tim
e st
aff
spen
d di
scus
sing
you
r con
cern
s/
ques
tions
with
you
?”
Dat
a re
view
incl
uded
in 1
00%
of m
ont
hly
stee
ring
com
mitt
ee
mee
ting
s
Blu
ewat
er
Hea
lth (l
arg
e
com
mun
ity)
ince
nti
ves
lead
ersh
ip
atte
ntio
n/
wal
kab
ou
ts
Con
tinue
with
pat
ient
saf
ety
lead
er-
ship
wal
karo
und
s
Co
nduc
t a
min
imum
of
two
wal
k-
abo
uts
per
mon
th
Dem
ons
trat
ed
lead
ersh
ip s
upp
ort
to im
pro
ve q
ualit
y
of
care
and
pat
ient
safe
ty a
nd id
entif
y
area
s to
imp
rove
safe
ty a
nd q
ualit
y
of
care
Roy
al O
ttaw
a
Hea
lth C
are
Gro
up (m
enta
l
heal
th)
taB
le
27:
ch
an
ge
ide
as
to
imp
ro
ve
pa
tie
nt
sa
tis
fac
tio
n (C
ON
TIN
UE
D)
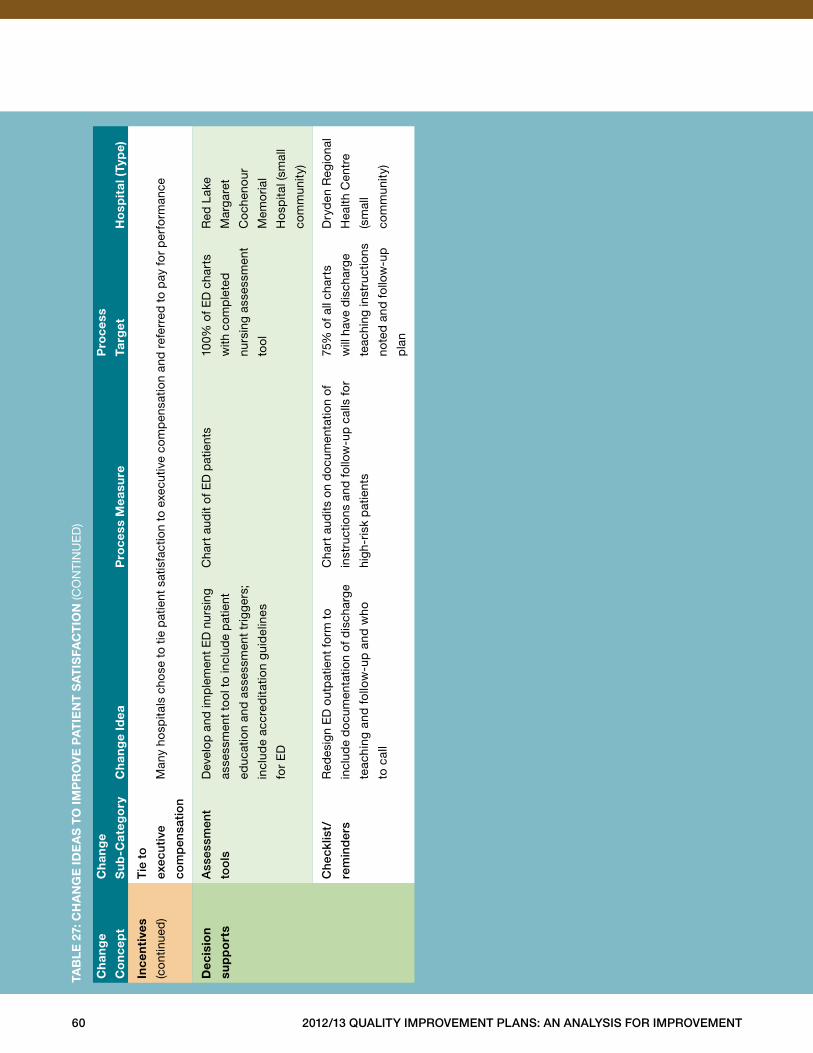
60 2012/13 Quality improvement plans: an analysis for improvement
ch
ang
e
co
nce
pt
ch
ang
e
su
b-c
ateg
ory
ch
ang
e id
ea
pro
cess
mea
sure
pro
cess
targ
et
ho
spit
al (
typ
e)
ince
nti
ves
(con
tinue
d)
tie
to
exec
uti
ve
com
pen
sati
on
Man
y ho
spita
ls c
hose
to
tie p
atie
nt s
atis
fact
ion
to e
xecu
tive
com
pen
satio
n an
d r
efer
red
to
pay
for
per
form
ance
dec
isio
n
sup
po
rts
ass
essm
ent
too
ls
Dev
elop
and
imp
lem
ent
ED
nur
sing
asse
ssm
ent
tool
to
incl
ude
pat
ient
educ
atio
n an
d a
sses
smen
t tr
igge
rs;
incl
ude
accr
edita
tion
gui
del
ines
for
ED
Cha
rt a
udit
of E
D p
atie
nts
100%
of E
D c
hart
s
with
co
mp
lete
d
nurs
ing
asse
ssm
ent
tool
Red
Lak
e
Mar
gar
et
Co
chen
our
Mem
oria
l
Ho
spita
l (sm
all
com
mun
ity)
Che
cklis
t/
rem
ind
ers
Red
esig
n E
D o
utp
atie
nt fo
rm t
o
incl
ude
do
cum
enta
tion
of d
isch
arge
teac
hing
and
fo
llow
-up
and
who
to c
all
Cha
rt a
udits
on
do
cum
enta
tion
of
inst
ruct
ions
and
follo
w-u
p c
alls
for
high
-ris
k p
atie
nts
75%
of a
ll ch
arts
will
hav
e d
isch
arg
e
teac
hing
inst
ruct
ions
note
d a
nd fo
llow
-up
pla
n
Dry
den
Reg
iona
l
Hea
lth C
entr
e
(sm
all
com
mun
ity)
taB
le
27:
ch
an
ge
ide
as
to
imp
ro
ve
pa
tie
nt
sa
tis
fac
tio
n (C
ON
TIN
UE
D)
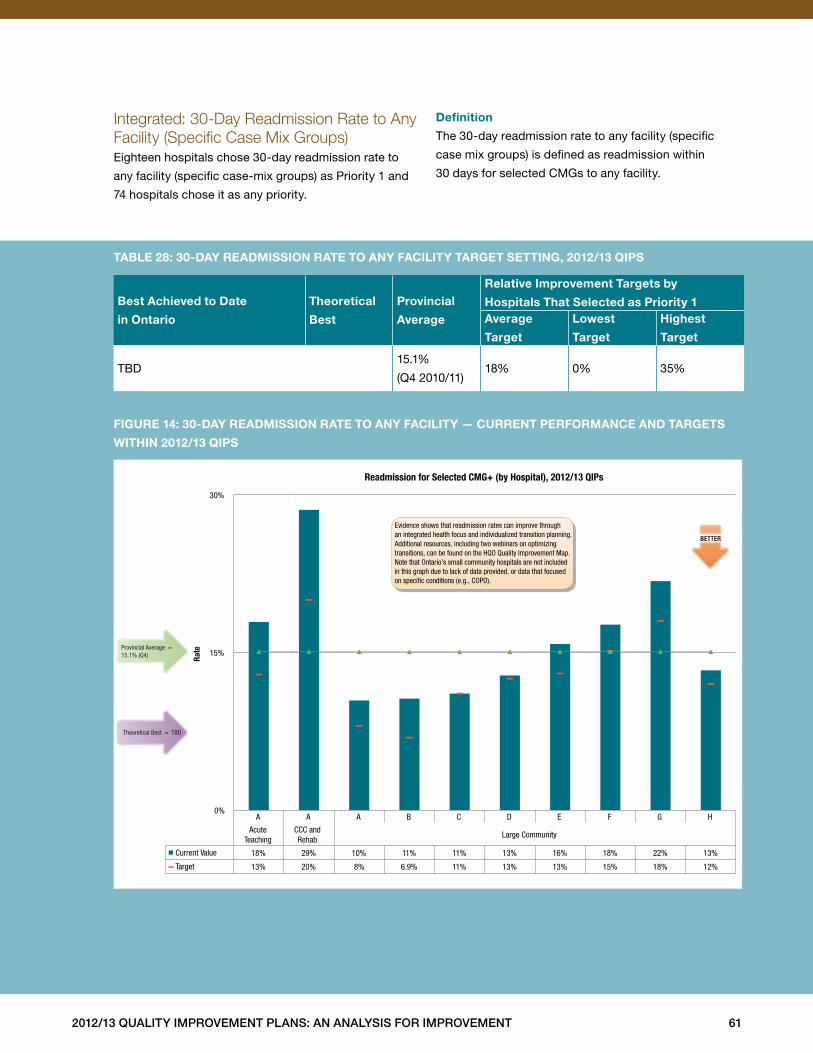
2012/13 Quality improvement plans: an analysis for improvement 61
Integrated: 30-Day Readmission Rate to Any Facility (Specific Case Mix Groups)Eighteen hospitals chose 30-day readmission rate to
any facility (specific case-mix groups) as Priority 1 and
74 hospitals chose it as any priority .
definition
The 30-day readmission rate to any facility (specific
case mix groups) is defined as readmission within
30 days for selected CMGs to any facility .
Best achieved to date
in ontario
theoretical
Best
provincial
average
relative improvement targets by
hospitals that selected as priority 1average
target
lowest
target
highest
target
TBD15 .1%
(Q4 2010/11)18% 0% 35%
taBle 28: 30-day readmission rate to any facility target setting, 2012/13 Qips
figure 14: 30-day readmission rate to any facility — current performance and targets
Within 2012/13 Qips
A A A B C D E F G H
Acute Teaching
CCC and Rehab
Large Community
Current Value 18% 29% 10% 11% 11% 13% 16% 18% 22% 13%
Target 13% 20% 8% 6.9% 11% 13% 13% 15% 18% 12%
0%
15%
30%
Rate
Readmission for Selected CMG+ (by Hospital), 2012/13 QIPs
Provincial Average = 15.1% (Q4)
Theoretical Best = TBD
BETTER
Evidence shows that readmission rates can improve through an integrated health focus and individualized transition planning. Additional resources, including two webinars on optimizing transitions, can be found on the HQO Quality Improvement Map. Note that Ontario’s small community hospitals are not included in this graph due to lack of data provided, or data that focused on speci�c conditions (e.g., COPD).
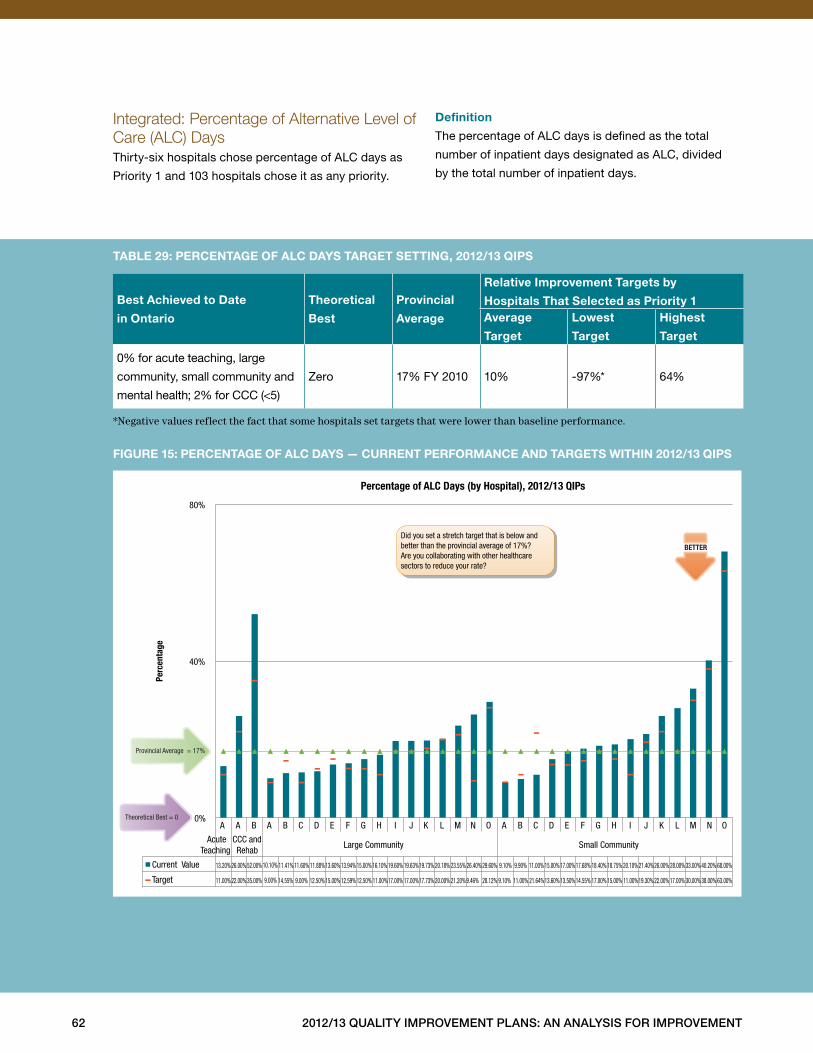
62 2012/13 Quality improvement plans: an analysis for improvement
Integrated: Percentage of Alternative Level of Care (ALC) DaysThirty-six hospitals chose percentage of ALC days as
Priority 1 and 103 hospitals chose it as any priority .
definition
The percentage of ALC days is defined as the total
number of inpatient days designated as ALC, divided
by the total number of inpatient days .
Best achieved to date
in ontario
theoretical
Best
provincial
average
relative improvement targets by
hospitals that selected as priority 1average
target
lowest
target
highest
target
0% for acute teaching, large
community, small community and
mental health; 2% for CCC (<5)
Zero 17% FY 2010 10% -97%* 64%
*Negative values reflect the fact that some hospitals set targets that were lower than baseline performance.
taBle 29: percentage of alc days target setting, 2012/13 Qips
figure 15: percentage of alc days — current performance and targets Within 2012/13 Qips
A A B A B C D E F G H I J K L M N O A B C D E F G H I J K L M N O
Acute Teaching
CCC and Rehab
Large Community Small Community
Current Value 13.20%26.00% 52.00% 10.10% 11.41% 11.60% 11.88%13.60% 13.94% 15.00% 16.10% 19.60% 19.63%19.73% 20.18% 23.55% 26.40% 29.60% 9.10% 9.90% 11.00% 15.00% 17.00%17.68% 18.40% 18.75% 20.10% 21.40%26.00% 28.00% 33.00% 40.20% 68.00%
Target 11.00%22.00% 35.00% 9.00% 14.55% 9.00% 12.50% 15.00% 12.59% 12.50% 11.00%17.00% 17.00%17.73% 20.00% 21.20%9.46% 28.12% 9.10% 11.00% 21.64%13.60% 13.50%14.55% 17.00% 15.00% 11.00%19.30% 22.00% 17.00% 30.00% 38.00% 63.00%
0%
40%
80%
Perc
enta
ge
Percentage of ALC Days (by Hospital), 2012/13 QIPs
Provincial Average = 17%
Theoretical Best = 0
BETTER
Did you set a stretch target that is below and better than the provincial average of 17%? Are you collaborating with other healthcare sectors to reduce your rate?
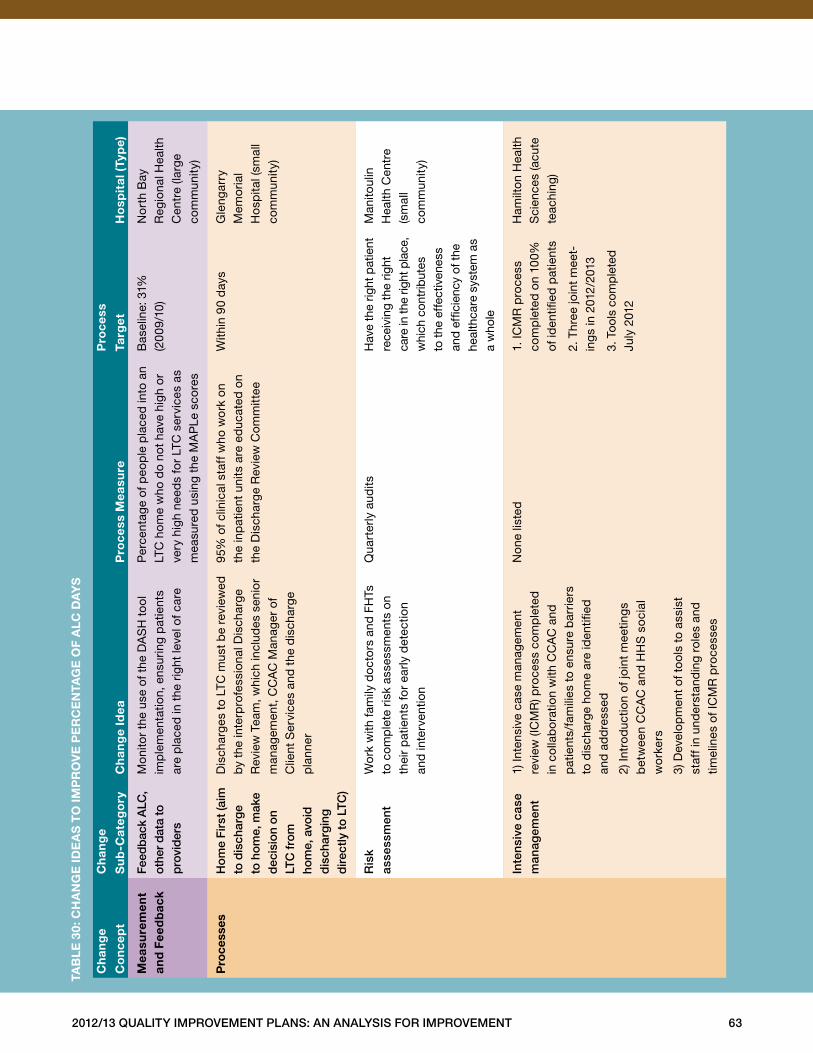
2012/13 Quality improvement plans: an analysis for improvement 63
ch
ang
e
co
nce
pt
ch
ang
e
su
b-c
ateg
ory
ch
ang
e id
ea
pro
cess
mea
sure
pro
cess
targ
et
ho
spit
al (
typ
e)
mea
sure
men
t an
d f
eed
bac
kfe
edb
ack
alC
, ot
her
dat
a to
p
rovi
der
s
Mon
itor
the
use
of t
he D
AS
H t
ool
im
ple
men
tatio
n, e
nsur
ing
pat
ient
s ar
e p
lace
d in
the
rig
ht le
vel o
f car
e
Per
cent
age
of p
eop
le p
lace
d in
to a
n LT
C h
ome
who
do
not
have
hig
h o
r ve
ry h
igh
need
s fo
r LT
C s
ervi
ces
as
mea
sure
d u
sing
the
MA
PLe
sco
res
Bas
elin
e: 3
1%
(20
09/1
0)N
ort
h B
ay
Reg
iona
l Hea
lth
Cen
tre
(larg
e co
mm
unity
)
pro
cess
esH
om
e f
irst
(aim
to
dis
char
ge
to h
om
e, m
ake
dec
isio
n o
n lt
C fr
om
ho
me,
avo
id
dis
char
gin
g
dir
ectly
to
ltC
)
Dis
char
ges
to L
TC m
ust
be
revi
ewed
b
y th
e in
terp
rofe
ssio
nal D
isch
arge
R
evie
w T
eam
, whi
ch in
clud
es s
enio
r m
anag
emen
t, C
CA
C M
anag
er o
f C
lient
Ser
vice
s an
d t
he d
isch
arge
p
lann
er
95%
of c
linic
al s
taff
who
wo
rk o
n th
e in
pat
ient
uni
ts a
re e
duc
ated
on
the
Dis
char
ge R
evie
w C
omm
ittee
With
in 9
0 d
ays
Gle
ngar
ry
Mem
oria
l H
osp
ital (
smal
l co
mm
unity
)
ris
k
asse
ssm
ent
Wo
rk w
ith fa
mily
do
cto
rs a
nd F
HTs
to
com
ple
te r
isk
asse
ssm
ents
on
th
eir
pat
ient
s fo
r ea
rly d
etec
tion
an
d in
terv
entio
n
Qua
rter
ly a
udits
Hav
e th
e rig
ht p
atie
nt
rece
ivin
g th
e rig
ht
care
in th
e rig
ht p
lace
, w
hich
con
trib
utes
to
the
effe
ctiv
enes
s an
d ef
ficie
ncy
of th
e he
alth
care
sys
tem
as
a w
hole
Man
itoul
in
Hea
lth C
entr
e (s
mal
l co
mm
unity
)
inte
nsiv
e ca
se
man
agem
ent
1) In
tens
ive
case
man
agem
ent
re
view
(IC
MR
) pro
cess
com
ple
ted
in
col
lab
ora
tion
with
CC
AC
and
p
atie
nts/
fam
ilies
to
ensu
re b
arrie
rs
to d
isch
arge
hom
e ar
e id
entifi
ed
and
ad
dre
ssed
2) In
tro
duc
tion
of jo
int
mee
ting
s
bet
wee
n C
CA
C a
nd H
HS
so
cial
w
ork
ers
3) D
evel
opm
ent
of t
ool
s to
ass
ist
staf
f in
und
erst
and
ing
role
s an
d
timel
ines
of I
CM
R p
roce
sses
Non
e lis
ted
1 . IC
MR
pro
cess
co
mp
lete
d o
n 10
0%
of id
entifi
ed p
atie
nts
2 . T
hree
join
t m
eet-
ing
s in
201
2/20
13
3 . T
ools
com
ple
ted
Ju
ly 2
012
Ham
ilto
n H
ealth
S
cien
ces
(acu
te
teac
hing
)
taB
le
30:
ch
an
ge
ide
as
to
imp
ro
ve
pe
rc
en
tag
e o
f a
lc d
ay
s
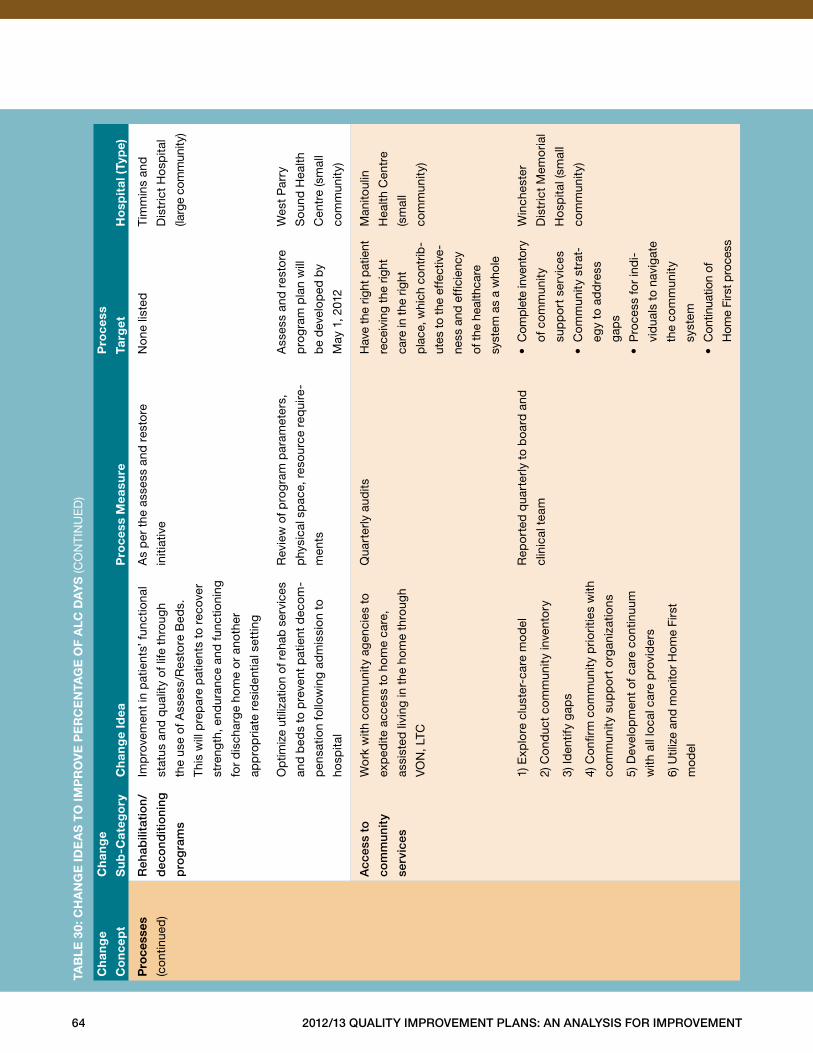
64 2012/13 Quality improvement plans: an analysis for improvement
ch
ang
e
co
nce
pt
ch
ang
e
su
b-c
ateg
ory
ch
ang
e id
ea
pro
cess
mea
sure
pro
cess
targ
et
ho
spit
al (
typ
e)
pro
cess
es
(con
tinue
d)
reh
abili
tati
on
/
dec
ond
itio
ning
pro
gra
ms
Imp
rove
men
t in
pat
ient
s’ f
unct
iona
l
stat
us a
nd q
ualit
y of
life
thr
ough
the
use
of A
sses
s/R
esto
re B
eds .
Thi
s w
ill p
rep
are
pat
ient
s to
rec
over
stre
ngth
, end
uran
ce a
nd fu
nctio
ning
for
dis
char
ge h
ome
or
anot
her
app
rop
riate
res
iden
tial s
ettin
g
As
per
the
ass
ess
and
res
tore
initi
ativ
e
No
ne li
sted
Tim
min
s an
d
Dis
tric
t H
osp
ital
(larg
e co
mm
unity
)
Op
timiz
e ut
iliza
tion
of r
ehab
ser
vice
s
and
bed
s to
pre
vent
pat
ient
dec
om-
pen
satio
n fo
llow
ing
adm
issi
on t
o
hosp
ital
Rev
iew
of p
rog
ram
par
amet
ers,
phy
sica
l sp
ace,
res
ourc
e re
qui
re-
men
ts
Ass
ess
and
res
tore
pro
gra
m p
lan
will
be
dev
elop
ed b
y
May
1, 2
012
Wes
t P
arry
Sou
nd H
ealth
Cen
tre
(sm
all
com
mun
ity)
acc
ess
to
com
mun
ity
serv
ices
Wo
rk w
ith c
omm
unity
age
ncie
s to
exp
edite
acc
ess
to h
ome
care
,
assi
sted
livi
ng in
the
hom
e th
roug
h
VO
N, L
TC
Qua
rter
ly a
udits
Hav
e th
e rig
ht p
atie
nt
rece
ivin
g th
e rig
ht
care
in th
e rig
ht
pla
ce, w
hich
con
trib
-
utes
to th
e ef
fect
ive-
ness
and
effi
cien
cy
of th
e he
alth
care
syst
em a
s a
who
le
Man
itoul
in
Hea
lth C
entr
e
(sm
all
com
mun
ity)
1) E
xplo
re c
lust
er-c
are
mo
del
2) C
ond
uct
com
mun
ity in
vent
ory
3) Id
entif
y ga
ps
4) C
onfir
m c
omm
unity
prio
ritie
s w
ith
com
mun
ity s
upp
ort
org
aniz
atio
ns
5) D
evel
opm
ent
of c
are
cont
inuu
m
with
all
loca
l car
e p
rovi
der
s
6) U
tiliz
e an
d m
onito
r H
ome
Firs
t
mod
el
Rep
ort
ed q
uart
erly
to
boa
rd a
nd
clin
ical
tea
m
•C
ompl
ete
inve
ntor
y
of c
om
mun
ity
sup
po
rt s
ervi
ces
•C
om
mun
ity s
trat
-
egy
to a
dd
ress
gap
s
•P
roce
ss fo
r in
di-
vid
uals
to
navi
gat
e
the
com
mun
ity
syst
em
•C
ontin
uatio
n of
Hom
e Fi
rst p
roce
ss
Win
ches
ter
Dis
tric
t M
emo
rial
Ho
spita
l (sm
all
com
mun
ity)
taB
le
30:
ch
an
ge
ide
as
to
imp
ro
ve
pe
rc
en
tag
e o
f a
lc d
ay
s (C
ON
TIN
UE
D)
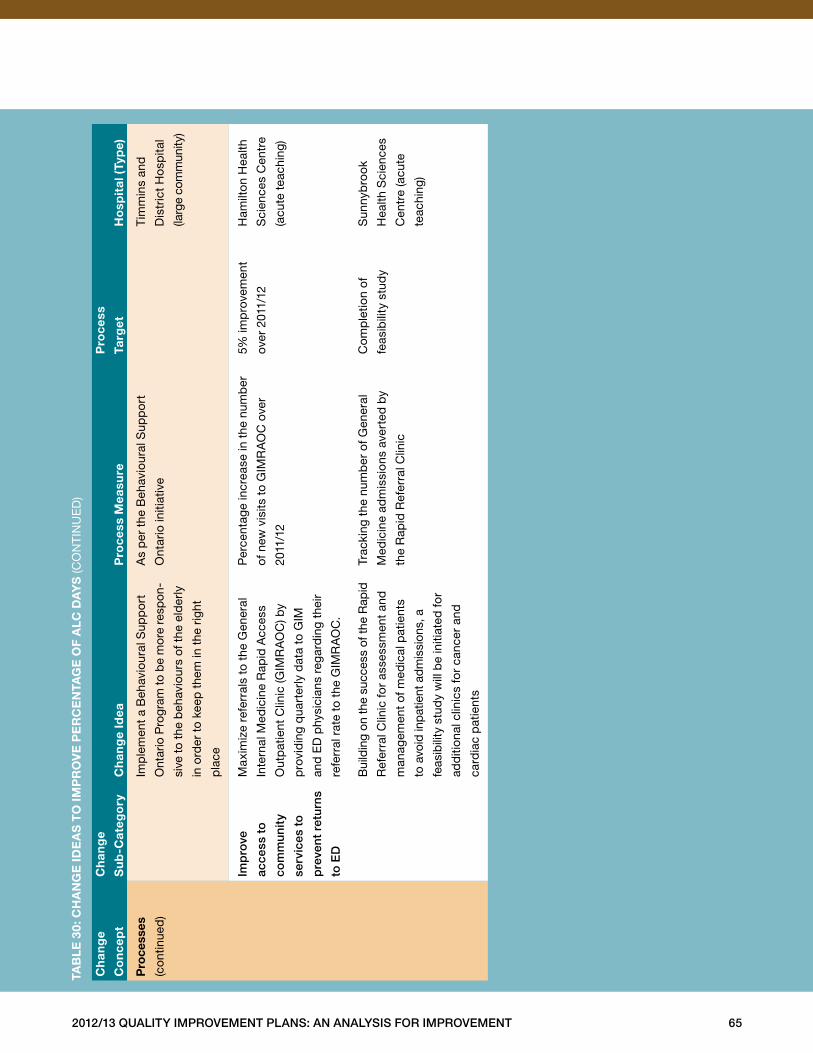
2012/13 Quality improvement plans: an analysis for improvement 65
ch
ang
e
co
nce
pt
ch
ang
e
su
b-c
ateg
ory
ch
ang
e id
ea
pro
cess
mea
sure
pro
cess
targ
et
ho
spit
al (
typ
e)
pro
cess
es
(con
tinue
d)
Imp
lem
ent
a B
ehav
iour
al S
upp
ort
Ont
ario
Pro
gram
to b
e m
ore
resp
on-
sive
to t
he b
ehav
iour
s of
the
eld
erly
in o
rder
to
keep
the
m in
the
rig
ht
pla
ce
As
per
the
Beh
avio
ural
Sup
po
rt
Ont
ario
initi
ativ
e
Tim
min
s an
d
Dis
tric
t H
osp
ital
(larg
e co
mm
unity
)
imp
rove
acce
ss t
o
com
mun
ity
serv
ices
to
pre
vent
ret
urns
to e
D
Max
imiz
e re
ferr
als
to t
he G
ener
al
Inte
rnal
Med
icin
e R
apid
Acc
ess
Out
pat
ient
Clin
ic (G
IMR
AO
C) b
y
pro
vid
ing
qua
rter
ly d
ata
to G
IM
and
ED
phy
sici
ans
rega
rdin
g th
eir
refe
rral
rat
e to
the
GIM
RA
OC
.
Per
cent
age
incr
ease
in t
he n
umb
er
of n
ew v
isits
to
GIM
RA
OC
ove
r
2011
/12
5% im
pro
vem
ent
over
201
1/12
Ham
ilto
n H
ealth
Sci
ence
s C
entr
e
(acu
te t
each
ing)
Bui
ldin
g on
the
succ
ess
of th
e R
apid
Ref
erra
l Clin
ic fo
r as
sess
men
t an
d
man
agem
ent
of m
edic
al p
atie
nts
to a
void
inp
atie
nt a
dm
issi
ons,
a
feas
ibili
ty s
tud
y w
ill b
e in
itiat
ed fo
r
add
ition
al c
linic
s fo
r ca
ncer
and
card
iac
pat
ient
s
Trac
king
the
num
ber
of G
ener
al
Med
icin
e ad
mis
sion
s av
erte
d b
y
the
Rap
id R
efer
ral C
linic
Com
ple
tion
of
feas
ibili
ty s
tud
y
Sun
nyb
rook
Hea
lth S
cien
ces
Cen
tre
(acu
te
teac
hing
)
taB
le
30:
ch
an
ge
ide
as
to
imp
ro
ve
pe
rc
en
tag
e o
f a
lc d
ay
s (C
ON
TIN
UE
D)
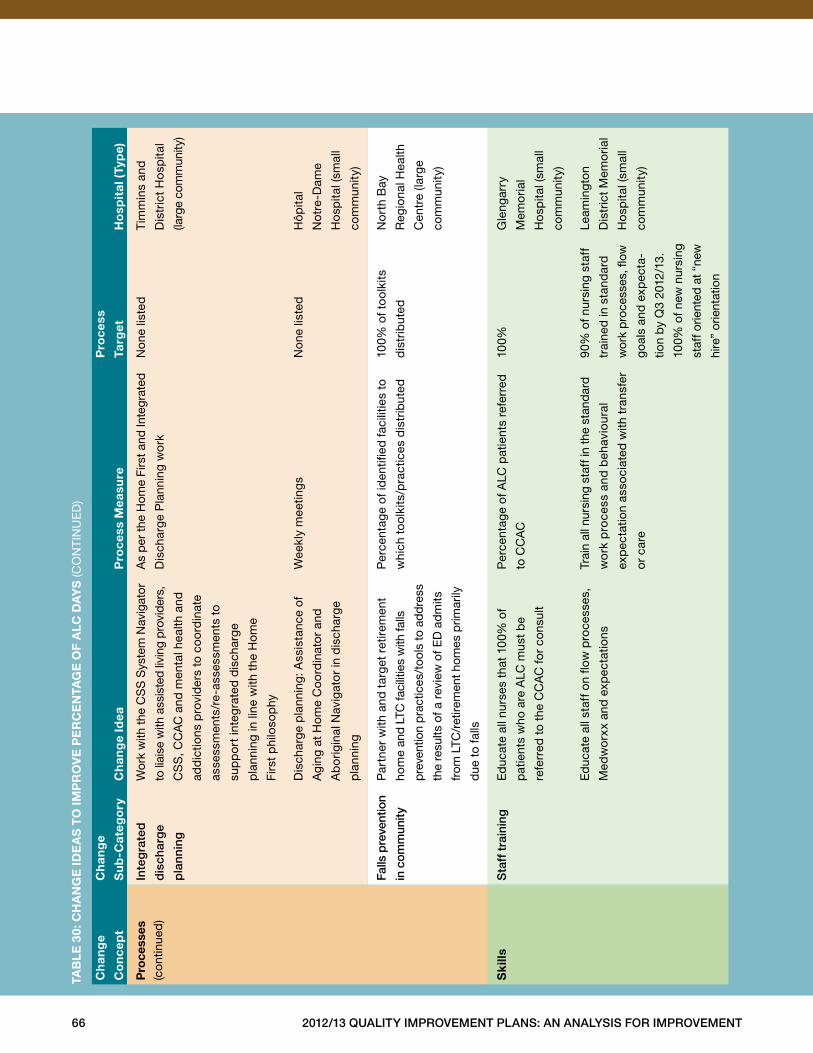
66 2012/13 Quality improvement plans: an analysis for improvement
ch
ang
e
co
nce
pt
ch
ang
e
su
b-c
ateg
ory
ch
ang
e id
ea
pro
cess
mea
sure
pro
cess
targ
et
ho
spit
al (
typ
e)
pro
cess
es
(con
tinue
d)
inte
gra
ted
dis
char
ge
pla
nnin
g
Wor
k w
ith th
e C
SS
Sys
tem
Nav
igat
or
to li
aise
with
ass
iste
d liv
ing
pro
vide
rs,
CS
S, C
CA
C a
nd m
enta
l hea
lth a
nd
add
ictio
ns p
rovi
der
s to
co
ord
inat
e
asse
ssm
ents
/re-
asse
ssm
ents
to
sup
po
rt in
teg
rate
d d
isch
arge
pla
nnin
g in
line
with
the
Hom
e
Firs
t p
hilo
sop
hy
As
per
the
Hom
e Fi
rst a
nd In
tegr
ated
Dis
char
ge P
lann
ing
wo
rk
Non
e lis
ted
Tim
min
s an
d
Dis
tric
t H
osp
ital
(larg
e co
mm
unity
)
Dis
char
ge p
lann
ing:
Ass
ista
nce
of
Agi
ng a
t H
ome
Co
ord
inat
or
and
Ab
orig
inal
Nav
igat
or
in d
isch
arge
pla
nnin
g
Wee
kly
mee
ting
sN
one
liste
dH
ôpita
l
Not
re-D
ame
Ho
spita
l (sm
all
com
mun
ity)
falls
pre
vent
ion
in c
omm
unity
Par
tner
with
and
tar
get
retir
emen
t
hom
e an
d LT
C fa
cilit
ies
with
falls
pre
vent
ion
pra
ctic
es/t
ools
to a
dd
ress
the
resu
lts o
f a r
evie
w o
f ED
ad
mits
from
LTC
/ret
irem
ent h
omes
prim
arily
due
to
falls
Per
cent
age
of id
entifi
ed fa
cilit
ies
to
whi
ch t
ool
kits
/pra
ctic
es d
istr
ibut
ed
100%
of t
ool
kits
dis
trib
uted
No
rth
Bay
Reg
iona
l Hea
lth
Cen
tre
(larg
e
com
mun
ity)
sk
ills
sta
ff t
rain
ing
Ed
ucat
e al
l nur
ses
that
100
% o
f
pat
ient
s w
ho a
re A
LC m
ust
be
refe
rred
to
the
CC
AC
for
cons
ult
Per
cent
age
of A
LC p
atie
nts
refe
rred
to C
CA
C
100%
Gle
ngar
ry
Mem
oria
l
Ho
spita
l (sm
all
com
mun
ity)
E
duc
ate
all s
taff
on
flow
pro
cess
es,
Med
wo
rxx
and
exp
ecta
tions
Trai
n al
l nur
sing
sta
ff in
the
stan
dar
d
wo
rk p
roce
ss a
nd b
ehav
iour
al
exp
ecta
tion
asso
ciat
ed w
ith t
rans
fer
or
care
90%
of n
ursi
ng s
taff
trai
ned
in s
tand
ard
wor
k p
roce
sses
, flow
goal
s an
d e
xpec
ta-
tion
by
Q3
2012
/13 .
100%
of n
ew n
ursi
ng
staf
f orie
nted
at “
new
hire
” or
ient
atio
n
Leam
ing
ton
Dis
tric
t M
emo
rial
Ho
spita
l (sm
all
com
mun
ity)
taB
le
30:
ch
an
ge
ide
as
to
imp
ro
ve
pe
rc
en
tag
e o
f a
lc d
ay
s (C
ON
TIN
UE
D)
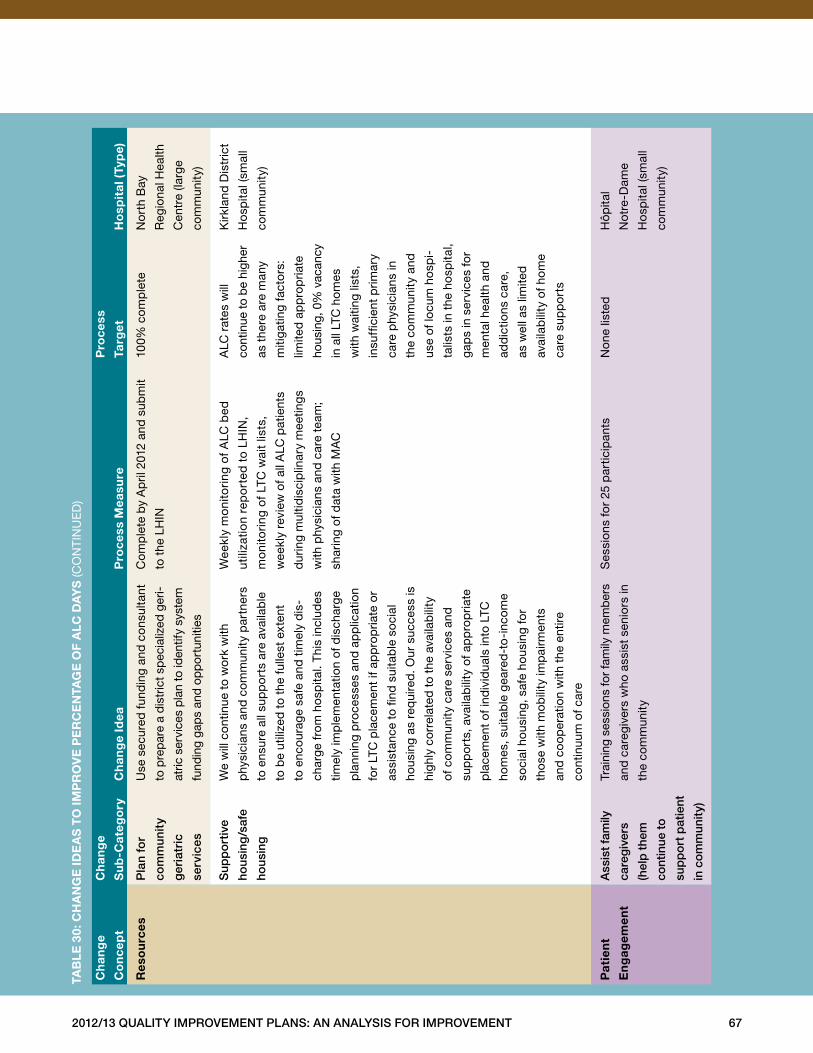
2012/13 Quality improvement plans: an analysis for improvement 67
ch
ang
e
co
nce
pt
ch
ang
e
su
b-c
ateg
ory
ch
ang
e id
ea
pro
cess
mea
sure
pro
cess
targ
et
ho
spit
al (
typ
e)
res
ou
rces
pla
n fo
r
com
mun
ity
ger
iatr
ic
serv
ices
Use
sec
ured
fun
din
g an
d c
onsu
ltant
to p
rep
are
a d
istr
ict s
pec
ializ
ed g
eri-
atric
ser
vice
s p
lan
to id
entif
y sy
stem
fund
ing
gap
s an
d op
por
tuni
ties
Com
ple
te b
y A
pril
201
2 an
d s
ubm
it
to t
he L
HIN
100%
com
ple
teN
ort
h B
ay
Reg
iona
l Hea
lth
Cen
tre
(larg
e
com
mun
ity)
sup
po
rtiv
e
hous
ing
/saf
e
hous
ing
We
will
con
tinue
to
wo
rk w
ith
phy
sici
ans
and
com
mun
ity p
artn
ers
to e
nsur
e al
l sup
po
rts
are
avai
lab
le
to b
e ut
ilize
d t
o th
e fu
llest
ext
ent
to e
ncou
rage
saf
e an
d t
imel
y d
is-
char
ge f
rom
ho
spita
l . T
his
incl
udes
timel
y im
ple
men
tatio
n of
dis
char
ge
pla
nnin
g p
roce
sses
and
ap
plic
atio
n
for
LTC
pla
cem
ent
if ap
pro
pria
te o
r
assi
stan
ce t
o fin
d s
uita
ble
so
cial
hous
ing
as r
equi
red
. Our
suc
cess
is
high
ly c
orr
elat
ed t
o th
e av
aila
bili
ty
of c
omm
unity
car
e se
rvic
es a
nd
sup
po
rts,
ava
ilab
ility
of a
pp
rop
riate
pla
cem
ent
of in
div
idua
ls in
to L
TC
hom
es, s
uita
ble
gea
red
-to
-inc
ome
soci
al h
ousi
ng, s
afe
hous
ing
for
tho
se w
ith m
obili
ty im
pai
rmen
ts
and
co
oper
atio
n w
ith t
he e
ntire
cont
inuu
m o
f car
e
Wee
kly
mo
nito
ring
of
ALC
bed
utili
zatio
n re
po
rted
to
LH
IN,
mo
nito
ring
of
LTC
wai
t lis
ts,
wee
kly
revi
ew o
f all
ALC
pat
ient
s
dur
ing
mul
tidis
cip
linar
y m
eetin
gs
with
phy
sici
ans
and
car
e te
am;
shar
ing
of d
ata
with
MA
C
ALC
rat
es w
ill
cont
inue
to b
e hi
gher
as t
here
are
man
y
miti
gatin
g fa
cto
rs:
limite
d a
pp
rop
riate
hous
ing,
0%
vac
ancy
in a
ll LT
C h
om
es
with
wai
ting
lists
,
insu
ffici
ent
prim
ary
care
phy
sici
ans
in
the
com
mun
ity a
nd
use
of lo
cum
ho
spi-
talis
ts in
the
ho
spita
l,
gap
s in
ser
vice
s fo
r
men
tal h
ealth
and
add
ictio
ns c
are,
as w
ell a
s lim
ited
avai
lab
ility
of h
om
e
care
sup
po
rts
Kirk
land
Dis
tric
t
Ho
spita
l (sm
all
com
mun
ity)
pat
ien
t
en
gag
emen
t
ass
ist
fam
ily
care
giv
ers
(hel
p t
hem
cont
inue
to
sup
po
rt p
atie
nt
in c
om
mun
ity)
Trai
ning
ses
sion
s fo
r fa
mily
mem
ber
s
and
car
egiv
ers
who
ass
ist
seni
ors
in
the
com
mun
ity
Ses
sion
s fo
r 25
par
ticip
ants
Non
e lis
ted
Hôp
ital
Not
re-D
ame
Ho
spita
l (sm
all
com
mun
ity)
taB
le
30:
ch
an
ge
ide
as
to
imp
ro
ve
pe
rc
en
tag
e o
f a
lc d
ay
s (C
ON
TIN
UE
D)
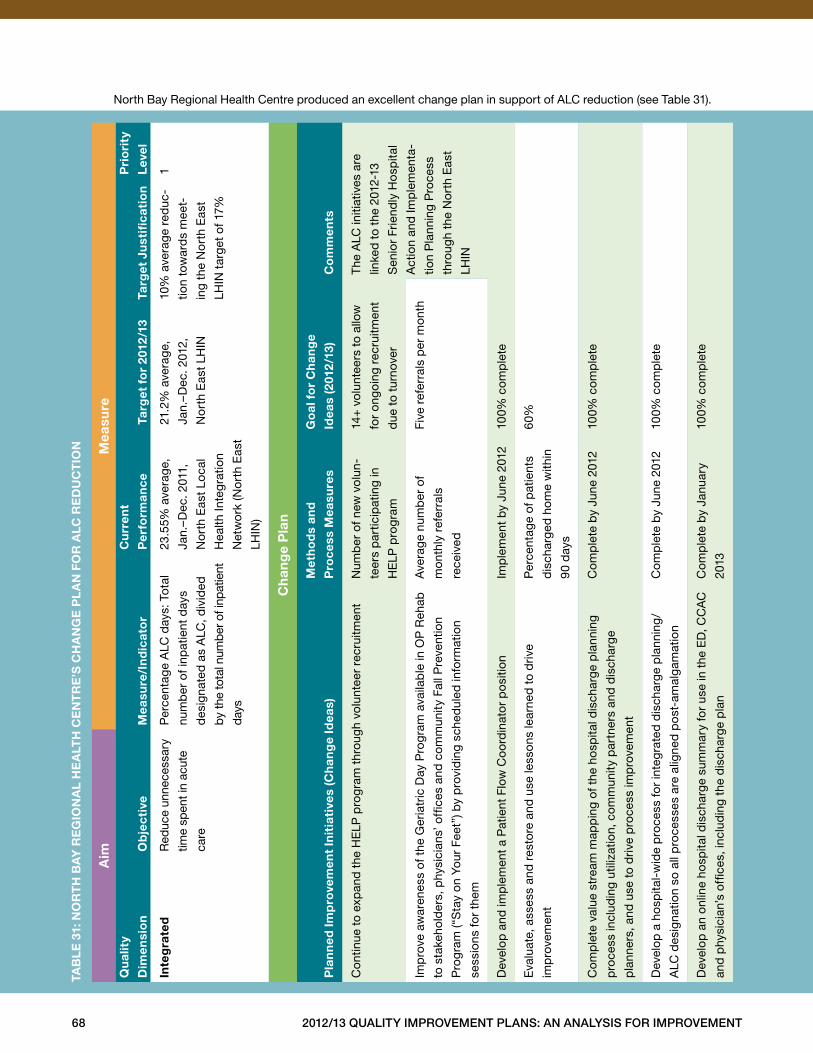
68 2012/13 Quality improvement plans: an analysis for improvement
North Bay Regional Health Centre produced an excellent change plan in support of ALC reduction (see Table 31) .a
imm
easu
reQ
ual
ity
dim
ensi
on
ob
jec
tive
mea
sure
/in
dic
ato
r
cu
rren
t
per
form
ance
targ
et f
or
2012
/13
targ
et J
ust
ifica
tio
n
pri
ori
ty
lev
el
inte
gra
ted
Red
uce
unne
cess
ary
time
spen
t in
acut
e
care
Per
cent
age
ALC
day
s: T
otal
num
ber
of i
npat
ient
day
s
des
igna
ted
as
ALC
, div
ided
by
the
tota
l num
ber
of i
npat
ient
days
23 .5
5% a
vera
ge,
Jan .
–Dec
. 201
1,
No
rth
Eas
t Lo
cal
Hea
lth In
teg
ratio
n
Net
wo
rk (N
ort
h E
ast
LHIN
)
21 .2
% a
vera
ge,
Jan .
–Dec
. 201
2,
No
rth
Eas
t LH
IN
10%
ave
rag
e re
duc
-
tion
tow
ard
s m
eet-
ing
the
No
rth
Eas
t
LHIN
tar
get
of 1
7%
1
ch
ang
e p
lan
pla
nn
ed im
pro
vem
ent
init
iati
ves
(ch
ang
e id
eas)
met
ho
ds
and
pro
cess
mea
sure
s
go
al f
or
ch
ang
e
idea
s (2
012
/13)
co
mm
ents
Con
tinue
to
exp
and
the
HE
LP p
rog
ram
thr
ough
vol
unte
er r
ecru
itmen
tN
umb
er o
f new
vol
un-
teer
s p
artic
ipat
ing
in
HE
LP p
rog
ram
14+
vol
unte
ers
to a
llow
for
ongo
ing
recr
uitm
ent
due
to
turn
over
The
ALC
initi
ativ
es a
re
linke
d t
o th
e 20
12‐1
3
Sen
ior
Frie
ndly
Ho
spita
l
Act
ion
and
Imp
lem
enta
-
tion
Pla
nnin
g P
roce
ss
thro
ugh
the
No
rth
Eas
t
LHIN
Imp
rove
aw
aren
ess
of t
he G
eria
tric
Day
Pro
gra
m a
vaila
ble
in O
P R
ehab
to s
take
hold
ers,
phy
sici
ans’
offi
ces
and
com
mun
ity F
all P
reve
ntio
n
Pro
gra
m (“
Sta
y on
You
r Fe
et”)
by
pro
vid
ing
sche
dul
ed in
form
atio
n
sess
ions
for
them
Ave
rage
num
ber
of
mon
thly
ref
erra
ls
rece
ived
Five
ref
erra
ls p
er m
ont
h
Dev
elop
and
imp
lem
ent
a P
atie
nt F
low
Co
ord
inat
or
po
sitio
nIm
ple
men
t b
y Ju
ne 2
012
100%
com
ple
te
Eva
luat
e, a
sses
s an
d r
esto
re a
nd u
se le
sson
s le
arne
d t
o d
rive
imp
rove
men
t
Per
cent
age
of p
atie
nts
dis
char
ged
hom
e w
ithin
90 d
ays
60%
Com
ple
te v
alue
str
eam
map
pin
g of
the
ho
spita
l dis
char
ge p
lann
ing
pro
cess
incl
udin
g ut
iliza
tion,
com
mun
ity p
artn
ers
and
dis
char
ge
pla
nner
s, a
nd u
se t
o d
rive
pro
cess
imp
rove
men
t
Com
ple
te b
y Ju
ne 2
012
100%
com
ple
te
Dev
elop
a h
osp
ital‐
wid
e p
roce
ss fo
r in
teg
rate
d d
isch
arge
pla
nnin
g/
ALC
des
igna
tion
so a
ll p
roce
sses
are
alig
ned
po
st-a
mal
gam
atio
n
Com
ple
te b
y Ju
ne 2
012
100%
com
ple
te
Dev
elop
an
onlin
e ho
spita
l dis
char
ge s
umm
ary
for
use
in t
he E
D, C
CA
C
and
phy
sici
an’s
offi
ces,
incl
udin
g th
e d
isch
arge
pla
n
Com
ple
te b
y Ja
nuar
y
2013
100%
com
ple
te
taB
le
31:
no
rt
h B
ay
re
gio
na
l h
ea
lth
ce
nt
re
’s c
ha
ng
e p
la
n f
or
alc
re
du
ct
ion
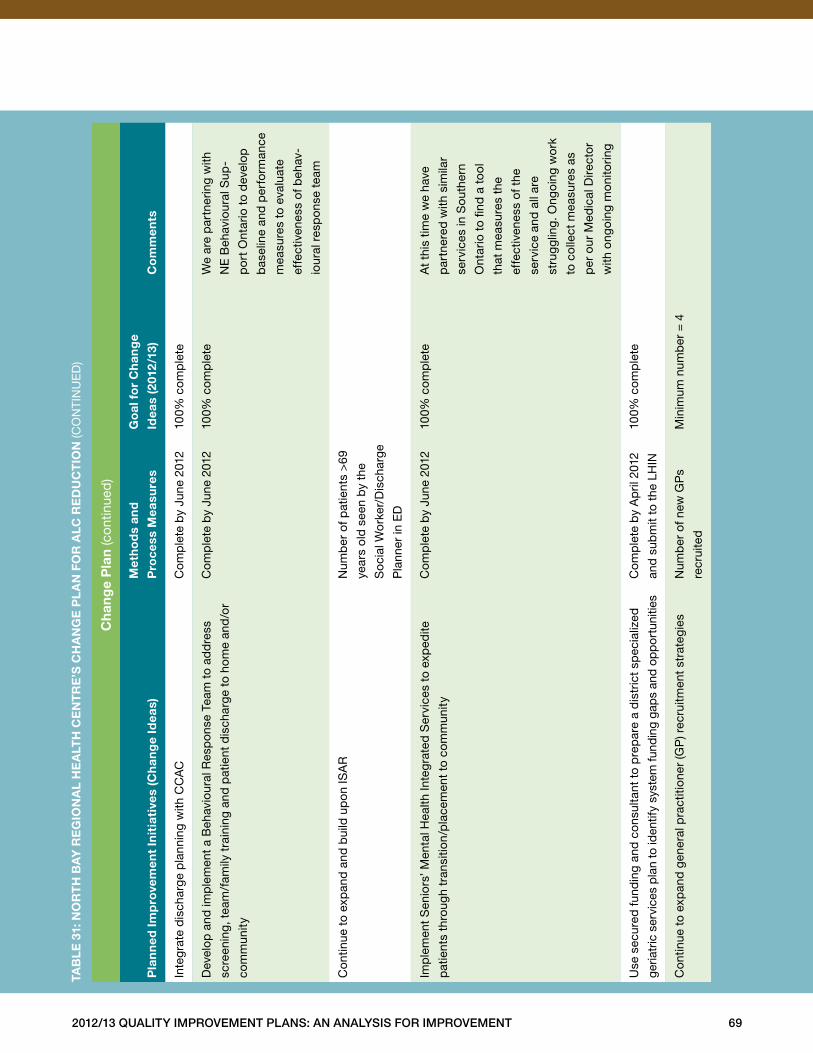
2012/13 Quality improvement plans: an analysis for improvement 69
ch
ang
e p
lan
(con
tinue
d)
pla
nn
ed im
pro
vem
ent
init
iati
ves
(ch
ang
e id
eas)
met
ho
ds
and
pro
cess
mea
sure
s
go
al f
or
ch
ang
e
idea
s (2
012
/13)
co
mm
ents
Inte
gra
te d
isch
arge
pla
nnin
g w
ith C
CA
CC
omp
lete
by
June
201
210
0% c
omp
lete
Dev
elop
and
imp
lem
ent
a B
ehav
iour
al R
esp
onse
Tea
m t
o ad
dre
ss
scre
enin
g, t
eam
/fam
ily t
rain
ing
and
pat
ient
dis
char
ge t
o ho
me
and
/or
com
mun
ity
Com
ple
te b
y Ju
ne 2
012
100%
com
ple
teW
e ar
e p
artn
erin
g w
ith
NE
Beh
avio
ural
Sup
-
po
rt O
ntar
io t
o d
evel
op
bas
elin
e an
d p
erfo
rman
ce
mea
sure
s to
eva
luat
e
effe
ctiv
enes
s of
beh
av-
iour
al r
esp
ons
e te
am
Con
tinue
to
exp
and
and
bui
ld u
pon
ISA
RN
umb
er o
f pat
ient
s >
69
year
s ol
d s
een
by
the
So
cial
Wo
rker
/Dis
char
ge
Pla
nner
in E
D
Imp
lem
ent
Sen
iors
’ Men
tal H
ealth
Inte
gra
ted
Ser
vice
s to
exp
edite
pat
ient
s th
roug
h tr
ansi
tion/
pla
cem
ent
to c
om
mun
ity
Com
ple
te b
y Ju
ne 2
012
100%
com
ple
teA
t th
is t
ime
we
have
par
tner
ed w
ith s
imila
r
serv
ices
in S
outh
ern
Ont
ario
to
find
a t
ool
that
mea
sure
s th
e
effe
ctiv
enes
s of
the
serv
ice
and
all
are
stru
ggl
ing .
Ong
oing
wo
rk
to c
olle
ct m
easu
res
as
per
our
Med
ical
Dire
cto
r
with
ong
oing
mon
itorin
g
Use
sec
ured
fun
din
g an
d c
onsu
ltant
to
pre
par
e a
dis
tric
t sp
ecia
lized
geria
tric
ser
vice
s p
lan
to id
entif
y sy
stem
fund
ing
gap
s an
d op
por
tuni
ties
Com
ple
te b
y A
pril
201
2
and
sub
mit
to t
he L
HIN
100%
com
ple
te
Con
tinue
to
exp
and
gen
eral
pra
ctiti
oner
(GP
) rec
ruitm
ent
stra
tegi
esN
umb
er o
f new
GP
s
recr
uite
d
Min
imum
num
ber
= 4
taB
le
31:
no
rt
h B
ay
re
gio
na
l h
ea
lth
ce
nt
re
’s c
ha
ng
e p
la
n f
or
alc
re
du
ct
ion
(CO
NTI
NU
ED
)
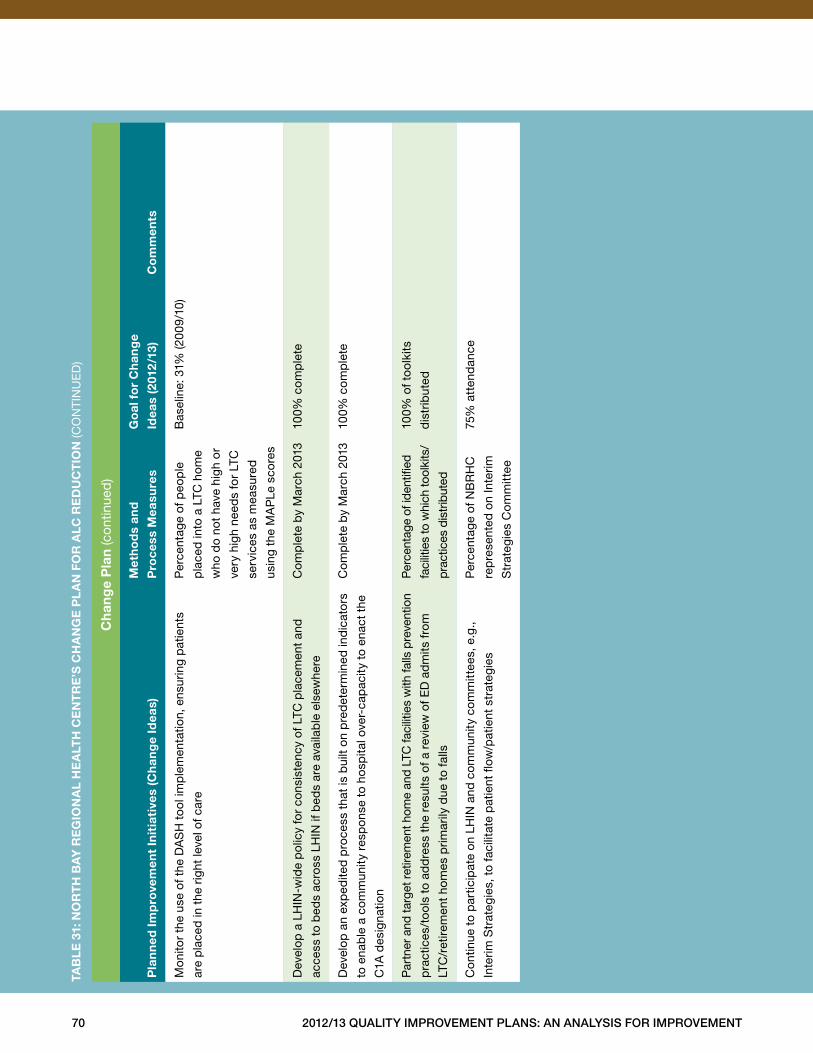
70 2012/13 Quality improvement plans: an analysis for improvement
ch
ang
e p
lan
(con
tinue
d)
pla
nn
ed im
pro
vem
ent
init
iati
ves
(ch
ang
e id
eas)
met
ho
ds
and
pro
cess
mea
sure
s
go
al f
or
ch
ang
e
idea
s (2
012
/13)
co
mm
ents
Mon
itor
the
use
of t
he D
AS
H t
ool
imp
lem
enta
tion,
ens
urin
g p
atie
nts
are
pla
ced
in t
he r
ight
leve
l of c
are
Per
cent
age
of p
eop
le
pla
ced
into
a L
TC h
ome
who
do
not
have
hig
h o
r
very
hig
h ne
eds
for
LTC
serv
ices
as
mea
sure
d
usin
g th
e M
AP
Le s
core
s
Bas
elin
e: 3
1% (2
009
/10)
Dev
elop
a L
HIN
-wid
e p
olic
y fo
r co
nsis
tenc
y of
LTC
pla
cem
ent
and
acce
ss t
o b
eds
acro
ss L
HIN
if b
eds
are
avai
lab
le e
lsew
here
Com
ple
te b
y M
arch
201
310
0% c
omp
lete
Dev
elop
an
exp
edite
d p
roce
ss t
hat
is b
uilt
on p
red
eter
min
ed in
dic
ato
rs
to e
nab
le a
com
mun
ity r
esp
onse
to
hosp
ital o
ver-
cap
acity
to
enac
t th
e
C1A
des
igna
tion
Com
ple
te b
y M
arch
201
310
0% c
omp
lete
Par
tner
and
targ
et r
etire
men
t hom
e an
d LT
C fa
cilit
ies
with
falls
pre
vent
ion
pra
ctic
es/t
ool
s to
ad
dre
ss t
he r
esul
ts o
f a r
evie
w o
f ED
ad
mits
fro
m
LTC
/ret
irem
ent
hom
es p
rimar
ily d
ue t
o fa
lls
Per
cent
age
of id
entifi
ed
faci
litie
s to
whi
ch to
olki
ts/
pra
ctic
es d
istr
ibut
ed
100%
of t
ool
kits
dis
trib
uted
Con
tinue
to
par
ticip
ate
on L
HIN
and
com
mun
ity c
omm
ittee
s, e
.g .,
Inte
rim S
trat
egie
s, t
o fa
cilit
ate
pat
ient
flow
/pat
ient
str
ateg
ies
Per
cent
age
of N
BR
HC
rep
rese
nted
on
Inte
rim
Str
ateg
ies
Com
mitt
ee
75%
att
end
ance
taB
le
31:
no
rt
h B
ay
re
gio
na
l h
ea
lth
ce
nt
re
’s c
ha
ng
e p
la
n f
or
alc
re
du
ct
ion
(CO
NTI
NU
ED
)
2012/13 Quality improvement plans: an analysis for improvement 71
Conclusion
This Analysis for Improvement highlighted many of
the successes achieved across quality improvement
domains over 2011/12 and the excellent work that
hospitals put into creating their quality improvement
plans for 2012/13, as required under ECFAA . Many
hospitals developed effective QIPs that identified clear
aims aligned with strategic priorities, included measures
and motivational targets, and provided change plans
that lead towards improvement .
Although a number of hospitals identified bold aims
and innovative ideas for change, others did not set
clear priorities or goals, achievable stretch targets
or comprehensive change ideas . This analysis of the
QIPs is a learning tool that will help all Ontario hospitals
going forward — to share innovative change ideas,
effective strategies and success stories, to communicate
progress achieved and to highlight continued areas for
improvement .
Moving forward, we hope to see greater improvements
in hospitals’ QIPs, which will result in continued improve-
ment and success for hospitals: Patients will experience
and receive better care and better outcomes, and
hospitals will achieve success by providing the right
care in the right place at the right time . In the future,
more detailed change plans, stretch targets and better
data quality will enable HQO to evaluate progress,
broker improvement and catalyze spread .
HQO expects that hospitals will continue to use their
QIPs to drive performance improvement, and to ensure
that they are focusing on key priority areas .
Congratulations to all Ontario hospitals for their continued
efforts this year . Their hard work and commitment to
developing effective QIPs are laying the groundwork for
improved quality across the Ontario healthcare system .
72 2012/13 Quality improvement plans: an analysis for improvement
Appendix A: Suite of Capacity-Building Supports
ecfaa (excellent Care for All Act)
hQo strategic roles
• Focus system on common agenda
• Build evidence of knowledge
• Broker improvement
• Catalyze spread
• Evaluate progress
hQo functional roles for capacity Building
• Facilitate
• Dissemination of change ideas, effective
strategies and QI success stories through
using the resources below
resources for capacity Building
hQo Quality improvement map: An online tool created to help hospitals develop their quality improvement
plans . The Quality Improvement Map is a source for best practice change ideas and provides links to recom-
mended resources . See http://www .hqontario .ca/en/ecfaa .html .
2012/13 Quality improvement plans: an analysis for improvement: This report communicates progress
achieved and highlights continued areas for improvement for hospital QIPs .
hQo Qip specialists: The QIP Specialist works with partners and hospitals to support the development of
QIPs . To connect with a QIP specialist, send an email to QIP@hqontario .ca .
hQo’s live web-based learning opportunities: These sessions are facilitated on a variety of improvement
topics . We encourage you to suggest topics of interest for the future . You can join our email list and receive
notification of upcoming events by sending an email to QIP@hqontario .ca .
peer-to-peer Qip feedback: The proposed Plan–Do–Study–Act cycle is set to begin in fall 2012 . HQO is
working with partners to identify opportunities to facilitate regional peer-to-peer QIP feedback sessions .
institute for healthcare improvement (ihi) open school: The school offers a vast array of QI supports
through its website, www .IHI .org . HQO is providing an opportunity to enroll two employees from each hospital
in IHI Open School improvement courses for health professionals, designed for the next generation of leaders .
To enroll, contact us at QIP@hqontario .ca .
mentorship program: The Ontario Hospital Association (OHA) and the Canadian Health Care Risk
Management Network (CHRMN) are offering individuals an opportunity to participate in a Patient Safety,
Quality and Risk Management Mentorship Program . See www .oha .com/SERVICES/PATIENTSAFETY/
Pages/QualityandPatientSafetyMentorshipProgram .aspx .
2012/13 Quality improvement plans: an analysis for improvement 73
hQo capacity-Building linkages
• hQo integrated program delivery Branch
– access and chronic disease: As part of its work to foster quality improvement capacity in Ontario’s
healthcare system, HQO offers improvement initiatives in Advanced Access, Efficiency and Chronic
Disease Management in Primary Care . See www .hqontario .ca/en/supporting_qi_pc .html .
– bestpath: Quality improvement coaches facilitate health system integration for participating communities .
bestPATH products include evidence-informed best practices for transitions in care targeted to reduce
avoidable rehospitalizations .
– long-term care: Residents First is a provincial quality improvement initiative that supports all Ontario
long-term care homes in providing safe, effective and responsive care to their residents . See
www .hqontario .ca/en/supporting_qi .html .
• hQo evidence development and standards Branch: HQO’s Evidence Development and Standards (EDS)
team works with clinical experts, scientific collaborators and field evaluation partners to conduct evidence-
based analyses to evaluate the effectiveness and cost-effectiveness of health technologies and services in
Ontario . Based on the results of EDS’s evidence-based analyses, the Ontario Health Technology Advisory
Committee (OHTAC) — a standing advisory sub-committee of the HQO Board — makes recommendations
about the uptake, diffusion, distribution or removal of health interventions to Ontario’s Ministry of Health and
Long-Term Care, clinicians, health system leaders and policy-makers . See www .hqontario .ca/en/mas/mas .html .
• hQo health system performance Branch: As part of HQO’s mandate, the health system performance
(HSP) team monitors and reports to the people of Ontario on access to publicly funded health services,
health human resources in publicly funded health services, consumer and population health status and
health system outcomes . The primary vehicles for evaluating progress are the Quality Monitor and the
comprehensive suite of public reporting websites . HSP is also active with other projects related to
primary care performance measurement, benchmarking of key quality indicators, and the development
and alignment of indicators for monitoring and reporting on the quality improvement initiatives supported
by HQO . See www .hqontario .ca/en/framework .html .
other support organizations
• local health integration networks (lhins) plan, fund and integrate health service locally and develop
LHIN-specific Integrated Health Service Plans (IHSPs) . Consequently, the LHIN IHSPs differ from one LHIN
to the next, since each is tailored to local health services needs and priorities . See www .lhins .on .ca .
• professional organizations, including the Ontario Hospital Association, Association of Family Health Teams
Ontario, etc .
• the Quality healthcare network is a community-based, not-for-profit organization with a mission to elevate
system performance through collaborative and innovation means . See www .QHN .ca .
• accreditation canada provides program-specific standards, tools and processes . See www .accreditation .ca .
• the canadian patient safety institute is a national not-for-profit organization that raises awareness and
facilitates implementation of ideas and best practices to achieve a transformation in patient safety . See
www .patientsafetyinstitute .ca/English/Pages/default .aspx .
• the institute for safe medication practices canada is an independent, national not-for-profit organization
committed to the advancement of medication safety in all healthcare settings . See www .ismp-canada .org .
74 2012/13 Quality improvement plans: an analysis for improvement
Appendix B: Technical Report
introduction
The purpose of the Technical Report is to provide public
access to details of the process used to generate indicator
results . This information will be useful to others interested
in replicating the indicators presented . Further details
on the process and methods used to select the indicators
on the Health Quality Ontario (HQO) website can be
obtained from HQO .
data sources
The indicator results presented were provided to HQO
by several sources, including the Canadian Institute
for Health Information (CIHI), the Ontario Hospital
Association (OHA) and the Ministry of Health and
Long-Term Care (MOHLTC) .
discharge abstract databases (dad)
DAD is a data collection tool used by CIHI to collect
information on patients treated in acute care facilities .
DAD contains administrative, clinical and demographic
data . CIHI receives data directly from acute care facilities
or from their respective health/regional authority or
ministry/department of health .
ontario mental health reporting system (omhrs)
OMHRS data are sourced from the Resident Assessment
Instrument-Mental Health (RAI-MH), a unique standardized
data collection system for mental health . OMHRS contains
data about individuals admitted to adult mental health
beds in Ontario . The data are collected at admission,
discharge and every three months for patients with
extended stays .
national ambulatory care reporting system (nacrs)
NACRS is a data collection tool developed by CIHI to
capture information on patient visits to hospital- and
community-based ambulatory care facilities . NACRS
data used in this report are collected on a routine basis
by all emergency departments (EDs) in Ontario .
continuing care reporting system (ccrs)
CCRS is a data collection tool developed by CIHI to
capture demographic, clinical, functional and resource
utilization information on individuals receiving continuing
care services in hospitals or residential care facilities
in Canada . Participating organizations also provide
information on facility characteristics to support
comparative reporting and benchmarking .
critical care information system (ccis)
CCIS is a data collection tool developed by MOHLTC to
collect information on admitted ICU patients, interventions
performed to address care needs and the utilization of
critical care response teams .
Web-enabled reporting system (Wers)
WERS is an easy-to-use online tool developed by
MOHLTC for the complete preparation and tracking
of reports prepared by hospitals and other institutional
users .
ontario hospital reporting system (ohrs)
OHRS databases developed by MOHLTC provide the
only integrated source of data on the actual financial
and operational activities of hospitals in the province .
nrc picker/hospital consumer assessment of
healthcare providers and systems (hcaphs)
NRC Picker/HCAPHS uses standardized surveys to
capture patients’ perspectives on the hospital care .
This provides the public with comparable information
on hospital quality .
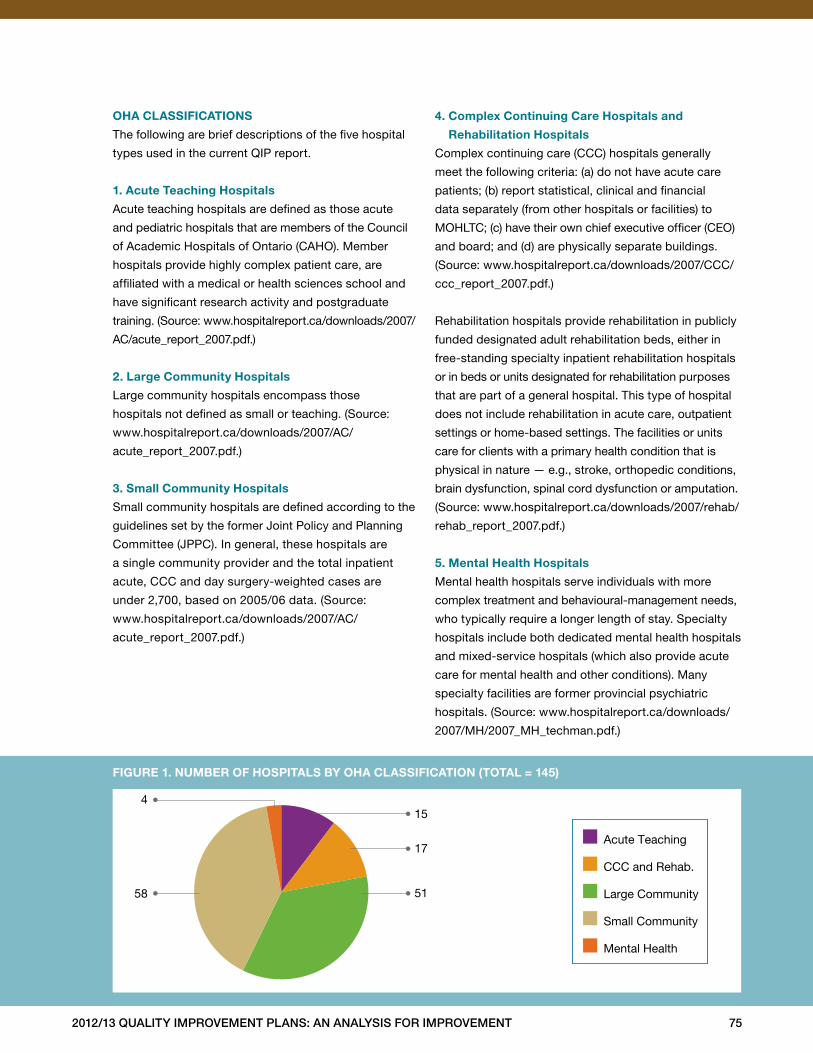
2012/13 Quality improvement plans: an analysis for improvement 75
■ Acute Teaching
■ CCC and Rehab.
■ Large Community
■ Small Community
■ Mental Health
154
58
17
51
figure 1. numBer of hospitals By oha classification (total = 145)
oha classifications
The following are brief descriptions of the five hospital
types used in the current QIP report .
1. acute teaching hospitals
Acute teaching hospitals are defined as those acute
and pediatric hospitals that are members of the Council
of Academic Hospitals of Ontario (CAHO) . Member
hospitals provide highly complex patient care, are
affiliated with a medical or health sciences school and
have significant research activity and postgraduate
training . (Source: www .hospitalreport .ca/downloads/2007/
AC/acute_report_2007 .pdf .)
2. large community hospitals
Large community hospitals encompass those
hospitals not defined as small or teaching . (Source:
www .hospitalreport .ca/downloads/2007/AC/
acute_report_2007 .pdf .)
3. small community hospitals
Small community hospitals are defined according to the
guidelines set by the former Joint Policy and Planning
Committee (JPPC) . In general, these hospitals are
a single community provider and the total inpatient
acute, CCC and day surgery-weighted cases are
under 2,700, based on 2005/06 data . (Source:
www .hospitalreport .ca/downloads/2007/AC/
acute_report_2007 .pdf .)
4. complex continuing care hospitals and
rehabilitation hospitals
Complex continuing care (CCC) hospitals generally
meet the following criteria: (a) do not have acute care
patients; (b) report statistical, clinical and financial
data separately (from other hospitals or facilities) to
MOHLTC; (c) have their own chief executive officer (CEO)
and board; and (d) are physically separate buildings .
(Source: www .hospitalreport .ca/downloads/2007/CCC/
ccc_report_2007 .pdf .)
Rehabilitation hospitals provide rehabilitation in publicly
funded designated adult rehabilitation beds, either in
free-standing specialty inpatient rehabilitation hospitals
or in beds or units designated for rehabilitation purposes
that are part of a general hospital . This type of hospital
does not include rehabilitation in acute care, outpatient
settings or home-based settings . The facilities or units
care for clients with a primary health condition that is
physical in nature — e .g ., stroke, orthopedic conditions,
brain dysfunction, spinal cord dysfunction or amputation .
(Source: www .hospitalreport .ca/downloads/2007/rehab/
rehab_report_2007 .pdf .)
5. mental health hospitals
Mental health hospitals serve individuals with more
complex treatment and behavioural-management needs,
who typically require a longer length of stay . Specialty
hospitals include both dedicated mental health hospitals
and mixed-service hospitals (which also provide acute
care for mental health and other conditions) . Many
specialty facilities are former provincial psychiatric
hospitals . (Source: www .hospitalreport .ca/downloads/
2007/MH/2007_MH_techman .pdf .)
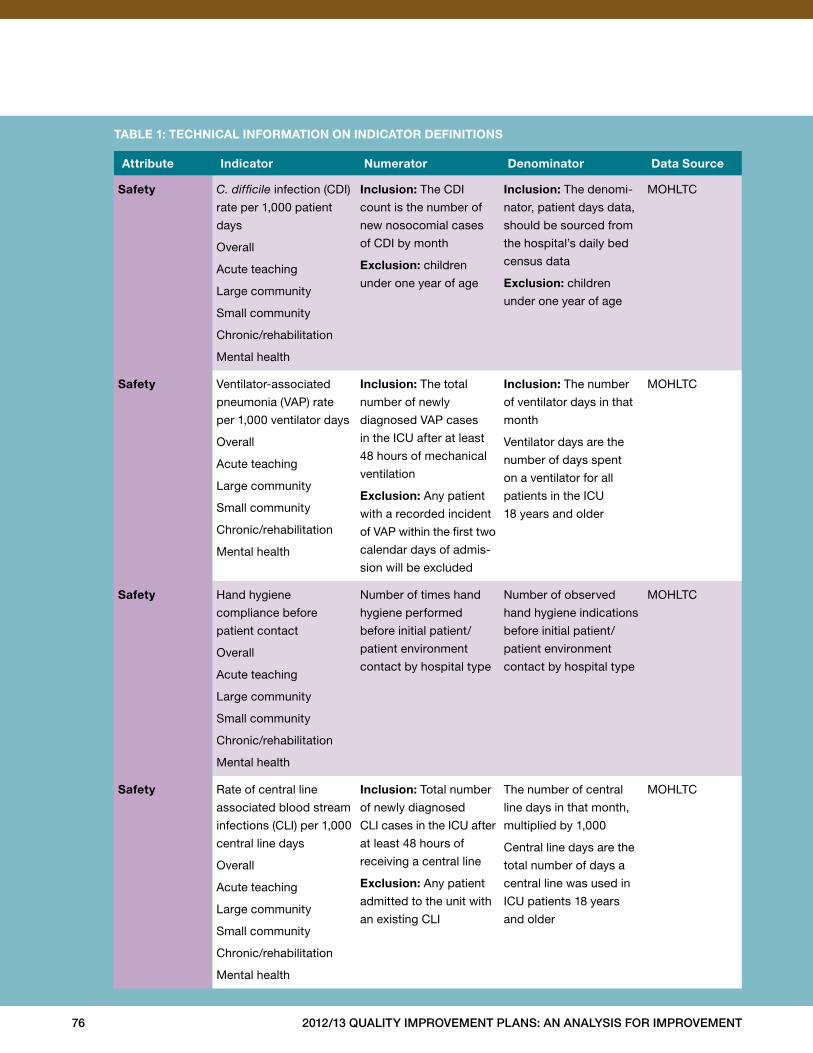
76 2012/13 Quality improvement plans: an analysis for improvement
attribute indicator numerator denominator data source
safety C. difficile infection (CDI)
rate per 1,000 patient
days
Overall
Acute teaching
Large community
Small community
Chronic/rehabilitation
Mental health
inclusion: The CDI
count is the number of
new nosocomial cases
of CDI by month
exclusion: children
under one year of age
inclusion: The denomi-
nator, patient days data,
should be sourced from
the hospital’s daily bed
census data
exclusion: children
under one year of age
MOHLTC
safety Ventilator-associated
pneumonia (VAP) rate
per 1,000 ventilator days
Overall
Acute teaching
Large community
Small community
Chronic/rehabilitation
Mental health
inclusion: The total
number of newly
diagnosed VAP cases
in the ICU after at least
48 hours of mechanical
ventilation
exclusion: Any patient
with a recorded incident
of VAP within the first two
calendar days of admis-
sion will be excluded
inclusion: The number
of ventilator days in that
month
Ventilator days are the
number of days spent
on a ventilator for all
patients in the ICU
18 years and older
MOHLTC
safety Hand hygiene
compliance before
patient contact
Overall
Acute teaching
Large community
Small community
Chronic/rehabilitation
Mental health
Number of times hand
hygiene performed
before initial patient/
patient environment
contact by hospital type
Number of observed
hand hygiene indications
before initial patient/
patient environment
contact by hospital type
MOHLTC
safety Rate of central line
associated blood stream
infections (CLI) per 1,000
central line days
Overall
Acute teaching
Large community
Small community
Chronic/rehabilitation
Mental health
inclusion: Total number
of newly diagnosed
CLI cases in the ICU after
at least 48 hours of
receiving a central line
exclusion: Any patient
admitted to the unit with
an existing CLI
The number of central
line days in that month,
multiplied by 1,000
Central line days are the
total number of days a
central line was used in
ICU patients 18 years
and older
MOHLTC
taBle 1: technical information on indicator definitions
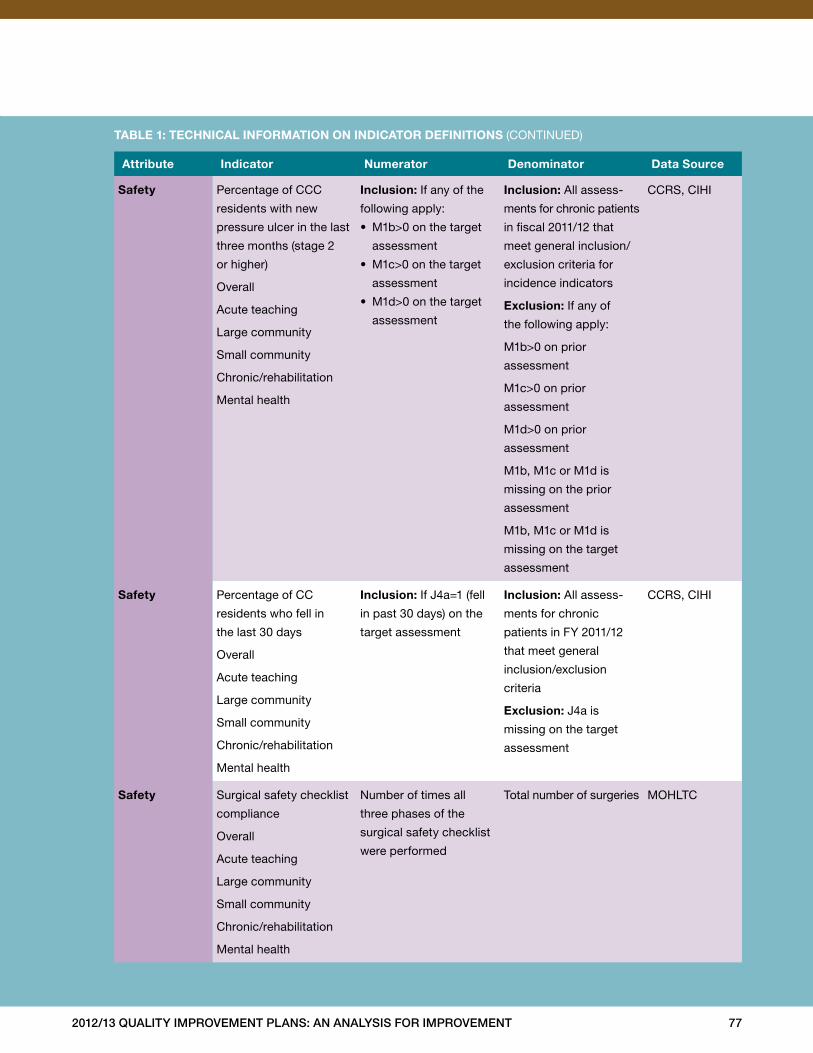
2012/13 Quality improvement plans: an analysis for improvement 77
attribute indicator numerator denominator data source
safety Percentage of CCC
residents with new
pressure ulcer in the last
three months (stage 2
or higher)
Overall
Acute teaching
Large community
Small community
Chronic/rehabilitation
Mental health
inclusion: If any of the
following apply:
• M1b>0 on the target
assessment
• M1c>0 on the target
assessment
• M1d>0 on the target
assessment
inclusion: All assess-
ments for chronic patients
in fiscal 2011/12 that
meet general inclusion/
exclusion criteria for
incidence indicators
exclusion: If any of
the following apply:
M1b>0 on prior
assessment
M1c>0 on prior
assessment
M1d>0 on prior
assessment
M1b, M1c or M1d is
missing on the prior
assessment
M1b, M1c or M1d is
missing on the target
assessment
CCRS, CIHI
safety Percentage of CC
residents who fell in
the last 30 days
Overall
Acute teaching
Large community
Small community
Chronic/rehabilitation
Mental health
inclusion: If J4a=1 (fell
in past 30 days) on the
target assessment
inclusion: All assess-
ments for chronic
patients in FY 2011/12
that meet general
inclusion/exclusion
criteria
exclusion: J4a is
missing on the target
assessment
CCRS, CIHI
safety Surgical safety checklist
compliance
Overall
Acute teaching
Large community
Small community
Chronic/rehabilitation
Mental health
Number of times all
three phases of the
surgical safety checklist
were performed
Total number of surgeries MOHLTC
taBle 1: technical information on indicator definitions (CONTINUED)
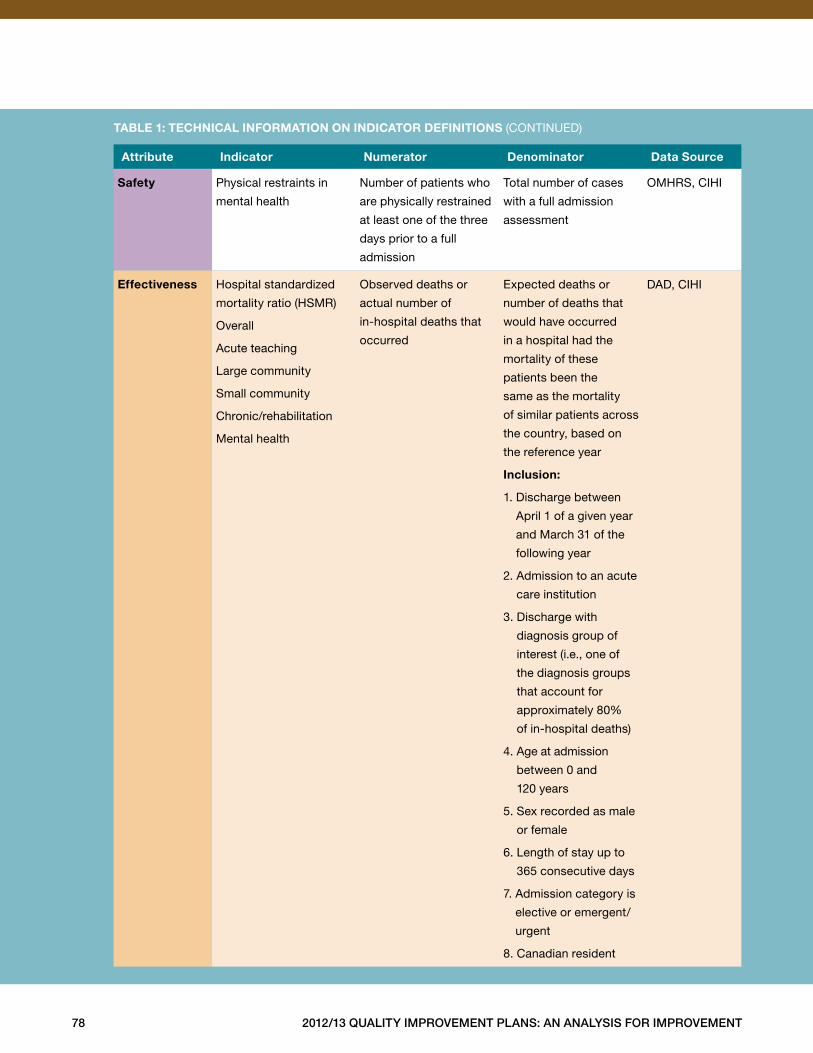
78 2012/13 Quality improvement plans: an analysis for improvement
attribute indicator numerator denominator data source
safety Physical restraints in
mental health
Number of patients who
are physically restrained
at least one of the three
days prior to a full
admission
Total number of cases
with a full admission
assessment
OMHRS, CIHI
effectiveness Hospital standardized
mortality ratio (HSMR)
Overall
Acute teaching
Large community
Small community
Chronic/rehabilitation
Mental health
Observed deaths or
actual number of
in-hospital deaths that
occurred
Expected deaths or
number of deaths that
would have occurred
in a hospital had the
mortality of these
patients been the
same as the mortality
of similar patients across
the country, based on
the reference year
inclusion:
1 . Discharge between
April 1 of a given year
and March 31 of the
following year
2 . Admission to an acute
care institution
3 . Discharge with
diagnosis group of
interest (i .e ., one of
the diagnosis groups
that account for
approximately 80%
of in-hospital deaths)
4 . Age at admission
between 0 and
120 years
5 . Sex recorded as male
or female
6 . Length of stay up to
365 consecutive days
7 . Admission category is
elective or emergent/
urgent
8 . Canadian resident
DAD, CIHI
taBle 1: technical information on indicator definitions (CONTINUED)
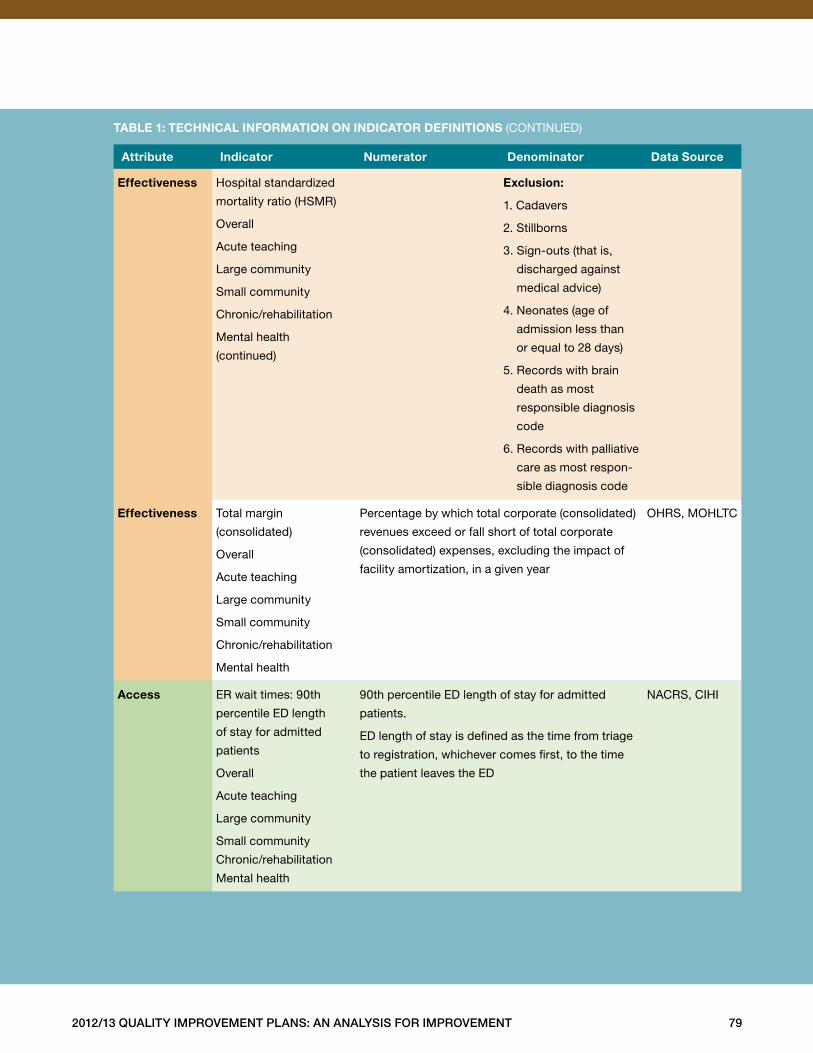
2012/13 Quality improvement plans: an analysis for improvement 79
attribute indicator numerator denominator data source
effectiveness Hospital standardized
mortality ratio (HSMR)
Overall
Acute teaching
Large community
Small community
Chronic/rehabilitation
Mental health
(continued)
exclusion:
1 . Cadavers
2 . Stillborns
3 . Sign-outs (that is,
discharged against
medical advice)
4 . Neonates (age of
admission less than
or equal to 28 days)
5 . Records with brain
death as most
responsible diagnosis
code
6 . Records with palliative
care as most respon-
sible diagnosis code
effectiveness Total margin
(consolidated)
Overall
Acute teaching
Large community
Small community
Chronic/rehabilitation
Mental health
Percentage by which total corporate (consolidated)
revenues exceed or fall short of total corporate
(consolidated) expenses, excluding the impact of
facility amortization, in a given year
OHRS, MOHLTC
access ER wait times: 90th
percentile ED length
of stay for admitted
patients
Overall
Acute teaching
Large community
Small community
Chronic/rehabilitation
Mental health
90th percentile ED length of stay for admitted
patients .
ED length of stay is defined as the time from triage
to registration, whichever comes first, to the time
the patient leaves the ED
NACRS, CIHI
taBle 1: technical information on indicator definitions (CONTINUED)
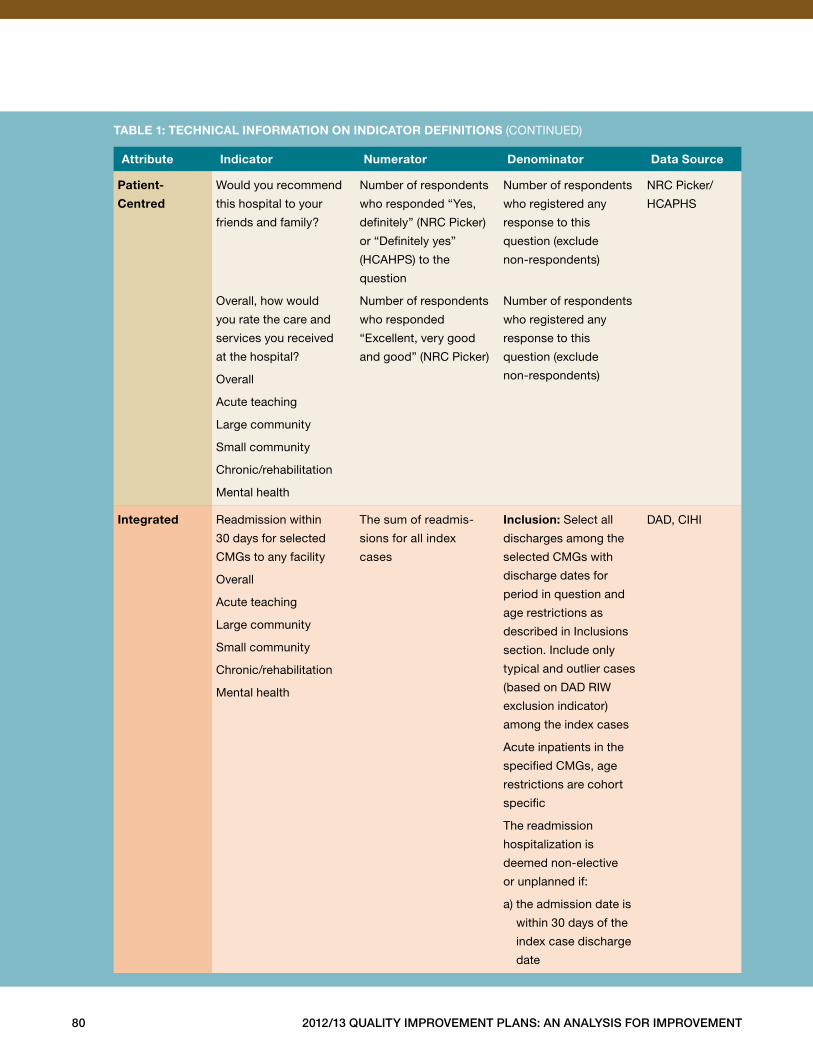
80 2012/13 Quality improvement plans: an analysis for improvement
attribute indicator numerator denominator data source
patient-
centred
Would you recommend
this hospital to your
friends and family?
Overall, how would
you rate the care and
services you received
at the hospital?
Overall
Acute teaching
Large community
Small community
Chronic/rehabilitation
Mental health
Number of respondents
who responded “Yes,
definitely” (NRC Picker)
or “Definitely yes”
(HCAHPS) to the
question
Number of respondents
who responded
“Excellent, very good
and good” (NRC Picker)
Number of respondents
who registered any
response to this
question (exclude
non-respondents)
Number of respondents
who registered any
response to this
question (exclude
non-respondents)
NRC Picker/
HCAPHS
integrated Readmission within
30 days for selected
CMGs to any facility
Overall
Acute teaching
Large community
Small community
Chronic/rehabilitation
Mental health
The sum of readmis-
sions for all index
cases
inclusion: Select all
discharges among the
selected CMGs with
discharge dates for
period in question and
age restrictions as
described in Inclusions
section . Include only
typical and outlier cases
(based on DAD RIW
exclusion indicator)
among the index cases
Acute inpatients in the
specified CMGs, age
restrictions are cohort
specific
The readmission
hospitalization is
deemed non-elective
or unplanned if:
a) the admission date is
within 30 days of the
index case discharge
date
DAD, CIHI
taBle 1: technical information on indicator definitions (CONTINUED)
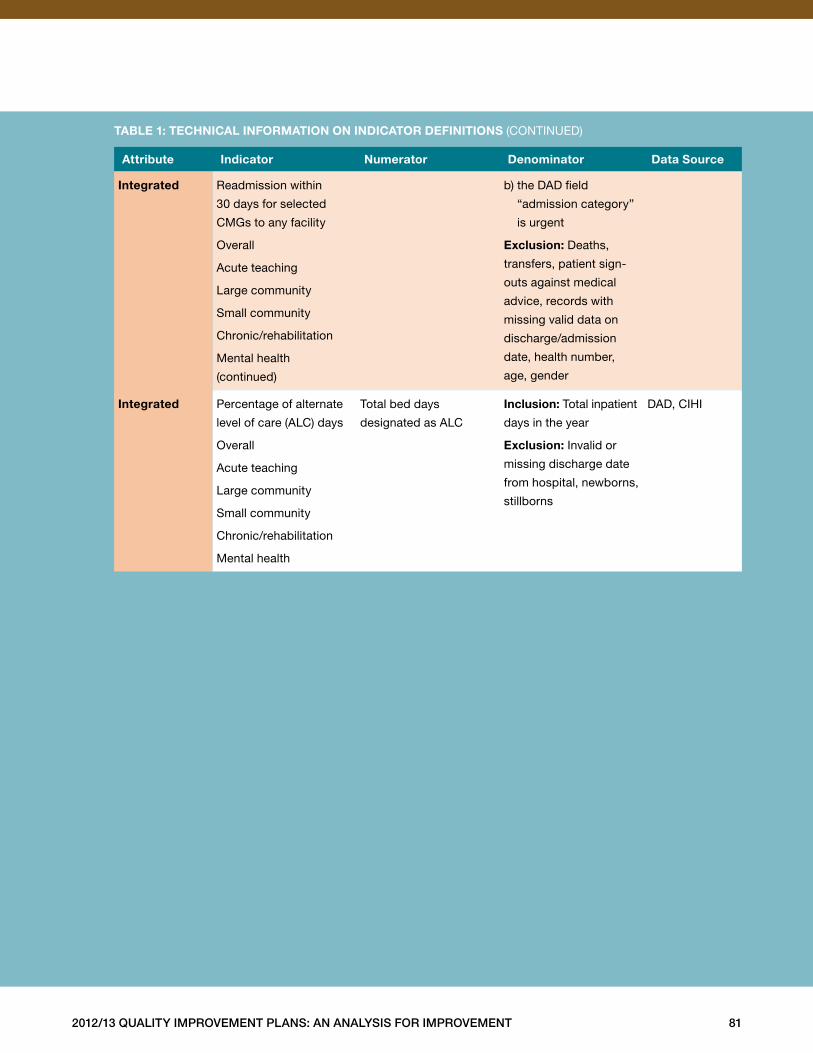
2012/13 Quality improvement plans: an analysis for improvement 81
attribute indicator numerator denominator data source
integrated Readmission within
30 days for selected
CMGs to any facility
Overall
Acute teaching
Large community
Small community
Chronic/rehabilitation
Mental health
(continued)
b) the DAD field
“admission category”
is urgent
exclusion: Deaths,
transfers, patient sign-
outs against medical
advice, records with
missing valid data on
discharge/admission
date, health number,
age, gender
integrated Percentage of alternate
level of care (ALC) days
Overall
Acute teaching
Large community
Small community
Chronic/rehabilitation
Mental health
Total bed days
designated as ALC
inclusion: Total inpatient
days in the year
exclusion: Invalid or
missing discharge date
from hospital, newborns,
stillborns
DAD, CIHI
taBle 1: technical information on indicator definitions (CONTINUED)
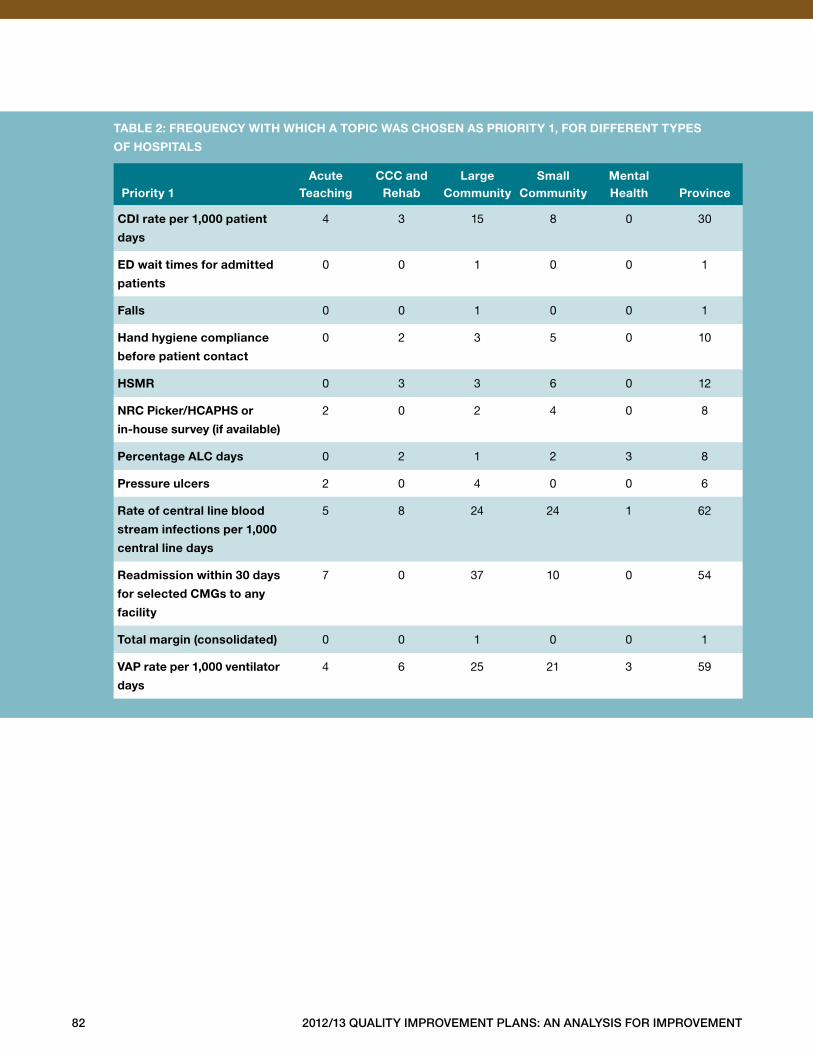
82 2012/13 Quality improvement plans: an analysis for improvement
taBle 2: freQuency With Which a topic Was chosen as priority 1, for different types
of hospitals
priority 1
acute teaching
ccc and rehab
large community
small community
mental health
province
cdi rate per 1,000 patient
days
4 3 15 8 0 30
ed wait times for admitted
patients
0 0 1 0 0 1
falls 0 0 1 0 0 1
hand hygiene compliance
before patient contact
0 2 3 5 0 10
hsmr 0 3 3 6 0 12
nrc picker/hcaphs or
in-house survey (if available)
2 0 2 4 0 8
percentage alc days 0 2 1 2 3 8
pressure ulcers 2 0 4 0 0 6
rate of central line blood
stream infections per 1,000
central line days
5 8 24 24 1 62
readmission within 30 days
for selected cmgs to any
facility
7 0 37 10 0 54
total margin (consolidated) 0 0 1 0 0 1
vap rate per 1,000 ventilator
days
4 6 25 21 3 59
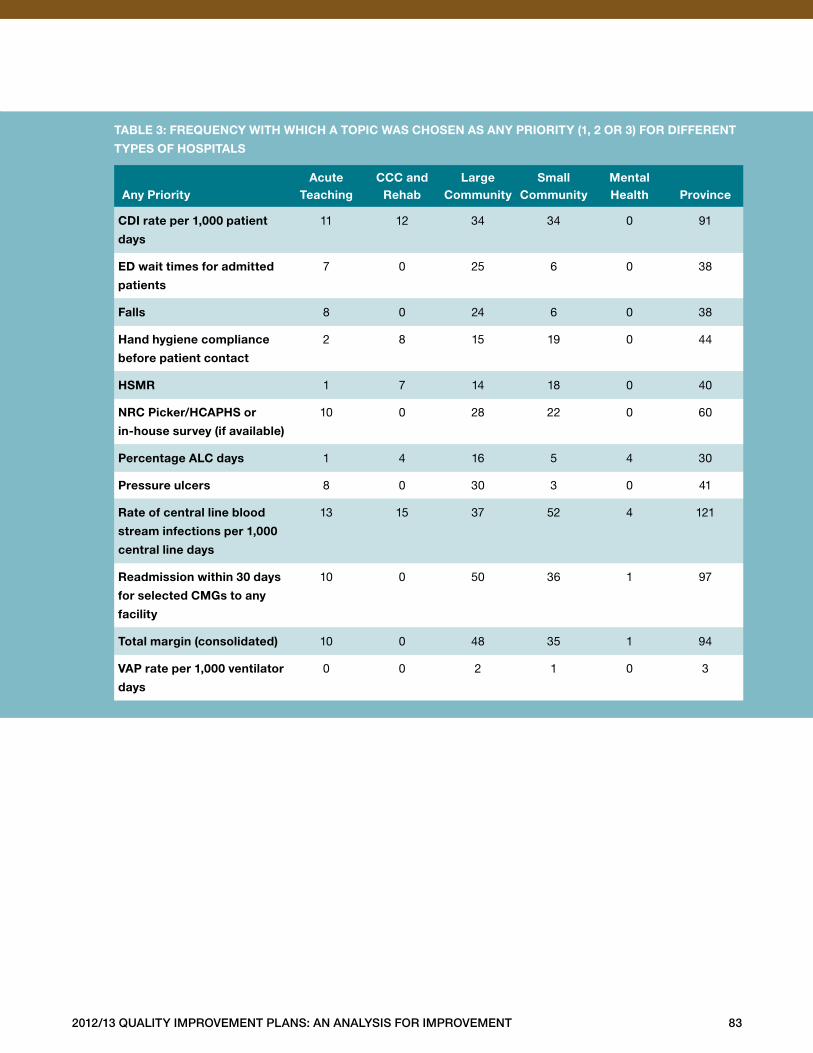
2012/13 Quality improvement plans: an analysis for improvement 83
taBle 3: freQuency With Which a topic Was chosen as any priority (1, 2 or 3) for different
types of hospitals
any priority
acute teaching
ccc and rehab
large community
small community
mental health
province
cdi rate per 1,000 patient
days
11 12 34 34 0 91
ed wait times for admitted
patients
7 0 25 6 0 38
falls 8 0 24 6 0 38
hand hygiene compliance
before patient contact
2 8 15 19 0 44
hsmr 1 7 14 18 0 40
nrc picker/hcaphs or
in-house survey (if available)
10 0 28 22 0 60
percentage alc days 1 4 16 5 4 30
pressure ulcers 8 0 30 3 0 41
rate of central line blood
stream infections per 1,000
central line days
13 15 37 52 4 121
readmission within 30 days
for selected cmgs to any
facility
10 0 50 36 1 97
total margin (consolidated) 10 0 48 35 1 94
vap rate per 1,000 ventilator
days
0 0 2 1 0 3


www.hqontario.ca
Health Quality Ontario
130 Bloor Street West, 10th Floor
Toronto, ON M5S 1N5
Tel: 416-323-6868 | 1-866-623-6868
Fax: 416-323-9261
ISBN 978-1-4606-0271-3 (Print)
ISBN 978-1-4606-0272-0 (PDF)
© Queen’s Printer for Ontario, 2012