producing objective income & balance sheet forecasts · producing objective income &...
TRANSCRIPT

Producing Objective Income & Balance Sheet Forecasts
Brian Poi, Director November 7, 2017
Producing Objective Income & Balance Sheet Forecasts 2
Brian PoiDirector, Specialized Modeling
Brian develops a variety of credit loss, credit origination and deposit account models for use in both strategic planning and CCAR/DFAST environments.
Brian also develops and validates models and provides guidance on the use of advanced modeling methods.
Today’s Speaker

Producing Objective Income & Balance Sheet Forecasts 3
1. Common Challenges 2. Case Study: Small-bank Peer Analysis3. Case Study: Super-regional CCAR Banks4. Solution & Methodological Approach5. Q&A
Agenda

1 Common Challenges

Producing Objective Income & Balance Sheet Forecasts 5
Barriers
» Influence of idiosyncratic factors (including management actions and M&A activity).
» Difficulty benchmarking performance individual competitors and peer groups.
» Internal forecasts often fail to account for competitors’ behavior.
» Gaps or limitations in historical data.
What we hear from market participants
Challenges

Producing Objective Income & Balance Sheet Forecasts 6
Small Banks
» Primary Stress Testing Solution
» Capital Planning
» Finding Acquisition Targets
» Competitive Analysis
Assessing performance under baseline and adverse scenariosUsing Objective Forecasts
Medium and Large Banks
» Benchmarking Internal Models
» Capital Planning
» Finding Acquisition Targets
» Competitive Analysis

2 Case Study: Small-bank Peer Analysis

Producing Objective Income & Balance Sheet Forecasts 8
Peer Group and Industry Assets
0
5,000
10,000
15,000
20,000
0123456789
93 95 97 99 01 03 05 07 09 11 13 15 17
Peer Group (L) Industry (R)
Peer group: 18 banks in Waco-Killeen area of central Texas
Sources: FDIC Statistics on Depository Institutions, Moody’s Analytics
$ bil

Producing Objective Income & Balance Sheet Forecasts 9
%Peer Group Assets As a Share of Industry
0.03
0.04
0.05
93 95 97 99 01 03 05 07 09 11 13 15 17Sources: FDIC Statistics on Depository Institutions, Moody’s Analytics
First National Bank ($1.7B)
Extraco Bank ($1.4B)
Central Nat’l Bank ($840M)
First Nat’l Central TX ($784M)
Nat’l Bank ($642M)
American Bank ($451M)
Community B&T ($433M)
Texas First ($395M)
Others ($1.6B)
Producing Objective Income & Balance Sheet Forecasts
0
5
10
15
20
25
30
93 95 97 99 01 03 05 07 09 11 13 15 17
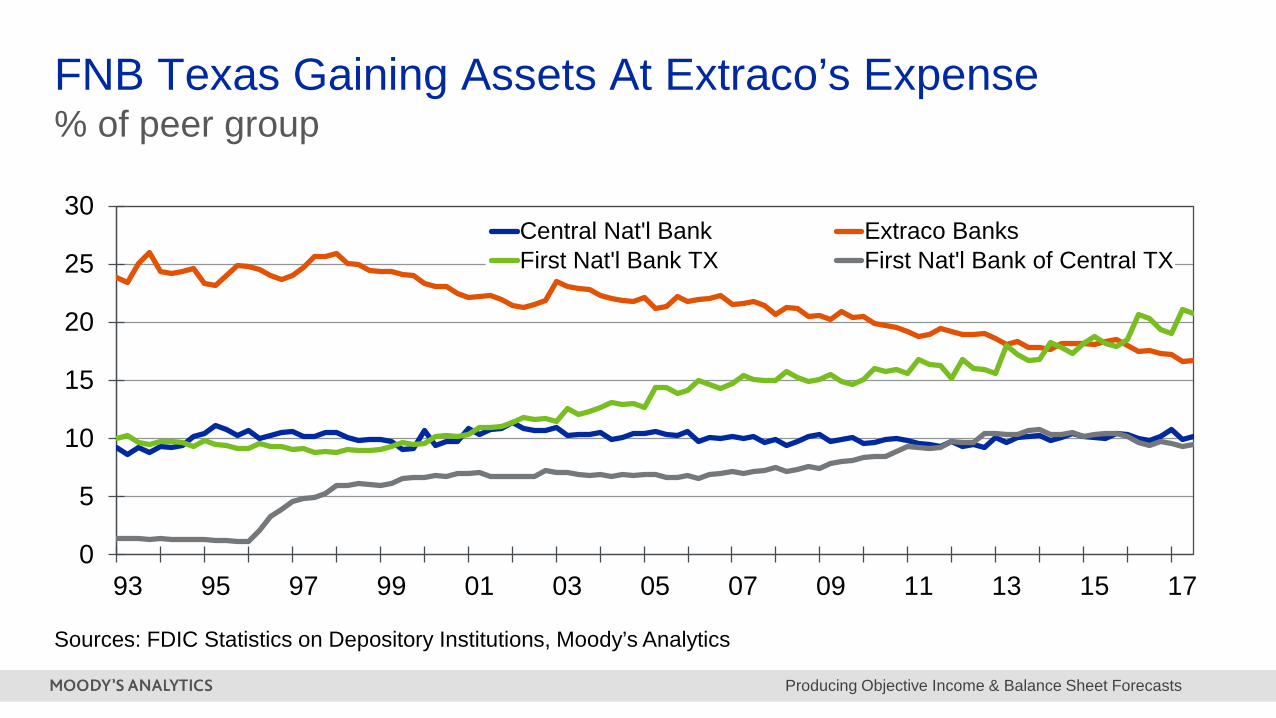
Central Nat'l Bank Extraco BanksFirst Nat'l Bank TX First Nat'l Bank of Central TX
FNB Texas Gaining Assets At Extraco’s Expense
Sources: FDIC Statistics on Depository Institutions, Moody’s Analytics
% of peer group

Producing Objective Income & Balance Sheet Forecasts
0
5
10
15
20
25
30
35
95 97 99 01 03 05 07 09 11 13 15 17 19 21
FNB TX Base Severe Extraco Base Severe
Net Loan and Lease Share Forecasts
Sources: FDIC Statistics on Depository Institutions, Moody’s Analytics
% of peer group

Producing Objective Income & Balance Sheet Forecasts
0100200300400500600700800900
1,000
95 97 99 01 03 05 07 09 11 13 15 17 19 21
Actual Base Adverse Severely Adverse
FNB Texas Net Loans and Leases Forecast
Sources: FDIC Statistics on Depository Institutions, Moody’s Analytics
$ mil

Producing Objective Income & Balance Sheet Forecasts
0
200
400
600
800
1,000
1,200
95 97 99 01 03 05 07 09 11 13 15 17 19 21
Actual Base Adverse Severely Adverse
Extraco Net Loans and Leases Forecast
Sources: FDIC Statistics on Depository Institutions, Moody’s Analytics
$ mil

3 Case Study: Super-Regional CCAR Banks

Producing Objective Income & Balance Sheet Forecasts
0
5
10
15
93 97 01 05 09 13 17
Actual Base Adv. Sev.
C&I Lending Market Shares
Sources: FDIC Statistics on Depository Institutions, Moody’s Analytics
3
4
5
6
7
93 97 01 05 09 13 17
Actual Base Adv. Sev.2
4
6
8
10
93 97 01 05 09 13 17
Actual Base Adv. Sev.
Comerica Compass Bank
M&T Bank MUFG Americas
0
2
4
6
93 97 01 05 09 13 17
Actual Base Adv. Sev.
%

Producing Objective Income & Balance Sheet Forecasts
2
4
6
8
10
93 97 01 05 09 13 17
Actual Base Adv. Sev.
C&I Lending Market Shares
Sources: FDIC Statistics on Depository Institutions, Moody’s Analytics
4
6
8
93 97 01 05 09 13 17
Actual Base Adv. Sev.
0
2
4
6
8
93 97 01 05 09 13 17
Actual Base Adv. Sev.
BB&T Bank Fifth Third Bank
Huntington Bank Santander Bank
2
4
6
8
10
12
93 97 01 05 09 13 17
Actual Base Adv. Sev.
%

Producing Objective Income & Balance Sheet Forecasts 17
Peer Group First Mortgage Net Charge offs
0
200
400
600
800
1,000
1,200
03 05 07 09 11 13 15 17 19
Actual Baseline Adverse Severely Adverse
2008Q1 – 2010Q1: $5.6 bil
2017Q1 – 2019Q1: $1.9 bil
Sources: FDIC Statistics on Depository Institutions, Moody’s Analytics
$ mil

Producing Objective Income & Balance Sheet Forecasts 18
Peer Group Risk-Weighted Assets
800
1,000
1,200
1,400
1,600
03 05 07 09 11 13 15 17 19
Actual Baseline Adverse Severely Adverse
Sources: FDIC Statistics on Depository Institutions, Moody’s Analytics
$ bil

Producing Objective Income & Balance Sheet Forecasts 19
Peer Group Tier-1 Capital – Naïve Forecast
50
100
150
200
250
03 05 07 09 11 13 15 17 19
Actual Baseline Adverse Severely Adverse
Sources: FDIC Statistics on Depository Institutions, Moody’s Analytics
$ bil

Producing Objective Income & Balance Sheet Forecasts 20
Peer Group Tier-1 Capital Ratio
8
9
10
11
12
13
14
03 05 07 09 11 13 15 17 19
Actual Baseline Adverse Severely Adverse
Sources: FDIC Statistics on Depository Institutions, Moody’s Analytics
%

4 Solution & Methodological Approach

Producing Objective Income & Balance Sheet Forecasts 22
Overcomes Many Limitations
» Model based on call report data from the FDIC going back to 1992.
» Uses forecasts from Moody’s Analytics US Macroeconomic model.
» Eliminates internal factors such as management actions and M&A activity.
» Documented methodology, applicable any of the 6,000 US banks.
» Results under baseline and stress scenarios.
Model forecasts off of authoritative industry dataSolution

Producing Objective Income & Balance Sheet Forecasts 23
Industry forecasts combined with forecasts of the bank’s market share produce more accurate bank-level projections of sales and volume
Modeling an Objective Forecast
Bank Data
Call Report
Forecasts
Market Share Model Share
Forecasts
Bank Forecasts
Call Report
Forecasts

Producing Objective Income & Balance Sheet Forecasts 24
Emphasis on internal forecast consistency across components
Taking a Granular Approach
Income Statements Assets Liabilities
• Net interest margin • Interest income • Interest expense • Non-interest income • Non-interest expense• Chargeoffs and Recoveries
• Total assets• Bank credit: Securities, C&I,
Mortgage, Consumer• Cash • Interbank loans • Trading gains
• Total liabilities • Deposits• Bank borrowing• Trading losses• Net due to related foreign
offices
» Ability to forecast performance for individual competitors and peer groups
» Ability to benchmark internally derived projections for bank specific portfolios

Producing Objective Income & Balance Sheet Forecasts 25
» Using only internal data embedded with subjective overlay may distort projections.
» Bank-level models more realistically assess bank-specific factors affecting portfolio.
» Industry models more accurately capture the effects of macroeconomic variables.
» Combining the industry- and bank-level models provide consistent, comparable forecasts across banks.
Summary

Producing Objective Income & Balance Sheet Forecasts 26
Q&AAdditional questions?
Send an email to [email protected]

Producing Objective Income & Balance Sheet Forecasts 27
Appendix

Producing Objective Income & Balance Sheet Forecasts 28
Key Features» 30-year horizon, for baseline forecast plus up to eight alternative scenarios
» Coverage of more than 1,800 economic, financial and demographic variables
» Available for 60+ countries globally
» Forecasts updated monthly, history updated in real-time
» Fully documented model methodology; scenario assumptions published monthly
» Model validation reports available
Reasonable and defensible forecastsMoody’s Analytics Scenarios
S1 S2 S3 S4BL S5 S6 S8 FED PRA EBA CU
MOODYS’ ANALYTICS BASELINE + S1-S8 EXPANDED REGUALTORY CUSTOM

moodysanalytics.com
Brian [email protected]
Alex LowyRegional Account [email protected]
Brian SimmonsAssociate [email protected]
Producing Objective Income & Balance Sheet Forecasts 30
© 2017 Moody’s Corporation, Moody’s Investors Service, Inc., Moody’s Analytics, Inc. and/or their licensors and affiliates (collectively, “MOODY’S”). All rights reserved.
CREDIT RATINGS ISSUED BY MOODY'S INVESTORS SERVICE, INC. AND ITS RATINGS AFFILIATES (“MIS”) ARE MOODY’S CURRENT OPINIONS OF THE RELATIVE FUTURE CREDIT RISK OF ENTITIES, CREDIT COMMITMENTS, OR DEBT OR DEBT-LIKE SECURITIES, AND MOODY’S PUBLICATIONS MAY INCLUDE MOODY’S CURRENT OPINIONS OF THE RELATIVE FUTURE CREDIT RISK OF ENTITIES, CREDIT COMMITMENTS, OR DEBT OR DEBT-LIKE SECURITIES. MOODY’S DEFINES CREDIT RISK AS THE RISK THAT AN ENTITY MAY NOT MEET ITS CONTRACTUAL, FINANCIAL OBLIGATIONS AS THEY COME DUE AND ANY ESTIMATED FINANCIAL LOSS IN THE EVENT OF DEFAULT. CREDIT RATINGS DO NOT ADDRESS ANY OTHER RISK, INCLUDING BUT NOT LIMITED TO: LIQUIDITY RISK, MARKET VALUE RISK, OR PRICE VOLATILITY. CREDIT RATINGS AND MOODY’S OPINIONS INCLUDED IN MOODY’S PUBLICATIONS ARE NOT STATEMENTS OF CURRENT OR HISTORICAL FACT. MOODY’S PUBLICATIONS MAY ALSO INCLUDE QUANTITATIVE MODEL-BASED ESTIMATES OF CREDIT RISK AND RELATED OPINIONS OR COMMENTARY PUBLISHED BY MOODY’S ANALYTICS, INC. CREDIT RATINGS AND MOODY’S PUBLICATIONS DO NOT CONSTITUTE OR PROVIDE INVESTMENT OR FINANCIAL ADVICE, AND CREDIT RATINGS AND MOODY’S PUBLICATIONS ARE NOT AND DO NOT PROVIDE RECOMMENDATIONS TO PURCHASE, SELL, OR HOLD PARTICULAR SECURITIES. NEITHER CREDIT RATINGS NOR MOODY’S PUBLICATIONS COMMENT ON THE SUITABILITY OF AN INVESTMENT FOR ANY PARTICULAR INVESTOR. MOODY’S ISSUES ITS CREDIT RATINGS AND PUBLISHES MOODY’S PUBLICATIONS WITH THE EXPECTATION AND UNDERSTANDING THAT EACH INVESTOR WILL, WITH DUE CARE, MAKE ITS OWN STUDY AND EVALUATION OF EACH SECURITY THAT IS UNDER CONSIDERATION FOR PURCHASE, HOLDING, OR SALE.
MOODY’S CREDIT RATINGS AND MOODY’S PUBLICATIONS ARE NOT INTENDED FOR USE BY RETAIL INVESTORS AND IT WOULD BE RECKLESS AND INAPPROPRIATE FOR RETAIL INVESTORS TO USE MOODY’S CREDIT RATINGS OR MOODY’S PUBLICATIONS WHEN MAKING AN INVESTMENT DECISION. IF IN DOUBT YOU SHOULD CONTACT YOUR FINANCIAL OR OTHER PROFESSIONAL ADVISER.
ALL INFORMATION CONTAINED HEREIN IS PROTECTED BY LAW, INCLUDING BUT NOT LIMITED TO, COPYRIGHT LAW, AND NONE OF SUCH INFORMATION MAY BE COPIED OR OTHERWISE REPRODUCED, REPACKAGED, FURTHER TRANSMITTED, TRANSFERRED, DISSEMINATED, REDISTRIBUTED OR RESOLD, OR STORED FOR SUBSEQUENT USE FOR ANY SUCH PURPOSE, IN WHOLE OR IN PART, IN ANY FORM OR MANNER OR BY ANY MEANS WHATSOEVER, BY ANY PERSON WITHOUT MOODY’S PRIOR WRITTEN CONSENT.
All information contained herein is obtained by MOODY’S from sources believed by it to be accurate and reliable. Because of the possibility of human or mechanical error as well as other factors, however, all information contained herein is provided “AS IS” without warranty of any kind. MOODY'S adopts all necessary measures so that the information it uses in assigning a credit rating is of sufficient quality and from sources MOODY'S considers to be reliable including, when appropriate, independent third-party sources. However, MOODY’S is not an auditor and cannot in every instance independently verify or validate information received in the rating process or in preparing the Moody’s publications.
To the extent permitted by law, MOODY’S and its directors, officers, employees, agents, representatives, licensors and suppliers disclaim liability to any person or entity for any indirect, special, consequential, or incidental losses or damages whatsoever arising from or in connection with the information contained herein or the use of or inability to use any such information, even if MOODY’S or any of its directors, officers, employees, agents, representatives, licensors or suppliers is advised in advance of the possibility of such losses or damages, including but not limited to: (a) any loss of present or prospective profits or (b) any loss or damage arising where the relevant financial instrument is not the subject of a particular credit rating assigned by MOODY’S.
To the extent permitted by law, MOODY’S and its directors, officers, employees, agents, representatives, licensors and suppliers disclaim liability for any direct or compensatory losses or damages caused to any person or entity, including but not limited to by any negligence (but excluding fraud, willful misconduct or any other type of liability that, for the avoidance of doubt, by law cannot be excluded) on the part of, or any contingency within or beyond the control of, MOODY’S or any of its directors, officers, employees, agents, representatives, licensors or suppliers, arising from or in connection with the information contained herein or the use of or inability to use any such information.
NO WARRANTY, EXPRESS OR IMPLIED, AS TO THE ACCURACY, TIMELINESS, COMPLETENESS, MERCHANTABILITY OR FITNESS FOR ANY PARTICULAR PURPOSE OF ANY SUCH RATING OR OTHER OPINION OR INFORMATION IS GIVEN OR MADE BY MOODY’S IN ANY FORM OR MANNER WHATSOEVER.
Moody’s Investors Service, Inc., a wholly-owned credit rating agency subsidiary of Moody’s Corporation (“MCO”), hereby discloses that most issuers of debt securities (including corporate and municipal bonds, debentures, notes and commercial paper) and preferred stock rated by Moody’s Investors Service, Inc. have, prior to assignment of any rating, agreed to pay to Moody’s Investors Service, Inc. for appraisal and rating services rendered by it fees ranging from $1,500 to approximately $2,500,000. MCO and MIS also maintain policies and procedures to address the independence of MIS’s ratings and rating processes. Information regarding certain affiliations that may exist between directors of MCO and rated entities, and between entities who hold ratings from MIS and have also publicly reported to the SEC an ownership interest in MCO of more than 5%, is posted annually at www.moodys.com under the heading “Investor Relations — Corporate Governance — Director and Shareholder Affiliation Policy.”
Additional terms for Australia only: Any publication into Australia of this document is pursuant to the Australian Financial Services License of MOODY’S affiliate, Moody’s Investors Service Pty Limited ABN 61 003 399 657AFSL 336969 and/or Moody’s Analytics Australia Pty Ltd ABN 94 105 136 972 AFSL 383569 (as applicable). This document is intended to be provided only to “wholesale clients” within the meaning of section 761G of the Corporations Act 2001. By continuing to access this document from within Australia, you represent to MOODY’S that you are, or are accessing the document as a representative of, a “wholesale client” and that neither you nor the entity you represent will directly or indirectly disseminate this document or its contents to “retail clients” within the meaning of section 761G of the Corporations Act 2001. MOODY’S credit rating is an opinion as to the creditworthiness of a debt obligation of the issuer, not on the equity securities of the issuer or any form of security that is available to retail investors. It would be reckless and inappropriate for retail investors to use MOODY’S credit ratings or publications when making an investment decision. If in doubt you should contact your financial or other professional adviser.
Additional terms for Japan only: Moody's Japan K.K. (“MJKK”) is a wholly-owned credit rating agency subsidiary of Moody's Group Japan G.K., which is wholly-owned by Moody’s Overseas Holdings Inc., a wholly-owned subsidiary of MCO. Moody’s SF Japan K.K. (“MSFJ”) is a wholly-owned credit rating agency subsidiary of MJKK. MSFJ is not a Nationally Recognized Statistical Rating Organization (“NRSRO”). Therefore, credit ratings assigned by MSFJ are Non-NRSRO Credit Ratings. Non-NRSRO Credit Ratings are assigned by an entity that is not a NRSRO and, consequently, the rated obligation will not qualify for certain types of treatment under U.S. laws. MJKK and MSFJ are credit rating agencies registered with the Japan Financial Services Agency and their registration numbers are FSA Commissioner (Ratings) No. 2 and 3 respectively.
MJKK or MSFJ (as applicable) hereby disclose that most issuers of debt securities (including corporate and municipal bonds, debentures, notes and commercial paper) and preferred stock rated by MJKK or MSFJ (as applicable) have, prior to assignment of any rating, agreed to pay to MJKK or MSFJ (as applicable) for appraisal and rating services rendered by it fees ranging from JPY200,000 to approximately JPY350,000,000.
MJKK and MSFJ also maintain policies and procedures to address Japanese regulatory requirements.