producing energy and fertilizer from organic municipal solid waste
TRANSCRIPT

Producing Energy and Fertilizer From Organic Municipal Solid Waste
Project Deliverable # 1
June 26, 2007
By Usama Zaher, Dae-Yeol Cheong, Binxin Wu, and Shulin Chen
Department of Biological Systems Engineering Washington State University
Ecology Publication No. 07-07-024

This report and the supporting database information can be accessed at:
http://www.ecy.wa.gov/programs/swfa/solidwastedata/
For additional copies of this document, contact:
Department of Ecology Solid Waste & Financial Assistance Program PO Box 47600 Olympia, WA 98504-7600 Telephone: (360) 407-6900
The Department of Ecology is an equal opportunity agency and does not discriminate on the basis of race, creed, color, disability, age, religion, national origin, sex, marital status, disabled veteran's status, Vietnam Era veteran's status or sexual orientation. If you need this publication in another format, please call the Solid Waste & Financial Assistance Program at (360) 407-6900. Persons with hearing loss can call 711 for Washington Relay Service. Persons with a speech disability can call 877-833-6341.

Producing Energy and Fertilizer From Organic Municipal Solid Waste
Project Deliverable # 1
June 26, 2007
By Usama Zaher, Dae-Yeol Cheong, Binxin Wu, and Shulin Chen
Department of Biological Systems Engineering Washington State University
Ecology Publication No. 07-07-024

i

Table of Contents Table of Contents......................................................................................................................... iList of Tables ............................................................................................................................. iii List of Figures ............................................................................................................................ iv
1. Executive Summary ..........................................................................................1 2. Introduction .......................................................................................................1
2.1. Definitions and History....................................................................................................2 2.2. Biochemical and Microbiological Principles of Anaerobic Digestion ............................4
2.2.1. Hydrolysis and Liquefaction................................................................................... 4 2.2.2. Acidogenesis ........................................................................................................... 4 2.2.3. Methanogenesis....................................................................................................... 5
3. Treatment System Strategies ...........................................................................6 3.1. Waste Material Characteristics ........................................................................................6 3.2. Typical MSW handling in Washington State ..................................................................6
3.2.1. Waste diversion and recycling ................................................................................ 7 3.2.2. Diverted wastes to composting sites ....................................................................... 7 3.2.3. Transfer to landfill Sites.......................................................................................... 7
3.3. Integrated MSW Treatment Systems ...............................................................................7 3.3.1. Feedstock Pre-/Post- processes ............................................................................... 9
3.4. Key Parameters in AD for Solid Waste .........................................................................11 3.4.1. pH ........................................................................................................................... 11 3.4.2. Temperature .......................................................................................................... 12 3.4.3. C/N ratio ................................................................................................................ 13 3.4.4. Mixing/Agitation ................................................................................................... 13 3.4.5. Retention Time ...................................................................................................... 14 3.4.6. Organic Loading Rate .......................................................................................... 15 3.4.7. Toxicity................................................................................................................... 16
4. Anaerobic Degradability of Waste ................................................................17 4.1. Hydrolysis Mechanism ..................................................................................................18 4.2. Aspects Related to Enzymatic Degradation...................................................................18 4.3. Aspects Related to Physical State and Structure of Substrate .......................................18 4.4. Assessment of Hydrolysis Rate .....................................................................................19 4.5. Co-Digestion with Animal Manure/ Digestion of MSW Alone ....................................20
5. Solids Digesters Classification........................................................................21 5.1. Wet versus Dry Systems ................................................................................................21 5.2. Batch versus Continuous Processes ...............................................................................21 5.3. Single versus Multi-Step Processes ...............................................................................22 5.4. Capacity and Orientation for AD of Solid Waste ..........................................................24 5.5. Single-Stage Systems.....................................................................................................25
5.5.1. Wet Single-Step Systems...................................................................................... 25 5.5.1.1. Full Scale Applications ................................................................................. 27 5.5.1.2. Biological Performance ................................................................................ 31 5.5.1.3. Impacts.......................................................................................................... 33
5.5.2. Dry Single-Stage systems ..................................................................................... 33
i

5.5.2.1. Full Scale Applications ................................................................................. 34 Biological Performance .................................................................................................... 40 5.5.2.2. Impacts.......................................................................................................... 41
5.6. The Proposed New Design of Single Stage HSAD System ..........................................42 5.7. Two-Stage Systems........................................................................................................43
5.7.1. Two Stage Systems without Biomass Retention .................................................. 45 5.7.1.1. Biological Performance ................................................................................ 46
5.7.2. Two Stage Systems with a Biomass Retention Scheme ....................................... 47 5.7.2.1. Biological Performance ................................................................................ 48
5.7.3. Full Scale Applications ......................................................................................... 49 5.7.3.1. Wet Two-Stage System................................................................................. 49 5.7.3.2. Dry Two-Stage, Two-Phase Process............................................................. 51
5.8. Batch Systems................................................................................................................53 5.8.1. Biological Performance ........................................................................................ 55 5.8.2. Impacts.................................................................................................................. 56
6. Economics of the High-Solids Anaerobic Digestion (HSAD)......................56 6.1. Performance of HSAD Applications .............................................................................57 6.2. Cost of Full Scale Plant Applications ............................................................................59
7. Model Based Comparisons.............................................................................60 7.1. The IWA ADM1 Model Description.............................................................................60 7.2. Importance of the Interface Development .....................................................................62 7.3. Implemented Interfacing Methods.................................................................................63
CBIM method. ...................................................................................................................... 63 Practical measurements......................................................................................................... 64 Ordered maximization of conversions .................................................................................. 65
7.4. Building the Model Transformation Matrix ..................................................................66 7.5. Validation of Substrate Conversion ...............................................................................67 7.6. High Solids Digestion Models .......................................................................................71 7.7. Virtual Case Studies.......................................................................................................72
7.7.1. Co-digestion Case Study....................................................................................... 73 7.7.2. Technology Selection Case Study ........................................................................ 74
7.8. Impact of the Developed Interface.................................................................................75 8. Review of CFD modelling concepts ...............................................................75
8.1. Modelling Digester Mixing............................................................................................75 8.2. Digester Energy Balance Concepts................................................................................76
9. Conclusions ......................................................................................................78 10. References ........................................................................................................80
ii

List of Tables
Table 1: Possible unit processes ..................................................................................................... 9 Table 2: Concentrations reported to be inhibitory cations to anaerobic microorganism............. 17 Table 3: Surface related hydrolysis rate assessed for different substrates................................... 19 Table 4: First order kinetic constant for hydrolysis of different materials ................................... 19 Table 5: Examples of co-digestion presented. .............................................................................. 20 Table 6: Reports other studies of the performance of anaerobic digestion of solid wastes ......... 24 Table 7: Advantages and disadvantages of existing high solids systems and the new design ..... 43 Table 8: Advantages and disadvantages of two stage systems . ................................................... 44 Table 9: Advantages and disadvantages of batch systems............................................................ 54 Table 10: Major 10 High Solids Plants Providers ........................................................................ 56 Table 11: Plants included in the economic survey........................................................................ 58 Table 12: HSAD Plants performance ........................................................................................... 58 Table 13: Investment of HSAD plants.......................................................................................... 59 Table 14: Schematic presentation of the interface transformation matrix ................................... 63 Table 15 Basic structures assumed for ADM1 ............................................................................. 64 Table 16: Theoretical COD per element, charge and assumed covalent bond ............................. 65 Table 17: Significantly small errors achieved with the continuity .............................................. 66 Table 18: Balance of covalent bond overall conversion............................................................... 67 Table 19: Manure wastes’ characteristics ..................................................................................... 67 Table 20 : Food wastes characteristics and measured lipids, proteins and carbohydrates .......... 68
iii

List of Figures Figure 1: Scheme of anaerobic metabolism pathways.................................................................... 5 Figure 2 MSW production in Washington State............................................................................. 6 Figure 3: Integrated scheme for MSW treatment and High solids digestion (Vandeviviere et al., 2002). .............................................................................................................................................. 8 Figure 4 Typical design of a one-stage 'wet' system (Vandeviviere et al., 2002). ....................... 26 Figure 5 Vagron Wet Single-Stage digestion facility ................................................................... 28 Figure 6: The Vagron Facility mass balance ................................................................................ 28 Figure 7: Grindsted Waste Shredder............................................................................................. 29 Figure 8: Grindsted, Denmark (Krüger Biosolid System) ............................................................ 30 Figure 9: Holsworthy, United Kingdom (Farmatic) ..................................................................... 30 Figure 10 : Kompogas Dry Digester............................................................................................. 34 Figure 11: Installation at Niederuzwil, Switzerland, Kompogas system...................................... 35 Figure 12: Kompogas heat exchanger........................................................................................... 35 Figure 13: Kombogas fiber separation.......................................................................................... 36 Figure 14: Linde-BRV solids digestion system............................................................................ 36 Figure 15: Linde BRV extracting system ..................................................................................... 37 Figure 16: Lemgo feedstock chopper (Calibrator)........................................................................ 37 Figure 17: Dranco Solids Digester Installation at Aarburg, Switzerland ..................................... 38 Figure 18: Valorga system installation at Geneva, Switzerland ................................................... 39 Figure 19: Compressed Biogas Mixing of the Valorga System ................................................... 40 Figure 20 Proposed new design scheme ....................................................................................... 42 Figure 21: The Schwarting-Uhde process, a two-stage 'wet-wet' plug-flow system.................... 45 Figure 22: Two-stage 'wet-wet' design with a biomass retention scheme in the second stage (BTA process). The non-hydrolyzed solids are not sent to the second stage. .............................. 48 Figure 23 BTA Wet Two Stage system installation at Kirchstockach, Germany ........................ 49 Figure 24: The treatment scheme for the BTA system................................................................. 50 Figure 25: Linde-KCA-Dresden wet two stage system. ............................................................... 50 Figure 26: the Linde-KCA-Dresden at Wels, Austria .................................................................. 51 Figure 27: ISKA Dry Two-Stage Two-Phase system at Buchen, Germany................................. 52 Figure 28 The first stage of percolation at Buchen, Germany...................................................... 52 Figure 29: Internal view of the percolator .................................................................................... 53 Figure 30: Configuration of leachate recycle patterns in different batch systems........................ 55 Figure 31 COD flux for a particulate composite comprised of 10% inerts, and 30% each proteins, carbohydrates and fats (in terms of COD). Propionic acid (10%), butyric acid (12%) and valeric acid (7%) are grouped in the diagram for simplicity (Batstone et. al, 2002). ............ 61 Figure 32: Schematic diagram of a typical single-tank digester (Batstone et al, 2002) .............. 62 Figure 33: Comparison of the interface results and reported values of carbohydrates and proteins in different types of manures. ....................................................................................................... 70 Figure 34 Interface estimates of carbohydrates, proteins and lipids in different food waste types compared to analysis reported by (Buffiere et al., 2006) ............................................................. 71 Figure 35: Models for existing high solids digesters designs (A illustrates the Dranco design, B the Kompogas and BRV designs, and C the Valorga design) ...................................................... 71 Figure 36: HRT and COD load for co-digestion and technology selection case studies.............. 73 Figure 37 comparison of digestion of dairy manure and co-digestion with food waste............... 73 Figure 38: Comparison of the existing designs of high solids reactors treating dairy manure..... 74 Figure 39: Heat and energy balance for the digester .................................................................... 77
iv

1. Executive Summary The earlier collaborative effort between Washington State University (WSU) and the Washington Department of Ecology (Ecology) (www.ecy.wa.gov/pubs/0507047.pdf) has identified municipal solid waste as a major biomass in the state. With directed funding from the State, WSU and Ecology established a new partnership under Inter Agency Agreement C-0700136 to explore the beneficial uses of the waste material. This project was proposed to produce fuel and fertilizer from the organic fraction of municipal solid waste (OFMSW) through the application/development of anaerobic digestion technology. The purpose of this project is to develop a design of an effective high solids anaerobic digestion (HSAD) system that is ready for pilot test. The design will be tested on a bench scale to demonstrate the potential of biogas and nutrients recovery from various types of organic municipal wastes. This project includes five objectives: (1) evaluation and review of existing HSAD designs, (2) bench scale trials and validation, (3) development of modeling tools for evaluation and development of high solids digestion systems, (4) developing a technology for enhancing the anaerobic bacterial population in the high solids digestion, and (5) design of a pilot digester. This report is the first deliverable of the project. In this report, a complete literature review of existing anaerobic digestion in general and High Solids Anaerobic Digestion (HSAD) technology in particular is presented. A general comparison of strengths and weaknesses of current designs was made using reported performance data and model simulation as well as through consideration of the technical, biological, and economical aspects of their applications. The primary performance indicators used are biogas production per unit of volume of the digester and capital cost per ton of waste treated. This review covered all HSAD types as well as required pre- and post-treatment. Different full-scale plant types were classified according to types of anaerobic reactors. Major manufactures as well as full scale applications were listed. Most of the full scale installations are in European countries. A new design was proposed with its main features illustrated in comparison with the most efficient existing systems defined. A new modeling methodology was developed to define the plant feedstock composition using practical analytical parameters. The usefulness of the methodology was illustrated by two simulation studies. The first study was for treating a mixture of two waste types. The second study was for comparison of three reactor designs. The modeling work was extended by reviewing the computational fluid dynamic concepts to model HSAD mixing and energy balance since they were found to be of great importance during the HSAD review. 2. Introduction To protect human health and decrease threats to air, land, and water quality, Washington State Department of Ecology (Ecology) is focused on reducing solid waste and safely managing what remains. Ecology’s 2004 Beyond Waste Plan specifically calls for actions to “…transition to a society that views wastes as inefficient uses of resources and believes that most wastes can be eliminated. Eliminating wastes will contribute to environmental, economic and social vitality.” This report is the first deliverable to the Washington State Department of Ecology (Ecology) under Inter-Agency Agreement C-0700136 establishing a Partnership between The State of Washington Department of Ecology and Washington State University, Project 2. This project is being conducted by funding from the State of Washington, for Waste to Fuels Technology Assessment as provided under the 2006 Supplemental Budget.
1

This High Solids Anaerobic Digestion (HSAD) project seeks to combine Ecology and WSU resources to create a promising sustainable system for high solids, organic waste anaerobic digestion that will produce energy, recover fertilizer, and provide organic materials that could prove beneficial in composting and eventual use in creating high fertility soils for gardeners, and agriculture from organic municipal solid waste. This system will reduce the Organic Fraction of Municipal Solid Waste (OFMSW) and provide an economic and renewable source of energy and fertilizer. As a first year mid-year deliverable on the project this report serves as a literature review of anaerobic digestion concepts and existing technology of high solids digestion to treat OFMSW. The existing technology will be compared according to reported performance, impacts and economics of full scale application. Process modeling techniques are developed and applied to support this comparison. Modeling concepts of mixing and energy balance as crucial aspects of anaerobic digestion are also reviewed to highlight their importance and how they will be tackled in the future project tasks. 2.1. Definitions and History Digestion is a process by which organic material is dissolved and chemically converted so that it can be absorbed by the cells of an organism and used to maintain body functions. As a result, complex carbohydrates (e.g., cellulose and starch), lipids, fibers, and proteins, are converted into simpler compounds (e.g. sugars, glycerin and fatty acids, and amino-acids) before being assimilated into cells. During digestion, these organic compounds are reduced by hydrolytic enzymes, such as cellulase, protease, and lipase, secreted by bacteria and glands, which split the long molecular chains into monomer units (Droste, 1997; Parkin and Owen, 1986; Speece, 1996). The process of anaerobic digestion (AD) employs specialized bacteria to break down organic waste, converting it into biogas, a mixture of carbon dioxide and methane, and a stable biomass. AD normally produces ten times less refractory biomass than aerobic treatment. Under anaerobic conditions, a considerable portion of the chemical oxygen demand (COD) is converted to methane gas as an end product. Methane is a potential energy source, thereby lessening the waste biomass disposal requirements and the financial burden associated with disposal considerably. Biogas produced from AD has been promoted as a part of the solution to energy problems. Methane contains about 90% of the energy with a calorific value of 9000 kcal /m3 and can be burned on site to provide heat for digesters or to generate electricity. Little energy (3-5%) is wasted as heat in the biological process (Saham, 1984; Speece, 1996). AD dates back as far as the 10th century, when the Assyrians used it to heat bath water. It was historically insignificant before reappearing in 17th century Europe, when it was determined that decaying organic matter produced flammable gasses, again was again used to heat water (Mahony et al., 2002). The first full scale application was in the 1890s when the city of Exeter, UK used AD to treat wastewater. From there, it continued to be widely used as a way to stabilize sewage sludge, as it is today. The first systems were large, unheated and unmixed tanks with significant operational problems due to solid settling and scum formation. These frequent system
2

disturbances limited the adoption of the technology until the twentieth century (Stronach, 1986; Lusk, 1998). The development of the field of microbiology in the 1930s allowed scientists to identify that the mechanism of gas production depended on anaerobic bacteria. Subsequent experiments were carried out to determine the optimal environmental conditions for gas production. As a result, heated and mixed digesters of increasing complexity came to the market in the middle of the twentieth century in Europe. The first commercial applications were on farms where manure was digested to produce heat and later electricity. As the knowledge base expanded, AD was employed to treat other farm wastes, wastewater, industrial organics, and finally Municipal Solid Waste (MSW), though the predominant use continues to be on farms. The energy crises in the 1970s prompted American research into alternative energy strategies, and AD was one such option. This push resulted in the first farm digester built in America in 1970 where the biogas could be used for heat and power (Lusk, 1999). At present, development continues on farms as well as wastewater treatment plants, where anaerobic processes and subsequent gas recovery are an industrially-mature technology. Recent developments in AD technology worldwide are in the treatment of industrial wastes and wastewater. The current designs of the AD systems reflect the need for shorter hydraulic retention times, higher retention of biomass, smaller reactor volume and higher loading rates, indicative of their urban locations. The companies benefit by using the biogas produced, reducing odor and the volume of sludge produced, as well as sanitizing the wastes. Germany and Denmark, where environmental legislation concerning waste disposal is stringent, lead the way. Although some private industrial facilities in the United States do choose to treat industrial effluent using AD, its application is not as widespread as in most other developed world countries (Lettinga, 1995; Switzenbaum et al., 1990). The solid waste and other biodegradable solid substrates should be treated to reduce their environmental impact and to recover energy while massive disposal treatments (e.g., landfill, incineration) are avoided. However, the treatment of solid waste using AD adds several new challenges because of the variety in the feedstock and the space limitations where such facilities would be located. The organic fraction of MSW (OFMSW) may contain agricultural, food, yard waste, or paper in varying concentrations, sizes, and composition. Furthermore, MSW is contaminated with non-organics, such as glass and metal, and therefore requires pre-treatment to separate the feedstock (Bilzonella et al., 2005; Castillo et al, 2006).Though the ideal waste stream for an AD plant would be source-separated organics, the reality is that there is always a small degree of contamination that must be handled on site. Despite these challenges, European nations have led the way in expanding AD to be a significant part of OFMSW management. Over 50 plants process MSW either alone or with sewage in Germany, Denmark, France, Spain, Austria, Holland, England, Belgium, and other European nations. Several types of digesters process between 50,000 and 80,000 tons of organic wastes (e.g., source separated biowastes, mixed grey wastes) per year, with the largest treating 100,000 tons, annually (De Baere, 2000; van Lier et al., 2001). Some plants accept mixed MSW, for example the Vagron plant, which treats 232,000 tons of mixed waste per year, 92,000 tons of which are organics (Grontmij, 2004). While anaerobic digestion of OFMSW is relatively well
3

established in other nations, especially in Europe, it remains an undeveloped or developing technique in the United States (van Opstal, 2006a). Future development of AD as a MSW management strategy in the United States depends on several parameters ranging from environmental concerns to economic considerations. Variables that impact MSW AD project development in the US include: increased process efficiency, reduced digester operation costs, higher and more stable gas production, recovery of marketable co-products, expanding markets for energy, co-products and final solids uses, and competitive economics compared to composting, landfill, or incineration. It seems that AD systems will continue to play a major role to decompose MSW organics in other nations while the extent of US application of AD on MSW is still to be determined. 2.2. Biochemical and Microbiological Principles of Anaerobic Digestion The AD process is accomplished through biological conversion of organics to methane and carbon dioxide in an oxygen-free environment. The overall conversion process is often described as a three-stage process which may occur simultaneously in an anaerobic digester. These stages are: (1) hydrolysis of insoluble biodegradable organic matter; (2) production of acid from smaller soluble organic molecules; and (3) methane generation. The three-stage scheme involving various microbial species can be described as follows: (1) hydrolysis and liquefaction; (2) acidogenesis; and (3) methane fermentation. 2.2.1. Hydrolysis and Liquefaction Hydrolysis and liquefaction are the breakdown of large, complex, and insoluble organics into small molecules that can be transported into microbial cells and metabolized. Hydrolysis of the complex molecules is catalyzed by extra-cellular enzymes such as cellulase, protease and lipase. Hydrolysis may be conducted using separate aerobic, thermal, chemical, or enzymatic means. Essentially, organic waste stabilization does not occur during hydrolysis; the organic matter is simply converted into a soluble form that can be utilized by the bacteria (Parkin and Owen, 1986). 2.2.2. Acidogenesis The acidogenesis stage is a complex phase involving acid-forming fermentation, hydrogen production and an acetogenic (acetic acid-forming) step. Once complex organics are hydrolyzed, acidogenic (acid-forming) bacteria convert sugars, amino acids and fatty acids to smaller organic acids, hydrogen, and carbon dioxide. The products formed vary with the types of bacteria as well as with environmental conditions. The community of bacteria responsible for acid production may include facultative anaerobic bacteria, strict anaerobic bacteria, or both (e.g. Bacteroides, Bifidobacterium, Clostridium, Lactobacillus, Streptococcus). Hydrogen is produced by the acidogenic bacteria including hydrogen-producing acetogenic bacteria. Acetogenic bacteria such as Syntrobacter wolini and Syntrphomonas wolfei convert volatile fatty acids (e.g. propionic acid and butyric acid) and alcohol into acetate, hydrogen, and carbon dioxide, which are used in methanogenesis. These microorganisms are related and can tolerate a wide range of environmental conditions. Under standard conditions, the presence of hydrogen in solution inhibits oxidation, so that hydrogen bacteria are required to endure the conversion of all acids (Novaes, 1986; Parkin and Owen, 1986).
4

2.2.3. Methanogenesis The formation of methane, which is the ultimate product of anaerobic treatment, occurs by two major routes. Formic acid, acetic acid, methanol, and hydrogen can be used as energy sources by the various methanogens. The primary route is the fermentation of the major product of the acid forming phase, acetic acid, to methane and carbon dioxide. Bacteria that utilize acetic acid are acetoclastic bacteria (acetate splitting bacteria). The overall reaction is: CH3COOH → CH4 + CO2 The acetoclastic group comprises two main genera: Methanosarcina and Methanothrix. During the thermophilic digestion of lignocellulosic waste, Methanosarcina is the dominant acetoclastic bacteria encountered in the bioreactor. About two-thirds of methane gas is derived from acetate conversion by acetoclastic methanogens. Some methanogens use hydrogen to reduce carbon dioxide to methane (hydrogenophilic methanogens) according to the following overall reaction (Novaes, 1986; Morgan et al., 1991): 4H2 + CO2 → CH4 + 2H2O A basic outline of the pathways of anaerobic metabolism is given as Figure 1. Under most circumstances in treating solid wastes, acetate is a common end product of acidogenesis. This is fortunate because acetate is easily converted to methane in the methanogenic phase. Due to the difficulty of isolating anaerobes and the complexity of the bioconversion processes, much still remains unsolved about anaerobic digestion (Hansen and Cheong, 2007).
Complex polymers
Cellulose, Other polysaccharides, Proteins, Lipids
Monomer
CO2 + H2 AcetatePropionateButyrateEthanol
Simple sugarsAmino acidsFatty acids
Acidogens Acidogenesis
Acetate
AcetogenesisHomoacetogens
CH4Methanogens
CO2 +H2 AcetateHomoacetogens
MethanogensMethanogenesis
Methanogens Acidogens Acidogenesis
Figure 1: Scheme of anaerobic metabolism pathways
5
3. Treatment System Strategies 3.1. Waste Material Characteristics The organic fraction of MSW is typically a non-homogeneous substrate and the biogas yield in the AD treatment of OFMSW is dependent not only on the system configurations and operational conditions, but also on the organic material’s characteristics. The content of lignocellulosic material, for example, determines the biogas potential and biodegradability while the C/N ratio is another important parameter in estimating nutrient deficiency and cation inhibition. One of the largest determining factors for solid waste’s characterization is the collection system. Source sorting of MSW generally provides OFMSW of higher quality, in terms of smaller quantities of non-biodegradable contaminants like plastics, metals, and glass. Mechanically separated OFMSW leads to a more contaminated strea, which leads to persistent handling problems and lower acceptability of the effluent product of the treatment process used as fertilizer on agricultural land (Castillo et al., 2006; Hartmann and Ahring, 2006). Municipal solid waste is typically composed of:
• Digestible organic fraction: readily biodegradable organic matter, e.g. kitchen scraps, food residue, food processing wastes, grass cuttings, etc.
• Low or non-digestible organic fraction: slowly digestible organic matter such as coarser wood, paper, and cardboard. These are lignocelluloses which are not readily degradable solely under anaerobic treatment.
• Inert fraction: stones, glass, sand, metal, etc. Some of these products such as the metals, and rock are suitable for recycling to the metal re-claimers or as construction materials. The remainder must be disposed.
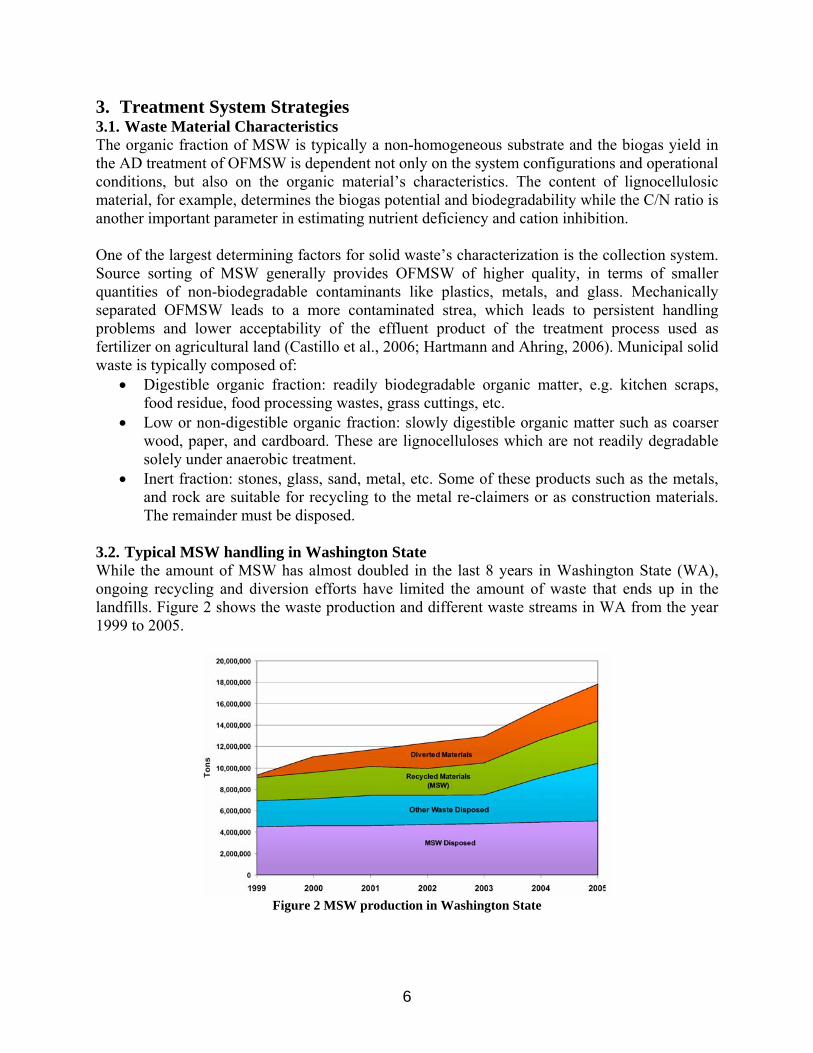
3.2. Typical MSW handling in Washington State While the amount of MSW has almost doubled in the last 8 years in Washington State (WA), ongoing recycling and diversion efforts have limited the amount of waste that ends up in the landfills. Figure 2 shows the waste production and different waste streams in WA from the year 1999 to 2005.
Figure 2 MSW production in Washington State
6

Enhanced diversion and recycling not only allow for the extended lifespan of the existing landfills, but also allows for enhanced supply of better sorted OFMSW for the high solids digester. 3.2.1. Waste diversion and recycling At the source, recyclables, such as paper and glass, are separated from the main waste and collected in separate containers. Containers are picked up at the curb side. Recyclables are sent to recycling facilities. The remaining wastes are sent to transfer stations where they are shipped landfills. Presently, some municipalities and counties in Washington State are instigating or in the planning stages of instigating source separation of food waste. This food waste could be a primary feedstock for the high solids digester treating the OFMSW. This source separated food waste may come from residential curb-side separation or industrial/commercial separation. In both cases, contamination from plastic bags, cardboard boxes and other inorganic items is an issue. 3.2.2. Diverted wastes to composting sites As diversion practices increase in the state, and in particular, as they increase in regard to collection of source separated residential and commercial food waste, regional composting facilities are becoming one of the major processors of the material. Several concerns do arise though in regard to the practice of composting this highly organic fraction of food waste. The first concern is the burden that arises from the composting of this volatile material which can result in considerable increases in odor. The second concern is making sure that the compost facilities are set-up to not only handle these new odor issues, but are they capable of handling the large increases in flow to the facility. A last and vital concern to this study is whether or not composting which results in release of volatile carbon without energy production is the best suited stabilization practice for such a volatile material. A potential alternative for this highly volatile fraction of OFMSW, which is composed mainly of food waste, is to have it be anaerobically digested to convert the high organic content to energy and recover its nutrient content as fertilizer (perhaps through downstream composting) as is the aim of this current project. However, the waste still contains large particles and non-organic streams such as plastic bags …etc. These fractions require mechanical processing such as grinding, shredding and screening before feeding the HSAD but no system will be able to remove all of this material. Thus, the HSAD system should be able to handle some of these waste fractions that escape the mechanical processing.
3.2.3. Transfer to landfill Sites The remaining waste is sent to landfills through transfer stations. At each transfer facility there are containers where the public can still bring in recyclable material or dispose harmful wastes. The waste is either delivered by public or by collection trucks. Loaders then push the waste toward an intake where waste is compressed and packed in containers. The containers are trucked or transferred to a transfer train station where the containers are sent to landfills.
3.3. Integrated MSW Treatment Systems Vandeviviere et al. (2002) listed specific pre- or post-treatment unit processes, as shown in Figure 3. A plant treating municipal solids anaerobically is therefore best seen as a complex train
7

of unit processes whereby wastes are transformed into a dozen products. Appropriate rating of given reactor designs should therefore also address the quantity and quality of these products as well as the need for additional pre- and post-treatments. These considerations are often decisive factors for the selection of a technology for an actual project. The most important parameters for classification of existing reactor designs are the number of treatment stages and the concentration of total solids (% TS) because these parameters have a great impact on the cost, performance and reliability of the digestion process. Table 1 summarizes the main treatment stages, their corresponding products, and the standards used to evaluate these products.
Figure 3: Integrated scheme for MSW treatment and High solids digestion (Vandeviviere et al., 2002).
8

Table 1. Possible unit processes, products and quality standards involved in an anaerobic digestion plant for organics solids, adapted from (Vandeviviere et al., 2002)
Unit processes Reusable products Standards or criteria PRE-TREATMENT - Magnetic separation - Size reduction (drum or shredder) - Pulping with gravity separation - Drum screening - Pasteurization
- Ferrous metals - Heavy inerts reused as construction material - Coarse fraction, plastics
- Organic impurities - Combination of paper, cardboard and bags - Germs die off
DIGESTION - Hydrolysis - Methanogenesis - Biogas utilization
- Biogas - Electricity Heat (steam)
- nitrogen and sulfur contents - 150 - 300 kWh elec /ton 250 - 500 kWh heat /ton
POST-TREATMENT - Mechanical dewatering - Aerobic stabilization or Biological dewatering - Water treatment - Biological dewatering - Wet separation
- Compost - Water - Sand, Fibres (peat), Sludge
- soil amendments - Water treatment load - Disposal regulations - Organic impurities
3.3.1. Feedstock Pre-/Post- processes There are a variety of pretreatment processes that are chosen based on the characteristics of the incoming waste and the effects they have on AD. This is of particular importance to improve the performance of digesters treating solid wastes. There is an obvious link between successful pretreatment and improved yields. By means of efficient pretreatment the suspended solids can be made more accessible for the anaerobic microbial consortium, optimizing the methanogenic potential of the solid waste to be treated. The most promising pre-treatment process is source separation. This provides an immediate clean waste stream that will have some residual plastics with the greatest portion of the waste being clean and ready to digest. The Cities of Seattle and Portland OR as well as San Francisco have curbside food waste collection programs operating or in the process of being implemented. Separation technologies for metals, glass, and plastic are usually necessary and similar to those used in material recovery facilities. The enhancement of the biodegradability of a particular substrate is mainly based on a better accessibility of the substrate for enzymes (Vavilin et al., 2002; Vavilin and Angelidaki, 2004). These pretreatments can be biological, mechanical, thermo-chemical or physico-chemical (Mata-Alvarez et al., 2000; van Lier et al., 2001). There are several ways in which this can be accomplished. Mechanical methods: The disintegration and grinding of solid particles represent mechanical pretreatment that reduces the size and the solid content of the digester feedstock. As a result, the amount of soluble organics increases in the digester influent. Shredding, pulping, crushing, or
9

otherwise reducing the particle size of the waste allows bacteria access to a greater surface area and therefore reduces the retention time required for the treatment. Diluting the waste with water also allows the bacteria to move more freely inside the digester (Mata-Alvarez et al., 2000). Sometimes the recovery of recyclable materials is done simultaneously in preparing the organic suspension. Engelhart et al. (1999) studied the effects of mechanical disintegration (by a high-pressure homogenizer) on anaerobic biodegradability of sewage sludge. A 25% increase in volatile solids reduction was achieved. Investigations of degradation of soluble proteins and carbohydrates showed that a slowly degradable fraction of carbohydrates was released via disintegration. In another study, Hartmann et al. (1999) found an increase of up to 25% in biogas from fibers in manure feedstock, after pre-treatment of the whole feed in a macerator before digestion. The function of the macerator is to suction the solids and liquids from the lines connected to the holding tanks and grind the solids effluent with the rotating cutter head down to a small particle size for simple discharge. In the BTA process, for example, a hydropulper sorts incoming MSW into heavy and light fractions of non-organic material as well as creating mixed organic waste (Hartmann et al., 2004; Kopp et al., 1997). In another process, a method of jetting the waste into a collision plate has been tried in order to rupture bacterial cell membranes, form soluble waste, and accelerate the availability of useable substrate. This was found to speed up the process of hydrolysis and reduce solids retention time without major effects on process efficiency and effluent quality. It also enhanced volatile mass reduction, which was attributed to the destruction of solids during pretreatment and increased gas production (Kim et al., 2003; Nah et al., 2000). Chemical methods: The destruction of complex organic compounds by means of strong mineral acids or alkalis changes the composition of waste by reducing particulate organic matter to more hydrolysable form, i.e. proteins, fats, carbohydrates or lower molecular weight compounds (Karlsson and Goranssonh, 1993). Chemical pretreatment has been tried in a variety of temperature regions, from 35 to 225°C and over a variety of time periods, from 15 to 120 minutes. These strategies particularly help with the degradation of fats, which is troublesome because of their insolubility in water and their semi-solidification. For fats hydrolysis, they must be emulsified to enhance their bioavailability in water (Mukherjee and Levine, 1992). Pretreatment with sodium hydroxide, lithium hydroxide or potassium hydroxide increases the hydrolysis rate. Thermo-chemical methods: Decomposing a significant part of the sludge solid fraction into soluble and less complex molecules improves hydrolysis and promotes solubility. Ultrasonic disintegration: Ultrasonic pretreatment also has been researched and has been shown to reduce retention time. Enzymatic and microbial methods: Enzymatic and microbial pretreatment are very promising methods for the future for some specifications (e.g., cellulose, lignin, etc). Stimulation of anaerobic microorganisms: Some organic compounds (e.g., amino acids, cofactors, cell content) act as a stimulating agent in bacterial growth and methane reduction.
10

The most applicable characteristics of AD feedstock are used when the organic fraction can be collected at the source of generation (e.g., food processing industries, pulp and paper mills, etc.). In addition to the low degree of contamination, there is a more consistent composition of the waste over time that makes it easier to achieve a steady level of biogas production. This is optimal for conversion into a useful energy by-product. Most of the above methods accelerate or improve the methane production steps and result in a better supply of methanogenic bacterial communities by suitable organics. The exact composition of the substrate is a major importance for the selection of the most appropriate pretreatment method (Kim and Park, 2003). In practice, designers recognize that a significant advantage of AD is its easy operation, owing in part to near-room temperatures and low pressures. The most common pretreatment, therefore, is simple and proven. Mechanical separation can be used to separate an organic fraction of the waste if source separation is not available as will be described in detail later. 3.4. Key Parameters in AD for Solid Waste The complete process of AD requires a complex interaction of several varieties of anaerobic bacteria that must be in equilibrium in order for the digester to remain stable. Anaerobic treatment is affected by a variety of environmental factors, and changes in operational conditions can disturb the equilibrium and result in the buildup of intermediaries that may inhibit the overall process or even shut it down. Several parameters within the anaerobic digester affect the physical environment and therefore the efficiency of digestion and biogas production potential. AD facility operators must monitor the following parameters within acceptable ranges: pH, temperature, C/N ratio, retention time, organic loading rate, bacterial competition, nutrient content, toxicants, solids content, and mixing/agitation. The optimum ranges and importance of these critical factors are described below. 3.4.1. pH The pH varies in response to biological conversions during the different processes of AD. At low total alkalinity of waste, a stable pH indicates system equilibrium and digester stability. A falling pH can point toward acid accumulation and digester instability. The optimum pH range for methanogenic bacteria is between 6 and 8, but the optimum pH for the group as a whole is near 7. Many studies report that the pH required in AD for good performance and stability is in the range of 6.5-7.5, although stable operation has been observed outside this range. The anaerobic process may fail if the pH is close to 6. The greatest potential for anaerobic digester failure is a result of acid accumulation. This would occur if the amount of VS loaded into the digester as organic waste increased sharply. Acidogenic bacteria produce organic acid, which tend to lower the pH of the anaerobic digester. The acidogenic bacteria then thrive, producing high volumes of organic acids and lowering the pH to below 5.0, a level lethal to methanogens. Under normal conditions, this pH reduction is buffered by the bicarbonate produced by methanogens. Under adverse environmental conditions, the buffering capacity of the system can be upset, eventually stopping the production of methane. An increase in volatile acids thus serves as an early indicator of AD system upset. Therefore, excess alkalinity or ability to control pH must be available to guard against the accumulation of excess volatile acids. AD can operate over a wide range of volatile acid concentrations if proper control is maintained (Anderson and Yang, 1992; Parkin and Owen, 1986). On the other hand, prolific methanogenesis may result in a higher concentration of ammonia, increasing the pH above 8.0, where it will impede acidogenesis (Lusk, 1999). This can be controlled by adding a greater amount of fresh feedstock, which will spur acidogenesis and acid formation.
11

Maintaining pH is especially delicate in the start-up phase because organic waste must undergo acid forming stages before any methane forming can begin, which will lower the pH. To raise the pH during the early stages, operators must add a buffer to the system. The same procedure is followed when the pH drops during operation, for example due to increased loading rate. It is the responsibility of an operator, therefore, to keep bicarbonate alkalinity as high as possible in order for the pH to remain high enough for methanogens to survive. The common materials used to increase the alkalinity are lime, soda ash, ammonia, ammonium bicarbonate, sodium hydroxide, or sodium bicarbonate. Generally lime, sodium hydroxide, and ammonia are the least expensive of these chemicals (Anderson and Yang, 1992; Parkin and Owen, 1986). An advantage of adding alkali is that it induces swelling of particulate organics, making the cellular substances more susceptible to enzymatic attack (Vlyssides and Karlis, 2004). In some case automatic pH control is considered more economical than adding pH chemicals in a random manner because fewer chemicals are consumed. 3.4.2. Temperature Due to the strong dependence of anaerobic digestion rate on temperature, this is perhaps one of the most critical parameters to maintain in a desired range. Traditionally, AD was applied in the mesophilic temperature range. The optimum temperature for mesophilic digestion is 35°C (95°F) and a digester must be maintained between 30°C and 37°C for most favorable functioning. Bacteria operating in the mesophilic range are more robust and can tolerate greater changes in the environmental parameters, including temperature. Temperature fluctuations can be extreme in smaller digesters, poorly insulated digesters, or digesters in cold climates, suggesting that these would benefit by being run in the mesophilic range to minimize system crashing. The stability of the mesophilic process makes it more popular in current AD facilities, but requires longer retention times. Thermophilic digestion allows higher loading rates and achieves a higher rate of pathogen destruction as well as a higher degradation of the substrate and smaller digester size at lower capital cost (Mackie and Bryant, 1995). It is, however, more sensitive to toxins and smaller changes in the environment and is less attractive from an energy point of view since more heat is needed for the process. Furthermore, thermophilic cultures require a month or more to establish a population. If thermophilic wastewater AD treatments are rarely used, it probably can be attributed to the conflicting and sometimes disappointing results. Another disadvantage is the energy required to heat the influent to reactor temperature (Parkin and Owen, 1986; van Lier et al., 1996). Over the past 15 years, however, more and more biogas plants have been established and currently most of the centralized biogas plants in Western Europe are operated under thermophilic conditions. Thermophilic AD operation to treat MSW offers the advantage of a higher reaction rate, yielding a more profitable process with a lower retention time. Comparison of mesophilic and thermophilic digestion of OFMSW, for high-solids digestion of OFMSW and for the co-digestion of OFMSW and sewage sludge, found that the biogas production at thermophilic conditions, with a hydraulic retention time (HRT) of 12 days, was around double the biogas production at mesophilic conditions with a HRT of 15 days. This surplus in gas production was enough to compensate for the additional energy consumption required to heat the digester. The change from mesophilic to thermophilic conditions was achieved over 2 months without particular evidence of digester instability (Cecchi et al., 1991,
12

1992; Hansen et al., 2006). In general, the thermophilic semi-dry anaerobic digestion process was shown to be very robust and was able to buffer these variations, reaching new static reactor temperature conditions within a week. Thermophilic operation leads to a better pathogenic microorganism reduction of the waste material than mesophilic treatment. Fecal coliforms could not be detected in the effluent of the thermophilic DRANCO process whereas the original waste contained 3,103 CFU/g TS (CFU: colony forming units) (Six and De Baere, 1992). Scherer et al. (2000) also studied single-stage and multi-stage reactor configurations operated under thermophilic and hyperthermophilic conditions. Besides the reduction of pathogenic organisms, the volatile solid (VS) reduction was highest in the combination of a hyperthermophilic (60-70°C) first-stage and a thermophilic second-stage reactor compared to a conventional thermophilic reactor (55°C). Temperature is carefully monitored in all modern MSW AD facilities through temperature probes at various locations in the digester. Anaerobic digester heat is lost through convection or radiation to the surroundings or through the formation of water vapor. Temperature can be maintained through insulation or water baths. Heat can be added using heat exchangers in the recycled slurry or heating coils or steam injection directly into the anaerobic digester. 3.4.3. C/N ratio The Carbon/Nitrogen (C/N) ratio is a measure of the relative amounts of organic carbon and nitrogen present in the feedstock. The C/N ratio of the collected waste is determined by its composition. If the C/N ratio of OFMSW is very high, the waste used as single substrate will be deficient in nitrogen, which is needed for build up of bacterial communities. As a result the gas production will be low. If the C/N ratio is very low, nitrogen will be liberated and accumulate in the form of ammonia. This will increase the pH value of the material and a pH value higher than 8.5 will start to show a toxic effect on the methanogenic bacterial communities (Hartmann and Ahring, 2006; Van Opstal, 2006). For example, proteins such as meats are high in nitrogen while paper products contribute relatively more carbon. A C/N ratio of 20–30 is considered to be optimum for an anaerobic digester, based on biodegradable organic carbon. The C/N ratio, based on biodegradable organic carbon from food and yard waste is below 20, and for mixed paper is more than 100 (Kayhanian and Rich, 1995). Animal waste, such as cattle manure, which has been used successfully in biogas systems for many years, has an average C/N ratio of 24. Plant materials contain a high percentage of carbon and so the C/N ratio is high (e.g. rice straw = 70, sawdust > 200). To maintain the C/N level of the digester material at acceptable levels, materials with high C/N ratio can be mixed with those with a low C/N ratio, i.e. organic solid waste can be mixed with municipal sewage, biosolids, or animal manure. Co-digestion with nutrient-rich organic wastes like manure would be another option to overcome nutrient deficiency (Hartmann and Ahring, 2005). 3.4.4. Mixing/Agitation The way in which materials flow through the anaerobic digester impacts the degree of contact the substrate has with resident bacterial communities and therefore how quickly it is digested. This parameter is primarily a function of the hydraulic regime (mixing) in the reactors. Mixing of the substrate in the digester helps to distribute organisms uniformly throughout the mixture
13

and to transfer heat. The importance of adequate mixing is considered to encourage distribution of enzymes and microorganisms throughout the digester where MSW decomposition is carried out. Furthermore, agitation aids in particle size reduction as digestion progresses and in removal of gas from the mixture (Karim et al., 2005; Vavilin and Angelidaki, 2005). In the earliest AD systems, such as covered lagoons, the feedstock simply sits in a large bath and decomposes organics without mixing. Improvements on the AD system focused on changing the way materials flow, such as in complete mix digesters and plug-flow digesters, or in the way materials are mixed, such as through mechanical mixers, recirculation of digester contents, or by re-circulating the produced biogas using pumps. Mixing can take place as a result of the pathway the waste must travel until it is degraded. Some systems have interior walls in a cylindrical reactor that require a greater distance traveled for the waste, thereby increasing mixing. The material inside any digester may be further mixed through mechanical or gas mixers that keep the solids in suspension. Often biogas is bubbled through the digester as an inexpensive way to promote movement. Mechanical mixers inside digesters are less common because maintenance is somewhat difficult. Mixing can also be achieved through the recirculation of waste. Re-circulating digested waste continuously through heat exchangers both improves mixing and ensures proper temperature control. After digested waste is removed from the reactor at the end of its retention time, a percentage of it is fed into the stream of incoming fresh waste. This serves to contact the fresh waste with bacterial mass and increase movement in the digester, which prevents the buildup of a scum layer (Karim et al., 2005; Lissens et al., 2001; Stroot et al., 2001). The results from existing AD systems tend to show that a level of mixing is required to maintain the process stability within the digester. Over-frequent or excessive mixing can disrupt the anaerobic microbes. The amount of mixing required is also dependent on the content of the digestion mixture. The intensity and duration of mixing are other important aspects of digester mixing (Kim et al., 2002; Stroot et al., 2001). Some investigators have demonstrated that gentle or slow mixing may improve anaerobic digester performance (Chen et al., 1990; Vavilin et al., 2004). 3.4.5. Retention Time The hydraulic retention time (HRT) is a measure of the rate of substrate flow into and out of a reactor. The HRT is determined by the average time it takes for organic material to digest, as measured by the COD and BOD of the exiting effluent. In a completely mixed digester that employs continuous mixing, all the contents of the system have the same biomass residence or retention time. In such a system, the detention time is governed by the replication time of the slowest growing organism of the microbial community. Below this value, the system fails due to washout of the slowest growing organism that is necessary to the anaerobic process (Droste, 1997; Parkin and Owen, 1986). The HRT for most dry (influent solids content of above 20%) anaerobic processes range between 14 and 30 days and for wet (influent solids content of below 20%) anaerobic processes can be as low as 3 days. The optimal value varies according to the specific technology in place, the process temperature and the solid waste characteristics. For a specific anaerobic digester, therefore, the HRT may change from day to day or from season to season. Reducing HRT reduces the size of the digester, resulting in cost savings. Therefore, there is an incentive to design systems that can
14

achieve a complete digestion in shorter HRT. A shorter HRT will lead to a higher production rate per reactor volume unit, but a lower overall degradation. These two effects have to be balanced in the design of the full-scale anaerobic digester. Several practices have generally been accepted as helping to reduce HRT. Two of these are continuous mixing and utilizing low solids. One method generally accepted for minimizing HRT is mixing the digester. The other method is to re-circulate water and biogas in the digester to keep material moving. This will ensure that bacterial populations have rapid access to as many digestible surfaces as possible and that environmental characteristics are consistent throughout the digester (Lin et al., 1997; Vlyssides and Karlis, 2004). There are also four areas in which new study into reducing HRT has been focused. The first is to separate the phases of the digestion into individual digesters so that the bacteria population in each digester is optimized for its purpose. The second approach is alternating the mixing flow pattern to improve circulation within the digester. A third alternative is to introduce a surface or combination of surfaces to the reactor on which the anaerobic bacteria can live longer, reducing the microbial population that is washed out with the effluent (van Lier et al., 2001; Libanio et al.,2003; Lissens et al., 2001; Nguyen et al., 2007; Yu et al., 2002). The final area is to use one of various methods for pre-treating the organic waste to increase digester efficiency (Marjoleine et al., 1998; Mata-Alvarez et al., 2003; van Lier et al., 2001). Each of these approaches is best applied to a particular feed material, but the principles can be combined for OFMSW. 3.4.6. Organic Loading Rate The organic loading rate (OLR) represents the amount of organics that must be handled by the anaerobic system measured in mass of organic influent to the system per unit volume per time, which is another important process control parameter in AD systems to treat solid organic wastes. This parameter is used as an index of the stress imposed on the microbial population and affects the amount of total gas, methane production, COD stabilization, and alkalinity (Lettinga, 1995; Speece, 1996). A higher OLR will demand more of the bacteria, which may cause the anaerobic consortium system to crash if it is not prepared. One danger of rapid increase in the OLR would be that the acidogenic bacteria, which act early in the digestion process and reproduce quickly given enough substrate, would multiply and produce acids rapidly. The methanogenic bacteria, which take longer to increase their populations, would not be able to consume the acids at the same pace. The pH of the system would then fall, killing more of the methanogenic bacteria and leading to a positive feedback loop, eventually halting digestion resulting in a digester crash or failure. Many AD facilities have reported system failures due to organic overloading. Low biogas production and a lower pH are early indicators of failure. If there is a significant rise in volatile acids this normally requires that the OLR be reduced. Maximum OLR for an anaerobic digester depends on a number of parameters, such as reactor design, wastewater characteristics, the ability of the biomass to settle, and activity, etc. Speece (1996) reported that several factors which control organic loading rates are:
• Concentration of viable biosolids which can be retained in the anaerobic reactor • Mass transfer between the incoming wastewater and the retained biomass • Biomass proximity for metabolism of hydrogen intermediate
15

• Temperature within the anaerobic reactor and pH • Level of toxicity in the wastewater • Reactor configuration and presence of staging
3.4.7. Toxicity Toxicants (components in the wastewater causing adverse effect on bacterial metabolism) are responsible for the occasional failure of anaerobic digesters. Mineral ions, heavy metals and detergents are some of the toxic materials that inhibit the normal growth of bacteria in the anaerobic digester. Low concentrations of minerals (sodium, potassium, calcium, magnesium, ammonium, and sulfur) stimulate the bacterial growth, but become inhibitory as the concentrations increase. Heavy metals such as copper, nickel, chromium, zinc, and lead are essential for bacterial growth in small quantities, but higher quantities will have a toxic effect. Copper is specifically used as an antimicrobial in water cooling systems such as blow down towers. Detergents such as soap, antibiotics, and organic solvents also inhibit the anaerobic bacteria. From a control standpoint, toxic materials need to somehow be reduced in concentration to below a toxic threshold (McCarty, 1964). Summarizing methods that may be used to control inhibitory materials (Rittmann and McCarty, 2001):
• Remove toxic material from waste stream • Dilute wastes so toxicant is below toxic threshold • Form insoluble complex or precipitate with toxicant • Change form of toxicant through pH control • Add material that is antagonistic to toxicant
The following are some toxicants that are known to cause problems in AD systems. Ammonia-nitrogen Ammonia-nitrogen-containing solid waste, or its precursors, is of concern because of the potential inhibitory effects of ammonia on the AD microbial consortia (Angelidaki et al., 1993). Ammonia is usually formed in anaerobic processes as a result of mineralization of organic nitrogen in wastes rich in protein or urea. The excess ammonia-nitrogen in the fermentation medium could cause an inhibitory effect in three different ways. First, free ammonia, which is more toxic for anaerobic microbial communities than the ammonium ion, is formed during the fermentation process. Second, amination of α-ketoglutaric acid by ammonia-nitrogen coupled with rapid disappearance of α-ketoglutaric acid from the metabolic pool of the tricarboxylic acid cycle could cause difficulties in the metabolism of organic compounds. Finally, buildup of ammonia-nitrogen may result in undetected accumulation of volatile fatty acids (VFAs) because ammonia will keep the pH above 8 (Krylova et. al., 1997; Sterling et al., 2001). Ammonia-nitrogen is generally inhibitory to methanogens at levels of 1500–3000 mg/L. However, ammonia inhibition can be tolerated in concentrations as high as 7000 mg/L with no significant decrease in methane production if a long acclimation time is allowed (Parkin and Owen, 1986). Sulfide Sulfide toxicity is a common problem with organic waste containing high concentrations of sulfate. Sulfate is used primarily as an electron acceptor in organic waste treatment and is
16

converted to sulfide. Sulfide in complex with heavy metals – such as iron, zinc or copper – is not toxic. It is the soluble form – primarily un-ionized hydrogen sulfide – that is most inhibitory. Concentrations of soluble sulfide from 50 to 100 mg/L are tolerated with little or no acclimation. Concentrations up to 200 mg/L are tolerated after some acclimation. Concentrations above 200 mg/L are quite toxic. Theoretically, 600 mg/L of sulfate will produce 200 mg/L of sulfide. Hydrogen sulfide (H2S), one of the sulfide species formed, is a relatively insoluble gas and is partially stripped from solution through normal gas production. At a normal pH during anaerobic treatment, almost all soluble sulfides are H2S or HS– (Rittmann and McCarty, 2001). H2S is formed by bacterial sulfate reduction and the decomposition of sulfur-containing organic substrates. Acid-forming bacteria are less sensitive to H2S than methanogens. Within the latter group, hydrogen-oxidizing bacteria are considered to be more sensitive than acetoclastic methanogens (Arogo et al., 2000). Cation toxicity Some solid organic wastes have relatively higher concentrations of normal alkali and alkaline earth salts and this can inhibit the anaerobic process. If one attempts to control very high volatile acid concentrations through the addition of sodium hydroxide or other sodium-containing bases, high salt concentration could readily affect the activity of microorganisms and interfere with their metabolism. Acclimation is a factor that could affect the characteristics of sodium inhibition. Adaptation of methanogens to high concentrations of sodium over prolonged times could increase the sodium tolerance of these microbes. Another phenomenon associated with sodium toxicity is the antagonistic effect. Here, if a cation such as sodium is present in an inhibitory concentration, this inhibition might be relieved if another cation such as potassium is added. With the stimulatory concentrations of the various cations present, they help reduce the extent of inhibition caused by any of the other cations present at a moderately inhibitory concentration (Feijoo et al., 1995; Soto et al., 1993). Table 2 shows a summary of concentrations of various common cations that may cause inhibition (Parkin and Owen, 1986).
Table 2 Concentrations reported to be inhibitory cations to anaerobic microorganism. Cation Moderately inhibitory (mg/L) Strongly inhibitory (mg/L)Sodium 3,500 - 5,500 8,000 Potassium 2,500 - 4,500 12,000 Calcium 2,500 - 4,500 8,000 Magnesium 1,000 - 1,500 3,000
4. Anaerobic Degradability of Waste The biodegradability depends on the content of carbohydrates, lipids, and proteins, as well as the composition of cellulose, hemicellulose, and lignin fractions. Due to the different percentage of these components in collected OFMSW (agro waste, food waste, yard waste, grey waste, and paper) the biodegradability varies significantly (Baraber, 1995). An important step of the anaerobic biodegradation process is the hydrolysis of the complex organic matter. During the AD of complex organic matter the hydrolysis is the first and often the rate-limiting step. The hydrolysis can be defined as the breakdown of organic substrate into
17

smaller products that can subsequently be taken up and degraded by bacteria. Substrate for hydrolysis can be directly present in the waste or can be formed by microbial activity such as internal storage products, or bacterial biomass. During hydrolysis of macro-pollutants such as lipids, protein and carbohydrates are de-polymerized to glycerol and long chain fatty acids, to amino acids and to oligo- and mono-saccharides for lipids, proteins and carbohydrates, respectively. 4.1. Hydrolysis Mechanism Hydrolysis takes place extra-cellular via enzymes excreted by the biomass. Three main mechanisms exist for the release of enzymes and the subsequent hydrolysis of the complex substrate during anaerobic digestion (Jain et al., 1992; Vavilin et al., 1996, 2002).
• The organism secretes enzymes to the bulk liquid, where they will either adsorb to a particle or react with a soluble substrate.
• The organism attaches to the particle, secretes enzymes into the vicinity of the particle and next the organism will benefit from the released dissolved substrates.
• The organism has an attached enzyme that may also act as a transport receptor to the interior of the cell. This method requires the organism to absorb into the surface of the particle.
4.2. Aspects Related to Enzymatic Degradation Hydrolytic enzymes can be endo-enzymes, which prefer to cut the bonds towards the middle of the molecule, or exo-enzymes, which prefer to cut the bonds near to the edges of the macromolecule. The enzyme substrate specific activity is thought to follow Michaelis–Menten kinetics. The overall effect of the digestion temperature on the hydrolysis rate originates from the combined temperature effect on the enzyme kinetics, bacterial growth and solubility of the substrate. In general, the rates of reactions vary with temperature in accordance with the Arrhenius equation (Veeken and Hamelers, 1999). The effect of the pH on the hydrolysis is complicated. The net effect of pH on the hydrolysis rate is specified by the optimum pH of the different enzymes present in the digester and the effect of pH on the charge/solubility of the substrate. The latter especially applies to the digestion of substrates that contain proteins. 4.3. Aspects Related to Physical State and Structure of Substrate An important factor for the hydrolysis is the physical state and structure of the substrate and its accessibility for hydrolytic enzymes. The hydrolysis rate of particulate substrates is lower than that of dissolved polymers because only the surface part of the substrate is accessible to the enzymes. Solid substrates in solid waste can be found in different physical states, in particles, dissolved, or emulsified. Particles are the most commonly found, for example 60–90% of the total organic load in domestic sewage consists of particles. The rate of microbial attachment to the substrate depends on the type of micro-organisms. The accessibility of a substrate can also be altered by formation of complexes with other compounds. Table 3 presents values for the surface hydrolysis rate (Angelidaki and Sanders, 2004).
18

Table 3 Surface related hydrolysis rate assessed for different substrates
Substrate Hydrolysis rate (mg COD/m3/d)
Inoculum Temperature Reactor
Starch 1.0 Granular sludge from potato factory
Mesophilic Batch
Rice 1.1 n/a Mesophilic Batch Hay 0.01 n/a Mesophilic Batch Cellulose 0.33 MSW leachate Mesophilic CSTR
4.4. Assessment of Hydrolysis Rate First order kinetics is most commonly used to describe the hydrolysis of particulate substrates during anaerobic digestion (Pavlostathis and Giraldo-Gomez, 1991). The equation:
dXdegr / dt = – kh · Xdegr
where Xdegr is the concentration of biodegradable substrate (kg/m–3), t is the time (days) and, kh is the first order hydrolysis constant (day –1), describes the hydrolysis kinetics. Despite the fact that the first order kinetics is an empirical relation it does reflect the major aspect of the hydrolysis of particulate substrates, namely the fact that the hydrolysis of particles is limited by the amount of surface available. Several researchers have shown that the hydrolysis mechanism of particulate substrates is surface related (Sanders et al., 2000). In this case the amount of enzymes is present in excess relative to the available surface area, and the hydrolysis rate is determined by the surface area, not by the enzyme activity. Such surface limited kinetics can be described with a first order relation (Vavilin et al. 1996; Veeken and Hamelers, 1999). As it is assumed that the enzyme activity is associated with the biomass the first order constant is not affected by the biomass concentration. Although the first order kinetics was originally only intended to describe the hydrolysis of particles, they can also be used to describe the hydrolysis of dissolved polymers. Sanders et al. (2002) showed by statistical calculations that the production of mono and dimmers from a soluble polymeric substrate by a mixture of endo- and exo-enzymes can be described by first order kinetics. A more direct and accurate method for assessing the hydrolysis constant and biodegradability from batch and continuous experiments is the non-linear least squares fit on the assessed effluent concentration. This method should be used whenever possible. With these calculations the gas production or the COD, protein and carbohydrate content of the blank has to be taken into account (Sanders et al., 2002). Table 4 shows the values of hydrolysis first-order constant, k, for hydrolysis of materials (Mata-Alvarez et al.,
2000)
Table 4 First order kinetic constant for hydrolysis of different materials Component Hydrolysis constants, k (d-1) Lipids 0.005-0.010 Proteins 0.015-0.177 9value dependent on pH) Carbohydrates 0.025-0.200 Food wastes 0.4 Solid wastes 0.012-0.042
19

Biowaste components 0.03-0.15 (20◦C), 0.24-0.47 (40◦C) 4.5. Co-Digestion with Animal Manure/ Digestion of MSW Alone An interesting option for improving yields of anaerobic digestion (AD) of solid wastes is co-digestion. That is, the use of a co-substrate, which in most cases improves the biogas methane production yields due to positive synergisms that establish the digestion medium and the supply of missing nutrients by the co-substrates. Sometimes the use of a co-substrate can also help to establish the required moisture contents of the digester feed. Other advantages are the easier handling of mixed wastes, the use of common access facilities and the known effect of economy of scale (Bjornsson et al., 2000). Co-digestion with animal manure: The organic fraction of the MSW is mixed with animal manure and the two fractions are co-digested. This improves the carbon/nitrogen ratio, alkalinity and buffering capacity as well as gas production. Digestion of OFMSW alone: The feedstock contains the organic fraction of MSW alone, slurried with liquid, and no other materials are added. The co-digestion of municipal solid waste with animal manure/sewage slurry is a popular method in existing plants, as the process tends to be simpler and is economically more viable than an MSW only treatment system (Hartmann and Ahring, 2005). However, some drawbacks also exist, mainly due to slurry waste transportation costs and the problems arising from the harmonization of different policies of the waste generating facilities generators. Co-digestion has been used in many plants for starting up digesters. As an example, Griffin et al. (1998) showed how a mesophilic (35°C) anaerobic sewage sludge, together with cattle manure, was used successfully to start up a thermophilic (55°C) digestion of biosolids and simulated municipal solid waste. Other examples of co-digestion are summarized in Table 5 (Mata-Alvarez et al., 2000; Stroot et al., 2001).
Table 5 Examples of co-digestion presented (Mata-Alvarez et al., 2000).
Co-digestion fess source Comments Olive mill effluents (OME) with pig manure (PM) and sewage sludge (SS)
Ratios used: OME/SS: 1/5, OME/PM:1/1, With PM, A COD reduction of up to 75% was achieved
Organic wastes and agricultural manures
Discussion of technical and quality requirements for co-digestion
Landfill leachate and septage Overall COD removal of around 71% PM and organic wastes form food industry
Mesophilic results were better than thermophilic ones. In both temperatures biogas yields of PM were improved.
PM and other organic wastes Agricultural cooperative–project partially using laboratory results
Solid manure and OFMSW Pilot plant with agronomic tests
20

5. Solids Digesters Classification The AD treatment efficiency and stability can vary significantly depending upon the process design type of anaerobic digester used. Digesters range in complexity from simple cylindrical reactor with no moving parts to fully automated mixed industrial facilities. Design considerations include capacity/volume vertical or horizontal orientation, batch or continuous flow, wet or dry digestion, number of stages, etc. The multitude of digester varieties are designed to optimize the process for specific geographic locations, types of waste, and other considerations (Bolzonella et al., 2006; Lissens et al., 2001; Luning et al., 2003; Ohmura et al., 2003; Paven et al., 2000). In order to select the optimal strategy for AD of organic solid waste, the different processes have been applied throughout the last 15 years in lab, pilot, and full scale. The AD systems for treatment of MSW in various scales are described in next section of this report (Bolzonella et al., 2006; Lissens et al., 2001; Luning et al., 2003; Ohmura et al., 2003; Paven et al., 2000). A wide variety of AD system processes have been developed to anaerobically treat MSW. The AD processes can be divided into a variety of categories such as wet/dry processes, batch/continuous and single/multi stages. Co-digestion of OFMSW has been reported recently and this section also includes the process concept. 5.1. Wet versus Dry Systems Wet – The MSW feedstock is slurried with a large amount of water to provide a dilute feedstock of 10-15% dry solids. Dry – The feedstock used has a dry solids content of 25 – 40%. Depending on the moisture content and hence the total solid (TS) concentration of the feed for the AD process, the process is termed low-solids = “wet” process with TS < 20%; high-solids = “dry” processes with TS > 20%, and “semi-dry” process with TS around 20%. Since OFMSW is a substrate with a high solid content of about 30% TS, the simplest treatment process of OFMSW alone is the high-solids treatment process. De Baere (2000) reported that the capacity of dry AD to treat high solids in Europe was estimated to be 54% of the total AD processes for OFMSW in the year 2000. The advantage of high-solids AD is that higher organic loading rates above 10 g VS/L/d can be applied. However, complete mixing of the solid waste is not easy, and therefore, full contact of biomass and substrate has not been guaranteed. Recirculation of the leachate has improved the homogeneity of the dry AD process (Lissens et al., 2001; Harmann and Ahring, 2006). Reactors used in dry AD processes generally do not apply mechanical stirrers and may, depending on reactor design, use biogas injection to facilitate mixing of material. Digesters used in dry AD processes can be characterized as plug flow reactors (Luning et al., 2003). The wet anaerobic digestion of OFMSW can be performed in conventional reactor systems where process homogeneity is obtained by mechanical stirrers or a combination of mechanical stirring and biogas injections. In order to lower the TS concentration, addition of liquid is necessary, by recirculation of the liquid effluent fraction (Hartaman et al., 2002). 5.2. Batch versus Continuous Processes In AD process technology, two general models are used: the batch process and the continuous process. In the batch process, the substrate is put in the reactor at the beginning of the degradation period and sealed for the complete retention time, after which it is opened and the
21

effluent removed. In the continuous process, fresh material continuously enters the tank and an equal amount of digested material is removed. There are distinct stages of digestion throughout the batch process whereas equilibrium is achieved in the continuous process (Bolzonella et al., 2005; Lissesn et al., 2001). On the simple end of the spectrum, the batch AD occurs in sealed volumes in which the substrate resides for a predetermined amount of time and effluent is removed as a batch at the end of that time. Usually batch reactors are cylindrical, but on farms, where land is readily available, digestion can also occur in large covered lagoons. When waste is first loaded, hydrolysis takes place and gas production is low, forming only carbon dioxide. Methane production increases during the acid forming stages, reaching a maximum halfway through the degradation period, when methanogenesis dominates the processes. Toward the end of the degradation period, only the least easily digestible material remains, and gas production drops. The sludge mixed waste or liquor in a batch reactor is normally not mixed, allowing the content of the digester to stratify into layers of gas, scum, supernatant, an active layer, and stabilized solids at the bottom. Influent and effluent valves reside in the supernatant layer and solids should be removed near the bottom. The disadvantage of this type of AD system is the large tank volume required due to the longer retention time, the low organic loading rate and the formation of a scum layer. Only about 1/3 of the tank volume is used for active digestion, making this a poor option (Davis and Cornwell in crowded urban settings., 1998). In a continuous AD process, fresh organic substrate is added and an equal amount of effluent is removed in an ongoing process. With consistent feedstock input, all reactions occur at a fairly steady rate resulting in approximately constant biogas production. The structure for a continuous process can be identical to a batch process, a cylindrical tank with influent and effluent valves. Because there is constant movement, however, the substrate inside the tank digester is mixed and does not become stratified. This allows for more optimal use of the tank volume. The disadvantage of the continuous process is that the removed effluent is a combination of completely digested and partially digested material (Davis and Cornwell, 1998; Droste, 1997). Mixed forms of these two digester models have been developed including the plug-flow reactor and the sequencing batch-reactor, which try to combine the advantages of the two extremes (Mata-Alvarez et al., 2000). 5.3. Single versus Multi-Step Processes Single stage – All digestion occurs in one reactor vessel. Multi-stage – Process consists of several reactors; often the organic acid forming stage of the anaerobic digestion process (acidogenesis) is separated from the methane forming stage (methanogenesis). This results in increased efficiency as the acidogenic and methanogenic microorganisms are separate in terms of nutrient needs, growth capacity and ability to cope with environmental stress. Some multistage systems also use a preliminary aerobic stage to raise the temperature and increase the degradation of the organic material (Raynal et al., 1998). In other systems the digester are separated into a mesophilic stage and a thermophilic stage as the temperature-phase type. Single stage treatment is, generally, the more predominant AD applied in full scale for OFMSW, and multi stage digestion has, so far, not been able to prove its benefit in the market place (De
22

Baere, 2000). Industrialists, in fact, prefer single stage systems because simpler designs suffer less frequent technical failures and have smaller investment costs. In a single stage digester, all of the bacteria exist in the same volume and the environmental conditions are kept at equilibrium. These parameters are not necessarily optimal for any bacteria, but are acceptable to all because the equilibrium is stable (Lissens et al., 2001). Many investigators have attempted to optimize the AD process by separation of hydrolysis/acidification and methanization in different reactors. The main idea was to optimize the conditions for the hydrolytic/acidogenic bacteria in one reactor and for the methanogens in the other reactor in order to improve the overall degradation rate (Hartmann and Ahring, 2006). In two or multiple stage digesters, the substrate is transported to sequential chambers where progressive stages of AD occur according to prescribed timing. Each chamber maintains environmental conditions most favorable to the bacteria present. If two digesters are used, the first digester allows hydrolysis, acidogenesis and acetagenesis to occur while the second optimizes methanogenesis (Raynal et al., 1998; Nguyen et al., 2007; Yu et al., 2002). Babel et al (2004) reported that two-stage digesters can be more efficient because the microorganisms have separate nutrient needs, growth capacities, and abilities to cope with environmental stress. Hamzawi et al (1999), for example, concluded in an overview of high-solids AD systems used for the treatment of OFMSW, that a two-stage treatment could be operated at significantly shorter HRT and higher organic loading rate than a single high-rate digester. The need to construct multiple digesters, however, may offset the cost savings incurred by reduced retention time. Chynoweth et al. (1992) introduced a sequential batch anaerobic composting (SEBAC) process consisting of three 0.7m3 reactors for the treatment of high-solids waste and Ku¨bler and Schertler (1994) investigated a three-phase process for the AD of organic waste with separate acidification, hydrolysis and methanization, called the BTA (Biotechnische Abfallverwertung GmbH) process. Hofenk et al. (1984) designed a two-phase AD process in a pilot scale where organic matter was hydrolyzed and acidified in the first reactor and the resulting solution, with high volatile fatty acids (VFAs) content, was treated in an up-flow anaerobic sludge blanket reactor (UASBR) for methanization. Especially, at higher loading rates, the overall performance of this latter system was worse than in a single stage system and it was assumed that reactor staging was not beneficial. It was considered that under these conditions the acidifying reactor was overloaded and the VFA became too high and the methanogenic activity in this reactor decreased. A separate hydrolysis reactor can be advantageous for treatment of solid waste containing larger fractions of recalcitrant organic matter, while the phase separation can lead to overload problems when using substrates with a high content of easily biodegradable organics. Generally, the staging into two digesters may be optimal if the processes, hydrolysis and methanization, can be successfully separated. The current leading industrial concepts to treat OFMSW are: Dry Continuous Digestion: continuously fed digester with dry digested material content of 20-40%. Minimal water addition makes the overall heat balance very favorable for the AD process. Dry Batch Digestion: batch digester system fed with dry digested matter content 20-40%. During digestion, when the digester is sealed, leachate collected from the base of the reactor is
23

recirculated to maintain uniform moisture content and to redistribute soluble organics and bacteria. A disadvantage of this AD system is that increased pretreatment is required to provide a suitable digested material. Leach-Bed Process: similar to dry batch digestion, however, leachate from the base of the reactor is exchanged between established and new batches to improve startup, inoculation and removal of volatile acids in the reactor. This is also called Sequential Batch Anaerobic Composting (SEBAC). Wet continuous single-step digestion: OFMSW feedstock is slurried with a larger amount of water (around 10% solids). The AD system leads itself to co-digestion of OFMSW with more diluted feedstocks such as sewage sludge or animal manure. Effective removal of glass and stones is required to prevent rapid accumulation of these in the bottom of the reactor. The digestion requires pressing to recover liquid, (which can be recycled to mix with incoming waste). Wet continuous multi-step digestion: OFMSW feedstock is slurried with water or recycled liquid (10% solids content) and fed to a series of digesters where acetogenesis occurs in a separate digester to methanogenesis. Table 6: Reports other studies of the performance of anaerobic digestion of solid wastes (Mata-Alvarez et al.,
2003).
Substrate Scale/Reactor type/Temperature Slaughterhouse and catering
Pilot/Mesophilic
Poultry mortalities Lab/Two-phase (Leach bed +UASB) Mesophilic OFMSW Pilot (Leach bed + UASB) Psychrophilic Sewage sludge Lab/Two-phase/Mesophilic Mycelium waste Non-stirred digester/ Psychrophilic OFMSW Lab/One and two stages/ Psychrophilic and
Mesophilic Coffee pulp Lab/Batch/ Psychrophilic Fish farming sludge Lab/Batch/Mesophilic OFMSW Piolt/Two-phase/Themophilic Food Wastes Lab/Leach bed/Mesophilic OFMSW Lab/CSTR/Mesophilic Coffee Pulp Pilot/Plug flow/Mesophilic OFMSW/Coffee pulp Pilot/Two-phase
5.4. Capacity and Orientation for AD of Solid Waste HSAD system capacity depends on the availability of feedstock. The capacity of a system with MSW as feedstock may include simply organics or, mixed (grey) waste, or source-separated waste. As the systems have been proven to be reliable and economic, larger sizes have become more popular. At present, worldwide some 1 million tons of organic wastes are digested per year. The Friesland plant in the Netherlands, for example, has a capacity of 230,000 metric tons per
24

year. For MSW management systems in the developed world, the smallest digester that is economic is about 50,000 tons per year. Many plants under construction are close to 100,000 tons per year. The size of individual chambers ranges from 70 m3 to 5000 m3. Larger capacities are normally accommodated by the use of multiple chambers because incomplete mixing occurs when an individual chamber gets too large (De Baere et al., 2000; Hartmann and Ahring, 2006; Libanio et al., 2003). The investment costs for AD are a factor 1.2-1.5 higher than aerobic composting. The net costs per ton waste treated, taking into account the recovery of biogas energy, are also 1.2-1.5 higher than that of conventional aerobic composting. World wide, the major amount of municipal wastes is destined for landfill, incineration ranks second; aerobic composting is third and AD is fourth. This makes the AD at present technology of only limited quantitative impact. Therefore, the evolution of regulation will push towards a growing market for AD to treat organic solid waste. The recovery of energy (100-150 m3 biogas per ton organic waste) in AD is an important factor for sustainable waste treatment (van Lier et al., 2001; Hartmann and Ahring, 2006) as is the impact AD will have on greenhouse gas utilization and global climate change. The selection of a horizontally or vertically oriented tank reactor depends on how material is intended to flow through the AD system. Vertical tank reactors are predominately gravity driven forcing the material to flow generally downward, though the exact path can vary depending on interior boundaries in the chamber. Horizontal tanks minimize the area over which the substrate can settle, but require greater space. It may take less input to mix a horizontal tank because the direction of settling is perpendicular to the direction of propagation. In the Dranco process, the mixing flow occurs via recirculation of the wastewater extracted at the bottom end. The Kompogas process works similarly, except that plug flow occurs horizontally in cylindrical reactors (Lissesns et al., 2001). In some cases, material is pumped into the bottom of the tank and removed from the top, causing general upward flow that is further mixed by a lesser, downward, gravity driven flow.
5.5. Single-Stage Systems About 90 % of the full-scale plants currently in use in Europe for anaerobic digestion of MSW rely on one-stage systems and these are approximately evenly split between 'wet' and 'dry' operating conditions (De Baere, 1999). Depending on the moisture content and according to the aforementioned classification, 20% as TS may be the cut off line for classification, allowing more flexibility for the classification of the examples illustrated later in this report. Many investigations on two-, multi-stage or batch systems that will be described later were referred in literature as one-stage systems. A likely reason for this discrepancy is that two- and multi-stage systems afford more possibilities to the researcher to control and investigate the intermediate steps of the digestion process. Developers, on the other hand, prefer one-stage systems because simpler designs suffer less frequent technical failures and have smaller investment costs. Biological performance of one-stage systems is, for most organic wastes, as high as that of two-stage systems, provided the reactor is well designed and operating conditions carefully chosen (Weiland, 1992). 5.5.1. Wet Single-Step Systems
25

Vandeviviere et al. (2002) state that the one-stage wet system appears attractive because of its similarity to the demonstrated technology in use for decades for the anaerobic stabilization of biosolids produced in wastewater treatment plants. The physical consistency of organic solid wastes is made to resemble that of biosolids, via pulping and slurrying to less than 15 % TS with dilution water, so that a classical complete mix reactor may be used. One of the first full-scale plants for the treatment of biowastes, built in the city of Waasa, Finland, in 1989, is based on this principle (Figure 4). A pulper with three vertical auger mixers is used to shred, homogenize and dilute the wastes in sequential batches. To this end, both fresh and recycled process water are added to attain 10 - 15 % TS. The obtained slurry is then digested in large complete mix reactors where the solids are kept in suspension by vertical impellers.
Figure 4 Typical design of a one-stage 'wet' system (Vandeviviere et al., 2002).
In contrast with the apparent simplicity of such one-stage wet process, many technical aspects need actually be taken into account and solved in order to guarantee a satisfactory process performance (Westergard and Teir, 1999; Farneti et al., 1999). The pre-treatment necessary to condition the wastes into slurry of adequate consistency and devoid of coarse or heavy contaminants can be very complex, especially in the case of mechanically-sorted OFMSW. To achieve the objective of removing these contaminants while at the same time keeping as much biodegradable wastes within the main stream requires a complicated plant involving screens, pulpers, drums, presses, breakers, and flotation units (Farneti et al., 1999). These pre-treatment steps inevitably incur a 15- 25 % loss of volatile solids, with a proportional drop in biogas yield (Farneti et al., 1999). Slurried wastes do not keep a homogenous consistency because heavier fractions and contaminants sink and a floating scum layer forms during the digestion process, resulting in the formation of three layers of distinct densities, or phases, in the reactor. The heavies accumulate at the bottom of the reactor and moreover may damage the propellers while the floating layer, several meters thick, accumulates at the top of the reactor and will hamper effective mixing. It is therefore necessary to foresee means to extract periodically the light and heavy fractions from the reactor. Since the heavies do also damage pumps, they must be removed as much as possible before they enter the reactor, either in specifically-designed hydro-cyclones or in the pulper which is designed with a settling zone.
26
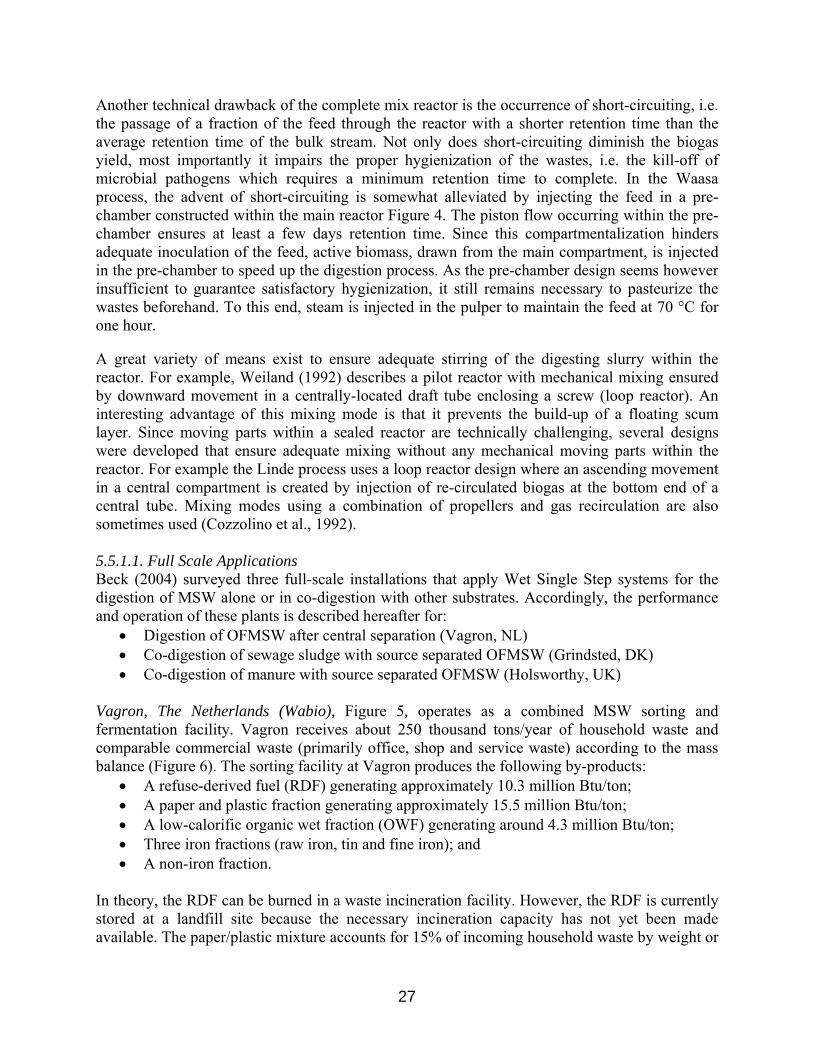
Another technical drawback of the complete mix reactor is the occurrence of short-circuiting, i.e. the passage of a fraction of the feed through the reactor with a shorter retention time than the average retention time of the bulk stream. Not only does short-circuiting diminish the biogas yield, most importantly it impairs the proper hygienization of the wastes, i.e. the kill-off of microbial pathogens which requires a minimum retention time to complete. In the Waasa process, the advent of short-circuiting is somewhat alleviated by injecting the feed in a pre-chamber constructed within the main reactor Figure 4. The piston flow occurring within the pre-chamber ensures at least a few days retention time. Since this compartmentalization hinders adequate inoculation of the feed, active biomass, drawn from the main compartment, is injected in the pre-chamber to speed up the digestion process. As the pre-chamber design seems however insufficient to guarantee satisfactory hygienization, it still remains necessary to pasteurize the wastes beforehand. To this end, steam is injected in the pulper to maintain the feed at 70 °C for one hour. A great variety of means exist to ensure adequate stirring of the digesting slurry within the reactor. For example, Weiland (1992) describes a pilot reactor with mechanical mixing ensured by downward movement in a centrally-located draft tube enclosing a screw (loop reactor). An interesting advantage of this mixing mode is that it prevents the build-up of a floating scum layer. Since moving parts within a sealed reactor are technically challenging, several designs were developed that ensure adequate mixing without any mechanical moving parts within the reactor. For example the Linde process uses a loop reactor design where an ascending movement in a central compartment is created by injection of re-circulated biogas at the bottom end of a central tube. Mixing modes using a combination of propellers and gas recirculation are also sometimes used (Cozzolino et al., 1992). 5.5.1.1. Full Scale Applications Beck (2004) surveyed three full-scale installations that apply Wet Single Step systems for the digestion of MSW alone or in co-digestion with other substrates. Accordingly, the performance and operation of these plants is described hereafter for:
• Digestion of OFMSW after central separation (Vagron, NL) • Co-digestion of sewage sludge with source separated OFMSW (Grindsted, DK) • Co-digestion of manure with source separated OFMSW (Holsworthy, UK)
Vagron, The Netherlands (Wabio), Figure 5, operates as a combined MSW sorting and fermentation facility. Vagron receives about 250 thousand tons/year of household waste and comparable commercial waste (primarily office, shop and service waste) according to the mass balance (Figure 6). The sorting facility at Vagron produces the following by-products:
• A refuse-derived fuel (RDF) generating approximately 10.3 million Btu/ton; • A paper and plastic fraction generating approximately 15.5 million Btu/ton; • A low-calorific organic wet fraction (OWF) generating around 4.3 million Btu/ton; • Three iron fractions (raw iron, tin and fine iron); and • A non-iron fraction.
In theory, the RDF can be burned in a waste incineration facility. However, the RDF is currently stored at a landfill site because the necessary incineration capacity has not yet been made available. The paper/plastic mixture accounts for 15% of incoming household waste by weight or
27
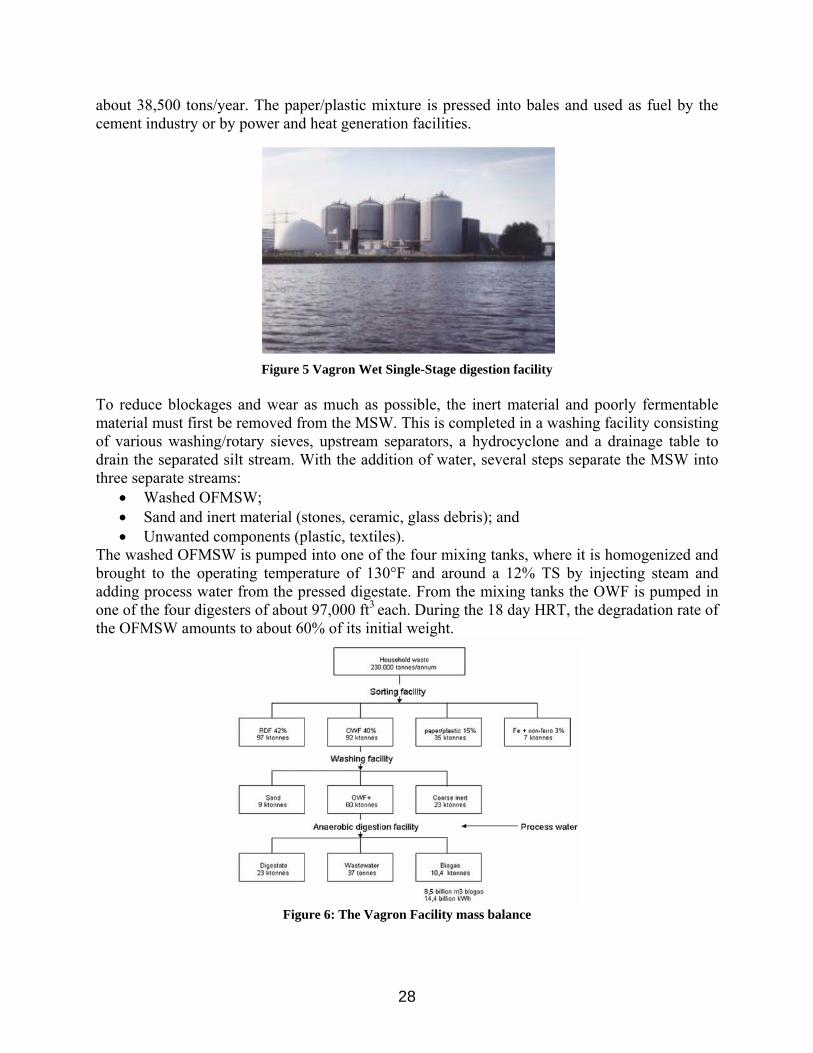
about 38,500 tons/year. The paper/plastic mixture is pressed into bales and used as fuel by the cement industry or by power and heat generation facilities.
Figure 5 Vagron Wet Single-Stage digestion facility To reduce blockages and wear as much as possible, the inert material and poorly fermentable material must first be removed from the MSW. This is completed in a washing facility consisting of various washing/rotary sieves, upstream separators, a hydrocyclone and a drainage table to drain the separated silt stream. With the addition of water, several steps separate the MSW into three separate streams:
• Washed OFMSW; • Sand and inert material (stones, ceramic, glass debris); and • Unwanted components (plastic, textiles).
The washed OFMSW is pumped into one of the four mixing tanks, where it is homogenized and brought to the operating temperature of 130°F and around a 12% TS by injecting steam and adding process water from the pressed digestate. From the mixing tanks the OWF is pumped in one of the four digesters of about 97,000 ft3
each. During the 18 day HRT, the degradation rate of the OFMSW amounts to about 60% of its initial weight.
Figure 6: The Vagron Facility mass balance
28

Around 35,300 ft3/hour of biogas is produced, which is dewatered and stored in a low-pressure biogas balloon with a volume of around 75,000 ft3. This corresponds to a biogas yield of 1,440 ft3/ton of raw waste input to the plant. The residual digestate is dewatered in a press. The digestate is a sanitized and stabilized co-product from the fermentation process that is comparable to compost in terms of structure and composition. It does not, however, meet the specifications required for agricultural use. The process water is treated with a physical/chemical method to remove floating material, after which it is mostly reused within the washing facility. Only a small portion of the process water is discharged. This discharge water is mixed with waste water from the fermentation facility and directed to the municipal waste water treatment plant (WWTP). Grindsted, Denmark (Krüger Biosolid System), in the Danish town of Grindsted, source separated household waste, Organic Industrial Waste (OIW) and sewage sludge are shredded, Figure 7, and co-digested to supply electricity, heat and fertilizer to the local community. In 2001, the total inputs consisted of 33,000 tons of sewage sludge (dry matter 990 tons), 1,650 tons of organic household waste (dry matter 725 tons) and 3,300 tons of liquid OIW (dry matter 220 tons). The biogas plant, constructed in 1996, is located adjacent the town’s municipal WWTP. Household organic wastes are collected in paper bags. It is reported that the contamination rate is less than 1%. It is crucial to obtain a clean de-glassed product, for the overall process. The plant is designed to handle up to four times more of household waste than it presently does and therefore is presently underutilized.
Figure 7: Grindsted Waste Shredder The biogas plant, Figure 8, receives the source separated household organic wastes generated from about 7,000 households. Because the waste is collected in paper bags at the individual households, expensive pre-treatment is avoided at the biogas plant. The bags are unloaded into a receiving silo and subsequently the waste is shredded into pieces that are sized at approximately two inches. Metal parts are removed by a metal separator. The household waste is then mixed with OIW and sewage sludge, and is then pulped for about 15 minutes. The OIW consists of flotation fat from a food processing industry. The feedstock is mixed in a ratio of one part OIW to nine parts sludge or similar. Then, the viscous mixture is pumped through a macerator for fine shredding and a separator for removal of glass and inerts before it is heated to 160°F for one hour in one of two hygienization tanks. Finally, the biomass is pumped into a 100,000 ft3
reactor and digested at 100°F. The digestate leaves the digester reactor with about a 2.5% TS concentration. A separator removes any residual materials, mainly plastic, before the digestate is separated by a
29

filter band press. The resulting fiber fraction has 20%-25% TS content, and the liquid reject fraction is recycled to the municipal WWTP. The fiber is delivered to the farmers free of charge, and is spread on approximately 1,850 acres of farmland.
Figure 8: Grindsted, Denmark (Krüger Biosolid System)
About 110 tons/day of feedstock is added, resulting in a daily biogas production of about 63,500 ft3. This corresponds to a biogas yield of 580 ft3/ton of raw waste input to the plant. The biogas is used in a Combined Heat and Power (CHP) plant that produces about 250 kW of electricity and 350 kW of heat. Because the CHP engine-generator is designed to run full load, it is possible to have a biogas storage balloon of only 18,000 ft3
to keep maintenance expenses at a minimum. Annual electricity production amounts to 855 thousand kWh, and the annual thermal energy production is 8.5 billion Btu. The electricity is sold to the public grid, and the thermal energy is used to heat the plant buildings and to heat the feedstock in the hygienization tanks as part of the internal AD process. Holsworthy, United Kingdom (Farmatic), Figure 9, co-digests manures and household wastes. It is comparable in design to most of the 20 large-scale co-digestion operations in Denmark. The manure is collected from 25-30 local farms within a 5 to 10 mile radius. The food waste is collected from food processors in the area southwest of Devon in the United Kingdom (UK). It was originally planned that the plant would be built by Krüger. When Farmatic bought the AD division from Krüger (respectively from Vivendi), they continued the planning work. The plant initiated operation in June of 2002. As of October 2002, the plant was still in start-up phase.
Figure 9: Holsworthy, United Kingdom (Farmatic)
30

During the planning and development of the project, obstacles have included lack of investors and concerns raised related to spread of animal diseases because of manures. The total annual inputs to the Holsworthy plant are projected to consist of 160,000 tons of food and animal waste. About 440 tons/day of feedstock is added, resulting in a daily biogas production of about 630,000 ft3. This corresponds to a biogas yield of 1,425 ft3/ton of waste input to the plant. The biogas will be used to generate electricity and recover heat from two engines with a total power capacity of approximately 2.1 MW. Expected power production is around 14.4 million kWh/year. Recovered heat is expected to be sold for use in a new district heating system. Including engineering design and consulting fees, the total 1996 investment for the entire plant was £5.0 million (around $8.0 million). Interestingly, Farmatic participated with 50% of the invest funds required for project capitalization. 5.5.1.2. Biological Performance Vandeviviere et al. (2002) evaluated the biological performance of Wet Single-Stage systems in view of the three most important indicators:
• rate, • degree of completion, • stability of the biochemical reactions.
The degree of completion is quantified by comparing the biogas yield obtained in the reactor per unit mass substrate fed with the maximum biogas yield obtained in lab-scale batch reactors operated under optimal conditions. While this comparison is perhaps the most important test used in the industry, published reports almost invariably fail to mention what is the maximum yield amount. Instead, publications refer simply to the biogas yield or alternatively to the % VS removal from the waste stream to assess the degree of completion of the methanization process. Biogas yield as such is however of very little use because it is much more dependent on waste composition than on process performance. For example, the methane yield in one full-scale plant varied between 170 and 320 m3
CH4/kg ~ 2700-5100 ft3/IbVS fed (40 and 75% VS reduction) during the summer and winter months, respectively, as a result of the higher proportion of garden waste during summer months. Garden wastes are indeed known to yield much less biogas, relative to kitchen wastes, due to the higher proportion of poorly degradable lignocellulosic fibres. Pavan et al. (1999b), when using the same reactor configuration, observed a two-fold larger VS reduction with source-separated bio-waste relative to mechanically-sorted OFMSW. Such difference is not due to process performance but rather to the smaller biogas production potential of the mechanically-sorted OFMSW which contains a greater proportion of poorly-degradable organic material such as plastic impurities. A more useful criterion of biological performance is the maximum sustainable reaction rate, which can be expressed as a rate of substrate addition, i.e. the maximum organic loading rate OLRmax, or as a rate of product formation, i.e. the volume of dry biogas or, better, of methane (under standard conditions of pressure and temperature) produced per unit time per unit reactor volume. These indicators are more useful than the biogas yield or % VS reduction because they are less sensitive to the ill-defined composition of the waste and better reflect the level of biological activity that a given reactor design may sustain. Another parameter of use to quantify the rate is the retention time, which is roughly the inverse of the OLR when the OLR is expressed as mass wet substrate instead of mass substrate VS.
31

The OLR max indicates the degradative capacity of the system, the biogas yield and its conversion efficiency, with 100 % conversion efficiency being defined as the maximum biogas yield potential determined under optimal conditions in the laboratory. If the latter is unknown, the biogas yield remains a valid indicator only for comparisons between studies where wastes of similar origin and composition are used. Finally, and of foremost importance, only those data pertaining to reactors where stable performance is demonstrated should be considered. Pavan et al. (1999b) examined the performance of the thermophilic one-stage wet system in a pilot reactor for the treatment of OFMSW and biowastes. The sustainable OLR max for mechanically-sorted OFMSW under thermophilic conditions was 9.7 kg VS/m3.d~ 0.6 Ib VS/ft3.d. The same OLR was however unsustainable when the feed was switched to source-separated biowaste, for which the maximum OLR was 6 kg VS/m3.d ~ 0.37 Ib VS/ft3.d. Weiland (1992) found a similar OLR max with various agro-industrial wastes under mesophilic conditions, provided these had C/N ratios greater than 20. Two plants were started in 1999 for the biomethanization of mechanically-sorted OFMSW with wet processes. The one in Verona, Italy, was designed with an OLR of 8 kg VS/m3.d ~ 0.5 Ib VS/ft3.d (Farneti et al., 1999) while the one in Groningen, The Netherlands, has a design capacity of 5 kg VS/m3.d (92,000 Ton OFMSW per year in four reactors of 2,750 m3 ~ 97000 ft3 each). It is not clear what the bottleneck is that determines these OLRmax values. Possible limiting factors are biomass concentration, mass transfer rate of substrates to bacteria, or accumulation of inhibitory substances. Since the feeding above the sustainable OLRmax
typically leads to a decrease of biogas production, the bottleneck is most likely the concentration of inhibiting substances, such as fatty acids and ammonia. The high levels of Kjeldahl-N typical of biowastes (21 versus 14 g/kg TS for mechanically-sorted OFMSW) leads to high levels of ammonia which decreases the methanogenic activity and affinity. This results in a rise of residual volatile fatty acids. Moreover, these fatty acids in turn inhibit the hydrolysis of polymers and acetogenesis of higher volatile fatty acids to acetate (Angelidaki, 1992). Inhibiting levels of fatty acids may also occur during overloads with substrates for which methanogenesis rather than hydrolysis is the limiting step, i.e. cellulose-poor substrates such as kitchen wastes. Since inhibitors often limit the degradative capacity (OLRmax) of reactors treating OFMSW, the sensitivity of reactor designs toward inhibition is of particular concern. In this respect, the one-stage wet system suffers the disadvantage that the reactor contents are fully dispersed and homogenized which eliminates spatial niches wherein bacteria may be protected from transitory high concentrations of inhibitors. This disadvantage is however compensated by the fact that fresh water may be added to incoming wastes to lower the concentration of potential inhibitors. For example, in Pavan, 1999b, the OFMSW was diluted two- to four-fold before feeding the reactor, apparently with tap water (no water recirculation was mentioned by the authors). The relevance of fresh water addition was demonstrated by Nordberg et al. (1992) in bench-scale reactors used to digest alfalfa silage. Process water produced in the dewatering stage was recycled to dilute the feed to a solid content of 6 % TS inside the reactor. However, the initially high biogas yield could be maintained only when a fraction of the recycled water was replaced by tap water in order to maintain the ammonium concentration below the threshold inhibitory level of 3 g/L. In the case of certain feed substrates, such as agro-industrial wastes with a C/N ratio below 20 and 60 % biodegradable VS, the ammonium concentration cannot be brought under this threshold value, even when tap water is used to dilute the feed (Weiland, 1992). In this case, the one-stage wet process fails entirely and special two-stage processes need to be applied.
32

5.5.1.3. Impacts The slurry of the solid wastes brings the economical advantage that cheaper equipment may be used, e.g. pumps and piping, relative to solid materials. This advantage is however balanced by the higher investment costs resulting from larger reactors with internal mixing, larger dewatering equipment, and necessary pre-treatment steps. Overall, investment costs are comparable to those for one-stage 'dry' systems. One drawback of ecological significance is the incomplete biogas recovery due to the fermentable substances removed with the floating scum layer and the heavy fraction. Another drawback is the relatively high water consumption necessary to dilute the wastes (about 1 m3
tap water per ton solid waste). Water consumption is often a decisive factor in the selection process of a reactor design in full-scale projects because higher water consumption, aside from ecological considerations, also incurs higher financial costs for water purchase, treatment before disposal and discharge fees. The dilution with water results in more heating requirements. This additional energy requirement does not however usually translate into larger internal use of produced biogas because the steam is usually recovered from the cooling water of the gas engines and exhaust fumes. In cases where the steam produced is exported to nearby factories, however, the yield will be lower. 5.5.2. Dry Single-Stage systems This type is also known under the name Dry Continuous Digestion. It is a continuously fed vessel with dry digested material content of 20-40%. Minimal water addition makes the overall heat balance very favorable for operation at thermophilic temperatures. Vandeviviere et al. (2002) illustrated the historical development of dry digesters. While the one-stage wet systems had initially been inspired from technology in use for the digestion of organic slurries, research during the 80's demonstrated that biogas yield and production rate were at least as high in systems where the wastes were kept in their original solid state, i.e. not diluted with water (Spendlin and Stegmann, 1988; Baeten and Verstraete, 1993; Oleszkiewicz and Poggi-Varaldo, 1997). The challenge was not one of keeping biochemical reactions going at high TS values, but rather one of handling, pumping and mixing solid streams. While most industrial facilities built until the 80's relied on 'wet' systems, the new plants erected during the last decade are evenly split between the wet and the dry systems (De Baere, 1999). No clear technology trend can be observed at this moment. Much will depend on the success of wet systems to deal with mechanically-sorted OFMSW. 'Dry' systems, on the other hand, have already proven reliable in France and Germany for the biomethanization of mechanically-sorted OFMSW. In dry systems, the fermenting mass within the reactor is kept at a solids content in the range 20 - 40 % TS, so that only very dry substrates (> 50 % TS) need to be diluted with process water (Oleszkiewicz and Poggi-Varaldo, 1997). The physical characteristics of the wastes at such high solids content impose technical approaches in terms of handling, mixing and pre-treatment which are fundamentally different from those of wet systems. Transport and handling of the wastes is carried out with conveyor belts, screws, and powerful pumps especially designed for highly viscous streams. This type of equipment is more expensive than the centifugal pumps used in wet systems and also much more robust and flexible in as much as wastes with solid content between 20 and 50 % can be handled and impurities such as stones, glass or wood do not cause any hindrance. The only pre-treatment which is necessary before feeding the wastes into the reactor is the removal of the coarse impurities larger than about 40 mm. This is accomplished either via
33

drum screens, as is typically the case with mechanically-sorted OFMSW, or via shredders in the case of source-separated biowaste (Fruteau de Laclos et al., 1997; De Baere and Boelens, 1999; Levasseur, 1999). The heavy inert materials such as stones and glass which pass the screens or shredder need not be removed from the waste stream as is the case in wet systems. This makes the pre-treatment of dry systems somewhat simpler than that of their wet counterparts and very attractive for the biomethanization of OFMSW which typically contain 25 % by weight of heavy inerts. 5.5.2.1.Full Scale Applications Several designs have been demonstrated effective for the adequate mixing of solid wastes at the industrial scale. All designs were meant to prevent local overloading and acidification. Some of these commercial installations and designs are illustrated hereunder according to Beck, 2004; Vandeviviere et al., 2002: Niederuzwil, Switzerland (Kompogas), In the Kompogas process the plug flow takes place horizontally in cylindrical reactors. The horizontal plug flow is aided by slowly-rotating impellers inside the reactors, which also serve for homogenization, degassing, and re-suspension of heavier particles. This system requires careful adjustment of the solid content around 23 % TS inside the reactor. At lower values, heavy particles such as sand and glass tend to sink and accumulate inside the reactor while higher TS values cause excessive resistance to the flow. Depending on the size and method of integration of the digester, Kompogas offers either steel or concrete digester reactors. In its original design, Kompogas fully integrated the steel digester reactor into a building. In its second design phase, the AD reactor has been built of concrete and made part of the building. In the newest design, Figure 10, which lowered the cost by a factor of two, the AD reactors are modular units of either concrete (>22,000 tons/year) or of steel (5,500-11,000 tons/year). The Niederuzwil plant was first constructed with the original design having an indoor steel AD reactor having the capacity to process about 8,800 tons/year. It was then extended by adding a new outdoor steel digester with a capacity of about 5,500 tons/year.
Figure 10 : Kompogas Dry Digester
34

In the existing plant, the waste is received in a pit and transported to a shredder having a mesh size of approximately 1.5 inches by a fully automatic crane. The undesirable materials are removed by hand-picking. The upgraded waste is stored in a container that uses a walking floor. This management measure enables Kompogas to be the only provider to offer an AD system that can operate 7 days a week without constant presence of operators. Since the system can function with just two manual checks/day and an emergency alarm system as back-up, this can minimize overall operational costs. In Figure 11, the old digester is in the background building and the new modular digester is in the foreground. Kompogas digesters are operated at 130°F to ensure that the digestate is fully sanitized. The average HRT is 15-18 days. Because of the proper plug flow operation with a guaranteed HRT, the Kompogas system is the only AD system to have passed sanitation requirements prescribed by German regulation.
Figure 11: Installation at Niederuzwil, Switzerland, Kompogas system The digester mixer does not destroy the plug flow characteristics because it moves very slowly - only a partial rotation in intervals. The feedstock is heated in a tubular heat exchanger alongside the digester as depicted in Figure 12.
Figure 12: Kompogas heat exchanger Part of the digestate is recycled and mixed with the fresh material to assure inoculation. The larger part of the digestate is separated into a liquid fertilizer and a fiber as depicted in Figure 13. The fiber can potentially be composted.
35

Figure 13: Kombogas fiber separation Lemgo, Germany (Linde-BRV), The Linde-BRV dry digestion system is similar to the Kompogas system, with a few minimal design differences. For example, some of the reactor heating is done outside the digester with a short heat exchanger, but primarily heating occurs within the digester walls using a heat exchanger. After solid separation only the liquid fraction is recycled which leads to a lower inoculation rate and, hence, a little longer HRT. As shown in Figure 14, the process is not a plug-flow system because feedstock mixing is more pronounced with the transverse paddles and the walking floor.
Figure 14: Linde-BRV solids digestion system
An innovative part of the design is the batch-wise removal, extracting system Figure 15, of the feedstock into a recipient reactor under negative pressure and the thermal concentration of the liquid digestate in a vacuum dryer at a temperature of 160°F. The BRV system uses much more equipment than a comparable Kompogas system. In Lemgo, the OFMSW is reduced in size by a screw mill and undergoes a 2 to 4 day period of anaerobic hydrolysis. Before the treated material is fed to the digester, it is chopped by a calibrator into 1.5 inch pieces in the chopper shown in Figure 16. After thermophilic digestion with an HRT of about 21 days, the digestate is separated into a liquid fraction with a 20% TS content and a solid fraction having a >45% TS content. The liquid fraction is recycled to dilute the incoming fresh waste, and to moisten the compost windrows. The excess liquid is concentrated and added to the compost. The fiber is post-composted for 30 days.
36

Figure 15: Linde BRV extracting system
Figure 16: Lemgo feedstock chopper (Calibrator) Aarburg, Switzerland (Dranco), in the Dranco process, the mixing occurs via recirculation of the wastes extracted at the bottom end, mixing with fresh wastes (one part fresh wastes for six parts digested wastes), and pumping to the top of the reactor. This simple design has been shown effective for the treatment of wastes ranging from 20 to 50 % TS. After mechanical separation using a mesh size of 1.5 inches in this Dranco HSAD facility, the OFMSW is steam heated and fed into the digester using comparable equipment to that used by the Valorga process. However, about 10% of fresh material is externally mixed with 90% of recycled digestate. The vertical steel tank has a cylindrical form, Figure 17, with a conical bottom of 45° angle. The feedstock is fed through the top; the digestate removed at the lowest point. There is neither any mixing nor any heating inside the AD reactor. However, the feedstock is fully recycled within two days or less, which corresponds to a smooth external mixing. The digester is operated at 130°F, with a TS content of 18%-35%. The HRT may vary from 18 to 24 days with average organic loading rates of 0.312-0.437 lb VS/ft3/day. Like Valorga, Dranco feeds the digester five days a week. The treatment of the digestate is absolutely identical to the Valorga process that is shown later. In Aarburg, the post-treatment composting of the fiber fraction is done at different composting units that deliver part of their waste to the plant.
37

Figure 17: Dranco Solids Digester Installation at Aarburg, Switzerland Geneva, Switzerland (Valorga), The Valorga system is quite different in that the horizontal plug flow is circular in a cylindrical reactor and mixing occurs via biogas injection at high pressure at the bottom of the reactor every 15 minutes through a network of injectors (Fruteau de Laclos et al., 1997). This elegant pneumatic mixing mode seems to work very satisfactorily since the digested wastes leaving the reactor need not be re-circulated to dilute the incoming wastes. One technical drawback of this mixing design is that gas injection ports become clogged and maintenance of these is obviously cumbersome. As in the Kompogas process, process water is re-circulated in order to achieve a solid content of 30 % TS inside the reactor. The Valorga design is ill-suited for relatively wet wastes since sedimentation of heavy particles inside the reactor takes place at solid contents beneath 20 % TS. Due to mechanical constraints, the volume of the Kompogas reactor is fixed and the capacity of the plant is adjusted by building several reactors in parallel, each one with a treatment capacity of either 15,000 or 25,000 ton/yr (Thurm and Schmid, 1999). On the other hand, the volume of the Dranco and Valorga reactors can be adjusted in function of the capacity required, though they are not made to exceed 3300 m3
and a height of 25 m. Valorga operates at least 13 AD facilities in Europe as of 2003. The feedstocks include primarily municipal solid waste and biowaste. The basic layout of the Valorga plants has remained much the same since the mid 1990’s. The digester reactor is built in concrete and intermittently mixed by adding compressed biogas. Figure 18 below depicts the Geneva AD Facility. Most of the Valorga AD systems are operated at mesophilic temperatures as opposed to the more commonly used thermophilic. Due to the operating characteristics in Geneva, the methane content of the biogas is lower when compared to some other processes. The average methane content of the biogas is about 55% when the system is operated at mesophilic temperatures. The process has slightly higher methane content when operated under thermophilic conditions.
38

Figure 18: Valorga system installation at Geneva, Switzerland
At Geneva, only source separated organic waste is digested. The plant is designed for 11,000 tons/year, with peak loads equivalent to 13,200 tons/year. After milling and mechanical separation (mesh size 2.5 inches), the waste is fed into the digester using a Putzmeister double screw mixing pump. At the same time, a part of the digested material is recycled in order to inoculate the fresh material. The dry matter is adjusted with recycled water to a TS concentration of approximately 30%. During digester mixing, steam is injected in order to heat up the feedstock to 130°F. There is no heat exchanger in the digester. The concrete digester has the form of a vertical cylinder with a height of 36ft. The source separated material is fed into the bottom on one side of a vertical median inner wall and is removed at the other side of the wall at the bottom as well. The wall has a length of 2/3 of the diameter dividing the digester reactor into two halves. The Valorga digester is completely stirred due to its individual stirring sectors, but in total the transportation of the material around the inner partition of the reactor is reported by Valorga to have the character of a plug (piston) flow. As shown in Figure 19, the digester is fully mixed using a pneumatic compression system. In it, biogas is compressed and injected through a large number of nozzles in the bottom of the digester. The nozzles are divided in 8 to 12 different sectors, each individually operated. The treated material is removed by the static pressure of the digester through a valve. The digestate is separated by a screw press into a fiber and liquid fraction without the addition of poly-electrolytes (polymers). The liquid is further treated: sand is removed by a hydrocyclone and suspended solids are later removed by a belt filter press. The digester is operated with a rather long HRT of 30 days or more, which increases the volume of the digester reactor. On the other hand, this extra volume gives the digestion process a certain tolerance, i.e., the addition of more waste during peak loads is easily absorbed. The organic matter loading rate is around 0.425 lb of VS/ft3/day. The incoming feedstock should have a TS content of greater than 25%. At lower values, sedimentation could occur in the digester reactor. Another Valorga facility recently became operational in Bassano Del Grappa, Italy. It is designed to accept up to 55,000 tons per year of MSW and biowaste.
39
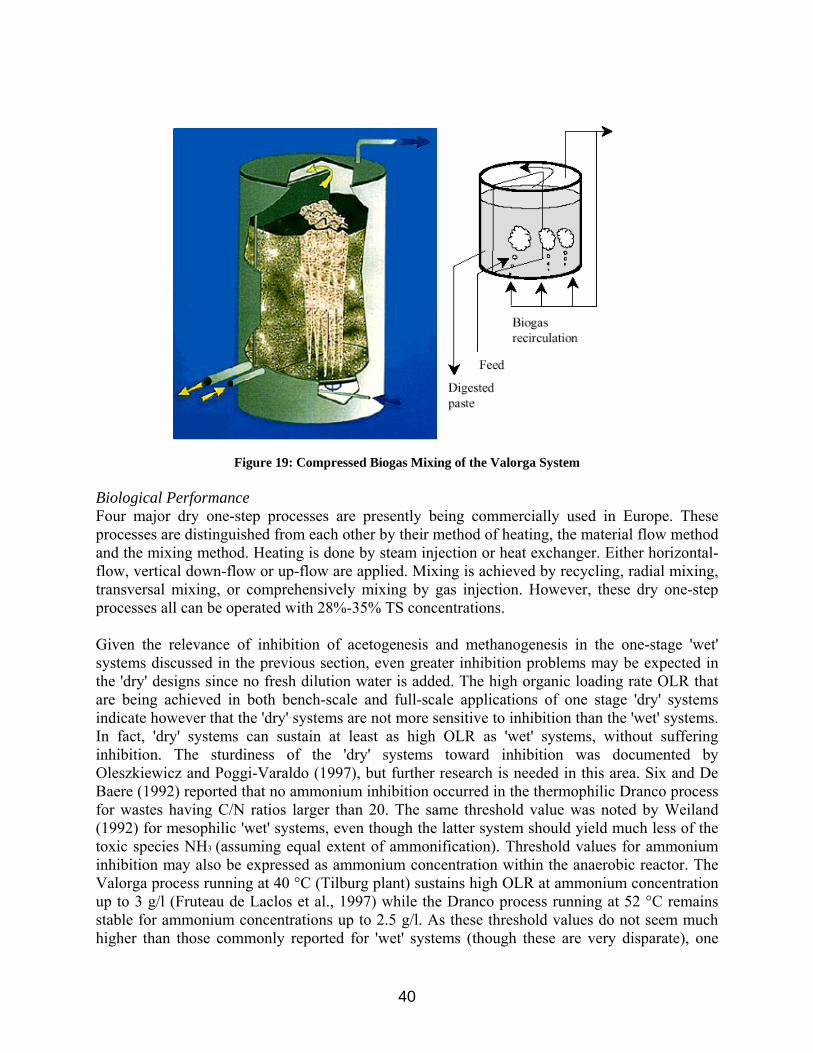
Figure 19: Compressed Biogas Mixing of the Valorga System Biological Performance Four major dry one-step processes are presently being commercially used in Europe. These processes are distinguished from each other by their method of heating, the material flow method and the mixing method. Heating is done by steam injection or heat exchanger. Either horizontal-flow, vertical down-flow or up-flow are applied. Mixing is achieved by recycling, radial mixing, transversal mixing, or comprehensively mixing by gas injection. However, these dry one-step processes all can be operated with 28%-35% TS concentrations.
Given the relevance of inhibition of acetogenesis and methanogenesis in the one-stage 'wet' systems discussed in the previous section, even greater inhibition problems may be expected in the 'dry' designs since no fresh dilution water is added. The high organic loading rate OLR that are being achieved in both bench-scale and full-scale applications of one stage 'dry' systems indicate however that the 'dry' systems are not more sensitive to inhibition than the 'wet' systems. In fact, 'dry' systems can sustain at least as high OLR as 'wet' systems, without suffering inhibition. The sturdiness of the 'dry' systems toward inhibition was documented by Oleszkiewicz and Poggi-Varaldo (1997), but further research is needed in this area. Six and De Baere (1992) reported that no ammonium inhibition occurred in the thermophilic Dranco process for wastes having C/N ratios larger than 20. The same threshold value was noted by Weiland (1992) for mesophilic 'wet' systems, even though the latter system should yield much less of the toxic species NH3 (assuming equal extent of ammonification). Threshold values for ammonium inhibition may also be expressed as ammonium concentration within the anaerobic reactor. The Valorga process running at 40 °C (Tilburg plant) sustains high OLR at ammonium concentration up to 3 g/l (Fruteau de Laclos et al., 1997) while the Dranco process running at 52 °C remains stable for ammonium concentrations up to 2.5 g/l. As these threshold values do not seem much higher than those commonly reported for 'wet' systems (though these are very disparate), one
40

may speculate that the extent of ammonification is less in dry systems, leading to smaller production of inhibitory ammonium. Another possible explanation is that micro-organisms within a dry fermenting medium are better shielded against toxicants since the absence of full mixing within the reactor limits the temporary shock loads to restricted zones in the digester, leaving other zones little exposed to transient high levels of inhibitors. In terms of extent of VS destruction, the three 'dry' reactor designs discussed above seem to perform very similarly, with biogas yields ranging from 90 m3/ton ~ 3178 ft3/ton fresh garden waste to 150 m3/ton ~ 5300 ft3/ton fresh food waste (Fruteau de Laclos et al., 1997; De Baere, 1999). These yields correspond to 210 - 300 m3
CH4 /ton VS, i.e. 50 - 70 % VS destruction. Though as discussed above the biogas yield is not an accurate measure of a system performance, it can be noted that these values are comparable to those achieved with wet systems which fall in the range 40 - 70 % VS destruction (Weiland, 1992; Pavan et al., 1999b; Westergard and Teir, 1999). A slightly greater biogas yield can however be expected with 'dry' systems compared to 'wet' systems since neither heavy inerts nor scum layer need be removed before or during the digestion. Differences among the dry systems are more significant in terms of sustainable OLR. The Valorga plant at Tilburg, The Netherlands, treats peaks of 1,000 Ton Vegetable-fruit-garden wastes (VFG) wastes per week in two digesters of 3,000 m3
~ 10600 ft3 each at 40 °C (Fruteau de Laclos et al., 1997). This corresponds to an OLR of 5 kg VS/m3.d ~0.31 Ib VS/ft3.d, a value comparable to the design values of plants relying on wet systems. Optimized 'dry' systems may however sustain much higher OLR such as the Dranco plant in Brecht, Belgium, where OLR values of 15 kg VS/m3.d~0.94 Ib VS/ft3.d were maintained as an average during a one-year period (De Baere, 1999). This very high value is achieved without any dilution of the wastes, i.e. 35 % TS inside the reactor, and corresponds to a retention time of 14 days during the summer months with 65% VS destruction. Typical design OLR values of the Dranco process are however more conservative (12 kg VS/m3.d) but remain about twice as high as those for 'wet' systems. As a consequence, at equal capacity, the reactor volume of a Dranco plant is two-fold smaller than that of a 'wet' system. Due to their high viscosity, the fermenting wastes move via plug flow inside the reactors, contrary to wet systems where complete mix reactors are usually used. The use of plug flow within the reactor offers the advantage of technical simplicity as no mechanical devices need to be installed within the reactor. It leaves the problem of mixing the incoming wastes with the fermenting mass, which is crucial to adequate inoculation. 5.5.2.2.Impacts The economic differences between the 'wet' and 'dry' systems are small, both in terms of investment and operational costs. The higher costs for the sturdy waste handling devices such as pumps, screws and valves required for 'dry' systems are compensated by a cheaper pre-treatment and reactor, the latter being several times smaller than for 'wet' systems. The smaller heat requirement of 'dry' systems does not usually translate in financial gain since the excess heat from gas motors is rarely sold to nearby industries. As in the case of 'wet' systems, 30% of produced electricity is used within the plant. Differences between the 'wet' and 'dry' systems are more substantial on environmental issues. While 'wet' systems typically consume one m3
of water per ton OFMSW treated, the water consumption of their 'dry' counterparts is ca. ten-fold less. As a consequence, the volume of wastewater to be discharged is several-fold less for 'dry' systems. Another environmental advantage of 'dry' systems is that the plug flow within the reactor
41

guarantees, at least under thermophilic conditions, the complete hygienization of the wastes and pathogen-free compost as an end-product (Baeten and Verstraete, 1993). 5.6. The Proposed New Design of Single Stage HSAD System This section illustrates and compares the new design proposed in this project. This design combines the benefits of aforementioned Single-Stage digesters and allows operation under dry and wet configuration. It employs the pretreatment applied with the existing systems as integrated part of the solids digestion process. Thus, inoculation is maintained, toxicity is reduced and mixing costs are reduced. The new design to be investigated in this project is shown schematically in Figure 20. Solids recycling and intensive solid mixing are not needed. The bacteria will be grown at high rate separately in the seed reactor. Bacterial seed will be grown on leachate from a portion of the solid waste (from a leaching upstream tank) and seeded in the solid waste influent, so that the new feedstock is provided with bacterial inoculums upon entering the digester.
Figure 20 Proposed new design scheme Five main points are the main innovations of the new proposed design of high solids digestion. First the biological reaction rates are maximized by increasing the bacterial population rather than increasing the biomass specific rate. Second, the bacteria are initially grown separately and inoculated with the fed waste so that recycling of the effluent to enrich the bacterial population is not required. Third, mixing the bacteria with reactor feed guarantees an even distribution of bacteria and avoids excessive mixing required by alternative designs. Fourth, growing the bacteria separately in the seed tank on the leachate of the solid waste facilitates better control for maximizing the growth, utilizing the easily degradable soluble organic portion. Fifth, using the leachate to grow the seed allows an acclimatization period to toxic components, e.g. ammonia. Acetoclastic methanogenic bacteria can be acclimated to high ammonia concentration (Fujishima, 2000). The toxicity of ammonium is due to the unionized form (free NH3) (Siegrist and Batstone, 2001). The fraction of free NH3 is low at a pH value of 7 (about 1% of the (NH4
++NH3) content) and therefore the pH of the seed tank will be controlled at pH 7. Comparing the newly proposed and existing designs, Table 7 lists the advantages and disadvantages of the existing one stage high solids digesters and comparisons with the new design. Mainly the new design maximizes the advantages reported for existing systems. Moreover, the new design is to eliminate the reported disadvantages for existing systems (e.g.,
High solids digesterSolids
Treated liquors
leac
hate
SeedSeed reactor
Influent mixing
Biogas
42

Dranco, Kompogas, Linde-BRV and Valorga). The comparison is only listed versus one stage systems since two stage systems that are discussed later, are found to be complex and expensive for full scale applications. The main advantage of the two-stage system is better hydrolysis of solid wastes that contain high cellulose content. Efficient hydrolysis is also expected with the new design. Many recent research endeavors try to speed up the hydrolysis step (refer to section 4 of this report). Physical and chemical pretreatment are applied to speed this process. Hydrolysis of solid waste is an enzyme catalyzed reaction to break complex molecules. Bacteria produce such enzymes and turn substrates to simpler molecules that can be easily ingested in their cells and biologically degraded. So, seeding high concentration of bacteria with the influent waste will produce enough enzymes for the hydrolysis and speed up the biological reactions. The innovative design of this project helps maximize the biological driving force of the hydrolysis step.
Table 7 Advantages and disadvantages of existing high solids systems and the new design, upgraded from (Vandeviviere et al., 2002).
Advantages Disadvantages Criteria
Existing single stage digesters
New design Existing single stage digesters
New design
Technical (efficiency)
- No moving parts inside reactor - Robust (inerts and plastics need not be removed) - No short-circuiting
- Same - Same - Better: bacteria is thoroughly mixed with feedstock
- Wet wastes (< 20 % TS) cannot be treated alone
- Eliminated: liquid leachate is diverted to and treated in the seed reactor - Extra seed production is additional operation and capital cost
Biological (reliability)
- Less VS loss in pre- treatment - Larger OLR (high biomass) - Limited dispersion of transient peak concentrations of inhibitors
- Better: Volatile Substrate are converted in the seed reactor - Better: biomass (bacteria) is seeded - Better: bacterial seed is adapted to toxicants
- Little possibility to dilute inhibitors with fresh water
- Eliminated: in the seed reactor bacteria is adapted to toxicants
Economical & Environmental
- Cheaper pre-treatment and smaller reactors - Complete hygienization - Very small water usage - Smaller heat requirement
- Better: much smaller reactors for higher bacterial concentration - Same if not better - Same - Better: more indo heat - Much biogas production
- More robust and expensive waste handling equipment (compensated by smaller and simpler reactor)
Eliminated: no expensive equipment are needed, ( no solid recycling is needed, mixing requirements are not needed)
5.7. Two-Stage Systems The rationale of two- and multi-stage systems is that the overall conversion process of OFMSW to biogas is mediated by a sequence of biochemical reactions which do not necessarily share the same optimal environmental conditions. Optimizing these reactions separately in different stages or reactors may lead to a larger overall reaction rate and biogas yield (Ghosh et al., 1999).
43

Typically, two stages are used where the first stage harbours the liquefaction-acidification reactions, with a rate limited by the hydrolysis of cellulose, and the second one harbours the acetogenesis and methanogenesis, with a rate limited by the slow microbial growth rate (Liu and Ghosh, 1997; Palmowski and Müller, 1999). With these two steps occurring in distinct reactors, it becomes possible to increase the rate of methanogenesis by designing the second reactor with a biomass retention scheme or other means (Weiland, 1992; Kübler and Wild, 1992). In parallel, it is possible to increase the rate of hydrolysis in the first stage by using microaerophilic conditions or other means (Capela et al., 1999; Wellinger et al., 1999). The application of these principles has led to a great variety of two-stage designs. The increased technical complexity of two-stage relative to single-stage systems has not however always been translated in the expected higher COD removal rates and biogas yields (Weiland, 1992). In fact, the main advantage, listed in Table 8 of two-stage systems is not a putative higher reaction rate, but rather a greater biological reliability for wastes which cause unstable performance in one-stage systems. It should be noted however that, in the context of industrial applications, even for the challenging treatment of highly degradable OFMSW, preference is given to technically-simpler one-stage plants. Biological reliability is then achieved by adequate buffering and mixing of incoming wastes, by precisely-controlled feeding rate and, if possible, by resorting to co-digestion with other types of wastes (Weiland, 2000). Industrial applications have up to now displayed little acceptance for two-stage systems as these represent only 10% of the current capacity (De Baere, 1999). A distinction should be made between two-stage systems with and without a biomass retention scheme in the second stage (Vandeviviere et al., 2002). Accordingly, both systems are illustrated later. The retention of biomass within a reactor is an important variable in determining the biological stability of the digester. Unstable performance can be caused either by fluctuations of OLR, due to wastes heterogeneity or discontinuous feeding, or by wastes excessively charged with inhibiting substances such as nitrogen. All types of two-stage systems, regardless of whether biomass is accumulated provide some protection against the fluctuations of OLR. However, only those two-stage systems with biomass retention schemes display stable performance with wastes excessively charged with nitrogen or other inhibitors (Weiland, 1992). Most commercial two-stage designs propose a biomass retention scheme in the second stage.
Table 8 Advantages and disadvantages of two stage systems (Vandeviviere et al., 2002).
Criteria
Advantages
Disadvantages
Technical
- Design flexibility
- Complex
Biological/Biomass retention More reliable for cellulose-poor kitchen waste - Only reliable design (with biomass retention) for C/N < 20
- Smaller biogas yield (when solids not methanogenized)
Economical & Environmental
- Less heavy metal in compost (when solids not methanogenized)
- Larger investment
44

5.7.1. Two Stage Systems without Biomass Retention The simplest design of two-stage systems (used primarily in laboratory investigations) is two complete mix reactors in series (Pavan et al., 1999a; Scherer et al., 1999). The technical features of each reactor are comparable to those presented above for the one-stage 'wet' system. The wastes are shredded and diluted with process water to 10 % TS before entering the first digester. Another possible design is the combination in series of two plug-flow reactors, either in the 'wet-wet' or 'dry-dry' mode, as illustrated by the Schwarting-Uhde and BRV processes, respectively. The source-sorted biowaste, finely chopped and diluted to 12 % TS, rises upward through a series of perforated plates placed within the reactors Figure 21. Uniform upward movement is imparted by pulsating pumps which also ensure localized short term mixing via time-controlled impulses creating rapid rising of the liquid column (Trösch and Niemann, 1999). The impulses also push the biogas through the plate apertures. This elegant design, applied under 'wet' thermophilic conditions, is able to ensure, without any internal moving parts, adequate mixing and a plug flow mode which guarantees complete hygienization since short-circuiting is avoided. Moreover this design is not conducive to the formation of the thick floating scum layer commonly plaguing wet reactors. Its sensitivity to clogging of the perforated plates limits however the Schwarting-Uhde process to relatively clean highly biodegradable biowastes.
Figure 21: The Schwarting-Uhde process, a two-stage 'wet-wet' plug-flow system
applicable to source-sorted biowastes, finely-choped (ca. 1 mm) and diluted to 12 % TS, adapted from (Vandeviviere et al., 2002).
In the BRV process, the source-separated OFMSW adjusted to 34 % TS, pass through an aerobic upstream stage where organics are partially hydrolyzed and 2 % lost through respiration. The reason for conducting the hydrolysis stage under microaerophilic conditions is that the loss of COD due to respiration is more than compensated by a higher extent of liquefaction, which, moreover, proceeds faster than under anaerobic conditions (Wellinger et al., 1999; Capela et al., 1999). After a two-day retention time, the pre-digested wastes are pumped through methanogenic reactors in a horizontal plug flow mode. The digestion lasts 25 days at 55 °C and 22 % TS. The primary advantages of this system are the use of 'dry' conditions which reduces the size of the digesters and the use of piston flow which affords complete hygienization without a pasteurization step. The horizontal flow requires however the use of floor scrapers to eliminate
45

the heavy material from the reactor and mixing equipment inside the reactor to prevent the formation of a crust layer. 5.7.1.1. Biological Performance The main advantage of the two-stage system is the greater biological stability it affords for very rapidly degradable wastes like fruits and vegetables (Pavan et al., 1999a). The reason commonly invoked is that the slower metabolism of methanogens relative to acidogens would lead to inhibiting accumulation of acids. Theoretically, however, this reasoning seems illogical as it would suffice to adjust the OLR of a one-stage system to the rate which can be handled by the methanogens to avoid any risk of acid accumulation. The OLR chosen in this manner for a one-stage system would not be inferior to that of a two-stage system. In the practice, however, the greater reliability of two-stage systems has indeed at times been observed, at least in discontinuously-fed laboratory set-ups. For example, Pavan et al. (1999a) compared the performances of the one- and two-stage systems, using pilot complete mix reactors fed with very rapidly hydrolyzable biowastes from fruit and vegetable markets. While the one-stage system failed at 3.3 kg VS/m3.d~0.2 Ib VS/ft3.d, the performance of the two-stage plant remained stable at an overall system OLR of 7 kg VS/m3.d. This departure from theoretical predictions can be explained by the fact that actually applied OLR vary a great deal with time and space due to the heterogeneity of wastes and due to the discontinuous working of the feeding pump (feeding occurred only four times daily in the Pavan study). In cases where special care is taken to mix the feed thoroughly and dose it at constant OLR, one-stage 'wet' systems are as reliable and perform as well as two-stage systems even for highly degradable agro-industrial wastes, provided these have a C/N above 20 (Weiland, 1992). The short-lived fluctuations of the actually applied OLR may lead to short-lived overloading in the one-stage system. In a two-stage system, however, these OLR fluctuations are somewhat buffered by the first stage, so that the OLR applied to the second stage is more uniform in time and space. In fact, this buffering of OLR in the first stage is somewhat similar to the effect of the plug flow pattern often used in the one-stage 'dry' systems because a plug flow with external mixing leaves large zones in the digester unexposed to transient high concentrations of inhibitors. Highly biodegradable kitchen wastes can indeed be digested in single-stage reactors provided these are thoroughly mixed before feeding and provided feeding occurs continuously, or at least five days per week as in the one-stage 'dry' Dranco plant in Salzburg, Austria. This plant, which treats kitchen wastes, achieves a mean OLR of 5.0 kg VS/m3.d~0.31 Ib VS/ft3.d with 80 % VS destruction. As pointed out by Edelman et al. (1999), the OLR buffering taking place in a pre-digester is beneficial and useful only for the treatment of cellulose-poor wastes for which methanogenesis rather than hydrolysis-acidification is the rate limiting step. For the majority of wastes, however, hydrolysis of cellulose is the rate-limiting step (Noike et al., 1985), and shock loads are not conducive to inhibition. The second type of inhibition, resulting from unbalanced average composition of feed rather than from transient shock load, is, however, as deleterious to two-stage systems as it is to one-stage systems, except in cases where two-stage systems are equipped with a biomass retention scheme in the second stage, e.g. via attached growth on a fixed bed. In terms of biogas yields and OLRmax, little difference can be noted between one- and two-stage systems, at least for these two-stage systems without biomass retention discussed in this section. For example, the BRV plant in Heppenheim is designed with an OLR of 8.0 kg VS/m3.d ~0.5 Ib VS/ft3.d while the
46

Schwarting- Uhde process seems to sustain an OLRmax up to 6 kg VS/m3.d (Trösch andNiemann, 1999). 5.7.2. Two Stage Systems with a Biomass Retention Scheme In order to increase rates and resistance to shock loads or inhibiting substances, it is desirable to achieve high cell densities of the slowly-growing methanogenic consortium in the second stage. There are two basic ways to achieve this. The first method to increase the concentration of methanogens in the second stage is to uncouple the hydraulic and solids retention time, thereby raising the solid content in the methanogenic reactor. These accumulated solids represent active biomass only in the case of wastes leaving no more than 5-15 % of their original solid content as residual suspended solids inside the reactor. This design will therefore be effective only for highly hydrolyzable kitchen or market wastes (Weiland, 1992; Madokoro et al., 1999). One way to uncouple the solid and hydraulic retention times is to use a contact reactor with internal clarifier (Weiland, 1992). Another way is to filter the effluent of the second stage on a membrane and return the concentrate in the reactor in order to retain the bacteria (Madokoro et al., 1999). Plugging of the micro-filtration membranes can be avoided using a high cross-flow velocity achieved via re-injection of biogas. Excessive biomass was purged in a separate outlet line. Further up-scaling of these two interesting designs, which up to now could only be tested in small pilot plants, may face technical challenges such as the crushing of the feed down to 0.7 mm. Another method to increase the concentration of slowly-growing methanogens in the second stage is to design the latter with support material allowing attached growth, high cell densities and long sludge age. The prerequisite of this design avenue is however that the feed to the attached growth reactor be very little charged with suspended particles, which means that the suspended solids remaining after the hydrolysis (first) stage should be removed. Two industrial processes, the BTA and Biopercolat designs, are based on these principles. In the BTA 'wet-wet' process, illustrated in Figure 22, the 10 % TS pulp exiting the pasteurization step is dewatered and the liquor directly sent to the methanogenic reactor (Kübler and Wild, 1992). The solid cake is resuspended in process water and hydrolyzed in a complete mix reactor under mesophilic conditions (HRT 2-3 d). The pH within the hydrolysis reactor is maintained in the range 6-7 by recirculating process water from the methanogenic reactor. The output stream of the hydrolysis reactor is once more dewatered and the liquor fed to the methanogenic reactor. The latter, receiving only liquid effluents, is designed as a fixed film loop reactor in order to increase biomass concentration and age. From a technical point of view, this design shares the same limitations as the one-stage 'wet' system, i.e. short-circuiting, foaming, sinking of heavies, fouling of the impeller blades with plastic foils, obstruction of pipes with long objects such as sticks, and loss of 10-30 % of the incoming VS caused by the removal of the rake fraction in the hydropulper (Kübler and Wild, 1992). The major drawback of the 'wet-wet' system remains however its technical complexity as four reactors are necessary to achieve what other systems achieve in a single reactor. The Biopercolat follows the same principles as the BTA process, with the difference that the first stage is carried out under 'dry' and microaerophilic conditions and is continuously percolated with process water to accelerate the liquefaction reaction (Edelmann et al., 1999; Wellinger et al., 1999). The flush water, containing up to 100 g COD/l, is fed to an anaerobic plug-flow filter filled with a support material. The separate optimization of the first stage, via aeration, and of the second stage, via biofilm growth, allows the system to run at the exceedingly low overall
47

retention time of 7 days. The Biopercolat system is quite innovative from a technical point of view. In order to prevent the channelling and clogging typically occurring in 'dry' percolated systems (see section 'batch design'), percolation occurs in large slowly-rotating (1 rpm) sieve drums with 1 mm mesh openings. In the methanogenic filter, a pulsating motion is imparted to the horizontal plug flow in order to prevent plugging of the support material, improve mass transfer of substrates to biofilm, and improve degasification. Moreover, the 'dry' design of the percolation hydrolysis stage avoids the troublesome pulping stage required in 'wet' or 'wet-wet' systems. This system still awaits validation in the first full-scale plant currently planned in Germany (Garcia and Schalk, 1999).
Figure 22: Two-stage 'wet-wet' design with a biomass retention scheme in the second stage (BTA process). The
non-hydrolyzed solids are not sent to the second stage. 5.7.2.1. Biological Performance As a consequence of the higher biomass concentration in two-stage designs with attached growth, greater resistance toward inhibiting chemicals is achieved. Weiland (1992) compared one- and two-stage 'wet' pilot plants for the treatment of highly biodegradable agro-industrial wastes. While the one-stage system failed at OLR of 4 kg VS/m3.d ~0.25 Ib VS/ft3.d for those wastes which yielded ca. 5 g NH4
+/l due to ammonium inhibition, the same wastes could be processed in the two stage system at OLR of 8 kg VS/m3.d ~0.5 Ib VS/ft3.d without impairment of methanogenesis. The stability of the methanogenesis at such elevated ammonium concentration was attributed to the higher bacterial concentration and age which could be obtained in the contact reactor with internal clarifier used in the second stage. Another consequence of two-stage systems with biomass retention is the possibility of applying higher OLR in the methanogenic reactor, with values up to 10 and 15 kg VS/m3.d ~0.62-0.94 Ib VS/ft3.d reported for the BTA and Biopercolat processes, respectively (Kübler and Wild, 1992; Wellinger et al., 1999). These relatively high rates were however only achieved at the cost of 20-30 % lower biogas yields, due to the fact that the coarse solid particles remaining after the short hydrolysis stage, which still contain residual biodegradable polymers, are not fed to the methanogenic digester (Kübler and Wild, 1992; Garcia and Schalk, 1999).
48
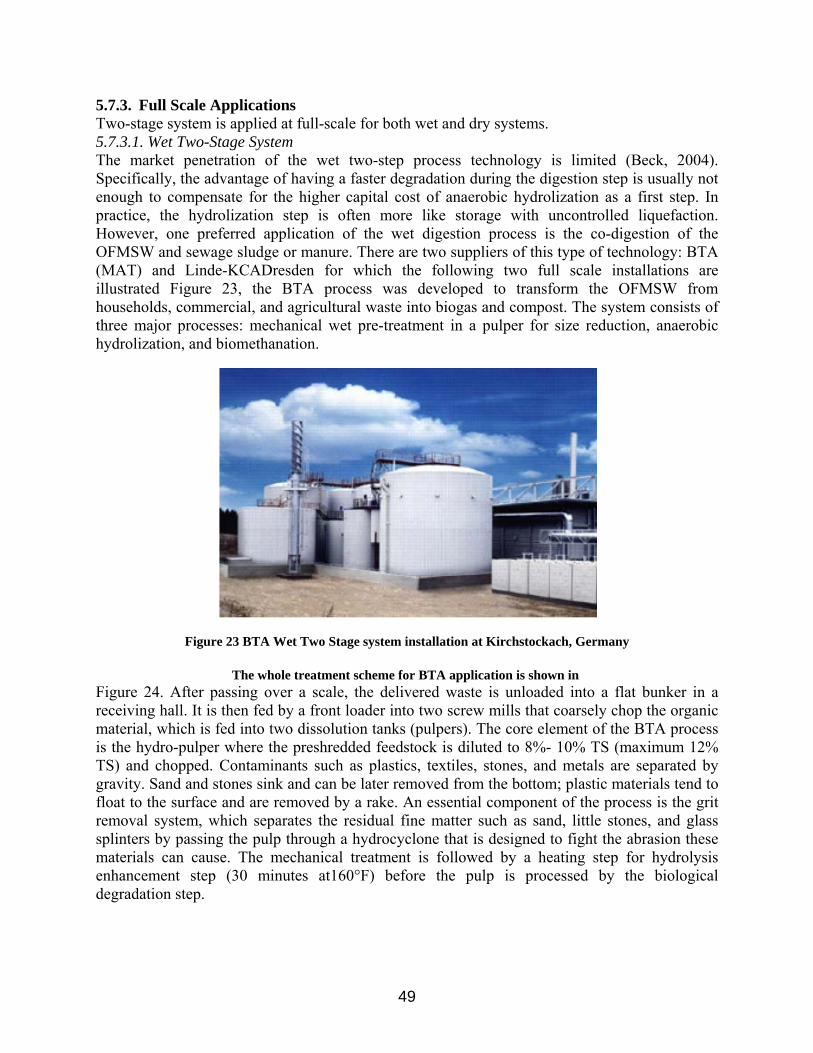
5.7.3. Full Scale Applications Two-stage system is applied at full-scale for both wet and dry systems. 5.7.3.1. Wet Two-Stage System The market penetration of the wet two-step process technology is limited (Beck, 2004). Specifically, the advantage of having a faster degradation during the digestion step is usually not enough to compensate for the higher capital cost of anaerobic hydrolization as a first step. In practice, the hydrolization step is often more like storage with uncontrolled liquefaction. However, one preferred application of the wet digestion process is the co-digestion of the OFMSW and sewage sludge or manure. There are two suppliers of this type of technology: BTA (MAT) and Linde-KCADresden for which the following two full scale installations are illustrated Figure 23, the BTA process was developed to transform the OFMSW from households, commercial, and agricultural waste into biogas and compost. The system consists of three major processes: mechanical wet pre-treatment in a pulper for size reduction, anaerobic hydrolization, and biomethanation.
Figure 23 BTA Wet Two Stage system installation at Kirchstockach, Germany
The whole treatment scheme for BTA application is shown in Figure 24. After passing over a scale, the delivered waste is unloaded into a flat bunker in a receiving hall. It is then fed by a front loader into two screw mills that coarsely chop the organic material, which is fed into two dissolution tanks (pulpers). The core element of the BTA process is the hydro-pulper where the preshredded feedstock is diluted to 8%- 10% TS (maximum 12% TS) and chopped. Contaminants such as plastics, textiles, stones, and metals are separated by gravity. Sand and stones sink and can be later removed from the bottom; plastic materials tend to float to the surface and are removed by a rake. An essential component of the process is the grit removal system, which separates the residual fine matter such as sand, little stones, and glass splinters by passing the pulp through a hydrocyclone that is designed to fight the abrasion these materials can cause. The mechanical treatment is followed by a heating step for hydrolysis enhancement step (30 minutes at160°F) before the pulp is processed by the biological degradation step.
49

Figure 24: The treatment scheme for the BTA system The biological degradation step is divided into a hydrolysis step and a biomethanization step that occurs in a fixed film reactor. Before the hydrolysis step, the suspended materials are dewatered and separated into liquid and solid factions. The liquid contains a high volume of previously dissolved organics, and is pumped directly into the AD reactor. The dewatered solids are re-mixed with process water and fed into the hydrolysis reactor to dissolve the remaining organic solids. After 2-4 days the hydrolyzed suspension is dewatered and the hydrolysis-liquid is also fed into the AD reactor. The fiber that remains after hydrolysis is a high quality material: it is free of pathogens with a low-salt concentration. Post-digestion composting is generally not needed. The liquid fraction is treated by a cleaning system that consists of sedimentation steps and a biological nitrification/denitrification step to remove some of the nutrients. Most of the cleaned liquid is reused as process water by the pulpers for the treatment of further waste. A small amount of the liquid is discharged as mechanical-biological pre-cleaned surplus water and is fed into the public sewer for final handling by a municipal WWTP. Wels, Austria (Linde-KCA-Dresden), Figure 25, Linde-KCA-Dresden GmbH is a wholly owned subsidiary of Linde AG. Linde’s wet digestion system for OFMSW is comparable to the BTA design with the major difference being how the light fraction is separated. The light fraction is separated via a drum screen and not within the pulper (Beck, 2004).
Figure 25: Linde-KCA-Dresden wet two stage system.
Depending on the type of input material, Linde’s two-stage wet digestion processes can be run at either thermophilic or mesophilic temperatures. The characteristic feature of the Linde
50
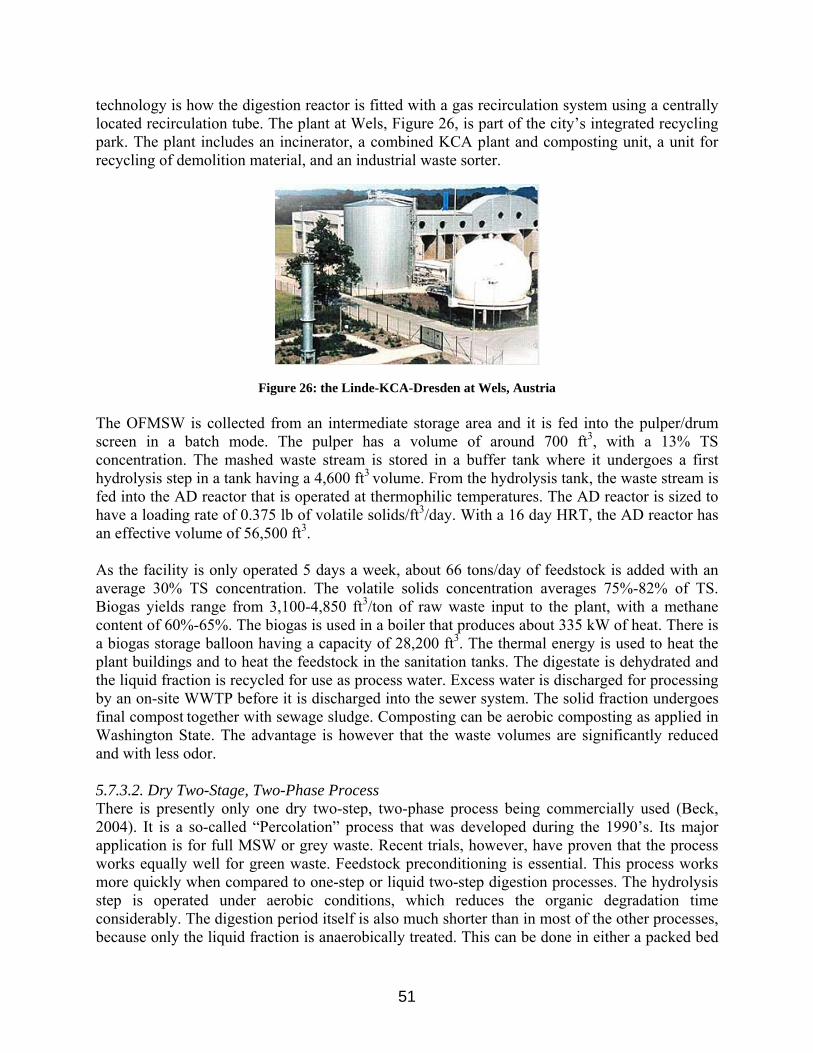
technology is how the digestion reactor is fitted with a gas recirculation system using a centrally located recirculation tube. The plant at Wels, Figure 26, is part of the city’s integrated recycling park. The plant includes an incinerator, a combined KCA plant and composting unit, a unit for recycling of demolition material, and an industrial waste sorter.
Figure 26: the Linde-KCA-Dresden at Wels, Austria The OFMSW is collected from an intermediate storage area and it is fed into the pulper/drum screen in a batch mode. The pulper has a volume of around 700 ft3, with a 13% TS concentration. The mashed waste stream is stored in a buffer tank where it undergoes a first hydrolysis step in a tank having a 4,600 ft3
volume. From the hydrolysis tank, the waste stream is fed into the AD reactor that is operated at thermophilic temperatures. The AD reactor is sized to have a loading rate of 0.375 lb of volatile solids/ft3/day. With a 16 day HRT, the AD reactor has an effective volume of 56,500 ft3. As the facility is only operated 5 days a week, about 66 tons/day of feedstock is added with an average 30% TS concentration. The volatile solids concentration averages 75%-82% of TS. Biogas yields range from 3,100-4,850 ft3/ton of raw waste input to the plant, with a methane content of 60%-65%. The biogas is used in a boiler that produces about 335 kW of heat. There is a biogas storage balloon having a capacity of 28,200 ft3. The thermal energy is used to heat the plant buildings and to heat the feedstock in the sanitation tanks. The digestate is dehydrated and the liquid fraction is recycled for use as process water. Excess water is discharged for processing by an on-site WWTP before it is discharged into the sewer system. The solid fraction undergoes final compost together with sewage sludge. Composting can be aerobic composting as applied in Washington State. The advantage is however that the waste volumes are significantly reduced and with less odor. 5.7.3.2. Dry Two-Stage, Two-Phase Process There is presently only one dry two-step, two-phase process being commercially used (Beck, 2004). It is a so-called “Percolation” process that was developed during the 1990’s. Its major application is for full MSW or grey waste. Recent trials, however, have proven that the process works equally well for green waste. Feedstock preconditioning is essential. This process works more quickly when compared to one-step or liquid two-step digestion processes. The hydrolysis step is operated under aerobic conditions, which reduces the organic degradation time considerably. The digestion period itself is also much shorter than in most of the other processes, because only the liquid fraction is anaerobically treated. This can be done in either a packed bed
51

digester or in an anaerobic filter where the HRT can be reduced to two days or even less. As a consequence, the biogas yield is slightly lower than in comparable CSTRs having an HRT of 20 (or more) days. Roughly, the yield from a percolation system accounts for about 70%-80% of methane produced using other methods with similar feedstocks. Buchen, Germany (ISKA), Figure 27 depicts the mechanical separation, nitrification/dentrification tank and digester of the Buchen Plant.
Figure 27: ISKA Dry Two-Stage Two-Phase system at Buchen, Germany
In Buchen, a drum sieve having a mesh size of 3.5 to 6.0 inches is used to separate the OFMSW from plastics, papers, and textiles. Before biological treatment, the metals are removed by a magnetic belt. The captured reject material is a dry, high-energy content RDF that is either landfill or incinerated. The organic rich underflow feed into the percolator. The percolator, Figure 29, is a horizontal continuously operating cylindrical reactor made of steel, Figure 28. It is equipped with a central mixer and a hydraulically-powered scraper located over a grate. It is fed with the OFMSW at one end and emptied on the other end after passing through a screw press to dewater the material.
Figure 28 The first stage of percolation at Buchen, Germany
52

Figure 29: Internal view of the percolator The feedstock is alternatively aerated and percolated, and it is intermittently stirred. The percolation water is introduced from the top and removed through screens at the bottom of the reactor. After removal of sand and a fine organic sludge (which is recycled to the percolator), the saturated percolation water is fed into the anaerobic hybrid filter from the bottom and removed from the top. The digestion HRT varies as a function of waste composition, but is usually between two and three days. The liquid is treated in a nitrification/denitrification plant followed by an ultra filtration process, and is either recycled as process water or released into the sewer. During the two day percolation period, one ton of grey waste is reduced to a mass of around 800 pounds. After leaving the percolator and being separated from the liquid fraction by a press, the recovered solids have a 60% TS content and are dryer than the original fresh material that had a 50% TS content. The solids are typically post-composted in an open windrow. The organic fraction is still high enough to raise the temperature up to 160°F during the composting process. As a result, the material is sanitized and is further stabilized. After the three week post-composting process, the solids are further dried to an 80% TS content. This solid material is easy to separate by sieving it into separate fiber, inert, metal, and plastic fractions. The sorted non-fiber material can then either be recycled, landfill or incinerated depending upon its purity. The fiber is generally used for landfill cover, or for soil remediation purposes. Depending on the input composition, the liquid fraction produces biogas at a rate of 1,400-2,650 ft3/ton MSW. With a total treatment time of five days (two days of percolation and three days of digestion), a comparable amount of biogas is produced as with a dry one-step digestion system during a 20 day HRT. 5.8. Batch Systems In batch systems, digesters are filled once with fresh wastes, with or without addition of seed material, and allowed to go through all degradation steps sequentially in the 'dry' mode, i.e. at 30-40 % TS. Though batch systems may appear as nothing more than a landfill-in-a-box, they in fact achieve 50- to 100- fold higher biogas production rates than those observed in landfills
53

because of two basic features. The first is that the leachate is continuously re-circulated, which allows the dispersion of inoculant, nutrients, and acids, and in fact is the equivalent of partial mixing. The second is that batch systems are run at higher temperatures than that normally observed in landfills. Batch systems have up to now not succeeded in taking a substantial market share. However the specific features of batch processes Table 9, such as a simple design and process control, robustness towards coarse contaminants, and lower investment cost make them attractive for developing countries (Ouedraogo, 1999). The hallmark of batch systems is the clear separation between a first phase where acidification proceeds much faster than methanogenesis and a second phase where acids are transformed into biogas. Three basic batch designs may be recognized, which differ in the respective locations of the acidification and methanogenesis phases Figure 30. In the single-stage batch design, the leachate is re-circulated to the top of the same reactor where it is produced. This is the principle of the Biocel process, which is implemented in a full-scale plant in Lelystad, The Netherlands, treating 35,000 Ton/yr source-sorted biowaste (Brummeler, 1999). The waste is loaded with a shovel in fourteen concrete reactors, each of 480 m3 effective capacity and run in parallel. The leachates, collected in chambers under the reactors, are sprayed on the top surface of the fermenting wastes. One technical shortcoming of this and other batch systems is the plugging of the perforated floor, resulting in the blockage of the leaching process. This problem is alleviated by limiting the thickness of the fermenting wastes to four meters in order to limit compaction and by mixing the fresh wastes with bulking material (one ton dewatered digested wastes and 0.1 ton wood chips added per ton fresh wastes) (Brummeler, 1992). The addition of dewatered digested wastes, aside from acting as bulking material, also serves the purpose of inoculation and dilution of the fresh wastes. Safety measures need to be closely observed during the opening and emptying of the batches, as explosive conditions can occur.
Table 9: Advantages and disadvantages of batch systems
Criteria
Advantages
Disadvantages
Technical
- Simple - 'Low-tech' - Robust (no hindrance from bulky items)
- Clogging - Need for bulking agent - Risk explosion during emptying of reactors
Biological
- Reliable process due to niches and use of several reactors
- Poor biogas yield due to channeling of percolate - Small OLR
Economical & Environmental
- Cheap, applicable to developping countries - Small water consumption
- Very large land acreage required (comparable to aerobic composting)
In the sequential batch design, the leachate of a freshly-filled reactor, containing high levels of organic acids, is recirculated to another more mature reactor where methanogenesis takes place.
54

The leachate of the latter reactor, freed of acids and loaded with pH buffering bicarbonates, is pumped back to the new reactor. This configuration also ensures cross-inoculation between new and mature reactors which eliminates the need to mix the fresh wastes with seed material. The technical features of the sequential batch design are similar to those of the single-stage design. Finally, in the hybrid batch-UASB design, the mature reactor where the bulk of the methanogenesis takes place is replaced by an upflow anaerobic sludge blanket (UASB) reactor. The UASB reactor, wherein anaerobic microflora accumulates as granules, is well suited to treat liquid effluents with high levels of organic acids at high loading rates (Anderson and Saw, 1992; Chen, 1999). This design is in fact very similar to the two-stage systems with biomass retention such as the Bio-percolat system discussed above, with the difference that the first stage is a simple fill-and-draw (batch) instead of fully mixed design.
Figure 30: Configuration of leachate recycle patterns in different batch systems
5.8.1. Biological Performance The Biocel plant in Lelystad achieves an average yield of 70 kg biogas/Ton source-sorted biowaste. This is 40 % smaller biogas yield than that obtained in continuously-fed one-stage systems treating the same type of waste (De Baere, 1999). This low yield is the result of leachate channeling, i.e. the lack of uniform spreading of the leachate which invariably tends to flow along preferential paths. The OLR of the Biocel process is however not exceedingly less than continuously-fed systems, as might have been expected from the simple design. The design OLR of the Lelystad plant was 3.6 kg VS/m3.d ~0.22 Ib VS/ft3.d at 37 °C and peak values of 5.1 kg VS/m3.d ~0.32 Ib VS/ft3.d during summer months seem sustainable (Brummeler, 1999). In the sequential batch design, the conversion of the acids in a separate mature reactor ensures the rapid depletion of the produced acids, thus a more reliable process performance and less variable biogas composition (O'Keefe et al., 1992; Silvey et al. 1999). At OLR of 3.2 kg VS/m3.d~0.2 Ib VS/ft3.d, biogas yields equivalent to 80-90 % of the maximal yield could be obtained in pilot reactors at 55 °C (O'Keefe et al., 1992; Silvey et al., 1999), which is considerably more than the yield reported in the Biocel plant. While the Biocel data were obtained from a full-scale plant treating compacted poorly-structured source-sorted biowaste at 40 % TS, the impressive biogas yields reported for the sequential batch design were obtained in pilot plants treating either unsorted MSW or mechanically-sorted OFMSW at 60 % TS with high levels of paper and cardboard and low bulk density (280 kg/m3 ~17.5 Ib /ft3.d). The coarser structure and lesser degree of compaction of these wastes render these less conducive to the channeling and plugging phenomena responsible for poor biogas yields.
55

5.8.2. Impacts Because batch systems are technically simple, the investment costs are significantly (40 %) less than those of continuously-fed systems (Brummeler, 1992). The land area required by batch processes is however considerably larger than that for continuously-fed 'dry' systems, since the height of batch reactors is about five-fold less and their OLR two-fold less, resulting in a ten-fold larger required footprint per Ton treated wastes. Operational costs, on the other hand, seem comparable to those of other systems (Brummeler, 1992). 6. Economics of the High-Solids Anaerobic Digestion (HSAD) Beck (2004) derived full scale applications of the high solids digestion from major suppliers and reported applications capacity and cost. A total of 45 different system providers were identified. Eeach provider constructed between one and 15 plants capable of digesting the OFMSW, most of them were illustrated in the previous section. As shown in Table 10, Kompogas has built the largest number of plants (15) followed by Krüger (14) and BTA (13). The largest volumes of waste are digested in Krüger plants (950 thousand tons/year) followed by Valorga (835 thousand tons/year) and Farmatic (405 thousand tons/year). Ten companies presently have a 62% market share by number and a 63% market share by volume.
Table 10: Major 10 High Solids Plants Providers (Beck, 2004)
It is interesting to note that the number of system providers who are still developing high solids digestion plants during the past two years has been dramatically decreased. With the increasing volumes of the plants and the tendency for waste management agencies to specify design, build, own and operate (DBOO) facilities, there is a clear market concentration toward larger companies. As a result, some of the smaller providers have sold their high solids digestion business units and some of the specialized firms have been bought by larger companies. So, Beck (2004) conducted the survey by sending a questionnaire to several existing plants that were mainly in Europe. The plants and suppliers who responded were apparently those who are active in the business. The surveyed plants are listed in Table 11. It is interesting to note that from the six different providers that participated in the survey, only two (BTA and ISKA) have wet digestion systems. Linde, who also provides liquid systems thorough its Linde-Dresden-KCA subsidiary, only responded regarding its HSAD system. This is not viewed as a major deficit since the project team has sufficient background experience to describe the various wet systems. All systems represented, except for one, process source
56

separated organic wastes. Only one facility that processes grey waste responded. Grey waste is a specific description of an MSW waste stream from which at least a part of the organic fraction has already been removed. Usually the so-called OFMSW (mainly kitchen waste) and yard waste (branches, leaves, etc.) have already been source separated. The grey waste (less degradable remaining fraction) typically contains 30% to 50% organic material. However, the easy digestible fraction has been removed. As a result, the biogas potential is far lower for grey waste. 6.1. Performance of HSAD Applications As shown in Table 12, an analysis of production data confirms that grey waste has the lowest biogas potential. The biogas production depends to large extent on the organic fraction of the feed stock. Based on the survey results conducted by Beck (2004), from the production data, the range of biogas production potential for a given feedstock from highest to lowest:
• Predominantly kitchen and food waste; • Predominantly yard waste; and • Predominantly other feedstocks.
57

Table 11: Plants included in the economic survey
Table 12: HSAD Plants performance Location Waste Type Waste Ft3 Ft3 Gas Ft3 Ft3 Gas/Ft3 Lbs./Ft3 Tons/Year Digester Production Biogas/Ton Digester/Day Digester/
Day Aarburg Yard 12,128 52,973 28,605,150 2,359 1.48 1.25 Baar Yard 4,410 16,951 13,419,700 3,043 2.17 1.43 Bachenbülach Yard & Food 9,482 18,364 30,017,750 3,166 4.48 2.83 Baden-Baden Food &
Kitchen 7,166 211,890 51,206,750 7,146 0.66 0.19
Braunschweig Kitchen 17,640 59,329 60,035,500 3,403 2.77 1.63 Buchen MSW 110,250 141,260 141,260,000 1,281 2.74 4.28 Geneva Yard 13,230 35,315 42,378,000 3,203 3.29 2.05 Grindsted Biosolids 38,036 98,882 22,954,750 603 0.64 2.11 Holsworthy Food 160,965 282,520 137,728,500 856 1.34 3.12 Karlsruhe Manure &
Food 8,820 47,675 30,935,940 3,507 1.78 1.01
Lemgo Yard & 37,485 90,053 134,197,000 3,580 4.08 2.28
58

Kitchen München Yard &
Kitchen 27,563 84,050 52,972,500 1,922 1.73 1.80
Niederuzwil Yard & Kitchen
11,025 31,784 30,724,050 2,787 2.65 1.90
Otelfingen Yard 13,781 29,665 38,846,500 2,819 3.59 2.55 Rümlang Yard 7,718 16,245 28,252,000 3,661 4.76 2.60 Samstagern Yard & Food 8,489 18,364 28,958,300 3,411 4.32 2.53 Average 30,512
77,207
54,530,774
2,922
2.65 2.10
As reflected in the data presented in Table 12, the average surveyed system treats a waste volume of slightly more than 30,500 tons/year, and has a reactor volume of around 77,000 ft3. With an average yield of almost 2,900 ft3/ton of biogas, the average HSAD system produces slightly more than 6,200 ft3/hour of biogas. There are two extremes in the presented data. For example, the Buchen plant shows an extremely low biogas/ton yield (1,281 ft3/ton), while having a very high process efficiency in terms of biogas/ft3
of digester volume (4.28 ft3/ft3 of digester).
On the other hand, the Baden-Baden plant demonstrates an extremely high biogas/ton yield (7,146ft3/ton) while having very low process efficiency (0.19 ft3/ft3
of digester). This may be a result of the fact that the food and kitchen waste used as its principal feedstock are being co-digested with sewage sludge. 6.2. Cost of Full Scale Plant Applications In the study of Beck (2004) assessing investment cost, it was found three specific factors that have an influence:
• Year of construction; • Size of installation; and • Type of system.
Table 13: Investment of HSAD plants (Beck, 2004)
The oldest plant listed in Table 13 is the Linde-BRV digester in Baar, which was developed in 1993. It was the first plant of this type built and was considered a demonstration unit. Including
59

the cost of an 8,800 ton/year composting operation, this facility has also been upgraded multiple times. Of course, these addons and modifications increase the investment cost dramatically up to installed cost price of $3,175/ton of installed capacity. Even if one were to take into account all of the waste treated each year, this still yields an installed cost of $1,067/ton of installed capacity. Linde-BRV continues to build AD plants today and have reported installed costs of $460/ton (Lemgo). This corresponds to a cost reduction factor of roughly 2.5 accounting for the economies of scale. As with Linde-BRV, the other system providers were able to accrue considerable cost reductions over the past decade by incorporating continuous process improvements to their systems. This trend is also reflected in Kompogas' facility development experience. Their first operation was installed in 1992 at a cost of approximately $8.4 million with an annual processing capacity of 11,000 tons and an installed cost of $764/ton. Using more refined engineering practices, the plant in Niederuzwil was built for an installed cost of $388/ton. On an installed cost/ton, this experience reflects a reduction in capital expense of nearly 50%. Many other system developers report similar trends. For example, from earlier analysis, it was found that the first Valorga operation installed in 1992 also had a cost of $8.4 million with an annual processing capacity of 11,000 tons, or $764/ton. One of Valorga’s 1996 facilities has a reported capital expense of $5.6 million with an annual capacity of 22,000 tons, corresponding to an installed cost of $254/ton. Once again, it should also be noted that the installed costs reflect a “turn-key” facility built in Europe, where investments in some components such as plant machinery, land, and infrastructure are significantly higher when compared to the U.S. 7. Model Based Comparisons Zaher and Chen (2006) developed an interface to the International Water Association Anaerobic Digestion Model number 1 (ADM1) to estimate the solid waste composition from its practical characteristics. The interface was based on COD, elemental, charge and covalent bond balances to conceal any error in collected characteristics from different sources. The interface was validated by reported characteristics of manure and food wastes and determined with relevant accuracy the wastes’ composition of carbohydrates, proteins and lipids. The benefit from the interface application with ADM1 is illustrated through virtual case studies of co-digestion and comparison of existing high solids digester designs for given solid waste characteristics. Thus the developed interface serves as a tool for early and efficient decision on technology selection of high solids digestion. 7.1. The IWA ADM1 Model Description The International Water Association (IWA) Anaerobic Digestion Model no.1 (ADM1) is implemented in Worldwide Engine for Simulation and Training WEST and used throughout this research as a reference model.
60

10%
30% Inerts 10%
30% 30%
30% Proteins 30% Fats 30%
1% 29%
MS 31% AA 30% LCFA 29%
13% 16% 2%
29% 12% 20% 9%20%
12% 6%
9%
Acetic 64% H2 26%
90%
Carbohydrates
HPr, HBu, HVa
CH4
Composite Particulate Material (100%)
Disintegration
Hydrolysis
Acidogenesis
Acetogenesis
Methanogenesis
Figure 31 COD flux for a particulate composite comprised of 10% inerts, and 30% each proteins, carbohydrates and fats (in terms of COD). Propionic acid (10%), butyric acid (12%) and valeric acid (7%)
are grouped in the diagram for simplicity (Batstone et. al, 2002). As shown in Figure 31 the IWA ADM1 model (Batstone et. al, 2002) considers the conversion processes in the digester from the most complex (substrate) to the simplest components. In other words, it starts from the disintegration of composite particulate and progresses in steps through biogas formation. However, in some industrial applications, the supplied wastewater is simpler. The process for the supplied wastewater mainly takes the path of carbohydrates. However, implementation of the extended ADM1 to such applications is important for two reasons. First, it is possible to still find considerable fractions of composite particulate in these wastewaters that originates from plant sources (e.g. grapes used in wineries, barley used in breweries and distilleries). These materials remain useful though. For a cost effective manufacturing process, they can be separated and used for animal feed. Second, the decay of biomass produced in the digestion processes is modeled; the decaying species are lumped and added to the composite particulates. Therefore, it is advantageous that all digestion paths described in Figure 31 are included even to describe the digestion of relatively simple wastewaters. Moreover, if the feed substrates are complex and consisting of particulates they should be characterized separately since their carbohydrates, proteins and lipids fractions will be different than the decaying biomass. The biogas is a valuable product and an important control parameter of the anaerobic process. The anaerobic reactor is a closed system. Therefore, it is essential to also consider the gas - liquid transfer and evaluate the flow of gas components. In the IWA ADM1, the gas transfer between two compartments (i.e gas phase and liquid phase), shown in Figure 32, is modeled by
61

considering three gas components of the biogas: methane, carbon dioxide and hydrogen. Their concentrations are evaluated in both phases. Also, the anaerobic process is sensitive to pH changes. There are buffering systems such as Volatile Fatty Acids?? (VFAs) (acetate, propionate, butyrate and valerate), bicarbonate and ammonia affecting the pH. Those buffers were considered in the ADM1 by their corresponding dissociation reactions that can be modeled by either differential equations (DE implementation) or by algebraic equations of equilibrium (DAE implementation). From either DE or DAE implementation, the hydrogen ion concentration and the pH are calculated. Ion concentrations are used to estimate inhibition factors that are also considered in the model. All these reaction rates add more state variables that are in most cases not measured online and require a lot of effort for off-line analysis. It also implies a burden on the numerical solver. The solver should be able to handle this large number of equations with different time constants: slow (biological), intermediate (physical) and fast (chemical). Therefore, ADM1 should be seen as a detailed reference model that helps the understanding of the process/process changes, validating simple models, generating balanced sets of data and optimal experimental design. Of course, ADM1 is not a model to be used in on-line control, but it could be used to evaluate control systems and strategies. For application to high solids digestion an interface to the solid waste practical characteristics is required.
qin
Sin,1
Sin,2.
.
Xin,24
qgas
Sgas,1, pgas,1
Sgas,2, pgas,2
Sgas,3, pgas,3
qout
Sliq,1
Sliq,2.
.
Xliq,24
ρgas,T
Biochemical and Physico-chemical
Conversion processes
Vliq
Vgas
Liquid Phase
Gas Phase
Sliq,1
Sliq,2.
.
Xliq,24
Figure 32: Schematic diagram of a typical single-tank digester (Batstone et al, 2002) 7.2. Importance of the Interface Development Substrate composition information is important for simulating and optimizing anaerobic digestion processes and reactors. Substrate composition determines the process pathways and influences the biofilm development in high rate anaerobic reactors such as Fluidized Beds (FB) and Upflow Anaerobic Sludge Bed reactors (UASB) (Garcia-Encina and Hidalgo, 2005). These configurations are similar to planned configuration of the seed tank in the new design. The substrate composition is even more important and considered as the bottle neck for high solids digestion due to the importance of the hydrolysis step (Hartmann and Ahring, 2006; Johansen and Bakke, 2006). Also, hydrolysis rates differs significantly (Mata-Alvarez, 2000) for particulate components, e.g. carbohydrates, proteins and lipids.
62

According to the ADM1 technical report (Batstone et al., 2002), disintegration is mainly included to describe degradation of composite particulate material with lumped characteristics (such as primary or waste-activated sludge), while the hydrolysis steps are to describe well defined, relatively pure substrates (such as cellulose, starch, lipids and protein feeds). Considering the fact that it is neither possible to fix the waste to one lumped characteristic nor practical to characterize it as pure substrates, this paper presents an interface that is developed to dynamically calculate the ADM1 input from practical measurements maintaining the balance of COD, all elements, charge and carbon covalent bonds. Thus the complete structure of ADM1 can be used in a dynamic manner while considering the three main pathways that start from the hydrolysis of carbohydrates, proteins and lipids. Two clear objectives were completed and described in this paper. First, reported practical analyses of manure and solid wastes were used to accurately estimate substrate composition for anaerobic digestion. This objective was achieved by building the interface for ADM1 using practical solid waste characteristics. The developed interface both upgraded and combined the advantages of previously developed model interfacing/transformation methods. The interface was validated with practical measurements recorded for different types of manure and food wastes. Second, high solids digestion applications were efficiently planned by using the interface and ADM1. This accomplishment is illustrated in this paper by virtual case studies which optimize degradation and biogas production by co-digestion and evaluate different anaerobic digestion plant designs for technology selection. 7.3. Implemented Interfacing Methods CBIM method. Vanrolleghem et al. (2005) proposed a general Continuity-Based Interfacing Method (CBIM) for models of wastewater systems described by Petersen matrices. CBIM was applied as the basis for the interface since it maintains the continuity of major elements composing model components and achieves the balance of COD and charge throughout all the conversions. The method uses the Petersen presentation of the transformation matrix between both models to be interfaced. The transformation matrix of the interface developed in this paper is shown schematically in Table 14.
Table 14: Schematic presentation of the interface transformation matrix updated from Vanrolleghem et al. (2005)
63
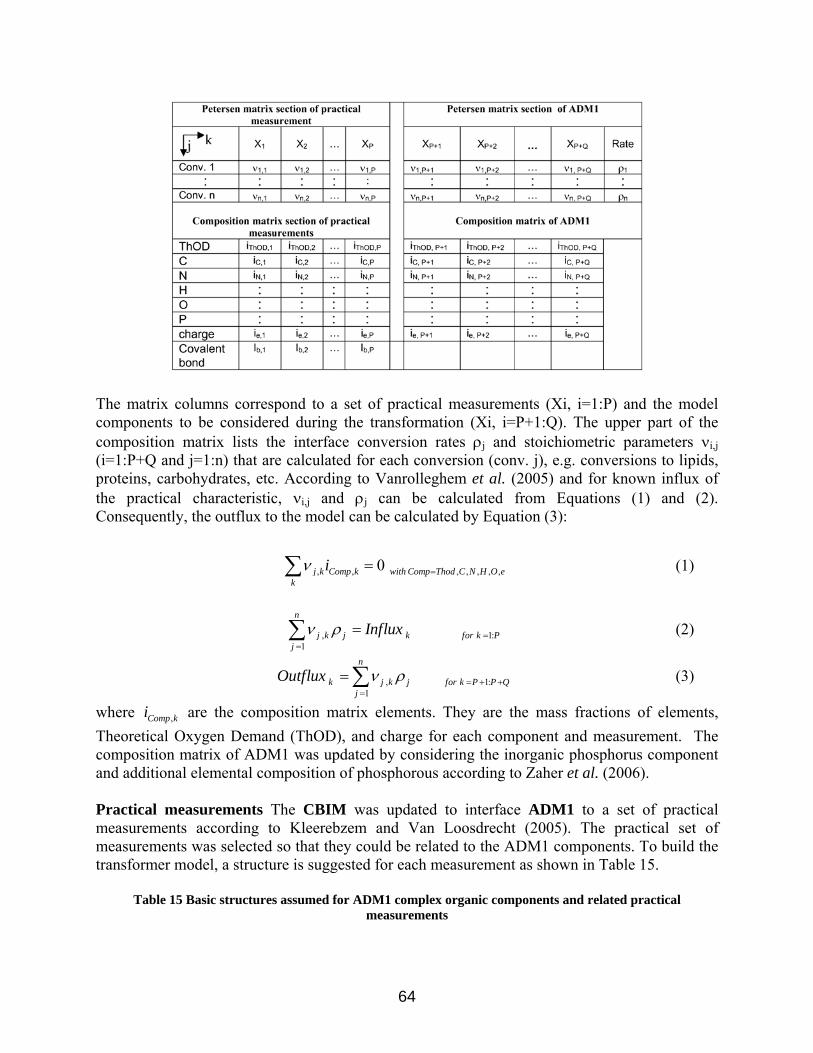
The matrix columns correspond to a set of practical measurements (Xi, i=1:P) and the model components to be considered during the transformation (Xi, i=P+1:Q). The upper part of the composition matrix lists the interface conversion rates ρj and stoichiometric parameters νi,j (i=1:P+Q and j=1:n) that are calculated for each conversion (conv. j), e.g. conversions to lipids, proteins, carbohydrates, etc. According to Vanrolleghem et al. (2005) and for known influx of the practical characteristic, νi,j and ρj can be calculated from Equations (1) and (2). Consequently, the outflux to the model can be calculated by Equation (3):
, , , , , ,0 ,j k Comp k with Comp Thod C N H O ek
iν ==∑ (1)
,1
n
1:j k j k for k Pj
Influxν ρ ==
=∑ (2)
,1
n
k j k j for k P Pj
Outflux ν ρ 1: Q= + +=
=∑ (3)
where are the composition matrix elements. They are the mass fractions of elements, Theoretical Oxygen Demand (ThOD), and charge for each component and measurement. The composition matrix of ADM1 was updated by considering the inorganic phosphorus component and additional elemental composition of phosphorous according to Zaher et al. (2006).
,Comp ki
Practical measurements The CBIM was updated to interface ADM1 to a set of practical measurements according to Kleerebzem and Van Loosdrecht (2005). The practical set of measurements was selected so that they could be related to the ADM1 components. To build the transformer model, a structure is suggested for each measurement as shown in Table 15.
Table 15 Basic structures assumed for ADM1 complex organic components and related practical measurements
64
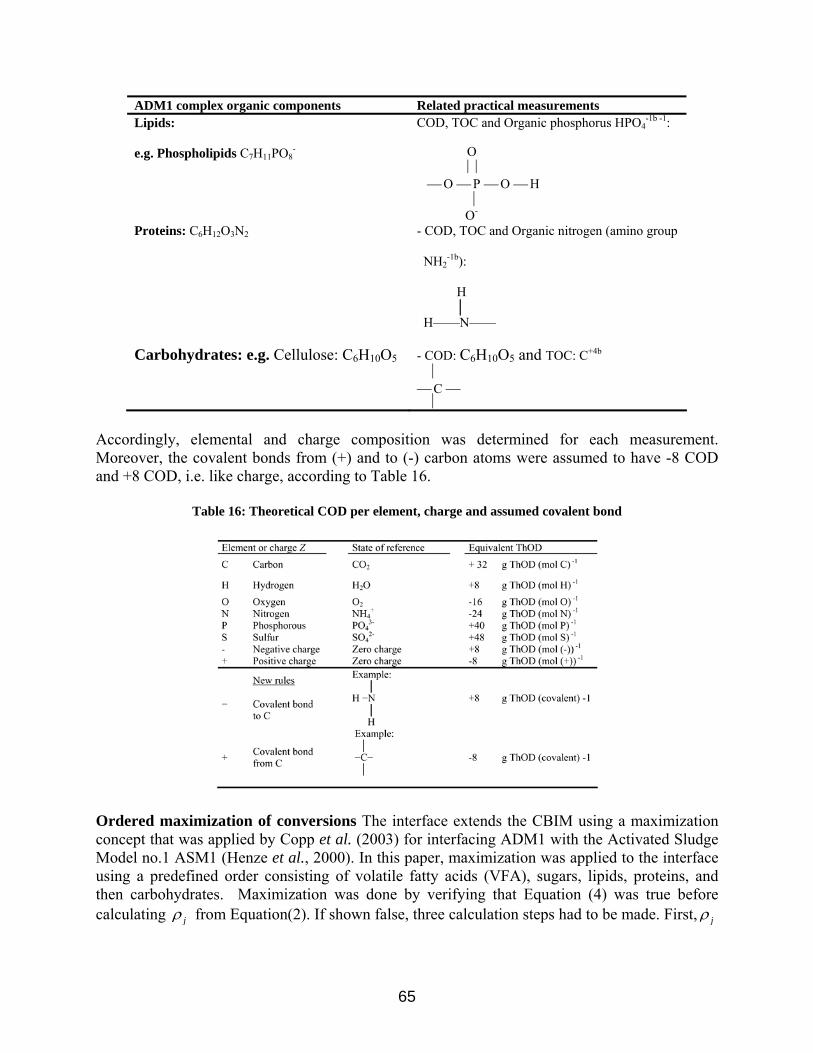
ADM1 complex organic components Related practical measurements Lipids:
e.g. Phospholipids C7H11PO8-
COD, TOC and Organic phosphorus HPO4-1b -1:
O ⎜⎟ ⎯ O ⎯ P ⎯ O ⎯ H ⏐ O -
Proteins: C6H12O3N2
- COD, TOC and Organic nitrogen (amino group
NH2-1b):
H │ H——N——
Carbohydrates: e.g. Cellulose: C6H10O5
- COD: C6H10O5 and TOC: C+4b
⏐ ⎯ C ⎯ ⏐
Accordingly, elemental and charge composition was determined for each measurement. Moreover, the covalent bonds from (+) and to (-) carbon atoms were assumed to have -8 COD and +8 COD, i.e. like charge, according to Table 16.
Table 16: Theoretical COD per element, charge and assumed covalent bond
Ordered maximization of conversions The interface extends the CBIM using a maximization concept that was applied by Copp et al. (2003) for interfacing ADM1 with the Activated Sludge Model no.1 ASM1 (Henze et al., 2000). In this paper, maximization was applied to the interface using a predefined order consisting of volatile fatty acids (VFA), sugars, lipids, proteins, and then carbohydrates. Maximization was done by verifying that Equation (4) was true before calculating jρ from Equation(2). If shown false, three calculation steps had to be made. First, jρ
65

was calculated according to Equation(5). Second, the remaining fluxes were added to the inorganic components. Third, other rates ( , 1i i j n:ρ = + ) were assigned a value of 0.
, 11
j
:j k j k for k PInfluxν ρ =<∑ (4)
1
,1
1:,
min
j
k i k ii
j for k Pj k
Influx ν ρρ
ν
−
==
⎛ ⎞−⎜ ⎟
⎜ ⎟=⎜ ⎟⎜ ⎟⎝ ⎠
∑ (5)
7.4. Building the Model Transformation Matrix The calculated transformation and composition matrices are listed in Table 21 (landscape page). The practical measurements could be presented as individual Petersen matrix components because of the suggested covalent bond representation and practical measurement composition. Model inorganic components were sourcing the C, N and P through all conversions. However, stoichiometric parameters were calculated through all conversions with a minimum yield of model inorganic components. Also, OH- and H+ ions were sourcing the O and H elements, respectively. Both ions comprise the water molecule that is frequently needed to extend the practical measurements to the complete structure of organic components. The charge balance was sourced by anions. Estimating the anions and cations in the influent was needed for the model pH calculations. Table 17 shows zero or small errors achieved in the continuity check of COD, all elements, and charge. In addition, the balance of the covalent bonds over all of the conversions to organic components helped in estimating the inert composition and attaining a balance of zero Table 18.
Table 17: Significantly small errors achieved with the continuity of COD, elemental mass and charge
J Conversion to COD C N O H P
char
ge
1 0.0E+00 0.0E+00 0.0E+00 0.0E+00 0.0E+00 0.0E+00 -4.2E-17
2 0.0E+00 0.0E+00 0.0E+00 0.0E+00 0.0E+00 0.0E+00 0.0E+00
3 0.0E+00 0.0E+00 0.0E+00 0.0E+00 0.0E+00 1.1E-16 0.0E+00
4 0.0E+00 0.0E+00 0.0E+00 0.0E+00 0.0E+00 0.0E+00 0.0E+00
5 0.0E+00 0.0E+00 0.0E+00 0.0E+00 0.0E+00 0.0E+00 0.0E+00
6 0.0E+00 0.0E+00 0.0E+00 0.0E+00 0.0E+00 0.0E+00 0.0E+00
7 0.0E+00 0.0E+00 0.0E+00 0.0E+00 0.0E+00 0.0E+00 0.0E+00
8 proteins 0.0E+00 0.0E+00 0.0E+00 0.0E+00 0.0E+00 0.0E+00 0.0E+00
9 carbohydrates 0.0E+00 0.0E+00 0.0E+00 0.0E+00 0.0E+00 0.0E+00 0.0E+00
10 organic inerts 0.0E+00 0.0E+00 0.0E+00 0.0E+00 0.0E+00 0.0E+00 0.0E+00
ammonia
bicarbonate
ortho phosphate
cations
Sugars
lipids
VFA
The selected practical measurements resolved the correlation between the organic components and enabled accurate conversion. Maximization of the conversions in a predefined order checks the consistency of the measurements and avoids negative influxes to the model that could arise due to measurement errors.
66

Table 18: Balance of covalent bond overall conversion
Covalent bonds balance Error
conversion to VFA -4.0E-07
conversion to sugar 4.3E-15
conversion to lipids -6.5E-02
conversion to proteins 7.1E-02
conversion to carbohydrates -4.3E-15conversion to inerts -6.8E-03
Overal balance 0.00 7.5. Validation of Substrate Conversion To validate the interface estimates of solid waste composition, practical characteristics were collected for several types of manure and food wastes. Accordingly, the interface was used to calculate the different wastes composition (carbohydrates, proteins and lipids). The interface results were comparable with the measured composition reported for the same waste types. Compositions were reported in literature as unit of mass per unit of mass or volume of substrate. This is generally to conform to the definition of the proximate analysis that is designed for food types. COD units were used to conform to the composition suggested in the interface and the model units. In addition to the benefit of achieving the COD and elemental balance to conceal any errors in the practical characteristics, the use of COD units avoided inconsistency in mass balance due to water content in complex substrate molecules or moisture content. For instance, Kayhanian et al. (1996) illustrated the importance of including a mass correction parameter when modeling high solids digestion using mass units due to the considerable mass reduction and water evaporation. Table 19 lists the practical characteristics of 5 manure types for which carbohydrate and protein compositions could be found in literature (Chen et al., 2003). The practical characteristics are collected from different sources (Neitsch et al., 2001; ASAE, 1998; USDA, 1996) as indicated. In addition to available on-line libraries that list practical characteristics of manure and solid wastes, in general, practical measurements for almost all types of manure were available from the USDA (USDA, 1996). However, only the listed five types are considered here for validation.
Table 19: Manure wastes’ characteristics
Waste CODp** TOC** Norg** TAN* TP-orthoP** OrthoP* Carbo-hydrates***proteins***
(gCOD
.m-3) (gC.m-3) (gN.m-3) (gN.m-3) (gP.m-3) (gP.m-3) (kgCOD .m-3)
(kgCOD .m-3)
Cattle manure (Dairy) **** 109665 75000 4077 716 261 483 97 31
Cattle manure (Beef) 96111 528601 3949 1337 1295 627 77 18
Swine manure (Grower) 97072 47094 2976 3752 854 1709 48 27
Swine manure (Nursing) 92342 45229 2500 3153 785 1570 46 30
Poultry manure 267706 122442 10203 3401 4239 1028 131 94 * Except dairy manure, data are collected from (Neitsch et al., 2001; ASAE, 1998)
67

** Except dairy manure, data are collected from (USDA, 1996) *** From analysis reported in (Chen et al., 2003) **** Checked and found consistent with standard lab analysis Buffiere et al. (2006) reported a detailed analysis of practical characteristics and composition of several food wastes and Table 20 lists the characteristics adapted from this analysis. Total phosphorus (TP) was added (USDA, 1996) to enable the estimation of lipids by the interface assuming phospholipid composition. TKN of carrots was not determined and thus the value was added using data from the USDA (USDA, 1996). The lipids content of banana was corrected according to USDA data as well (USDA, 2005). Carbohydrates did not include sugars since only the particulate forms were considered.
Table 20 : Food wastes characteristics and measured lipids, proteins and carbohydrates portions updated from (Buffiere et al., 2006)
analysis Unit Salad Carrots Grass Potato Banana Apple Orange TKN (gN/gfresh) 0.002 0.003** 0.007 0.004 0.004 0.006 0.009 COD (gO2/gfresh) 0.127 0.170 0.382 0.228 0.166 0.228 0.294 Proteins (g/gfresh) 0.017 0.025 0.040 0.016 0.011 0.021 0.037 Lipids (g/gfresh) 0.007 0.006 0.018 0.006 0.005* 0.004 0.008 Sugars (g/gfresh) 0.023 0.057 0.070 0.108 0.049 0.086 0.102 Cellulose extract (g/gfresh) 0.054 0.094 0.108 0.115 0.067 0.142 0.182 Hemicelluloses (g/gfresh) 0.014 0.010 0.097 0.053 0.015 0.005 0.010 Cellulose (g/gfresh) 0.011 0.009 0.041 0.007 0.008 0.008 0.017 Lignocelluloses (g/gfresh) 0.008 0.007 0.022 0.003 0.019 0.013 0.009 Carbohydrates (g/gfresh) 0.087 0.121 0.267 0.178 0.109 0.167 0.218 TP** (g/gfresh) -- 0.00073 0.00213 0.00072 0.00033 0.00059 0.00102
* corrected from USDA National Nutrient Database ** data are collected from (USDA, 1996)
68

Tab
le 2
1: C
alcu
late
d tr
ansf
orm
atio
n m
atri
x of
the
AD
M1
inte
rfac
e to
pra
ctic
al m
easu
rem
ents
of
69
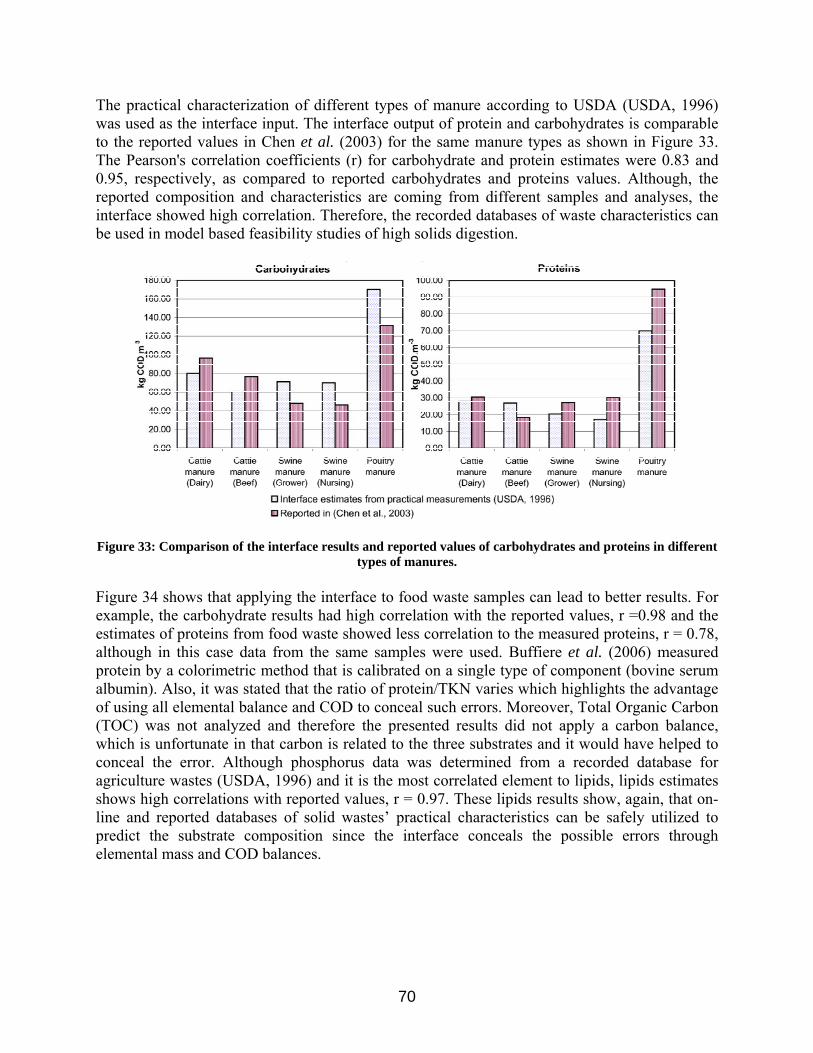
The practical characterization of different types of manure according to USDA (USDA, 1996) was used as the interface input. The interface output of protein and carbohydrates is comparable to the reported values in Chen et al. (2003) for the same manure types as shown in Figure 33. The Pearson's correlation coefficients (r) for carbohydrate and protein estimates were 0.83 and 0.95, respectively, as compared to reported carbohydrates and proteins values. Although, the reported composition and characteristics are coming from different samples and analyses, the interface showed high correlation. Therefore, the recorded databases of waste characteristics can be used in model based feasibility studies of high solids digestion.
Figure 33: Comparison of the interface results and reported values of carbohydrates and proteins in different types of manures.
Figure 34 shows that applying the interface to food waste samples can lead to better results. For example, the carbohydrate results had high correlation with the reported values, r =0.98 and the estimates of proteins from food waste showed less correlation to the measured proteins, r = 0.78, although in this case data from the same samples were used. Buffiere et al. (2006) measured protein by a colorimetric method that is calibrated on a single type of component (bovine serum albumin). Also, it was stated that the ratio of protein/TKN varies which highlights the advantage of using all elemental balance and COD to conceal such errors. Moreover, Total Organic Carbon (TOC) was not analyzed and therefore the presented results did not apply a carbon balance, which is unfortunate in that carbon is related to the three substrates and it would have helped to conceal the error. Although phosphorus data was determined from a recorded database for agriculture wastes (USDA, 1996) and it is the most correlated element to lipids, lipids estimates shows high correlations with reported values, r = 0.97. These lipids results show, again, that on-line and reported databases of solid wastes’ practical characteristics can be safely utilized to predict the substrate composition since the interface conceals the possible errors through elemental mass and COD balances.
70
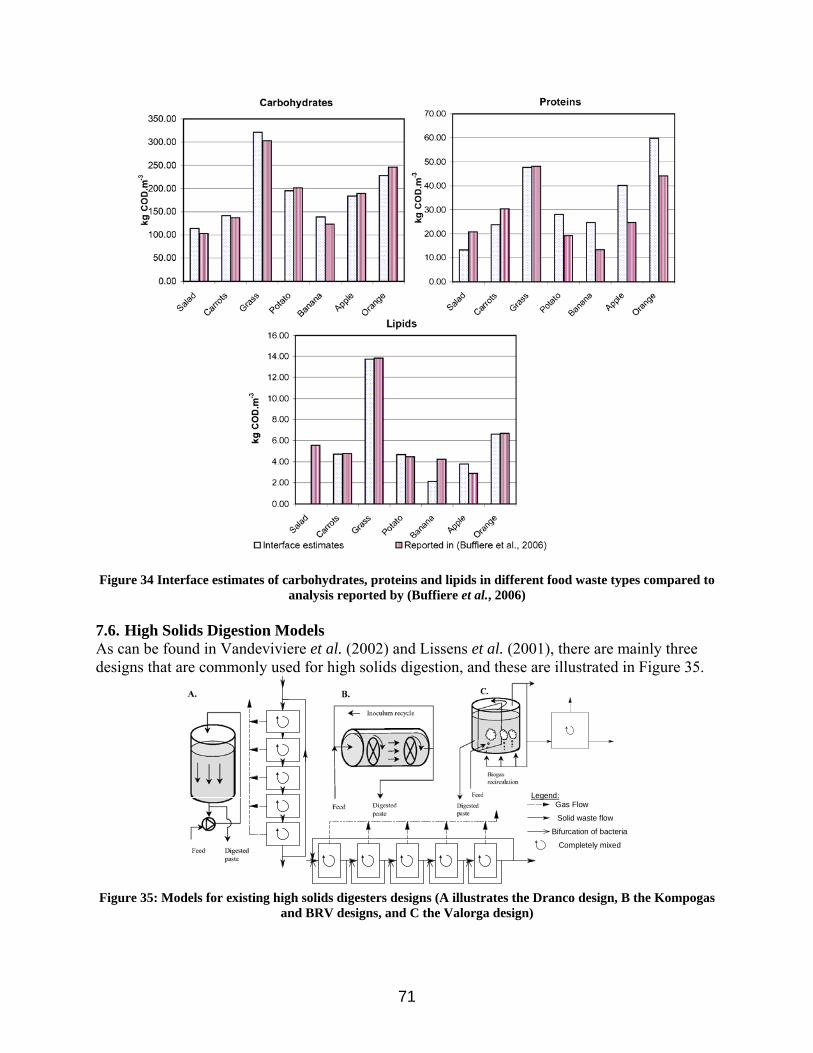
Figure 34 Interface estimates of carbohydrates, proteins and lipids in different food waste types compared to analysis reported by (Buffiere et al., 2006)
7.6. High Solids Digestion Models As can be found in Vandeviviere et al. (2002) and Lissens et al. (2001), there are mainly three designs that are commonly used for high solids digestion, and these are illustrated in Figure 35.
Solid waste flow
Legend:
Bifurcation of bacteria
Completely mixed
Gas Flow
Figure 35: Models for existing high solids digesters designs (A illustrates the Dranco design, B the Kompogas
and BRV designs, and C the Valorga design)
71

Models will be built for each design using both the interface and ADM1. Aquasim® software (Reichert, 1998) was used as the simulation platform. The interface was used to generate the ADM1 input and, therefore, enabled the technology selected to treat a particular solid waste of known characteristics. In Design A (Dranco process) the mixing occurs via recirculation of the wastes extracted at the bottom end, mixing with fresh wastes (one part of fresh waste for five to six parts of digested waste), and pumping to the top of a plug flow reactor. As shown schematically, the plug flow reactor is modeled as 5 reactors in series with a recycling of the effluent from the last reactor to the inlet of the first one. Design B (Kompogas and BRV designs) was modeled similarly but with some update. The update considered additional bifurcation and recycling of a part of the bacterial population as indicated in the scheme of Design B. The bacteria recycle was assumed in this example to be 50% of the bacterial population in each compartment to account for the re-suspension that occurred from the internal mixing in the reactor. Although Design C (Valorga design) applies a baffle in the reactor to act as a plug flow it is modeled as a single CSTR compartment. Later in the discussion section it will be shown that this assumption was valid. The three designs were applied to dairy manure characteristics as listed in Table 19 in addition to more analysis of the liquid part. The liquid content parameters were CODs = 5000 gCOD.m-3, VFA = 4146 g.m-3, ammonia nitrogen 715 gN.m-3, bicarbonate alkalinity = 515 mol.m-3 and total alkalinity (cation) concentration of = 300 equ.m-3. 7.7. Virtual Case Studies This section is devoted to simulation case studies to illustrate the practical impact of developing the interface. For illustration, two solids wastes were considered. Dairy manure and potato food wastes were considered with their characteristics listed in Table 19 and Table 20, respectively. Reactor configurations were considered according to the three applied high solids digestion as illustrated in Figure 35. All virtual experiments (simulations) were done using a liquid reactor volume of 1000 m3. Two case studies were considered. The first case study illustrated the benefit that can be achieved by co-digestion of two different wastes while the second case study compared the different high solids digester designs and highlights the effect of mixing and maintaining the bacterial population in the reactors. The HRT and COD load were varied as shown in Figure 36. All steps in the simulation case studies were considered as consecutive steady state in order to avoid influence of transition dynamics for clearer comparisons. An update was applied to the ADM1 model to produce an inert fraction from the carbohydrates hydrolysis. This fraction was set to 0.02 according to the ratio of lignocelluloses to total carbohydrates. All model fraction parameters were updated according to the general substrate elemental composition that is suggested in the interface. ADM1 hydrolysis parameters were updated according to Mata-Alvarez et al. (2000) and Christ et al. (1999). Values of hydrolysis parameters for lipids, proteins and carbohydrates were 0.005, 0.015 and 0.025, respectively.
72

Figure 36: HRT and COD load for co-digestion and technology selection case studies
7.7.1. Co-digestion Case Study In this case study a CSTR configuration was assumed, i.e. as assumed for reactor Design C (Valorga). Both dairy manure and (potato) food waste have high COD concentration and, therefore, OLR is the limiting factor for design. Several HRT were simulated from 100-18 days. Figure 37 shows the main simulation results of digesting dairy manure as compared to co-digestion with food waste (Potato) at the designed HRT and starting from the same initial conditions. Generally, a larger HRT is needed to achieve better COD removal efficiency while a lower HRT and higher OLR achieves a higher gas production rate but lower methane content. The process is more optimal when it is operated at different OLR and HRT than if only the biogas production rate was regarded (Hartmann and Ahring, 2006).
80% dairy manure + 20% Potato dairy manure only Figure 37 comparison of digestion of dairy manure and co-digestion with food waste
73

Co-digestion of manure with potato waste (with 4:1 ratio) significantly improved the process performance although the OLR was increased. The potato waste had higher COD than dairy manure, but it is mainly carbohydrate that is easily hydrolyzed and sugar that is easily degradable. The improvement due to co-digestion is even larger with an increase of the OLR in terms of COD removal, gas production and methane content. The C:N ratio of the potato waste was much larger and, therefore, less ammonia inhibition occurred compared to digesting dairy manure alone. The ADM1 ammonia inhibition factor was larger with co-digestion which implies less toxicity. Digesting potato waste alone or at higher % for methane production was not possible though. The alkalinity in dairy manure was necessary to maintain the pH in the optimum range around 7 across the entire simulation time (results are not shown). However, with the addition of alkalinity it was possible to produce higher hydrogen from the potato waste alone. 7.7.2. Technology Selection Case Study The three reactor designs for high solids digestion were modeled as schematically illustrated in Figure 35. The three reactors’ performance in treating dairy manure is illustrated by the simulation results in Figure 38.
Figure 38: Comparison of the existing designs of high solids reactors treating dairy manure
Both Design A and C that were simulated as plug flow (5 CSTR’s in series with recycle) and CSTR, respectively, show the same COD removal and gas production. Design B shows better efficiency due to the internal mixing modeled by recycling 50% of the biomass for each of the 5
74

compartments. This illustrates the benefit of mixing as long as it re-suspends and maintains higher bacterial concentration in the reactor. Although all uptake reactions are modeled with Monod kinetics, a high concentration of substrates keeps the reaction rate’s maximum at zero order which does not make a difference between CSTR and plug flow, especially at steady state conditions. Rapid dynamics may show different results. The only way for improving high solids digestion is by maintaining high concentrations of bacteria. However, when the hydrolysis is following a higher order kinetics, better performance of plug flow reactors would be shown. The high recycling flows to maintain the bacteria in the front end of the reactor reduces the dispersion effect and reduces the possible improvement using plug flow configurations. There was no difference between the three reactors in terms of methane content or ammonia inhibition. Methane content depends mainly on the substrate composition. Shock loads of toxicities may show different performance. 7.8. Impact of the Developed Interface The interface to ADM1 maintained the elemental mass, COD, charge, and covalent bond balances and determined the composition for several solid wastes. The use of several balances concealed errors when waste characteristics were collected from different sources or databases. The interface output was correlated with the reported composition of manure and food wastes. The application of the advantages of different model interfacing/transformation methodology enabled the determination of ADM1 input of carbohydrates, proteins and lipids with relevant accuracy. Accordingly, the model with the interface could evaluate co-digestion of dairy manure and potato food waste as an example for optimizing the anaerobic digestion efficiency in terms of COD removal and methane production. The simulation examples of different high solids digester designs show the importance of mixing and maintenance of biomass in the reactor. The illustrated virtual case studies show the potential impact of the interface to apply the ADM1 model to plan, optimize, and select high solids digestion technologies. With the interface, the application can be started at an early stage just by exploiting the recorded databases of solid wastes and reported practical characteristics from literature. 8. Review of CFD modelling concepts The above review of HSAD and model based comparison highlighted the importance of heating and mixing to achieve higher rate of digestion. Hereunder, important concepts to model the mixing of reactors and calculate the energy balance are reviewed. Accordingly, these concepts will be implemented in future to compare mixing and heating strategies of HSAD system. 8.1. Modelling Digester Mixing There are three mixing types commonly used in mixing-flow anaerobic digester. These types include mechanical (impeller) agitation, gas-recirculation, and slurry-recirculation. Among these types, the mechanical agitation has been proved to be the most efficient in terms of energy input and mixing performance. However, due to the impeller is installed inside the digester, maintenance of impeller is the disadvantage compared to other twos. Anaerobic digesters are mixed to provide efficient utilization of the entire digester volume, prevent stratification and temperature gradients, disperse metabolic and products and any toxic materials contained in the influent sludge, and maintain intimate contact between the bacteria, bacterial enzymes and their substrate. Adequate mixing provides a uniform environment for
75

anaerobic bacteria, one of the major factors in obtaining maximum digestion. The effect of inefficient mixing on process kinetics is a decrease in efficient system volume and a decrease in solid retention time. Monteith and Stephenson (1981) studied the full-scale digesters to show that inefficient mixing may reduce the effective volume of a digester by as much as 70%, leaving an actual volume utilization of only 30%. Bello-Mendoza and Sharratt (1998) used a dynamic model to investigate some of the effects of mixing on anaerobic digestion performance. Computer simulations showed that incomplete mixing results in lower methane generation and waste treatment efficiency, and COD removal efficiency increases by extending the retention time and the degree of mixing. Fleming (2002) used CFD technique to simulate 3-D gas-liquid two-phase flow patterns and heat transfer inside a covered lagoon digester. In this model, a modified biological kinetic model developed by Hill (1983) was included to predict biological reaction rates and methane production rates. The predictions were validated against three years of performance data from a full-scale covered anaerobic digestion system. Keshtkar et al. (2003) developed a mathematical model for anaerobic digestion to describe the dynamic behavior of non-ideal mixing continuous flow reactors, and proposed two characteristic mixing parameters (the relative volume of the flow-through region and the ratio of the internal exchange flow rate to the feed flow rate) to evaluate the digestion performance. The results showed that methane yield is a complex function of both parameters which have significant effects on the digestion process. Pena et al. (2003) studied modified pilot-scale anaerobic ponds receiving domestic sewage. The hydrodynamic behavior and process performance of these modified configurations were monitored for four flow rates (1.0, 1.2, 1.5 and 2.0 l/s). The results showed that baffling (vertical and horizontal) and the mixing pit configuration had the best hydrodynamic behaviors and removal efficiencies. Karim et al.(2004, 2005a, 2005b, and 2005c) studied the effect of mixing (biogas recirculation, impeller, and slurry recirculation) on the anaerobic digestion of animal waster. The main conclusions were (a) unmixed and mixed digesters performed quite similarly when fed with 5% manure slurry, (b) the digesters fed with 10% manure slurry and mixed by slurry recirculation, impeller mixing and biogas recirculation produced approximately 29%, 22% and 15% more biogas than the unmixed digester, respectively, and (c) mixing using biogas recirculation system was ineffective for 15% manure slurry feed. Vesvikar et al.(2005a, 2005b) performed computer automated radioactive particle tracking and computed tomography along with CFD simulations on mimic anaerobic digesters to visualize the flow patterns and obtain hydrodynamic parameters. The mixing in the digester was provided by sparging gas at different flow rates. The simulation results in terms of overall flow patterns, location of circulation cells and stagnant regions, trends of liquid velocity profiles, and volumes of dead zones agree reasonably well with experiment data. From their studies, it was concluded that the large draft tube diameter and/or a conical bottom should be used for practical reasons to enhance the digester’s mixing and thus the overall performance. 8.2. Digester Energy Balance Concepts
76

The digester temperature is one of most important affecting factors for digester operation. Knowledge of the total energy input required for proper digester function is essential in order to predict the net energy available for secondary use. There are many factors to consider when modeling heat exchange between the digester and its environment. For a digester with walls and base in contact with the soil, the density, thermal conductivity, specific heat and temperature of the ground must be considered. The density, thermal conductivity and specific heat of the ground are dependent upon soil type and water content. For example, a digester placed in dry sand with a thermal conductivity of approximately 0.3W/m K will lose heat at a significantly slower rate than a digester placed in saturated sand, which has a thermal conductivity of 3.14W/m K (Jumikis, 1977). Digesters could be installed entirely below ground surface, partially underground, or entirely above ground surface. For mixing-flow anaerobic digester, it should include extra energy used to drive the impeller or pump in terms of mixing types. The total heat and energy balance is showed in Figure 39.
solarQ heatingQ
mixingQ
Qcov er Qfloor Qwall
0=′′′q
Figure 39: Heat and energy balance for the digester
There are many factors to consider when modeling heat exchange between the digester and its environment. For a digester with walls and base in contact with the soil, the thermal conductivity, specific heat and temperature of the ground must be considered. The thermal conductivity and specific heat of the ground is dependant upon soil type, density and water. The ground surface temperature is influenced by many factors including ambient air temperature, solar load, wind speed, soil thermal conductivity, emissivity and surface roughness/cover. Ground temperature varies with time and depth from the surface. Temperature variation with depth is a function of the variation of surface conditions with time and soil diffusivity, which is a function of soil thermal conductivity, specific heat and density, all of which vary with moisture content. Kristensen (1959) shows that daily temperature variations cannot be noticed beyond a 50-cm depth in the soil studied, when daily temperatures ranged from about 13°C at night to 23°C during the warmest period of the day. Data from Parsons (1966) shows similar results. Yearly temperature variations can be noted to a greater depth. Ambient air conditions have a significant impact on heat loss through the lid of the digester. Ambient air temperature, air velocity and viscosity affect the amount of heat lost by convection. The amount of solar radiation reaching the digester surface also affects the heat balance.
77

Hills (1986) assumed that the digester does not affect the soil temperature, applied the finite difference method to solve the 2-D heat flow for plug-flow digesters, and proposed a heat balance model to optimize digester design. Axaopoulos (2001) simulated the energy balance for a solar-heated anaerobic digester. Heat loss through the digester walls and floor were calculated by solving an algebraic equation in which average heat transfer coefficients of the digester were assumed. Fleming (2002) used CFD (computational fluid dynamics) techniques to simulate the heat and mass transfer resulting from two-phase gas-liquid flow and unsteady buoyancy driven flow for anaerobic digestion. The energy balance on the cover includes the solar radiation, the convective heat transfer from the cover to the ambient air, and the heat transfer to the slurry. Minott (2002) calculated the heat flow for digesters by solving a 1-D heat conduction equation without considering the frozen area surrounding the digester in cold weather conditions.
Harikishan and Sung (2003) investigated the applicability of the temperature-phased anaerobic digestion process in the stabilization of dairy cattle manure. It was advisable to modify the conventional single-stage systems to two-stage systems by locating a thermophilic digester in front of an existing digester, and placing an effluent heat exchanger on the first-stage thermophilic digester. This approach would reduce the temperature of the thermophilic effluent to the optimum mesophilic level and enabled the recovery of a portion of the energy used in raising the temperature of incoming waste stream to thermophilic level. Zupancic and Ros (2003) studied the heating requirements of the thermophilic anaerobic digestion process. The heat requirements considered were the digester heat losses and the heat necessary for raising the incoming sludge temperature. Bouallagui et. al (2004) compared the performance of anaerobic digestion in the thermophilic (55 ) process with those under psychrophilic (20 ) and mesophilic (35 ) conditions. The energy balance of the process was analyzed by predicting energy production, calorific energy requirements, and mechanical energy requirements. Gebremedhin et al. (2003) conducted an extensive literature review on design and construction of anaerobic digesters, developed a heat transfer model, and simulated maximum biogas production. Subsequently, Gebremedhin et al. (2004 and 2005) extended their previous model to include solar radiation, weather conditions, and soil properties. Their model predictions were validated against winter and summer experimental data. Wu and Bibeau (2006) developed a 3-D heat-transfer model for digesters built entirely below ground. The model predictions were validated against experimental data and were also compared against the predictions of a one-dimensional model of Gebremedhin et al. (2003). In this study (Wu and Bibeau, 2006), a cylindrical digester with a flat top was found to loose less heat through the walls and floor than other digester geometries considered. The geometries considered include rectangular with arched top, rectangular with flat top, and cylindrical with conical bottom.
C0 C0
C0
9. Conclusions A remarkable evolution has occurred in the acceptance of reactor digestion of solid wastes during the last 25 years. The feasibility has changed towards a general acceptance that various digester types are functioning at the full scale in a reliable way. Most existing full-scale plants were designed with a single-stage reactor and reflect the relative newness of the technology. It can be expected that single-stage systems will continue to dominate the market. Among different reactor configurations, single stage designs were more robust in terms of operation simplicity. From the economics point of view dry single stage configurations are the least in terms of capital
78

costs. However, for some types of wastes they show less degradation rate. Reactor designs will be improved and matched to more specific substrates. This should provide far more reliable plants as proposed in the new design. The new design will avoid the drawback of dry-single stage of recycling and mixing. The application of the seed tank will avoid excessive recycle and mixing and compensate for the benefits achieved in wet systems compared to the dry single stage systems. At present, it is not possible to single out specific processes as all-round and optimally suited under all circumstances. Many variables have to be taken into consideration and a final evaluation for a specific site will need to be made. Application of process modelling evaluates all process variables and enables better understanding of the behaviour of different designs. For instance modelling was applied in this report to compare different dry-single stage design and shown that applying recycle of treated waste was not as efficient as compartmentalised mixing of plug flow systems. Also, the interface to ADM1 with practical characteristics of solid wastes enables the optimisation of the reactor feedstock and feeding regime. Yet, practice shows that initial investment costs are of crucial importance. Thus improving the reactor mixing to the proper extent needed for the high process rate and improving the heating system applying the energy balance concepts are very useful to increase the process efficiency with limited marginal increase of the operation cost. Indeed, the amount of gas potentially recovered from the solid wastes is substantial at a national level and therefore many governments offer tax subsidies upon AD application for MSW treatment. In addition to biogas production and tax subsidy, nutrient recovery as fertilizer, and management of remaining solids will be an added benefit of HSAD that further the feasibility of its applications.
79

10. References American Society of Agricultural Engineers. 1998. Manure production and characteristics. In
ASAE Standards. 45th edition, Section D384.1. ASAE, St. Joseph, pp. 646-648. Anderson, G. K., and G. Yang. 1992. pH control in anaerobic treatment of industrial wastewater.
J. Environ. Eng. 118(4): 551-567. Anderson, G.K. and C. B. Saw. 1992. Leach-bed two-phase anaerobic digestion of municipal
solid waste. In Proc. Int. Symp. on Anaerobic Digestion of Solid Waste, held in Venice, 14-17 April, 1992, (eds. F. Cecchi, J. Mata-Alvarez and F.G. Pohland), pp. 171-179.
Angelidaki, I. 1992. Anaerobic thermophilic process: the effect of lipids and ammonia. Ph.D. Thesis, Dept of Biotechnology, Technical Univ. of Denmark, Lyngby, DK.
Angelidaki, I., and W. Sanders. 2004. Assessment of the anaerobic biodegradability of macropollutants. Rev. in Environ. Sci. Bio/Technol. 3: 117-129.
Angelidaki, I., L. Ellegaard, and B. K. Ahring. 1993. A mathematical model for dynamic simulation of anaerobic digestion of complex substrates: focusing on ammonia inhibition. Biotechnol. Bioeng. 42: 159-166.
Arogo, J., R. H. Zhang, Riskowski, and D. L. Day. 2000. Hydrogen sulfide production from stored liquid swine manure: A laboratory study. Trans. ASAE 43(5): 1241-1245.
Axaopoulos, P., P. Panagakis, A. Tsavdaris, and D. Georgakakis. 2001. Simulation and experimental performance of a solar-heated anaerobic digester. Solar Energy 70 (2): 155-164.
Babel, S., K. fukushi, and B. Sitanarassamee. 2004. Effect of acid speciation on solid waste liquefaction in an anaerobic acid digester. Water Res. 38: 2417-2423.
Baeten, D., and Verstraete, W. 1993. In-reactor anaerobic digestion of MSW-organics. In Science and Engineering of Composting: Design, Environmental, Microbiological and Utilization Aspects (eds. Hoitink, H.A.J. and Keener, H.M.), pp. 111-129, Renaissance Publications, Worthington, OH.
Baraber, K. 1995. Aanerobic digestion of municipal solid waste: a modern waste disposal option on the verge of break through. Biomass and bioenergy 9 (1-5): 365-376.
Batstone, D. J., J. Keller, R. I., Angelidaki, S. V. Kalyuzhnyi, S. G. Pavlostathis, A. Rozzi, W. T. M. Sanders, H. Siegrist, and V. A. Vavilin. 2002. Anaerobic Digestion Model, no 1, IWA Publishing, London, UK, pp. 77.
Beck, R.W. 2004. Anaerobic Digestion Feasibility Study - Final Report, Bluestem Solid Waste Agency, http://www.iowadnr.com/waste/policy/files/bluestem.pdf.
Bello-Mendoza, R., and P.N. Sharratt. 1998. Modeling the effects of imperfect mixing on the performance of anaerobic reactors for sewage sludge treatment. J. Chemical Technol. Biotechnol. 71: 121-130.
Bilzonella, D., F. Francesco, P. Pavan, and Cecchi F. 2005. Anaerobic fermentation of organic municipal solid wastes for the production of soluble organic compounds. Ind. Eng. Chem. Res. 44: 3412-3418.
Bjornsson, L., M. Murto, and B. Mattiasson. 2000. Evaluation of parameters for monitoring an anaerobic co-digestion process. Appl. Microbiol. Biotechnol. 54: 844-849.
Bolzonella, D., P. Paven, S. Mace, and F. Cecchi. 2006. Dry anaerobic digestion of differently sorted organic municipal solid waste: a full-scale experience. Wat. Sci. Technol. 53 (8): 23-32.
Bouallagui, H., O. Haouari, Y. Touhami, R. Ben Cheikh, L. Marouani, and M. Hamdi. 2004. Effect of temperature on the performance of an anaerobic tubular reactor treating fruit and
80

vegetable waste. Pro. Biochem. 39: 2143-2148. Buffiere, P., D. Loisel, N. Bernet, and J.-P. Delgenes. 2006. Towards new indicators for the
prediction of solid waste anaerobic digestion properties, Wat. Sci. Technol. 53 (8): 233-241. Capela, I.F., C. Azeiteiro, L. Arroja, and A. C. Duarte. 1999. Effects of pre-treatment
(composting) on the anaerobic digestion of primary sludges from a bleached kraft pulp mill. In II Int. Symp. Anaerobic Dig. Solid Waste, held in Barcelona, June 15-17, 1999 (eds. J. Mata-Alvarez, A. Tilche and F. Cecchi), vol. 1, pp. 113-120.
Castillo, E. F. M., D. E. Cristancho, and V. A. Arellano. 2006. Study of the operational conditions for anaerobic digestion of urban solid wastes. Waste Management 26: 546-556.
Cecchi, F.., P. Paven, and J. M. Mata-Alvarez, and A. Basseti, and C. Cozzolini. 1991. Aanerobic digestion of municipal solid waste – thermphilic vs mesophilic perforamce at high solids. Waste Manage. Res. 9 (4): 305-315.
Cecchi, F.., P. Paven, and J. M. Mata-Alvarez, and C. San. 1992. Comparison between thermphilic and mesophilc anaerobic digestion of sewage sludge coming from urban wastewater treatment plants. Wat. Sci. Technol. 26 (9-11): 2409-2412.
Chen, T.-H. 1999. Anaerobic treatment of poultry mortalities. In II Int. Symp. Anaerobic Dig. Solid Waste, held in Barcelona, June 15-17, 1999 (eds. J. Mata-Alvarez, A. Tilche and F. Cecchi), vol. 2, pp. 69-72.
Chen, T., D. P. Chynoweth, and R. Biljetina. 1990. Aanerobic digestion of municipal solid waste in a nonmixed solids concentrating digester. Appl. Biochem. Biotechnol. 24/25: 533-544.
Chen, S., W. Liao, C. Liu, Z. Wen, R. L. Kincaid, J. H., Harrison, D. C. Elliott, M. D. Brown, A. E. Solana, and D. J. Stevens. 2003. Value-Added Chemicals from Animal Manure- Final Technical Report - Contract DE-AC06-76RL0 1830, U.S. Department of Energy.
Chen, Y., S. Jiang, H. Yuan, Q. Zhou, and G. Gu. 2006. Hydrolysis and acidification of waste activated sludge at different pHs, doi:10.1016/j.waters.2006.07.030.
Christ, O., M. Faulstich, P. Wilderer. 2000. Mathematical modelling of the hydrolysis of anaerobic processes. Wat. Sci. Technol. 41 (3): 61–65.
Chynoweth, D. P., J. Owens, D. Okeefe, J. F. K. Earle, G. Bosch, and R. Legrand. 1992. Sequential batch anaerobic composting of the organic fraction of municipal solid-waste. Wat. Sci. Technol. 25 (7): 327-339.
Copp, J., U. Jeppsson, and C. Rosen. 2003. Towards an ASM1-ADM1 state variable interface for plant-wide wastewater treatment modelling. In: Proceedings 76th Annual WEFTEC Conference and Exposition, Los Angeles, USA, October 11-15, 2003.
Cozzolino, C., A. Bassetti, and P. Rondelli. 1992. Industrial application of semi-dry anaerobic digestion process of organic solid waste. In Proc. Int. Symp. on Anaerobic Digestion of Solid Waste, held in Venice, 14-17 April, 1992, (eds. F. Cecchi, J. Mata-Alvarez and F.G. Pohland), pp. 551-555.
Davis, M., and D. Cornwell. 1998. Introduction to Environmental Engineering. New York, N.Y. WCB/McGraw-Hill.
De Baere, L. 1999. Anaerobic digestion of solid waste: state-of-the art. In II Int. Symp. Anaerobic Dig. Solid Waste, held in Barcelona, June 15-17, 1999 (eds. J. Mata-Alvarez, A. Tilche and F. Cecchi), vol. 1, pp. 290-299.
De Baere, L., and Boelens, J. 1999. The treatment of greyand mixed solid waste by means of anaerobic digestion: future developments. In II Int. Symp. Anaerobic Dig. Solid Waste, held in Barcelona, June 15-17, 1999 (eds. J. Mata-Alvarez, A. Tilche and F. Cecchi), vol. 2, pp. 302-305.
81

De Baere, L. 2000. Aanerobic digestion of solid waste: state-of- the-art. Wat. Sci. Technol. 41 (3): 283-290.
Delnoij, E., J. A. M. Kuipers, and W.P.M. van Swaaij. 1997. Dynamics simulation of gas-liquid two-phase flow: effect of column aspect ratio on the flow structure. Chemical Eng.Sci. 52: 3759-3772.
Droste, R. L. 1997. Theory and Practice of Water and Wastewater Treatment. New York, N.Y.: John Wiley and Sons.
Edelmann, W., A. Joss, and H. Engeli. 1999. Two-step anaerobic digestion of organic solid wastes. In II Int. Symp. Anaerobic Dig. Solid Waste, held in Barcelona, June 15-17, 1999 (eds. J. Mata-Alvarez, A. Tilche and F. Cecchi), vol 2, pp. 150-153.
Engelhart, M., M. Kruger, J. Kopp, and N. Dicht. 1999. Effects of disintegration on anaerobic degradation of sewage excess sludge in downflow stationary fixed film digesters. In: Mata-Alvarez, J., A. Tilche, and F. Cecchi, F. (Eds.), Proceedings of the Second International Symposium on Anaerobic Digestion of Solid Wastes, Barcelona, vol. 1. Grafiques 92, 15-18 June, pp. 153-160.
Farneti, A., C. Cozzolino, D. Bolzonella, L. Innocenti, and C. Cecchi. 1999. Semi-dry anaerobic digestion of OFMSW: the new full-scale plant of Verona (Italy). In II Int. Symp. Anaerobic Dig. Solid Waste, held in Barcelona, June 15-17, 1999 (eds. J. Mata-Alvarez, A. Tilche and F. Cecchi), vol. 2, pp. 330-333.
Feijoo, G., M. Soto, R. Mendez, and J. M. Lema. 1995. Sodium inhibition in the anaerobic digestion process: Antagonism and adaptation phenomena. Enzyme Microb. Technol. 17: 180–188
Fleming, J.G. 2002. Novel simulation of anaerobic digestion using computational fluid dynamics. PhD Dissertation. North Carolina State University, Raleigh, NC.
Fruteau de Laclos, H., S. Desbois, and C. Saint-Joly. 1997. Anaerobic digestion of municipal solid organic waste : Valorga full-scale plant in Tilburg, The Netherlands. In Proc. 8th Int. Conf. on Anaerobic Dig., held in Sendai, May 25-29, 1997, vol. 2, pp. 232-238.
Fujishima S., T. Miyahara, and Noike T. 2000. Effect of moisture content on anaerobic digestion of dewatered sludge: ammonia inhibition to carbohydrate removal and methane production. Wat. Sci. Technol. 41: 119-127
Garcia, J. L., and P. Schalk. 1999. Biopercolat-procedure. In II Int. Symp. Anaerobic Dig. Solid Waste, held in Barcelona, June 15-17, 1999 (eds. J. Mata-Alvarez, A. Tilche and F. Cecchi), vol. 2, pp. 298-301.
Garcia-Encina, P. A., M. D. Hidalgo. 2005. Influence of substrate feed patterns on biofilm development in anaerobic fluidized bed reactors (AFBR), Pro. Biochem. 40 (7), 2509-2516.
Gebremedhin, K. G., B. Wu, and C. Guarino. 2003. Heat transfer model for biogas system. ASAE Meeting, paper No: 034137, ASAE, St. Joseph.
Gebremedhin, K. G., B. Wu, C. Gooch, and P. Wright. 2004. Simulation of heat transfer for maximum biogas production. ASAE/CSAE meeting, paper No: 044165. ASAE, St. Joseph.
Gebremedhin, K. G., B. Wu, C. Gooch, P. Wright, and S. Inglis. 2005. Heat transfer model for plug-flow anaerobic digesters. Trans. ASAE. 48(2):777-785.
Ghosh, S., M. P. Henry, A. Sajjad, M. C. Mensinger, and J. L. Arora. 1999. Pilot-cale gasification of MSW by high-rate and two-phase anaerobic digestion. In II Int. Symp. Anaerobic Dig. Solid Waste, held in Barcelona, June 15-17, 1999 (eds. J. Mata-Alvarez, A. Tilche and F. Cecchi), vol. 1, pp. 83-90.
Griffin, M. E., K. D. McMahon, R. I. Mackie, and L. Raskin. 1998. Methanogenic population
82

dynamics during start-up of anaerobic digesters treating municipal solid-waste and biosolids. Biotechnol. Bioeng. 57 (3): 342-355.
Grontmij. 2004. Municipal Solid Waste Mechanical Separation and Biological Treatment Plant, VAGRON, The Netherlands.
Guerrero, L., F. Omil, R. Mendez, and J. M. Lema. 1999. Aanerobic hydrolysis and acidogenesis of wastewaters from food industries with high content of organic solids and protein. Water Res. 33 (15): 3281-3290.
Hansen, C. L., and D. Y. Cheong. 2007. Agricultural waste management in food processing. In Food Machinery Hand Book. Norwich, N.Y.: William Andrew Publishing. pp. 609-661.
Hansen, T. L., S. G. Sommer, G. Soren, and T. H. Christensen. 2006. Methane production during storage of anaerobically digested municipal organic waste. J. Environ. Qual. 35 (3): 830-836.
Harikishan, S., and S. Sung. 2003. Cattle waste treatment and class A biosolid production using temperature-phased anaerobic digester. Adv. Environ. Res. 7: 701-706.
Hartmann, H., and B. K. Ahring. 2005. Aanerobic digestion of the organic fraction of municipal solid waste: influence of co-digestion with manure. Water Res. 39: 1543-1552.
Hartmann, H., and B. K. Ahring. 2006. Strategies for the anaerobic digestion of the organic fraction of municipal solid waste: an overview. Wat. Sci. Technol. 53 (8): 7-22.
Hartmann, H., I. Angelidaki, I., and B. K. Ahring. 1999. Increase of anaerobic degradation of particulate organic matter in full-scale biogas plants by mechanical maceration. In: Mata-Alvarez, J., A. Tilche, A.,and F.Cecchi (Eds.), Proceedings of the Second International Symposium on Anaerobic Digestion of Solid Wastes, Barcelona, vol. 1. Grafiques 92, 15-18 June, pp. 129-136.
Hartmann, H., H. B. Moller, and B. K. Ahring. 2004. Efficiency of the anaerobic treatment of the organic fraction of municipal solid waste: collection and pretreatment. Waste Manage. Res. 22: 35-41.
He, P.-J., F. Lu, L.-M. Shao, X.-J. Pan, and D.-J. Lee. 2006. Enzymatic hydrolysis of polysaccharide-rich particulate organic waste. Biotechnol. Bioeng. 93 (6): 1145-1151.
Henze, M., W. Gujer, T. Mino, M. C. M. van Loosdrecht. 2000. Activated Sludge Models: ASM1, ASM2, ASM2d and ASM3. Scientific and Technical Report No:9, IWA Publishing, London, UK.
Hill, D.T. 1983. Energy consumption relationships for mesophilic and thermophilic digestion of animal manure. Trans. ASAE 26: 841-848.
Hofenk, G., S. J. J. Lips, B. A., and J. W. Voetberg. 1984. Two-phase anaerobic digestion of solid organic wastes yielding biogas and compost. EC Contract Final Report ESE-E-R-040-NL.
Jain, S, A. L. Lala, S. K. Bathia, and A. P. Kudchadker. 1992. Modelling hydrolysis controlled anaerobic digestion, J. Chem. Technol. Biotechnol. 53: 337–344
Johansen, J. E., and Bakke R. 2006. Enhancing hydrolysis with microaeration, Wat. Sci. Technol. 53 (8): 43-50
Jokela, J. P. Y., V. A. Vavilin, and J. A. Rintala. 2005. Hydrolysis rates, methane production and nitrogen solubilsation of grey waste components during anaerobic degradation. Bioresource Technol. 96: 501-508.
Jumikis, A.R. 1977. Thermal Geotechnics. Rutgers University Press. New Brunswick, New Jersey.
Karim, K., R. Varma, M. Vesvikar, and M.H. Al-Dahhan. 2004. Flow pattern visualization of a simulated digester. Water Research. 38: 3659-3670.
83

Karim, K., K. T. Klasson, R. Hoffmann, S.R. Drescher, D.W. DePaoli, and M.H. Al-Dahhan. 2005a. Anaerobic digestion of animal waste: effect of mixing. Bioresource Technol. 96: 1607-1612.
Karim, K., R. Hoffmann, K. T. Klasson, and M.H. Al-Dahhan. 2005b. Anaerobic digestion of animal waste: waste strength versus impact of mixing. Bioresource Technol. 96: 1771-1781.
Karim, K., R. Hoffmann, K. T. Klasson, and M.H. Al-Dahhan. 2005c. Anaerobic digestion of animal waste: effect of mode of mixing. Water Res. 39: 3597-3606.
Karlsson, I., and J. Goransson. 1993. Thermic sludge treatment. Wat. Sci. Technol. 27 (5-6): 449-456.
Kayhanian, M., and D. Rich. 1995. Pilot-scale high-solids thermpohilic anaerobic digestion of municipal of municipal solid waste with an emphsis on nutrient requirements. Biomass and Bioenergy 8 (6): 123-136.
Kayhanian, M., G. Tchobanoglous, J. Mata-Alvarez. 1996. Development of a mathematical model for the simulation of the biodegradation of organic substrates in a high-solids anaerobic digestion process, J. Chem. Technol. Biotechnol. 66 (3): 312-322.
Keshtkar, A., B. Meyssami, G. Abolhamd, H. Ghaforian, and M. K. Asadi. 2003. Mathematical modeling of non-ideal mixing continuous flow reactors for anaerobic digestion of cattle manure. Bioresource Technol. 87: 113-124.
Kim, J., and C. Park. 2003. Effects of various pretreatments for enhanced anaerobic digestion with waste activated sludge. J. Biosci. Bioeng. 95 (3): 271-275.
Kim, J., C. Park, T. K. Kim, M. Lee, S. Kim, S. W. Kim, and J. Lee. 2003. Effects of various pretreatments for enhanced anaerobic digestion with waste activated sludge. J. Biosci. Bioeng. 95 (3): 271-275
Kim, M. Y. Ahn, and R. E. Speece. 2002. Comparative process stability and efficiency of anaerobic digestion: mesophilic vs. thermophilic. Water Res. 36: 4369-4385.
Kopp, J., J. Muller, N. Dichtl, and J. Schwedes. 1997. Aanerobic digestion and dewatering characteristic of mechanically disintegrated excess sludge. Wat Sci. Technol. 36 (11): 129-136.
Kristensen, K. J. 1959. Temperature and heat balance of soil. Oikos. Vol. 10 (1): 103-120. Krylova, N. I., R. E. Khabiboulline, R. E. Naumova, and M. A. Nagel. 1997. The influence of
ammonium and methods for removal during the anaerobic treatment of poultry manure. J. Chem. Technol. Biotechnol. 70: 99-105.
Kübler, H., and C. Schertler. 1994. 3-phase anaerobic digestion of organic wastes. Wat. Sci. Technol. 30 (12): 367-374.
Kübler, H., M. Wild. 1992. The BTA-process high rate biomethanisation of biogenous solid wastes. In Proc. Int. Symp. on Anaerobic Digestion of Solid Waste, held in Venice, 14-17 April, 1992, (eds. F. Cecchi, J. Mata-Alvarez and F.G. Pohland), pp. 535-538.
Lettinga, G. 1995. Anaerobic digestion and wastewater treatment systems. Antonie Van Leeuwenhoek 67: 3-28.
Levasseur, J.-P. 1999. Anaerobic digestion of organic waste:from theory to industrial practice. In II Int. Symp. Anaerobic Dig. Solid Waste, held in Barcelona, June 15-17, 1999 (eds. J. Mata-Alvarez, A. Tilche and F. Cecchi), vol. 2, pp. 334-337.
Libanio, P. A. C., B. M. P Costa, I. S. Cintra, and C. A. L. Chernicharo. 2003. Evaluation of the start-up of an integrated municipal; solid waste and leachate treatment system. Wat. Sci. Technol. 48 (6): 241-247.
Lin, J. G., C. N. Chang, and S. C. Chang. 1997. Enhancement of anaerobic digestion of waste
84
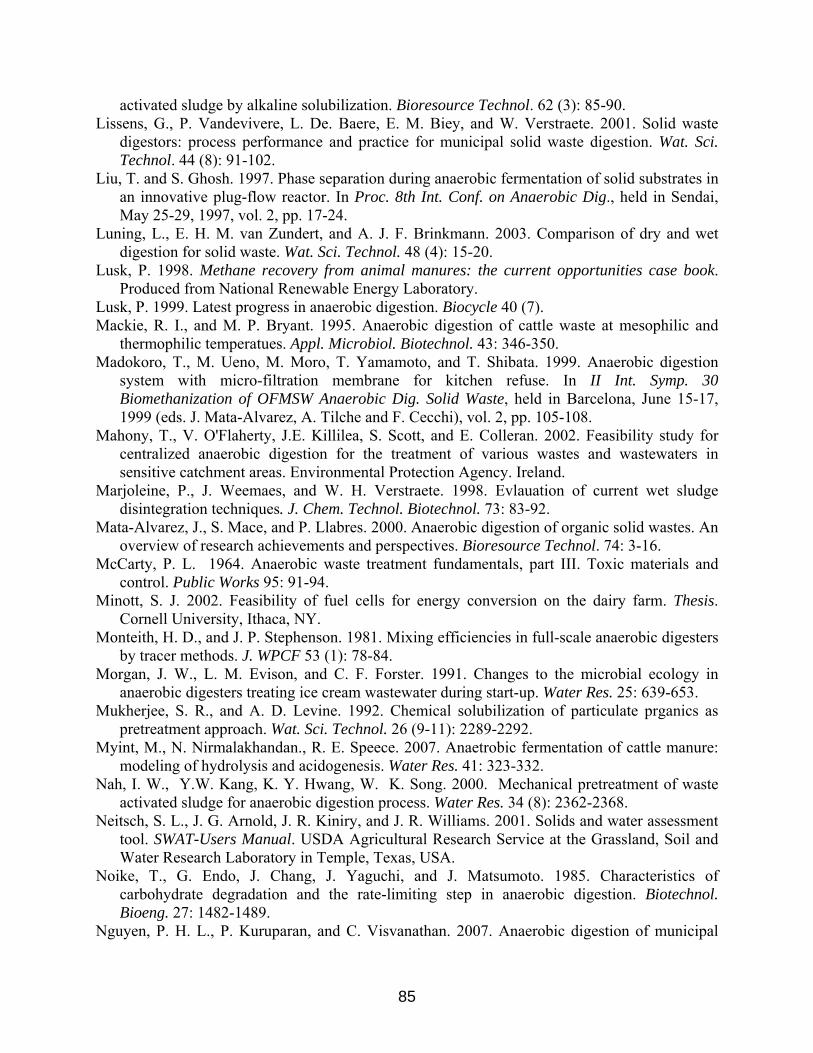
activated sludge by alkaline solubilization. Bioresource Technol. 62 (3): 85-90. Lissens, G., P. Vandevivere, L. De. Baere, E. M. Biey, and W. Verstraete. 2001. Solid waste
digestors: process performance and practice for municipal solid waste digestion. Wat. Sci. Technol. 44 (8): 91-102.
Liu, T. and S. Ghosh. 1997. Phase separation during anaerobic fermentation of solid substrates in an innovative plug-flow reactor. In Proc. 8th Int. Conf. on Anaerobic Dig., held in Sendai, May 25-29, 1997, vol. 2, pp. 17-24.
Luning, L., E. H. M. van Zundert, and A. J. F. Brinkmann. 2003. Comparison of dry and wet digestion for solid waste. Wat. Sci. Technol. 48 (4): 15-20.
Lusk, P. 1998. Methane recovery from animal manures: the current opportunities case book. Produced from National Renewable Energy Laboratory.
Lusk, P. 1999. Latest progress in anaerobic digestion. Biocycle 40 (7). Mackie, R. I., and M. P. Bryant. 1995. Anaerobic digestion of cattle waste at mesophilic and
thermophilic temperatues. Appl. Microbiol. Biotechnol. 43: 346-350. Madokoro, T., M. Ueno, M. Moro, T. Yamamoto, and T. Shibata. 1999. Anaerobic digestion
system with micro-filtration membrane for kitchen refuse. In II Int. Symp. 30 Biomethanization of OFMSW Anaerobic Dig. Solid Waste, held in Barcelona, June 15-17, 1999 (eds. J. Mata-Alvarez, A. Tilche and F. Cecchi), vol. 2, pp. 105-108.
Mahony, T., V. O'Flaherty, J.E. Killilea, S. Scott, and E. Colleran. 2002. Feasibility study for centralized anaerobic digestion for the treatment of various wastes and wastewaters in sensitive catchment areas. Environmental Protection Agency. Ireland.
Marjoleine, P., J. Weemaes, and W. H. Verstraete. 1998. Evlauation of current wet sludge disintegration techniques. J. Chem. Technol. Biotechnol. 73: 83-92.
Mata-Alvarez, J., S. Mace, and P. Llabres. 2000. Anaerobic digestion of organic solid wastes. An overview of research achievements and perspectives. Bioresource Technol. 74: 3-16.
McCarty, P. L. 1964. Anaerobic waste treatment fundamentals, part III. Toxic materials and control. Public Works 95: 91-94.
Minott, S. J. 2002. Feasibility of fuel cells for energy conversion on the dairy farm. Thesis. Cornell University, Ithaca, NY.
Monteith, H. D., and J. P. Stephenson. 1981. Mixing efficiencies in full-scale anaerobic digesters by tracer methods. J. WPCF 53 (1): 78-84.
Morgan, J. W., L. M. Evison, and C. F. Forster. 1991. Changes to the microbial ecology in anaerobic digesters treating ice cream wastewater during start-up. Water Res. 25: 639-653.
Mukherjee, S. R., and A. D. Levine. 1992. Chemical solubilization of particulate prganics as pretreatment approach. Wat. Sci. Technol. 26 (9-11): 2289-2292.
Myint, M., N. Nirmalakhandan., R. E. Speece. 2007. Anaetrobic fermentation of cattle manure: modeling of hydrolysis and acidogenesis. Water Res. 41: 323-332.
Nah, I. W., Y.W. Kang, K. Y. Hwang, W. K. Song. 2000. Mechanical pretreatment of waste activated sludge for anaerobic digestion process. Water Res. 34 (8): 2362-2368.
Neitsch, S. L., J. G. Arnold, J. R. Kiniry, and J. R. Williams. 2001. Solids and water assessment tool. SWAT-Users Manual. USDA Agricultural Research Service at the Grassland, Soil and Water Research Laboratory in Temple, Texas, USA.
Noike, T., G. Endo, J. Chang, J. Yaguchi, and J. Matsumoto. 1985. Characteristics of carbohydrate degradation and the rate-limiting step in anaerobic digestion. Biotechnol. Bioeng. 27: 1482-1489.
Nguyen, P. H. L., P. Kuruparan, and C. Visvanathan. 2007. Anaerobic digestion of municipal
85

solid waste as a treatment prior to landfill. Bioresource Technol. 98: 380-387. Nordberg, A., Nilsson, A. and Blomgren, A. 1992. Salt accumulation in a biogas process with
liquid recirculation. Effect on gas production, VFA concentration and acetate metabolism. In Proc. Int. Symp. on Anaerobic Digestion of Solid Waste, held in Venice, 14-17 April, 1992, (eds. F. Cecchi, J. Mata-Alvarez and F.G. Pohland), pp. 431-435.
Novaes, R. F. V. 1986. Microbiology of anaerobic digestion. Wat. Sci. Technol. 12: 1-14. Ohmura, T., T. Sakai, Y. Shindo, K. Nakamura, T. Ike, and Y. Katayama. 2003. Start-up of full-
scale anaerobic digesters treating municipal solid waste. Wat. Sci. Technol. 48 (4): 249-252. O'Keefe, D.M., D. P. Chynoweth, A.W. Barkdoll, R. A. Nordstedt, J. M. Owens, and J. Sifontes.
1992. Sequential batch anaerobic composting. In Proc. Int. Symp. On Anaerobic Digestion of Solid Waste, Venice, 14-17 April, 1992, (eds. F. Cecchi, J. Mata-Alvarez and F.G. Pohland), pp. 117-125.
Oleszkiewicz, J.A. and M. Poggi-Varaldo. 1997. High-solids anaerobic digestion of mixed municipal and industrial wastes. J. Environ. Eng. 123: 1087-1092.
Ouedraogo, A. 1999. Pilot scale two-phase anaerobic digestion of the biodegradable organic fraction of Bamako district municipal solid waste. In II Int. Symp. Anaerobic Dig. Solid Waste, held in Barcelona, June 15-17, 1999 (eds. J. Mata-Alvarez, A. Tilche and F. Cecchi), vol. 2, pp. 73-76.
Palmowski, L. and J. Müller. 1999. Influence of the size reduction of organic waste on their anaerobic digestion. In II Int. Symp. Anaerobic Dig. Solid Waste, held in Barcelona, June 15-17, 1999 (eds. J. Mata-Alvarez, A. Tilche and F. Cecchi), vol. 1, pp. 137-144.
Park, C., C. Lee, Y. Chen, and H. A. Chase. 2005. Upgrading of anaerobic digestion by incorporating two different hydrolysis processes. J. Biosci. Bioeng. 100 (2): 164-167.
Parkin, G. F., and Owen, W. F. 1986. Fundamentals of anaerobic digestion of wastewater sludges. J. Environ. Eng. 112 (5): 867–920.
Parsons, R. S. 1966. Investigation of an earth-air heat exchanger. M.S. Thesis. Cornell University, Ithaca, NY.
Pavan, P., P. Battistoni, F. Cecchi, and J. Mata-Alvarez. 1999a. Two-phase anaerobic digestion of source-sorted OFMSW: performance and kinetic study. In II Int. Symp. Anaerobic Dig. Solid Waste, held in Barcelona, June 15-17, 1999 (eds. J. Mata-Alvarez, A. Tilche and F. Cecchi), vol. 1, pp. 91-98.
Pavan, P., P. Battistoni, and J. Mata-Alvarez. 1999b. Performance of thermophilic semi-dry anaerobic digestion process changing the feed biodegradability. In II Int. Symp. Anaerobic Dig. Solid Waste, held in Barcelona, June 15-17, 1999 (eds. J. Mata- Alvarez, A. Tilche and F. Cecchi), vol. 1, pp. 57-64.
Paven, P., P. Battistoni, D. Bolzonella, L. Inoocenti, P. Traverso, and F. Cecchi. 2000. Integration of wastewater and OFMSW treatment cycles: from the pilot scale experiment to the industrial realization-the new full scale plant Treviso (Italy). Wat. Sci. Technol. 41 (12): 165-173.
Pavlostathis, S. G., and E. Giraldo-Gomez. 1991. Kinetics of anaerobic treatment. Wat. Sci. Technol. 24 (8): 35–59
Peiris, B. R. H., P. G. Rathnasiri, J. E. Johansen, A. Kuhn, R. Bakke. 2006. ADM1 simulations of hydrogen production. Wat. Sci. Technol. 53 (8): 129-137.
Pena, M. R., D. D. Mara, and J. M. Piguet. 2003. Improvement of mixing patterns in pilot-scale anaerobic pond treating domestic sewage. Wat. Sci. Technol. 48 (2): 234-242.
Raynal, J., J. P. Delgenes, and R. Moletta. 1998. Two-phase anaerobic digestion of solid wastes
86

by a multiple liquefaction reactors process. Bioresource Technol. 65: 97-103. Reichert, P. 1998. User manual of AQUASIM 2.0 for the identification and simulation of aquatic
systems, Swiss Federal Institute for Environmental Science and Technology. Du¨bendorf, Switzerland.
Rittmann, B. E., and P. L. McCarty. 2001. Environmental Biotechnology: Principles and Applications. New York: McGraw-Hill.
Saham, H. 1984. Anaerobic wastewater treatment. Adv. Biochem. Eng./Biotechnol. 29: 84-115. Samani, H. W. Y., Z. Samani, A. Hanson, G. Smith. 2002. Energy recovery from grass using
two-phase anaerobic digestion. Waste Management 22: 1-5. Sanders, W. T. M, G. Zeeman, and G. Lettinga. 2002. Hydrolysis kinetics of dissolved polymers.
Wat. Sci. Technol. 45 (10): 99–104. Sanders, W. T. M., M. Geerink, G. Zeeman, and G. Lettinga. 2000. Anaerobic hydrolysis
kinetics of particulate substrates, Wat. Sci. Technol. 41 (3): 17-24. Scherer, P.A., G.-R. Vollmer, T. Fakhouri, and S. Martensen. 1999. Development of a
methanogenic process to degrade exhaustively municipal 'residual refuse' (MRR) and 'grey waste' under thermophilic and hyperthermophilic conditions. In II Int.Symp. Anaerobic Dig. Solid Waste, held in Barcelona, June 15-17, 1999 (eds. J. Mata-Alvarez, A. Tilche and F. Cecchi), vol. 1, pp. 65-74.
Sherer, P.A., G. R. Vollmer, and T. Fakhouri, and S. Martensen. 2000. Development of amethanogenic process to degrade exhaustively the organic fraction of municipal “grey waste” under thermphilic and hypothermphilc conditions. Wat. Sci. Technol. 41 (3): 83-91.
Siegrist, H., and D. Batstone. 2001. Free ammonia and pH inhibition of acetotrophic methanogenesis at mesophilic and thermophilic conditions. In 9th World Congress: Anaerobic Digestion, Antwerp, Belgium, September 2-6, 2001, 395-400.
Silvey, P., L. Blackall, P. Nichols, and P. Pullammanappallil. 1999. Microbial ecology of the leach bed anaerobic digestion of unsorted municipal solid waste. In II Int. Symp. Anaerobic Dig. Solid Waste, held in Barcelona, June 15-17, 1999 (eds. J. Mata-Alvarez, A. Tilche and F. Cecchi), vol. 1, pp. 17-24.
Six, W. and L. De Baere. 1992. Dry anaerobic conversion of municipal solid waste by means of the Dranco process at Brecht, Belgium. In Proc. Int. Symp. on Anaerobic Digestion of Solid Waste, held in Venice, 14-17 April, 1992, (eds. F. Cecchi, J. Mata-Alvarez and F.G. Pohland), pp. 525-528.
Six, W., and L. De Baere. 1992. Dry anaerobic conversion of municipal solid waste by means of the Dranco process. Wat. Sci. Technol. 25 (7): 295-300.
Soto, M., R. Mendez, and J. M. Lema. 1993. Sodium inhibition and sulphate reduction Speece, R. E. 1996. Anaerobic Biotechnology for Industrial Wastewaters. Nashville, TN: Archae
Press. Spendlin, H.-H., and R. Stegmann. 1988. Anaerobic fermentation of the vegeable, fruit, and yard
waste. In Proc. 5th Int. Solid Wastes Conf., held in Copenhagen, September 11-16, 1988 (eds. L. Andersen and J. Moller), vol. 2, pp. 25-31, Academic Press, London.
Sterling M. C., R. E. Lacey, C. R. Engler, and S. C. Ricke. 2001. Effects of ammonia nitrogen on H2 and CH4 production during anaerobic digestion of dairy cattle manure. Bioresource Technol. 77: 9-18.
Stronach, S. M., T. Rudd, and J. N. Lester. 1986. Anaerobic Digestion Process in Industrial Wastewater Treatment. New York, N.Y.: Springer Heidelberg.
Stroot, P. G., K. D. Katherine, R. I. Mackie, and L. Raskin. 2001. Anaerobic codigestion of
87

municipal solid waste and biosolids under various mixing conditions–I. digester performance. Water Res. 35 (7): 1804-1816.
Switzenbaum, M. S., E. Giraldo-Gommez, and R. Hickey. 1990. Monitoring of the anaerobic methane fermentation process. Enzyme Microb. Technol. 12: 722-730.
ten Brummeler, E. 1992. Dry anaerobic digestion of solid waste in the Biocel process with a full scale unit. In Proc. Int. Symp. on Anaerobic Digestion of Solid Waste, held in Venice, 14-17 April, 1992, (eds. F. Cecchi, J. Mata-Alvarez and F.G. Pohland), pp. 557-560.
ten Brummeler, E. 1999. Full scale experience with the Biocel-process. In II Int. Symp. Anaerobic Dig. Solid Waste, held in Barcelona, June 15-17, 1999 (eds. J. Mata-Alvarez, A. Tilche and F. Cecchi), vol. 1, pp. 308-314.
Thurm, F., and W. Schmid. 1999. Renewable energy by fermentation of organic waste with the Kompogas process. In II Int. Symp. Anaerobic Dig. Solid Waste, held in Barcelona, June 15-17, 1999 (eds. J. Mata-Alvarez, A. Tilche and F. Cecchi), vol. 2, pp. 342-3345.
Trösch, W., and V. Niemann. 1999. Biological waste treatment using the thermophilic schwarting-Uhde process. In II Int. Symp. Anaerobic Dig. Solid Waste, held in Barcelona, June 15-17, 1999 (eds. J. Mata-Alvarez, A. Tilche and F. Cecchi), vol. 2, pp. 338-341.
U.S. Department of Agriculture, Agricultural Research Service. 2005. USDA National Nutrient Database for Standard Reference, Release 18. Nutrient Data Laboratory Home Page. http://www.ars.usda.gov/ba/bhnrc/ndl.
USDA-NRCS. 1996. Agricultural Waste Management Field Handbook. 210-vi–AWMFH, rev. 1. http://www.info.usda.gov/CED/ftp/CED/neh651-ch4.pdf.
van Lier, J. B., J. L. S. Martin, and G. Lettinga. 1996. Effect of temperature on the anaerobic thermophilic conversion of volatile fatty acids by dispersed and granular sludge. Water Res. 30: 199-207.
van Lier, J. B., A. Tilche, B. K. Ahring, H. Macrie, R. Moletta, M. Dohanyos, L. W. Hushoff Pol, P. Lens, and W. Verstraete. 2001. New perspectives in anaerobic digestion. 43 (1): 1-18.
van Opstal, B. 2006a. Evaluating AD system performance for MSW organics. Biocycle. 47 (11): 35-39.
van Opstal, B. 2006b. Managing AD system logistics for MSW organics. Biocycle 47 (12): 39-43.
Vandeviviere, P., L. De Baere, and W. Verstraete. 2002. Types of anaerobic digester for solid wastes. In J. Mata-Alvarez (Ed). Biomethanization of the Organic Fraction of Municipal Solid Wastes, London: IWA Publishing, pp. 111-137.
Vanrolleghem, P. A., C. Rosen, U. Zaher, J. Copp, L. Benedetti, E. Ayesa, and U. Jeppsson. 2005. Continuity-based interfacing of models for wastewater systems described by Petersen matrices. Wat Sci. Technol. 52 (1-2): 493-500.
Vavilin, V. A., and I. Angelidaki. 2005. Anaerobic degradation of solid material: importance of initiation centers for methanogenesis, mixing intensity, and 2D distributed model. Biotechnol. Bioeng. 89 (1): 113-122.
Vavilin, V. A., S. V. Rytov, and L. Y. Lokshina. 1996. A description of the hydrolysis kinetics in anaerobic degradation of particulate organic matter. Bioresource Technol. 56: 229–237.
Vavilin, V. A., M. Y. Schelkanov, L. Y. Lokshina, S. V. Rytov, J. Jokela, and E. Salminen. 2002. A comparative analysis of a balance between the rates of polymer hydrolysis and acetoclastic methanogenesis during anaerobic digestion of solid waste. Wat. Sci. Technol. 45 (10): 249-254.
Vavilin, V. A., L. Y. Lokshina, and J. P. Y. Jokela. 2004. Modeling solid waste decomposition.
88

Bioresource Technol. 94: 69-81. Veeken, A., and B. Hamelers. 1999. Effect of temperature on hydrolysis rates of selected
biowaste components. Bioresource Technol. 69: 249-254. Veeken, A., S. Kalyuzhnyi, H. Scharff, and B. Hamelers. 2000. Effect of pH and VFA on
hydrolysis of organic solid waste. J. Environ. Eng. 126 (12): 1076-1081. Vesvikar, M. S., and M. H. Al-Dahhan. 2005a. Flow pattern visualization in a mimic anaerobic
digester using CFD. Biotechnol. Bioeng. 89 (6):719-732. Vesvikar, M. S., R. Varma, K. Karim, and M. H. Al-Dahhan. 2005b. Flow pattern visualization
in a mimic anaerobic digester: experimental and computational studies. Wat Sci Technol. 52(1-2): 537-543.
Vlyssides, A. G., and P. K. Karlis. 2004. Thermal-alkaline solubilization of waste activated sludge as a pre-treatment stage for anaerobic digestion. Bioresource Technol. 91: 201-206.
Wang, Z., and C. J. Banks. 2000. Accelerated hydrolysis and acidification of municipal solid waste (MSW) in a flushing anaerobic bio-reactor using treated leachate recirculation. Waste Manage. Res. 18: 215-223.
Weiland, P. 1992. One- and two-step anaerobic digestion of solid agroindustrial residues. In Proc. Int. Symp. on Anaerobic Digestion of Solid Waste, held in Venice, 14-17 April, 1992, (eds. F. Cecchi, J. Mata-Alvarez and F.G. Pohland), Int. Assoc. on Wat. Poll. Res. and Control , pp. 193-199.
Weiland, P. 2000. Co-fermentation of organic wastes - Concepts, processes and new developments. International Meeting Chemical Engineering, Environmental Protection and Biotechnology, Frankfurt, May 2000, pp. 192-194.
Wellinger, A., C. Widmer, and P. Schalk. 1999. Percolation - a new process to treat MSW. In II Int. Symp. Anaerobic Dig. Solid Waste, held in Barcelona, June 15-17, 1999 (eds. J. Mata-Alvarez, A. Tilche and F. Cecchi), vol. 1, pp. 315-322.
Westergard, R., and J. Teir. 1999. The Waasa process integrated in the eco-cycling society. In II Int. Symp. Anaerobic Dig. Solid Waste, held in Barcelona, June 15-17, 1999 (eds. J. Mata-Alvarez, A. Tilche and F. Cecchi), vol. 2, pp. 310-313.
Wu, B., and E. Bibeau. 2006. Development of 3-D anaerobic digester heat transfer model for cool weather applications. Trans. ASABE 49 (3):749-757.
Zaher, U., and S. Chen. 2006. Interfacing the IWA anaerobic digestion model no1 (ADM1) with manure and solid waste characteristics. Water Environment Federation Technical Exhibition and Conference (WEFTEC 79th). Dallas, Texas, USA, October 21-25, 2006.
Zaher, U., P. Grau P., L. Benedetti, E. Ayesa., and P. A. Vanrolleghem. 2007. Transformers for interfacing anaerobic digestion models to pre- and post-treatment processes in a plant-wide modelling context. Environmental Modeling & Software. 22 (1): 40-58.
Zupancic, G.D, and M. Ros. 2003. Heat and energy requirements in thermophilic anaerobic sludge digestion. Renewable Energy. 28: 2255-2267.
89