•produce an ordered sequence of steps that describe
TRANSCRIPT

1

2
•A typical programming task can be divided into two phases:
1-Problem solving phase
•produce an ordered sequence of steps that describe solution of problem
•this sequence of steps is called an algorithm
2-Implementation phase
•implement the program in some programming language
Steps for writing an algorithm for a program:
1. Keep in mind that algorithm is a step-by-step process.
2. Depending upon programming language, include syntax where necessary.
3. Begin.
4. Include variables and their usage.
5. If they are any loops, try to give sub number lists.
6. Try to give go back to step number if loop or condition fails.
7. Use jump statement to jump from one statement to another.
8. Define expressions.
9. Use break and stop to terminate the process.
Qualities of a good algorithm
1. Input and output should be defined precisely.
2. Each steps in algorithm should be clear and unambiguous.
3
3. Algorithm should be most effective among many different ways to
solve a problem.
4. An algorithm shouldn't have computer code. Instead, the algorithm
should be written in such a way that, it can be used in similar
programming languages.
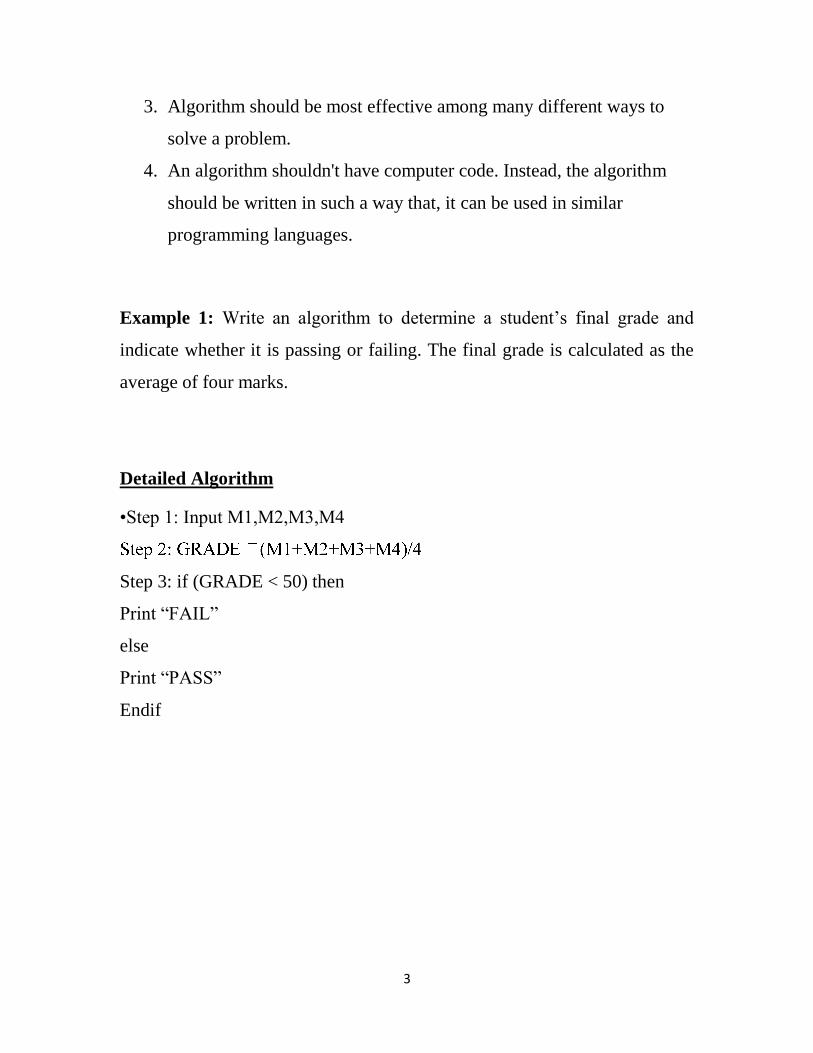
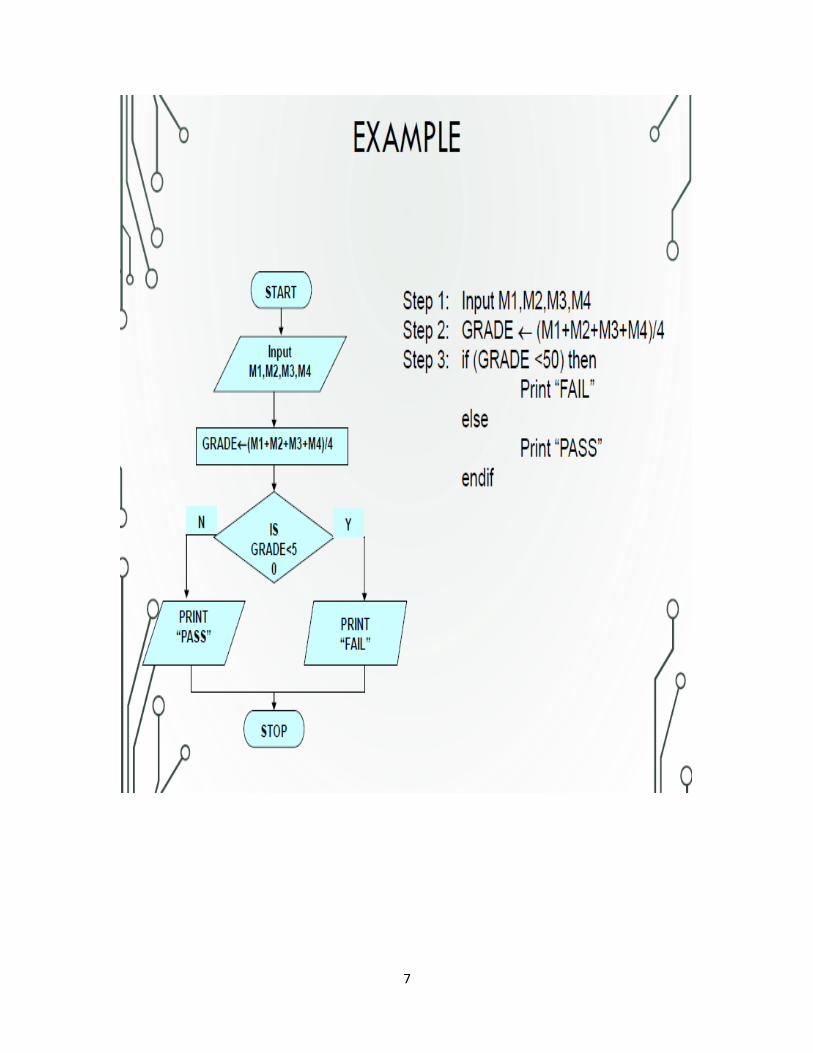
Example 1: Write an algorithm to determine a student’s final grade and
indicate whether it is passing or failing. The final grade is calculated as the
average of four marks.
Detailed Algorithm
•Step 1: Input M1,M2,M3,M4
Step 3: if (GRADE < 50) then
Print “FAIL”
else
Print “PASS”
Endif
4
Flowchart:
A graphical representation of the sequence of operations in an information
system or program. Information system flowcharts show how data flows
from source documents through the computer to final distribution to users.
Program flowcharts show the sequence of instructions in a single program or
subroutine. Different symbols are used to draw each type of flowchart.
A Flowchart
•shows logic of an algorithm
•emphasizes individual steps and their interconnections
•e.g. control flow from one action to the next
5
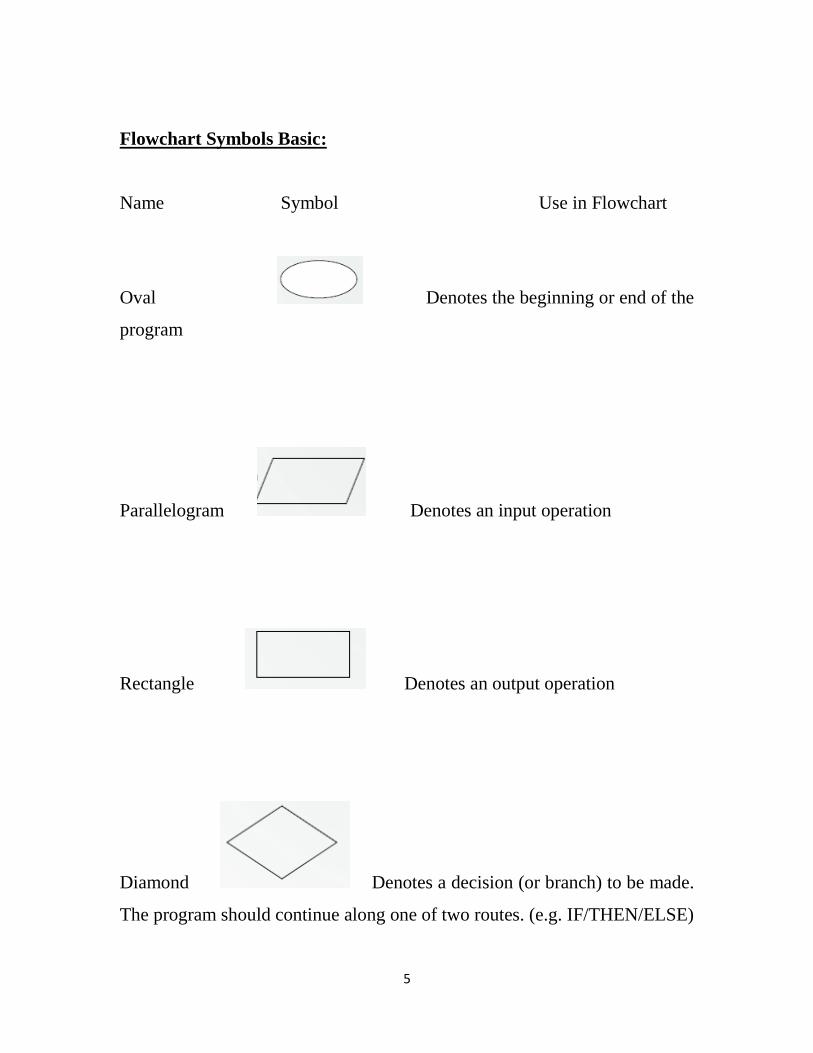
Flowchart Symbols Basic:
Name Symbol Use in Flowchart
Oval Denotes the beginning or end of the
program
Parallelogram Denotes an input operation
Rectangle Denotes an output operation
Diamond Denotes a decision (or branch) to be made.
The program should continue along one of two routes. (e.g. IF/THEN/ELSE)

6
Hybrid Denotes a process to be carried out e.g.
addition, subtraction, division etc. Flow line
Flow line Denotes the direction of logic flow in the
program
7

8
EXAMPLE
•Write an algorithm and draw a flowchart to convert the length in feet to
centimeter.
9
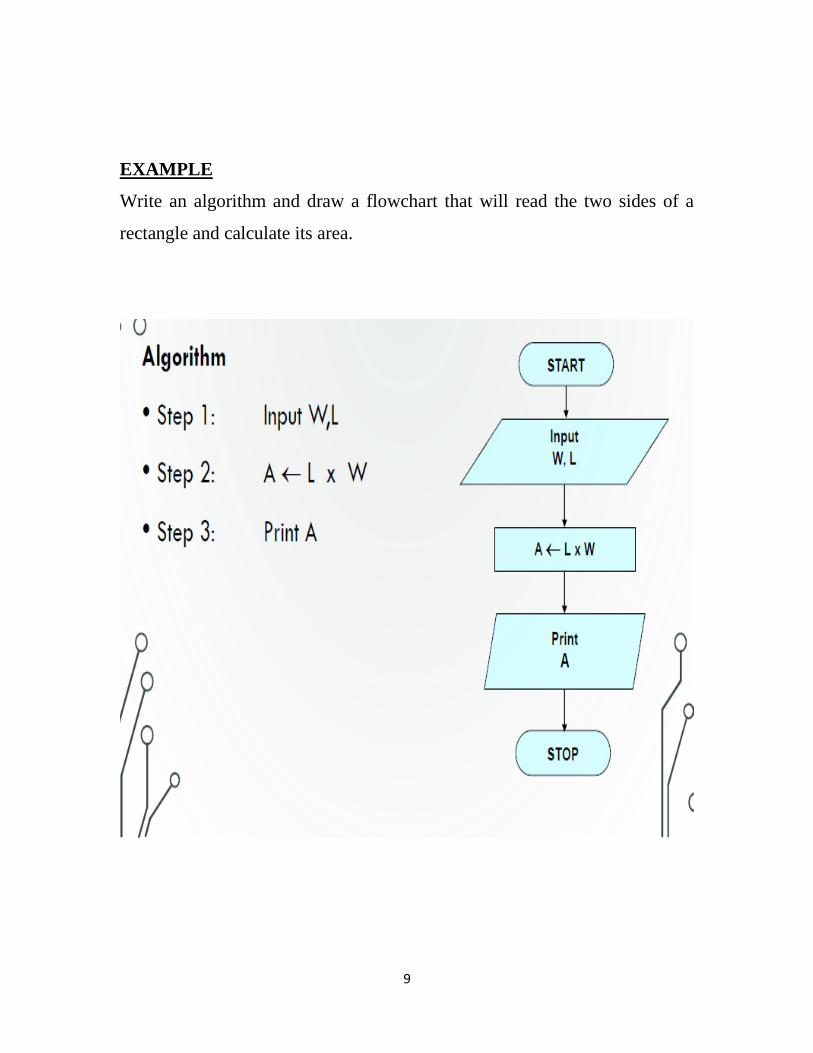
EXAMPLE
Write an algorithm and draw a flowchart that will read the two sides of a
rectangle and calculate its area.
10
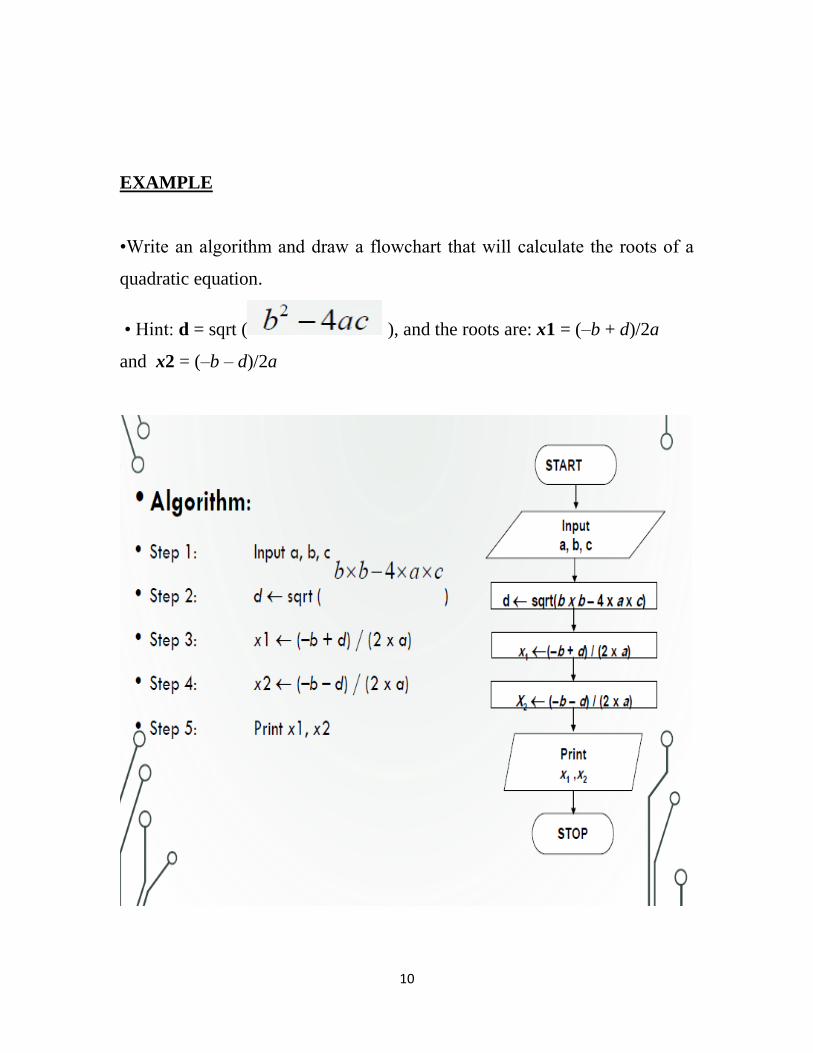
EXAMPLE
•Write an algorithm and draw a flowchart that will calculate the roots of a
quadratic equation.
• Hint: d = sqrt ( ), and the roots are: x1 = (–b + d)/2a
and x2 = (–b – d)/2a

11
DECISION STRUCTURES
•The expression A>B is a logical expression
•it describes a condition we want to test
•if A>B is true (if A is greater than B) we take the action on left
•print the value of A
•if A>B is false (if A is not greater than B) we take the action on right
•print the value of B
12
IF–THEN–ELSE STRUCTURE
•The structure is as follows
If condition then
true alternative
else
false alternative
endif
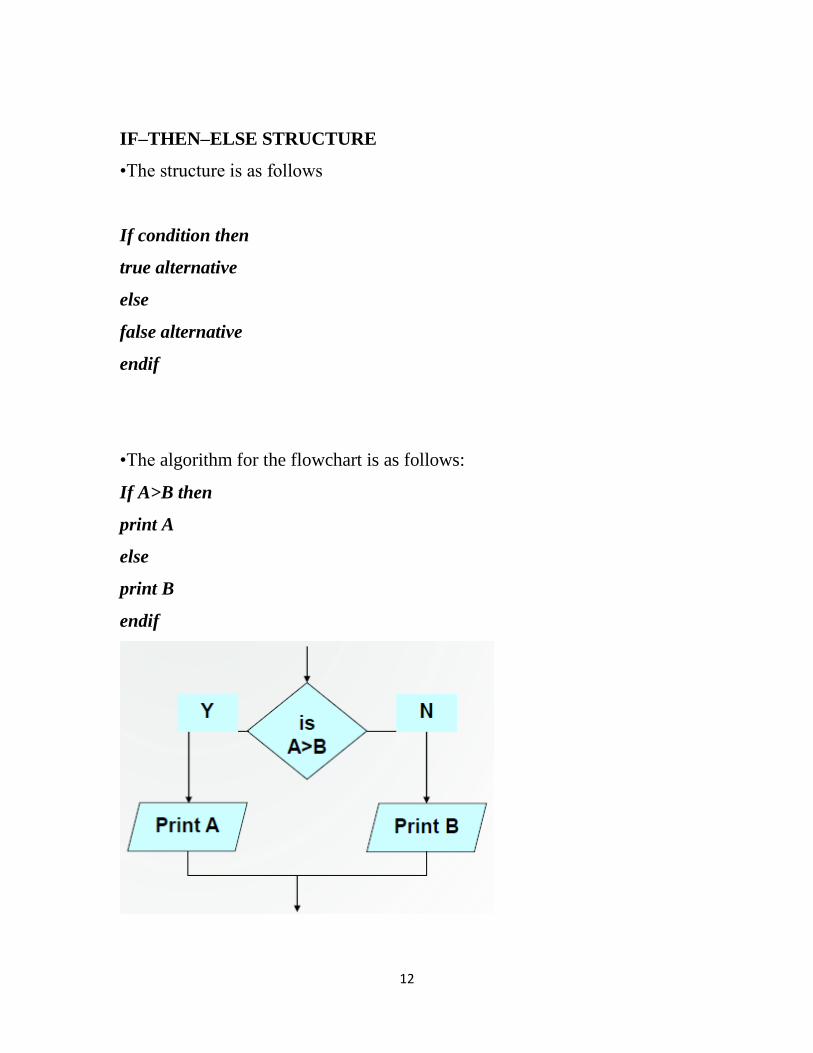
•The algorithm for the flowchart is as follows:
If A>B then
print A
else
print B
endif
13
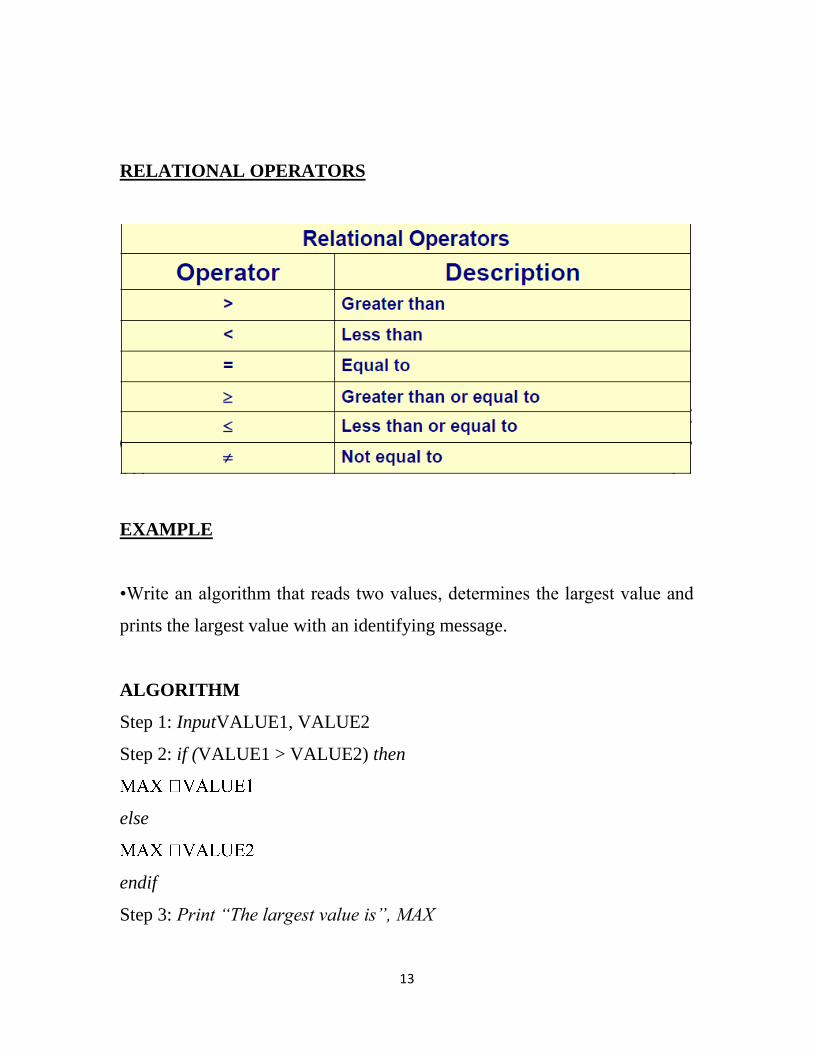
RELATIONAL OPERATORS
EXAMPLE
•Write an algorithm that reads two values, determines the largest value and
prints the largest value with an identifying message.
ALGORITHM
Step 1: InputVALUE1, VALUE2
Step 2: if (VALUE1 > VALUE2) then
else
endif
Step 3: Print “The largest value is”, MAX

14
15
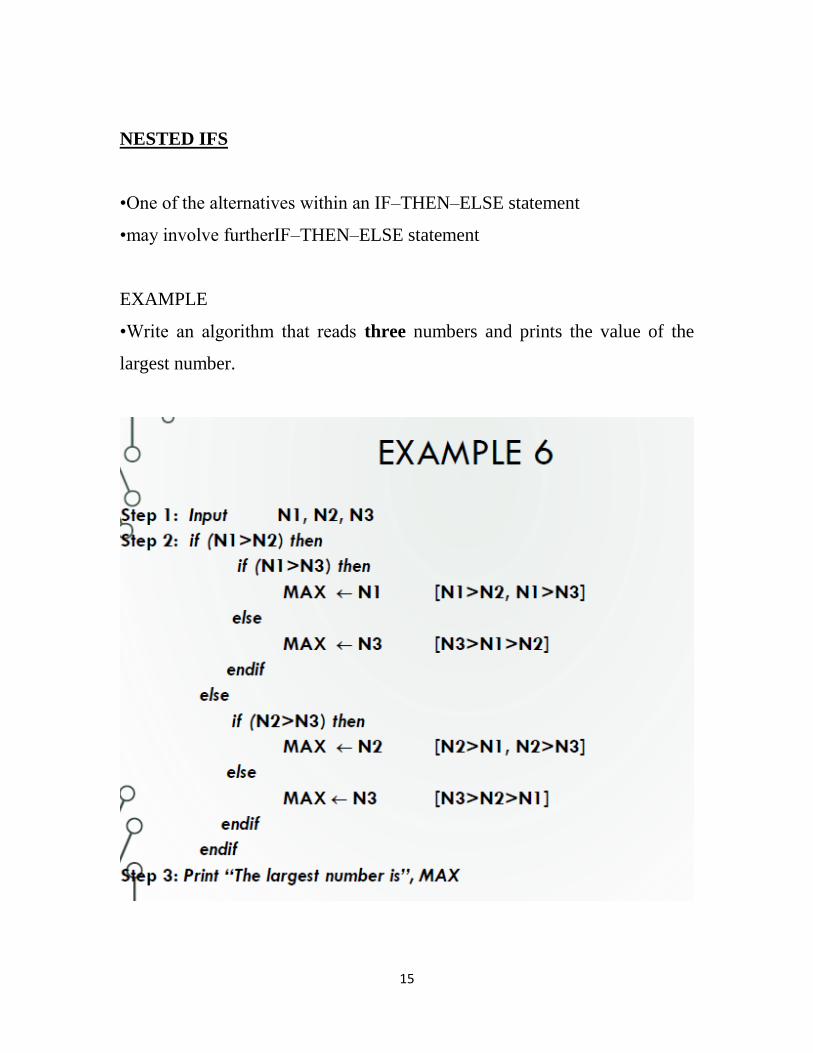
NESTED IFS
•One of the alternatives within an IF–THEN–ELSE statement
•may involve furtherIF–THEN–ELSE statement
EXAMPLE
•Write an algorithm that reads three numbers and prints the value of the
largest number.
16
Exercise:
•Flowchart: Draw the flowchart of the above Algorithm.
Now, if we take definition of algorithm as: “A sequence of activities to be
processed for getting desired output from a given input.” Then we can say
that:
1. Getting specified output is essential after algorithm is executed.
2. One will get output only if algorithm stops after finite time.
3. Activities in an algorithm to be clearly defined in other words for it to be
unambiguous.
Before writing an algorithm for a problem, one should find out what is/are
the inputs to the algorithm and what is/are expected output after running the
algorithm.
General Rules for flowcharting
1. All boxes of the flowchart are connected with Arrows. (Not lines)
2. Flowchart symbols have an entry point on the top of the symbol with no
other entry points. The exit point for all flowchart symbols is on the bottom
except for the Decision symbol.
3. The Decision symbol has two exit points; these can be on the sides or the
bottom and one side.
4. Generally a flowchart will flow from top to bottom. However, an upward
flow can be shown as long as it does not exceed 3 symbols.
5. Connectors are used to connect breaks in the flowchart. Examples are:
• From one page to another page.
17
• From the bottom of the page to the top of the same page.
• An upward flow of more then 3 symbols
6. Subroutines and Interrupt programs have their own and independent
flowcharts.
7. All flow charts start with a Terminal or Predefined Process (for interrupt
programs or subroutines) symbol.
8. All flowcharts end with a terminal or a contentious loop.
Advantages and Disadvantages of Flow Chart
Advantages
1. Communication: Flow Charts are better way of communicating the logic
of a system to all concerned.
2. Effective Analysis: With the help of flow chart, problem can be analyzed
in more effective way.
3. Proper Documentation: Program flow charts serve as a good program
documentation, which is needed for various purposes.
4. Efficient Coding: The flow charts act as a guide or blueprint during the
systems analysis and program development phase.
5. Proper Debugging: The flow chart helps in debugging process.
6. Efficient Program Maintenance: The maintenance of operating program
becomes easy with the help of flow chart. It helps the programmer to put
efforts more efficiently on that part.
Disadvantages
Complex logic: Sometimes, the program logic is quite complicated. In that
case, flow chart becomes complex and clumsy.

18
1. Alterations and Modifications: If alterations are required the flow chart
may require redrawing completely.
2. Reproduction: As the flow chart symbols cannot be typed, reproduction of
flow chart becomes a problem.
3. The essentials of what is done can easily be lost in the technical details of
how it is done.
H.W. Write an algorithm and draw a flow chart to calculate the factorial of a
number (N).
Verify your result by a trace table by assuming N = 5.
Hint: The factorial of N is the product of numbers from 1 to N.
H.W. Write an algorithm and draw a flowchart to calculate 24
. Verify your
result by a trace table.

19
H.W. Write down an algorithm and draw a flowchart to find and print the
largest of three numbers. Read numbers one by one. Verify your result by a
trace table. (Use 5, 7, 3 as the numbers read)
H.W. Write an algorithm and draw a flowchart to print the square of all
numbers from 1 to10.
H.W. Write an algorithm and draw a flowchart to print the SUM of numbers
from LOW to HIGH. Test with LOW=3 and HIGH=9.
H.W. Write an algorithm and draw a flowchart to print all numbers between
LOW and HIGH that are divisible by NUMBER.
H.W. Draw a flowchart for a program that reads 10 numbers from the user
and prints out their sum, and their product.

20
Example:
Find the biggest of 100 prices and reduce it by 10%

21
Example
Output the numbers x,y,z in ascending order.