process of the review - australian government … · web viewprisma flow diagram for risk factor...
TRANSCRIPT

Evidence evaluation report — Pre-eclampsia
16 May 2017
Prepared by Ampersand Health Science Writing for theAustralian Government Department of Health

1.
ContentsPROCESS OF THE REVIEW.............................................................................................4
Research questions......................................................................................................................4Search strategies.........................................................................................................................4
Prevalence............................................................................................................................4Risk factors...........................................................................................................................5Screening..............................................................................................................................8
Exclusion criteria........................................................................................................................10Assigning level of evidence........................................................................................................10Study design definitions.............................................................................................................10Selection of outcomes for GRADE analysis.................................................................................12
EVIDENCE TABLES......................................................................................................131. Prevalence and risk factors.................................................................................................13
1.1 Evidence summary......................................................................................................13Evidence statement............................................................................................................14Summary of findings...........................................................................................................15
Risk factors for preclampsia........................................................................................15Findings from systematic reviews or large studies regarding other risk factors.........16
Q1 What is the prevalence and incidence of pre-eclampsia, including population-specific groups.........................................................................................................................20Estimated prevalence and incidence of pre-eclampsia in cohort studies....................20Historical changes in prevalence.................................................................................21Women who are overweight or obese.........................................................................23Women aged 45 years or older...................................................................................25Women who have migrated from their country of birth..............................................26Women of refugee background...................................................................................27Women with serious mental health disorders.............................................................27Women by planned place of birth................................................................................29Women who conceive through assisted reproductive technology...............................30Women who experience vaginal bleeding in pregnancy.............................................31
Q2 What are the risk factors for developing pre-eclampsia?............................................32Blood group.................................................................................................................33Body mass index and adiposity...................................................................................33Cigarette smoking and exposure to environmental carbon monoxide........................35Physical activity...........................................................................................................36Mental health...............................................................................................................38Seasonality of birth......................................................................................................39Gynaecological and obstetric factors..........................................................................40Assisted reproductive technology...............................................................................44Cardiovascular factors.................................................................................................46Periodontal disease.....................................................................................................48Immunological factors.................................................................................................51Micronutrient levels.....................................................................................................52Shift work....................................................................................................................56
1.2 Excluded studies for prevalence..................................................................................571.3 Excluded studies for risk factors..................................................................................57
2 Screening............................................................................................................................622.1 Evidence summary......................................................................................................62
2

1.
Summary of effects of abnormal levels of individual biochemical markers in the first trimester on risk of pre-eclampsia...............................................................................65Summary of diagnostic accuracy of algorithms/models in the first trimester.............68Summary of diagnostic accuracy of algorithms/models in the second trimester........73
Q3 What is the predictive and diagnostic test accuracy of screening for pre-eclampsia? 76Individual biochemical markers in the first trimester..................................................76Algorithms/models in the first trimester......................................................................85Individual markers in the second trimester...............................................................101Algorithms/models in the second trimester...............................................................108Individual biochemical markers in the third trimester...............................................114Algorithms/models in the third trimester...................................................................116Sequential testing/screening.....................................................................................122Costs associated with screening, diagnosis and treatment for pre-eclampsia..........126
Q4 What are the harms of not screening for pre-eclampsia?..........................................126Q5 What are the maternal and/or fetal benefits of screening for pre-eclampsia?..........127Q6 When in pregnancy should screening be carried out?...............................................128Q7 What are the benefits and risks of the predictive tests (eg PAPP-A) to identify women
at risk of pre-eclampsia?...........................................................................................128Q8 Should every woman be tested for proteinuria at every antenatal visit if blood
pressure remains normal?.........................................................................................1282.2 Excluded studies for screening..................................................................................128
Background papers...................................................................................................128Other exclusions........................................................................................................129
3 Women at risk...................................................................................................................1373.1 Evidence summary....................................................................................................137Q9 What advice should women who are at risk of developing pre-eclampsia receive?..138
4 What are additional considerations for Aboriginal and Torres Strait Islander women?.....139Evidence summary...........................................................................................................139
BIBLIOGRAPHY.........................................................................................................140
3

2.
PROCESS OF THE REVIEW
Research questions
Prevalence and risk factors1 What is the prevalence and incidence of pre-eclampsia, including population specific groups?2 What are the risk factors for developing pre-eclampsia?Screening3 What is the predictive and diagnostic test accuracy of screening for pre-eclampsia?4 What are the harms of not screening for pre-eclampsia?5 What are the maternal and/or fetal benefits of screening for pre-eclampsia?6 When in pregnancy should screening be carried out?7 What are the benefits and risks of the predictive tests (eg PAPP-A) to identify women at risk of
pre-eclampsia?8 Should every woman be tested for proteinuria at every antenatal visit if blood pressure remains
normal?Women at risk9 What advice should women who are at risk of developing pre-eclampsia receive?Additional considerations10 What are the additional considerations for Aboriginal and Torres Strait Islander women?Search strategies
PrevalenceDatabases searched:• EMBASE (OVID) and MEDLINE (OVID) = 122• CINAHL = 14• AUSTRALIAN INDIGENOUS HEALTHINFONET = 0Date of searches: 05/12/2016Dates searched: 2012 to presentSearch strategyMEDLINE AND EMBASE (OVID)
1. exp Pre-Eclampsia/2. (pre-eclamp* or (pre adj eclamp*) or preeclamp*).mp.3. exp Prevalence/ or exp Incidence/ or exp Epidemiology/4. (prevalence or incidence or epidemiol*).mp.5. exp Australia/6. (Australia* or (New adj South adj Wales) or Victoria* or Queensland* or Tasmania* or
(Northern adj Territory)).mp.7. 1 or 28. 3 or 49. 5 or 610. 7 and 8 and 911. Remove duplicates from 1012. Limit 11 to 2012-Current
CINAHL1. (MH “Pre-eclampsia+”)2. (pre-eclamp* or (“pre eclamp*”) or preeclamp*)3. S1 or S24. (MH “Prevalence+”) or (MH “Incidence+”) or (MH “Epidemiology+”)5. (prevalence or incidence or epidemiol*)
4

2.
6. S4 or S57. (MH “Australia+”)8. (Australia* or (“New South Wales”) or Victoria* or Queensland* or Tasmania* or (“Northern
Territory”))9. S7 or S810. S3 and S6 and S911. 2012 to current
AUSTRALIAN INDIGENOUS HEALTHINFONET Title: pre-eclampsia OR preeclampsia OR pre eclampsia2012 to current
PRISMA flow diagram for prevalence studiesRisk factorsDatabases searched:• EMBASE (OVID) and MEDLINE (OVID) = 258• COCHRANE = 17• CINAHL = 33• AUSTRALIAN INDIGENOUS HEALTHINFONET = 0Date of searches: 22/12/2016Dates searched: 2012 to present
5

2.
Search strategyMEDLINE AND EMBASE (OVID)
1. Meta-Analysis as Topic/2. meta analy$.tw.3. metaanaly$.tw.4. Meta-Analysis/5. (systematic adj (review$1 or overview$1)).tw.6. exp Review Literature as Topic/7. or/1-68. cochrane.ab.9. embase.ab.10. (psychlit or psyclit).ab.11. (psychinfo or psycinfo).ab.12. (cinahl or cinhal).ab.13. science citation index.ab.14. bids.ab.15. cancerlit.ab.16. or/8-1517. reference list$.ab.18. bibliograph$.ab.19. hand-search$.ab.20. relevant journals.ab.21. manual search$.ab.22. or/17-2123. selection criteria.ab.24. data extraction.ab.25. 23 or 2426. Review/27. 25 and 2628. Comment/29. Letter/30. Editorial/31. animal/32. human/33. 31 not (31 and 32)34. or/28-30,3335. 7 or 16 or 22 or 2736. 35 not 3437. (pre-eclamp$ or (pre adj eclamp$) or preeclamp$).ti.38. Exp Causality/ or exp Risk Factors/ or exp Etiology/39. (risk$ or causa$ or etiolog$ or aetiolog$ or predict$).tw.40. 38 or 3941. 36 and 37 and 4042. Remove duplicates from 4143. Limit 42 to 2012-Current
COCHRANE1. MeSH descriptor: [Causality] explode all trees 2. MeSH descriptor: [Risk Factors] explode all trees 3. (risk$ or causa$ or etiolog$ or aetiolog$ or predict$):ti,ab,kw4. (pre-eclamp* or (pre adj eclamp*) or preeclamp*):ti5. #1 or #2 or #36. #1 and #47. 2012 to current
CINAHL1. TI (pre-eclamp* or (“pre eclamp*”) or preeclamp*)2. (MH “Causality+”) or (MH “Risk Factors+”)3. (risk* or causa* or etiolog* or aetiolog* or predict*)4. S2 OR S35. S1 AND S46. ( (TI (systematic* n3 review*)) or (AB (systematic* n3 review*)) or (TI (systematic* n3
bibliographic*)) or (AB (systematic* n3 bibliographic*)) or (TI (systematic* n3 literature)) or (AB (systematic* n3 literature)) or (TI (comprehensive* n3 literature)) or (AB (comprehensive* n3 literature)) or (TI (comprehensive* n3 bibliographic*)) or (AB
6

2.
(comprehensive* n3 bibliographic*)) or (TI (integrative n3 review)) or (AB (integrative n3 review)) or (JN “Cochrane Database of Systematic Reviews”) or (TI (information n2 synthesis)) or (TI (data n2 synthesis)) or (AB (information n2 synthesis)) or (AB (data n2 synthesis)) or (TI (data n2 extract*)) or (AB (data n2 extract*)) or (TI (medline or pubmed or psyclit or cinahl or (psycinfo not “psycinfo database”) or “web of science” or scopus or embase)) or (AB (medline or pubmed or psyclit or cinahl or (psycinfo not “psycinfo database”) or “web of science” or scopus or embase)) or (MH “Systematic Review”) or (MH “Meta Analysis”) or (TI (meta-analy* or metaanaly*)) or (AB (meta-analy* or metaanaly*)) )
7. S5 AND S6 (Limiters - Published Date: 20120101-20161231)AUSTRALIAN INDIGENOUS HEALTHINFONET Title: pre-eclampsia OR preeclampsia OR pre eclampsia2012 to current
PRISMA flow diagram for risk factor studies
ScreeningDatabases searched:EMBASE (OVID) and MEDLINE (OVID) = 599COCHRANE = 25CINAHL = 47AUSTRALIAN INDIGENOUS HEALTHINFONET = 0
7

2.
Date of searches: 05/12/2016Dates searched: 2012 to presentSearch strategyMEDLINE AND EMBASE (OVID)
1. (pre-eclamp* or (pre adj eclamp*) or preeclamp*).ti.2. (screen$ or (predictive adj test$)).mp.3. exp Maternal Serum Screening Tests/4. exp Mass Screening/5. 2 or 3 or 46. 1 and 57. limit 6 to yr="2012 –Current”8. remove duplicates from 7
COCHRANE1. (pre-eclamp* or (pre adj eclamp*) or preeclamp*):ti2. (screen* or (predictive adj test*)):ti,ab,kw3. MeSH descriptor: [Maternal Serum Screening Tests] explode all trees 4. MeSH descriptor: [Mass Screening] explode all trees 5. #2 or #3 or #46. #1 and #57. 2012 to current
CINAHL1. (pre-eclamp* or (pre adj eclamp*) or preeclamp*):ti2. (screen* or (predictive adj test*))3. (MH “Maternal Serum Screening Tests+”) 4. (MH “Mass Screening+”) 5. S2 or S3 or S46. S1 and S57. 2012 to current
AUSTRALIAN INDIGENOUS HEALTHINFONET Title: pre-eclampsia OR preeclampsia OR pre eclampsia2012 to current
8

2.
PRISMA flow diagram for screening studies
9

2.
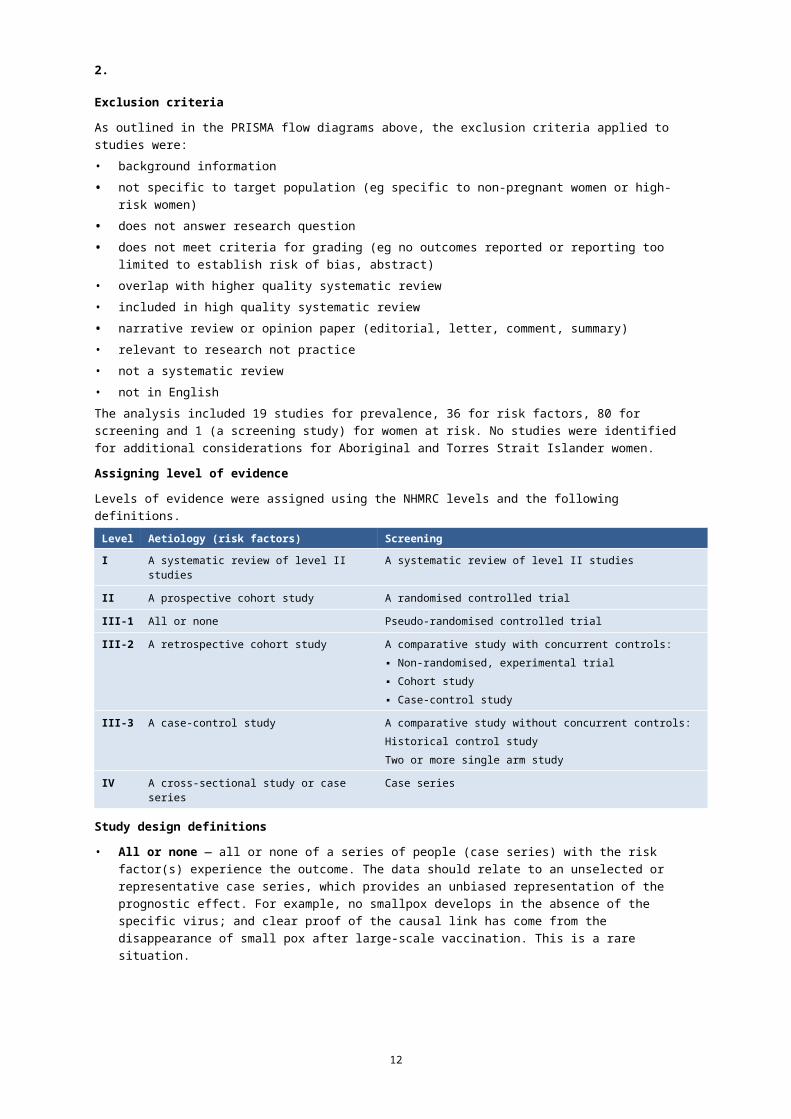
Exclusion criteria
As outlined in the PRISMA flow diagrams above, the exclusion criteria applied to studies were:• background information• not specific to target population (eg specific to non-pregnant women or high-risk women)• does not answer research question• does not meet criteria for grading (eg no outcomes reported or reporting too limited to
establish risk of bias, abstract)• overlap with higher quality systematic review• included in high quality systematic review• narrative review or opinion paper (editorial, letter, comment, summary)• relevant to research not practice• not a systematic review• not in EnglishThe analysis included 19 studies for prevalence, 36 for risk factors, 80 for screening and 1 (a screening study) for women at risk. No studies were identified for additional considerations for Aboriginal and Torres Strait Islander women.Assigning level of evidence
Levels of evidence were assigned using the NHMRC levels and the following definitions.Level Aetiology (risk factors) ScreeningI A systematic review of level II studies A systematic review of level II studiesII A prospective cohort study A randomised controlled trialIII-1 All or none Pseudo-randomised controlled trialIII-2 A retrospective cohort study A comparative study with concurrent controls:
▪ Non-randomised, experimental trial▪ Cohort study▪ Case-control study
III-3 A case-control study A comparative study without concurrent controls:Historical control studyTwo or more single arm study
IV A cross-sectional study or case series Case series
Study design definitions
• All or none — all or none of a series of people (case series) with the risk factor(s) experience the outcome. The data should relate to an unselected or representative case series, which provides an unbiased representation of the prognostic effect. For example, no smallpox develops in the absence of the specific virus; and clear proof of the causal link has come from the disappearance of small pox after large-scale vaccination. This is a rare situation.
• Case series — a single group of people exposed to the intervention (factor under study). Post-test – only outcomes after the intervention (factor under study) are recorded in the series of people, so no comparisons can be made. Pre-test/post-test – measures on an outcome are taken before and after the intervention is introduced to a series of people and are then compared (also known as a ‘before- and-after study’).
• Case-control study — people with the outcome or disease (cases) and an appropriate group of controls without the outcome or disease (controls) are selected and information obtained about their previous exposure/non-exposure to the intervention or factor under study.
10

2.
• Cross-sectional study — a group of people are assessed at a particular point (or cross-section) in time and the data collected on outcomes relate to that point in time ie proportion of people with asthma in October 2004. This type of study is useful for hypothesis-generation, to identify whether a risk factor is associated with a certain type of outcome, but more often than not (except when the exposure and outcome are stable eg genetic mutation and certain clinical symptoms) the causal link cannot be proven unless a time dimension is included.
• Historical control study – outcomes for a prospectively collected group of people exposed to the intervention (factor under study) are compared with either (1) the outcomes of people treated at the same institution prior to the introduction of the intervention (ie. control group/usual care), or (2) the outcomes of a previously published series of people undergoing the alternate or control intervention.
• Non-randomised, experimental trial - the unit of experimentation (eg. people, a cluster of people) is allocated to either an intervention group or a control group, using a non-random method (such as patient or clinician preference/availability) and the outcomes from each group are compared. This can include:— a controlled before-and-after study, where outcome measurements are taken before
and after the intervention is introduced, and compared at the same time point to outcome measures in the (control) group.
— an adjusted indirect comparison, where two randomised controlled trials compare different interventions to the same comparator ie. the placebo or control condition. The outcomes from the two interventions are then compared indirectly.
• Prospective cohort study — where groups of people (cohorts) are observed at a point in time to be exposed or not exposed to an intervention (or the factor under study) and then are followed prospectively with further outcomes recorded as they happen.
• Pseudo-randomised controlled trial - the unit of experimentation (eg. people, a cluster of people) is allocated to either an intervention (the factor under study) group or a control group, using a pseudo-random method (such as alternate allocation, allocation by days of the week or odd-even study numbers) and the outcomes from each group are compared.
• Randomised controlled trial — the unit of experimentation (eg. people, or a cluster of people4) is allocated to either an intervention (the factor under study) group or a control group, using a random mechanism (such as a coin toss, random number table, computer-generated random numbers) and the outcomes from each group are compared.
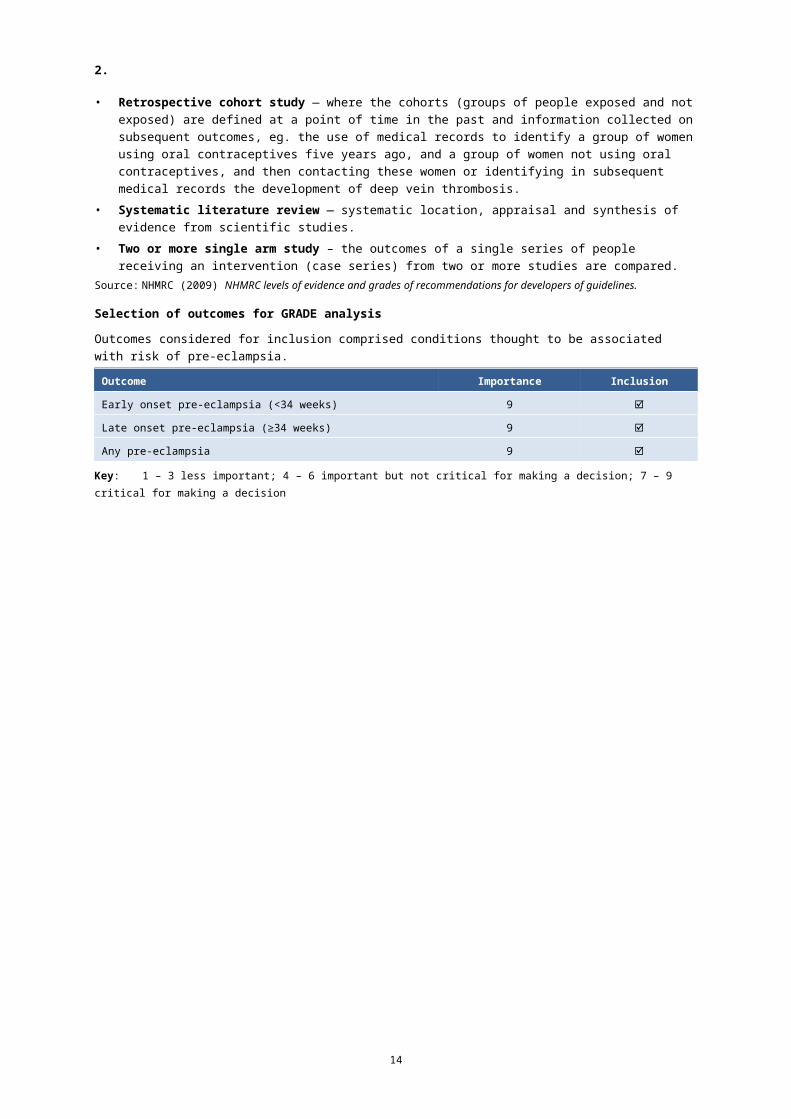
• Retrospective cohort study — where the cohorts (groups of people exposed and not exposed) are defined at a point of time in the past and information collected on subsequent outcomes, eg. the use of medical records to identify a group of women using oral contraceptives five years ago, and a group of women not using oral contraceptives, and then contacting these women or identifying in subsequent medical records the development of deep vein thrombosis.
• Systematic literature review — systematic location, appraisal and synthesis of evidence from scientific studies.
• Two or more single arm study – the outcomes of a single series of people receiving an intervention (case series) from two or more studies are compared.
Source: NHMRC (2009) NHMRC levels of evidence and grades of recommendations for developers of guidelines.
11
2.
Selection of outcomes for GRADE analysis
Outcomes considered for inclusion comprised conditions thought to be associated with risk of pre-eclampsia. Outcome Importance Inclusion
Early onset pre-eclampsia (<34 weeks) 9
Late onset pre-eclampsia (≥34 weeks) 9
Any pre-eclampsia 9
Key: 1 – 3 less important; 4 – 6 important but not critical for making a decision; 7 – 9 critical for making a decision
12

3.
Evidence tables1. Prevalence and risk factors
1.1 Evidence summaryResults of previous reviewThe same questions on prevalence and risk factors were asked in the literature review conducted to inform Module II of the guidelines (Australian Health Ministers' Advisory Council 2014). Identified studies informed the narrative.Results of the current reviewPrevalence and incidence, including population specific groupsAustralian studies in a range of settings estimated the incidence of any pre-eclampsia as 3.0–3.3% (Thornton et al 2013; Thornton et al 2016), early onset pre-eclampsia as 0.4% (Park et al 2013; Park et al 2015) and late-onset pre-eclampsia as 2.4% (Park et al 2013). Studies were consistent in noting a decrease in prevalence and incidence of pre-eclampsia in Western Australia (Hammond et al 2013; Diouf et al 2016) and New South Wales (Thornton et al 2013; Roberts et al 2015).The prevalence of pre-eclampsia among specific population groups was influenced by:• mental health — a diagnosis of schizophrenia or bipolar disorder conferred a five-fold increased
likelihood of having pre-eclampsia (OR 5.28; 95%CI 2.79 to 9.98; p<001) (Judd et al 2014) in one study and a three-fold increase in another (9% v 3%; P < 0.0001) (Nguyen et al 2012)
• body mass index — prevalence was increased among women with BMI >25 (OR 1.97; 95%CI 0.93 to 4.16) (Vanderlelie et al 2016), BMI >30 (OR 2.86; 95%CI 2.54 to 3.22; p=0.001) (Davies-Tuck et al 2016), BMI 30–34.9 (OR 2.01; 95%CI 1.48 to 2.73; p<0.001), BMI 35–39.9 (OR 2.41; 95%CI1.68 to 3.47; p<0.001), BMI 40–44.9 (OR 3.32; 95%CI 2.18 to 5.08; p<0.001), BMI 45 (OR 3.98; 95%CI 2.56 to 6.19; p<0.001) (Magann et al 2013) or BMI >50 (aOR 3.43; 95%CI 1.72 to 6.84) (Sullivan et al 2015)
• country of birth — compared with women born in Australia prevalence of pre-eclampsia was lower among women born in Western Europe (OR 0.91; 95%CI 0.85 to 0.97), Eastern Europe (OR 0.79; 95%CI 0.67 to 0.94), South Asia (OR 0.58; 95%CI 0.55 to 0.62), East-Southeast Asia (OR 0.64; 95%CI 0.58 to 0.71), North Africa and Middle East (OR 0.69; 95%CI 0.63 to 0.77) and Sub-Saharan Africa (OR 0.95; 95%CI 0.85 to 1.07) and similar among women born in Latin America and Caribbean (OR1.06; 95%CI 0.90 to 1.26) (Urquia et al 2014).
Prevalence did not appear to be influenced by:• maternal age > 45 years — there was no significant difference in prevalence between women aged
>45 years and <45 years (OR 1.86; 95% 0.9 to 3.6; p=0.052) (Carolan et al 2013)• refugee background — there was no statistical difference in prevalence between refugee background
and migration for non-humanitarian reasons among women from North Africa (age-adjusted OR 1.4 ;
95%CI 0.4 to 4.6; p=0.79), Middle and East Africa (crude OR 1.1; 95%CI 0.2 to 4.9; p=0.71) and West Africa (4.9% vs 0%) (Gibson-Helm et al 2014)
• conception by assisted reproductive technology — after stratification by plurality, the difference in gestational hypertension/pre-eclampsia rates between ART and non-ART mothers was not statistically significant, with AOR 1.05 (95% CI, 0.98-1.12) for mothers of singletons (Wang et al 2016)
• vaginal bleeding in pregnancy — prevalence of pre-eclampsia was not associated with the presence or absence of bleeding (aOR 0.96; 95% CI 0.67 to 1.38) (Smits et al 2012).
Risk factors for developing pre-eclampsiaFactors with an established association with a high risk of pre-eclampsia include (Bartsch et al 2016): • a history of pre-eclampsia (RR 8.4, 95%CI 7.1 to 9.9)• chronic hypertension (RR 5.1, 95%CI 4.0 to 6.5)• pre-existing diabetes (RR 3.7; 95%CI 3.1 to 4.3)• autoimmune disease such as systemic lupus erythematosus (RR 2.5; 95%CI 1.00 to 6.3) or
antiphospholipid syndrome (RR 2.8; 95%CI 1.8 to 4.3)
13
3.
• pre-existing kidney disease (RR 1.8; 95%CI 1.5 to 2.1).Findings from systematic reviews provided information on the association between additional factors and risk of pre-eclampsia (see table below):• cardiovascular factors — women with pre-eclampsia had higher levels of total cholesterol, non-HDL-C
and triglycerides throughout pregnancy (Gallos et al 2013; Spracklen et al 2014), lower levels of HDL-C in the third trimester (Spracklen et al 2014) and were more likely to have arterial stiffness (Hausvater et al 2012) than women without pre-eclampsia
• body mass index — there was a clear association between increasing BMI and risk of pre-eclampsia (Wang et al 2013; Poorolajal & Jenabi 2016)
• mental health — there were significant associations between mental stress, work stress and anxiety or depression and pre-eclampsia (Zhang et al 2013; Hu et al 2015)
• blood group — AB versus non AB blood group increased risk in women overall and in primigravid women (Alpoim et al 2013)
• assisted reproductive technology — in contrast to the findings on prevalence above, systematic reviews suggested that risk was increased in women receiving donor oocytes (Blazquez et al 2016; Masoudian et al 2016) or donor sperm (Gonzalez-Comadran et al 2014)
• immunological factors — IFN-gamma levels were significantly higher in women with pre-eclampsia than in controls (Yang et al 2014)
• micronutrient levels — levels of vitamin C and E were lower in women with pre-eclampsia than in controls but not when levels in mild and severe subtypes were analysed (Cohen et al 2015); risk was increased among women with vitamin D level <50 nmol/L (Hypponen et al 2013); and levels of copper were higher (Fan et al 2016) and levels of zinc (Ma et al 2015) and selenium (Xu et al 2016) lower among women with pre-eclampsia than among controls.
• gynaecological and obstetric factors — there was no significant association between risk of pre-eclampsia and fetal sex (Jaskolka et al 2016) or interpregnancy interval (Cormick et al 2016) but a higher risk following chorionic villus sampling compared to amniocentesis (Basaran et al 2016)
• periodontal disease — while reviews of observational studies showed an effect on risk (Sgolastra et al 2013; Wei et al 2013; Huang et al 2014), a review of RCTs found no significant effect (Kunnen et al 2010).
Smoking (Wei et al 2015) and exposure to environmental carbon monoxide (Zhai et al 2012) were found to have a protective effect and there was a trend towards physical activity having a protective effect in RCTs (Kasawara et al 2012) and case-control (Kasawara et al 2012; Aune et al 2014) but not in cohort studies (Kasawara et al 2012)There was insufficient evidence to assess the relationship between pre-eclampsia and shift work (Palmer et al 2013).Evidence statement• Women with a history of pre-eclampsia, chronic hypertension, pre-existing diabetes, chronic kidney
disease or autoimmune disease (systemic lupus erythematosus, antiphospholipid syndrome) have an increased risk of pre-eclampsia in the current pregnancy (low quality evidence).
RecommendationRoutinely assess a woman’s risk for pre-eclampsia in early pregnancy.
Consensus-based recommendationsRoutinely measure blood pressure to identify new onset hypertension.Recommend testing for proteinuria at each antenatal visit if a woman has risk factors for, or clinical indications of, pre-eclampsia, in particular raised blood pressure.
14
3.
Summary of findings
Risk factors for preclampsia
Patient or population: Pregnant women
Setting: Europe, North America
Subject: Women with risk factors
Comparison: Women without risk factors
Outcomes Relative effect(95% CI)
№ of participants (studies)
Quality of the evidence(GRADE)
Comments
History of pre-eclampsia RR 8.4
(7.1 to 9.9)
3,720,885
(20 observational studies)
⨁⨁◯◯LOW
Unable to calculate
absolute effects as data
are not available
Chronic hypertension RR 5.1
(4.0 to 6.5)
6,589,661
(20 observational studies)
⨁⨁◯◯LOW
Pre-existing diabetes RR 3.7
(3.1 to 4.3)
2,553,117
(19 observational studies)
⨁⨁◯◯LOW
Chronic kidney disease RR 1.8
(1.5 to 2.1)
966,505
(5 observational studies)
⨁⨁◯◯LOW
SLE RR 2.5
(1.0 to 6.3)
2,413,908
(2 observational studies)
⨁⨁◯◯LOW
APL RR 2.8
(1.8 to 4.3)
220,156
(3 observational studies)
⨁⨁◯◯LOW
*The risk in the intervention group (and its 95% confidence interval) is based on the assumed risk in the comparison group and the relative effect of the
intervention (and its 95% CI).
CI: Confidence interval; RR: Risk ratio
GRADE Working Group grades of evidenceHigh quality: We are very confident that the true effect lies close to that of the estimate of the effect
Moderate quality: We are moderately confident in the effect estimate: The true effect is likely to be close to the estimate of the effect, but there is a
possibility that it is substantially different
Low quality: Our confidence in the effect estimate is limited: The true effect may be substantially different from the estimate of the effect
Very low quality: We have very little confidence in the effect estimate: The true effect is likely to be substantially different from the estimate of effect
Source: Adapted from (Bartsch et al 2016).
15

4.
Findings from systematic reviews or large studies regarding other risk factors
Risk factor Effect (95%CI) Reference
AB vs non-Ab blood group overall OR 2.42 (1.63 to 3.58) (Alpoim et al 2013)
AB vs non-Ab blood group in primigravid women OR 2.44 (1.46 to 4.07) (Alpoim et al 2013)
Lifestyle factors
Overweight OR 1.73 (1.59 to 1.87) (Poorolajal & Jenabi 2016)
aRR 1.70 (1.60 to 1.81, P<0.001) (Wang et al 2013)
Obesity OR 3.15 (2.96 to 3.35) (Poorolajal & Jenabi 2016)
aRR 2.93 (2.58 to 3.33, P<0.001) (Wang et al 2013)
Severe obesity aRR 4.14 (3.61 to 4.75, P<0.001) (Wang et al 2013)
Smoking during pregnancy vs not smoking RR 0.67 (0.60 to 0.75) (Wei et al 2015)
Exposure to environmental CO (0.29–0.60 vs 0.01–0.16 ppm) aOR 0.63 (0.55 to 0.71) (Zhai et al 2012)
High vs low physical activity RR 0.65 (0.47 to 0.89) (Aune et al 2014)
Physical activity (meta-analysis of case control studies) OR 0.77 (0.64 to 0.91, p < 0.01) (Kasawara et al 2012)
Physical activity (meta-analysis of cohort studies) OR 0.99 (0.93 to 1.05, p= 0.81) (Kasawara et al 2012)
Protective effect of physical activity (stretching vs walking) (meta-analysis of RCT) OR 6.34 (0.72 to 55.37, p= 0.09) (Kasawara et al 2012)
Mental stress OR 1.49(1.27 to 1.74; P<0.001) (Zhang et al 2013)
Work stress OR 1.50 (1.15 to 1.97; P=0.003) (Zhang et al 2013)
Anxiety or depression OR 1.88 (1.08 to 3.25; P=0.02) (Zhang et al 2013)
Antenatal depression OR 1.63 (1.32 to 2.02) (Hu et al 2015)
Gynaecological and obstetric factors
Previous intrauterine device use RR 0.74 (0.61 to 0.90) (Li et al 2016a)
Male vs female fetal sex RR 1.01 (0.97 to 1.05) (Jaskolka et al 2016)
Chorionic villus sampling vs no invasive procedure OR 0.83 (0.42 to 1.67) (Basaran et al 2016)
16

4.
Risk factor Effect (95%CI) Reference
Chorionic villus sampling vs no invasive procedure or amniocentesis OR 1.00 (0.46 to 2.18) (Basaran et al 2016)
Chorionic villus sampling vs amniocentesis OR 2.47 (1.14 to 5.33) (Basaran et al 2016)
Interpregnancy interval 2–4 years vs <2 years aOR 1.01 (0.95 to 1.07) (Cormick et al 2016)
Interpregnancy interval 2–4 years vs >2 years aOR 1.10 (1.02 to 1.19) (Cormick et al 2016)
Assisted reproductive technology
Oocyte donation vs other ART OR 2.54 (1.98 to 3.24; P<0.0001) (Masoudian et al 2016)
Oocyte donation vs natural conception OR 4.34 (3.10 to 6.06; P<0.0001) (Masoudian et al 2016)
Oocyte donation vs IVF with autologous oocytes Weighted OR 2.9 (2.19 to 3.85) (Blazquez et al 2016)
Donor sperm vs partner sperm OR 1.63 (1.36 to 1.95) (Gonzalez-Comadran et al 2014)
Cardiovascular factors
Total cholesterol in women with any pre-eclampsia vs controls (1st/2nd trimester) WMD 12.49 mg/dL (3.44 to 21.54; p=0.007) (Spracklen et al 2014)
Total cholesterol in women with any pre-eclampsia vs controls (3rd trimester) WMD 20.20 mg/dL (8.70 to 31.70; p=0.001) (Spracklen et al 2014)
HDL-C in women with any pre-eclampsia vs controls (3rd trimester) WMD –8.86 mg/dL (–11.50 to –6.21; p<0.0001) (Spracklen et al 2014)
Non-HDL-C in women with any pre-eclampsia vs controls (1st/2nd trimesters) WMD 11.57 mg/dL (3.47 to 19.67; p<0.0001) (Spracklen et al 2014)
Non-HDL-C in women with any pre-eclampsia vs controls (3rd trimesters) WMD 29.59 mg/dL (12.13 to 47.06; p=0.001) (Spracklen et al 2014)
Triglycerides in women with any pre-eclampsia vs controls (1st trimester) (cohort studies)
WMD 4.32 mg/dL (2.34 to 6.13; P<0.0001) (Gallos et al 2013)
Triglycerides in women with any pre-eclampsia vs controls (2nd/3rd trimester, postpartum or not reported) (case control studies)
WMD 14.05 mg/dL (10.81 to 17.30, P<0.00001)
(Gallos et al 2013)
Triglycerides in women with any pre-eclampsia vs controls (1st/2nd trimesters) WMD 25.08 (14.39 to 35.77; p<0.0001) (Spracklen et al 2014)
Triglycerides in women with any pre-eclampsia vs controls (3rd trimester) WMD 80.29 mg/dL (51.45 to 109.13; p<0.0001)
(Spracklen et al 2014)
Arterial stiffness in women with pre-eclampsia vs normotensive controls SMD 1.62 (0.73 to 2.50) (Hausvater et al 2012)
17

4.
Risk factor Effect (95%CI) Reference
Periodontal disease
Pre-eclampsia in women with periodontal disease vs controls (observational studies) OR 2.79 (2.01 to 3.01, P<0.0001) (Wei et al 2013)
OR 2.17 (1.38 to 3.41, P 0.0008) (Sgolastra et al 2013)
OR 3.69 (2.58 to 5.27) (Huang et al 2014)
Pre-eclampsia in women with periodontal disease vs controls (RCTs) OR 1.00 (0.78 to 1.28) (Kunnen et al 2010)
Immunological factors
IFN-gamma in women with pre-eclamsia vs normotensive pregnant women SMD 0.93 (0.07 to 1.79) (Yang et al 2014)
Micronutrient levels
Vitamin E level in women with any pre-eclampsia vs control SMD –0.42 (–0.72 to –0.13) (Cohen et al 2015)
Vitamin E level in women with mild pre-eclampsia vs controls SMD 0.08 (–0.55 to 0.72) (Cohen et al 2015)
Vitamin E level in women with severe pre-eclampsia vs control SMD –0.13 (–0.57 to 0.30) (Cohen et al 2015)
Vitamin C level in women with any pre-eclampsia vs control SMD –0.56 (–0.83 to –0.28) (Cohen et al 2015)
Vitamin C level in women with mild pre-eclampsia vs controls SMD –0.32 (–0.67 to 0.03) (Cohen et al 2015)
Vitamin D >37.5 nmol/L vs <37.5 nmol/L OR 0.66 (0.32 to 1.35) (Hypponen et al 2013)
Vitamin D >50 nmol/L vs <50 nmol/L OR 0.58 (0.32 to 1.07) (Hypponen et al 2013)
Copper level in women with pre-eclampsia vs controls SMD 0.69 (0.54 to 0.84; P<0.001) (Fan et al 2016)
Zinc level in women with pre-eclampsia vs controls SMD –0.587(–0.963 to –0.212) (Ma et al 2015)
Selenium levels in women with pre-eclampsia vs controls MD –6.47 mug/l (–11.24 to –1.7; p = 0.008) (Xu et al 2016)
18

5.
Additional informationData on the prevalence of pre-eclampsia in Australia are limited. • In 2012, hypertension or pre-eclampsia were the reasons for 9.0–13.2% of labour inductions in New
South Wales, Queensland, South Australia, Tasmania and the Northern Territory and 1.3–2.4% of caesarean sections in Queensland, South Australia, Tasmania and the Northern Territory. Data collection methods varied and, for other states and territories, were unavailable or unpublished (Hilder et al 2014).
• There were nine maternal deaths related to hypertensive disorders of pregnancy between 2008 and 2012 (Humphrey et al 2015). These deaths were all due to pre-eclampsia and its complications, and all deaths were classified as direct. The maternal mortality rate during 2008–2012 for hypertensive disorders of pregnancy was 0.6 per 100,000 women who gave birth compared with 0.4 per 100,000 women who gave birth in 2006–2010, and 0.8 per 100,000 women who gave birth in 2003–2005.
Advice to EWGThe identified evidence and additional information will inform the narrative.
19

6.
Q1 What is the prevalence and incidence of pre-eclampsia, including population-specific groups
Estimated prevalence and incidence of pre-eclampsia in cohort studies
Study ref LoE N Aim/ methods Findings Comments
(Park et al 2015) III-2 5,784 Aim: To examine the effect of a combination of screening and treatment with low-dose aspirin on the prevalence of early-onset pre-eclampsia (PE).Methods: Retrospective analysis of two consecutive cohorts of women screened for early PE. The first was observed to determine whether algorithms developed to screen for PE at 11 to 13+6 weeks gestation could be applied to our population. High-risk women in the second cohort were offered aspirin (150mg at night), with treatment starting immediately after screening. The prevalence of early PE and the proportion of women with PE delivering at 34-37 weeks' gestation were compared.
There were 12 (0.4%) cases of early PE in the observational cohort and one (0.04%) in the interventional cohort (P<0.01). Among all women with PE delivering before 37 weeks, 25 (0.83%) were in the observational cohort and 10 (0.37%) in the interventional cohort (P=0.03).
(Park et al 2013) III-2 3,014 Aim: to validate the Fetal Medicine Foundation (FMF) multiple logistic regression algorithm for prediction of risk of pre-eclampsia in an Australian population.Methods: All women who attended first trimester screening were assessed. After delivery, risks of early-onset (delivery prior to 34 weeks) pre-eclampsia, late pre-eclampsia and gestational hypertension were calculated using the FMF risk algorithm.
Of women who had a live birth, 12 were delivered before 34 weeks due to early pre-eclampsia (0.4%) and 71 (2.4%) due to late pre-eclampsia (after 34 weeks).
20

6.
Study ref LoE N Aim/ methods Findings Comments
(Thornton et al 2016)
III-2 1,728 Aim: To benchmark outcomes for women and babies following a diagnosis of hypertension between obstetric units in similar settings.Methods: Utilising a set of pre-defined clinical indicators, Individual Patient Data analysis techniques applied to the medical records of all women diagnosed with a HDP over a 12. month period at six obstetric units within Australia and Canada.
The overall rate of hypertensive disorders of pregnancy was 7.6% of all deliveries, with a 3.0% preeclampsia rate. Outcomes differed significantly between units and did not cluster within any individual unit.
Historical changes in prevalence
Study ref LoE N Aim/ methods Findings Comments
(Hammond et al 2013)
III-2 526,125 Aim: To characterise changing risk factors for preterm birth in Western Australia between 1984 and 2006 among all non-Aboriginal women giving birth to live singleton infants between 1984 and 2006.Methods: Multinomial, multivariable regression models were used to assess antecedent profiles by preterm status and labour onset types (spontaneous, medically indicated (MI), prelabour rupture of membranes [PROM]).
Reported percentages of pre-eclampsia were lower in 2006 than 1984 among women with spontaneous term birth (1.4 vs 2.5%), spontaneous preterm birth (3.5 vs 3.6%), PROM term birth (2.4 vs 3.6%), MI term birth (6.3 vs 12.9%) and MI preterm birth (35.6 vs 43.8%) but not among women with PROM preterm birth (3.5 vs 2.4%).
21

6.
Study ref LoE N Aim/ methods Findings Comments
(Thornton et al 2013)
III-2 691,738 Aim: To determine the incidence of preeclampsia and eclampsia and associated mortality in Australia between 2000 and 2008.Methods: Analysis of statutorily collected datasets of singleton births in New South Wales using International Classification of Disease coding. Analyzed using cross tabulation, logistic regression, and means testing, where appropriate.
The overall incidence of preeclampsia was 3.3% with a decrease from 4.6% to 2.3%. The overall rate of eclampsia was 8.6/10,000 births or 2.6% of preeclampsia cases, with an increase from 2.3% to 4.2%. The relative risk of eclampsia in pre-eclamptic women in 2008 was 1.9 (95%CI 1.28 to 2.92) when compared with the year 2000. The relative risk of a woman with preeclampsia/eclampsia dying in the first 12 months following birth compared with normotensive women is 5.1 (95%CI 3.07 to 8.60).
(Diouf et al 2016) III-2 37,424 Aim: To examine trends in maternal and newborn health characteristics for all mothers who were recorded as Aboriginal in the Western Australian Midwives' Notification System from 1986 to 2009.Methods: Births were categorised into four-year time intervals (1986-1989, 1990-1993, 1994-1997, 1998-2001, 2002-2005, 2006-2009). Trends in maternal demographic characteristics, pre-existing medical conditions, pregnancy complications and neonatal characteristics were examined.
The prevalence of pre-eclampsia decreased (6.8-4.0%, P < 0.001).
22

6.
Study ref LoE N Aim/ methods Findings Comments
(Roberts et al 2015) III-2 1,076,122 Aim: to explore whether early planned delivery can partly explain the declining pregnancy hypertension rates in Australia.Method: Population-based record linkage study utilising linked birth and hospital records. A cohort of deliveries in New South Wales, Australia, 2001–2012. Pregnancy hypertension was the main outcome; pre-eclampsia was a secondary outcome.
From 2001 to 2012, pregnancy hypertension rates declined by 22%, from 9.9% to 7.7%, and pre-eclampsia by 27%, from 3.3% to 2.4% (trend p<0.0001).
Women who are overweight or obese
Study ref LoE N Aim/ methods Findings Comments
(Davies-Tuck et al 2016)
III-2 41,041 Aim: to determine whether the association between obesity and a range of adverse maternal and perinatal outcomes differed in South Asian and Australian and New Zealand born women.Methods: A retrospective cohort study of singleton births in South Asian and Australian/New Zealand born women at an Australian hospital between 2009 and 2013. The interaction between maternal region of birth and obesity on a range of maternal and perinatal outcomes was assessed using multivariate logistic regression.
Obesity was more strongly associated with pre-eclampsia/HELLP in Australian/New Zealand born women (OR 2.86; 95%CI 2.54 to 3.22; p=0.001 and p<0.001, respectively for interaction).
23

6.
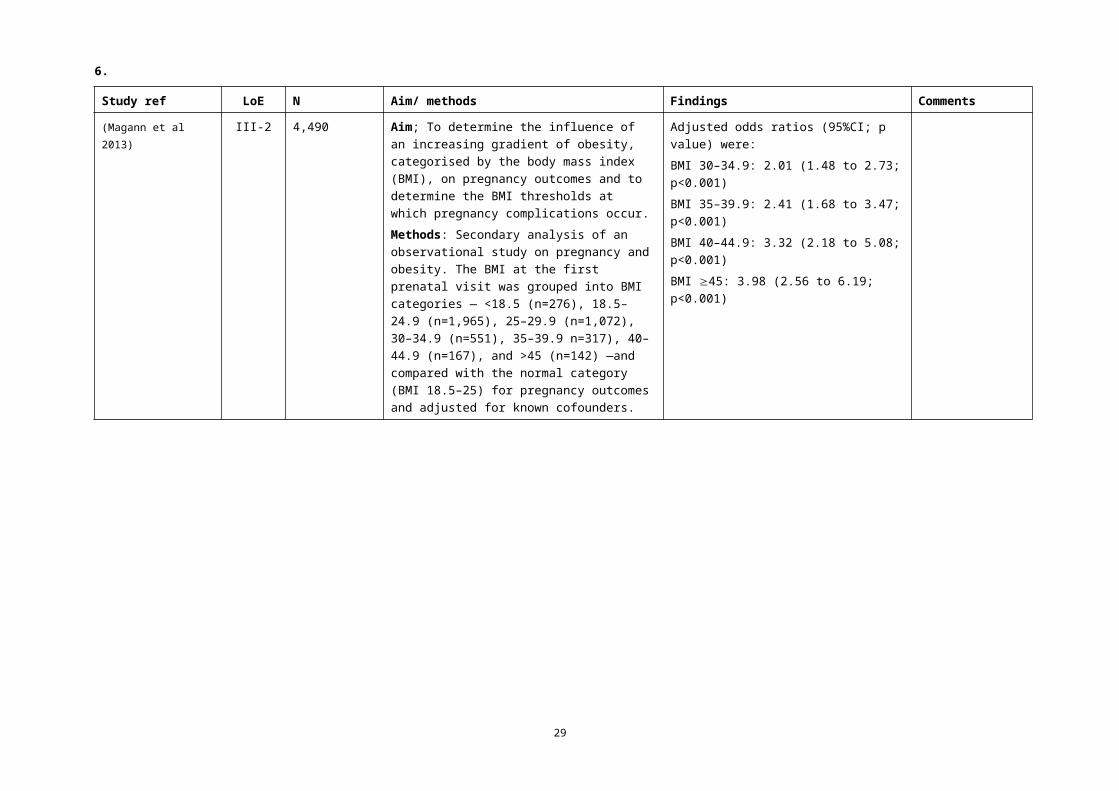
Study ref LoE N Aim/ methods Findings Comments
(Magann et al 2013) III-2 4,490 Aim; To determine the influence of an increasing gradient of obesity, categorised by the body mass index (BMI), on pregnancy outcomes and to determine the BMI thresholds at which pregnancy complications occur.Methods: Secondary analysis of an observational study on pregnancy and obesity. The BMI at the first prenatal visit was grouped into BMI categories — <18.5 (n=276), 18.5–24.9 (n=1,965), 25–29.9 (n=1,072), 30–34.9 (n=551), 35–39.9 n=317), 40–44.9 (n=167), and >45 (n=142) —and compared with the normal category (BMI 18.5–25) for pregnancy outcomes and adjusted for known cofounders.
Adjusted odds ratios (95%CI; p value) were:BMI 30–34.9: 2.01 (1.48 to 2.73; p<0.001)BMI 35–39.9: 2.41 (1.68 to 3.47; p<0.001)BMI 40–44.9: 3.32 (2.18 to 5.08; p<0.001)BMI 45: 3.98 (2.56 to 6.19; p<0.001)
24

6.
Study ref LoE N Aim/ methods Findings Comments
(Sullivan et al 2015) III-2 370 Aim: to determine the prevalence, risk factors, management and perinatal outcomes of super-obese women giving birth in Australia.Methods: A national population-based cohort study. Super-obese pregnant women (body mass index (BMI) >50 kg/m(2) or weight >140 kg) who gave birth between January 1 and October 31, 2010 and a comparison cohort were identified using the Australasian Maternity Outcomes Surveillance System (AMOSS). Outcomes included maternal and perinatal morbidity and mortality. Prevalence estimates calculated with 95% confidence intervals (CIs). Adjusted odds ratios (ORs) were calculated using multivariable logistic regression.
Compared with other women, super-obese women had a significantly higher risk for pre-eclampsia (8.5% vs 2.6%; AOR 3.43; 95%CI 1.72 to 6.84)
25

6.
Study ref LoE N Aim/ methods Findings Comments
(Vanderlelie et al 2016)
III-2 2,261 Aim: to investigate whether multivitamin use during pregnancy is associated with a reduced risk of pre-eclampsia.Methods: The effect of multivitamin use on incidence of pre-eclampsia in lean and overweight/obese women was analysed using data collected between 2006 and 2011 as part of the Environments for Healthy Living Project, Griffith University, Australia.
Body mass index (BMI)>25 was associated with increased in pre-eclampsia risk (OR 1.97; 95%CI 0.93 to 4.16). First trimester multivitamin use was associated with a 67% reduction in pre-eclampsia risk (95%CI: 0.14 to 0.75). Stratification by BMI demonstrated a 55% reduction in pre-eclampsia risk (95%CI: 0.30 to 0.86) in overweight (BMI: 25-29.9) and 62% risk reduction (95%CI: 0.16, 0.92) in obese (BMI:>30) cohorts that supplemented with multivitamins in the first trimester of pregnancy. First trimester folate supplementation demonstrated significance upon stratification by overweight status for women with BMI >25 (AOR 0.55 95%CI: 0.31 to 0.96).
26

6.Women aged 45 years or older
Study ref LoE N Aim/ methods Findings Comments
(Carolan et al 2013) III-2 49,126 Aim: to determine maternal and perinatal outcomes of pregnancies in women aged 45 years or older compared to women aged 30-34 years.Methods: Data on births at 20 or more weeks' gestation were obtained from the Victorian Perinatal Data Collection for the years 2005 and 2006 and selected maternal and perinatal outcomes for women of very advanced maternal age (VAMA) aged 45 years or older (n=217) compared to women aged 30-34 years (n=48,909).
There was weak evidence for an increased risk of pre-eclampsia (OR 1.86; 95% 0.9 to 3.6; p=0.052).
27

6.Women who have migrated from their country of birth
Study ref LoE N Aim/ methods Findings Comments
(Urquia et al 2014) III-2 9,028,802 Aim: To assess disparities in pre-eclampsia and eclampsia among immigrant women from various world regions giving birth in six industrialised countries.Methods: Cross-country comparative study of linked population-based databases. Setting Provincial or regional obstetric delivery data from Australia, Canada, Spain and the USA and national data from Denmark and Sweden. Population All immigrant and non-immigrant women delivering in the six industrialised countries within the most recent 10-year period available to each participating centre (1995-2010). Pooled data were analysed with multilevel models. Within-country analyses used stratified logistic regression to obtain odds ratios (OR) with 95% confidence intervals (95% CI).
Compared with women born in Australia risk of pre-eclampsia was lower among women born in Western Europe (OR 0.91; 95%CI 0.85 to 0.97), Eastern Europe (OR 0.79; 95%CI 0.67 to 0.94), South Asia (OR 0.58; 95%CI 0.55 to 0.62), East-Southeast Asia (OR 0.64; 95%CI 0.58 to 0.71), North Africa and Middle East (OR 0.69; 95%CI 0.63 to 0.77) and Sub-Saharan Africa (OR 0.95; 95%CI 0.85 to 1.07) and similar among women born in Latin America and Caribbean (OR1.06; 95%CI 0.90 to 1.26).
28
6.Women of refugee background
Study ref LoE N Aim/ methods Findings Comments
(Gibson-Helm et al 2014)
III-2 2,173 Aim: To inform whether women of refugee background require additional services in pregnancy compared to non-refugee migrant women from similar world regions we aimed to describe and compare maternal health, pregnancy care attendance and pregnancy outcomes among migrant women from Africa with or without a refugee background.Methods: Retrospective, observational study of singleton births at a single, metropolitan, maternity service in Australia 2002-2011, to women born in humanitarian source countries (HSC) and non-HSC from North Africa (n=1361), Middle and East Africa (n=706) and West Africa (n=106).
Risk of pre-eclampsia was higher in women from HSC source countries than non-HSC source countries among women from North Africa (age-adjusted OR 1.4; 95%CI 0.4 to 4.6; p=0.79), Middle and East Africa (crude OR 1.1; 95%CI 0.2 to 4.9; p=0.71) and West Africa (4.9% vs 0%) but the differences were not significant.
Women with serious mental health disorders
Study ref LoE N Aim/ methods Findings Comments
(Judd et al 2014) III-2 112 Aim: to better understand the factors that may influence these adverse outcomes.Method: We examined obstetric and neonatal outcomes of pregnant women with schizophrenia and bipolar disorder and factors possibly influencing these outcomes. A retrospective review of the medical history of 112 women with a DSM-IV diagnosis of schizophrenia or bipolar disorder was undertaken. Data for controls were extracted from the hospital's electronic birth record data.
A diagnosis of schizophrenia or bipolar disorder conferred a five-fold increased risk of having pre-eclampsia (OR 5.28; 95%CI 2.79 to 9.98; p<001).
29

6.
Study ref LoE N Aim/ methods Findings Comments
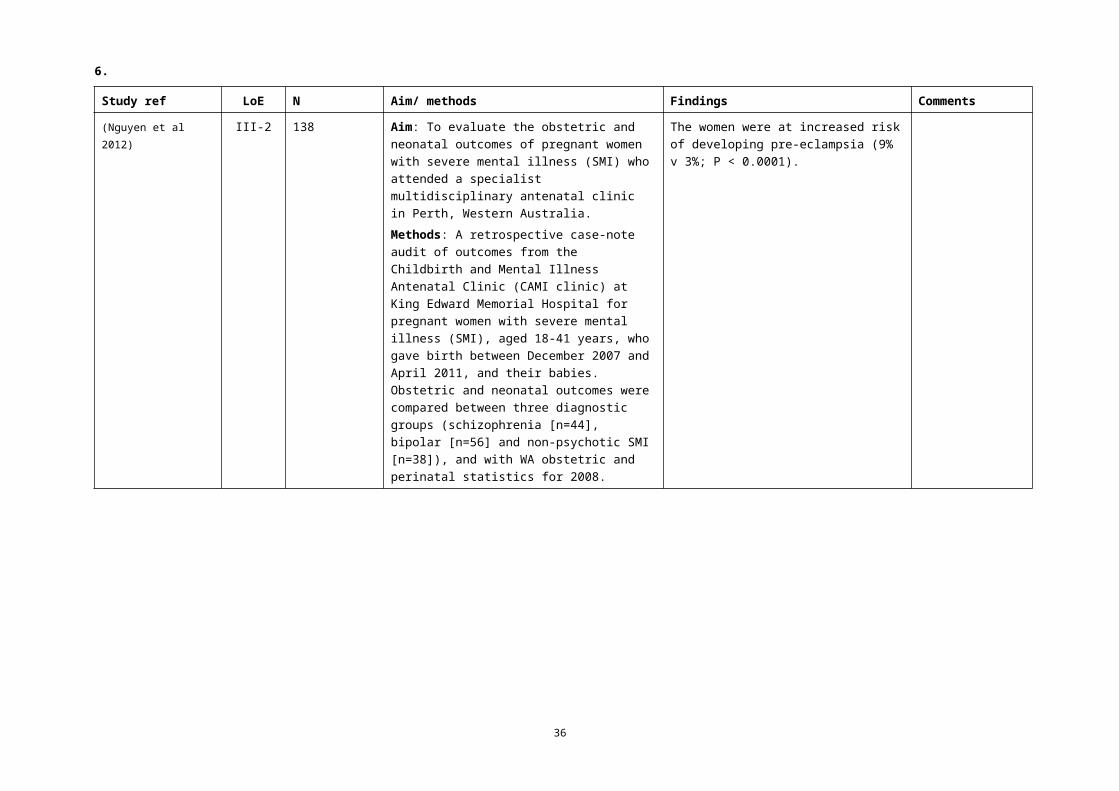
(Nguyen et al 2012) III-2 138 Aim: To evaluate the obstetric and neonatal outcomes of pregnant women with severe mental illness (SMI) who attended a specialist multidisciplinary antenatal clinic in Perth, Western Australia.Methods: A retrospective case-note audit of outcomes from the Childbirth and Mental Illness Antenatal Clinic (CAMI clinic) at King Edward Memorial Hospital for pregnant women with severe mental illness (SMI), aged 18-41 years, who gave birth between December 2007 and April 2011, and their babies. Obstetric and neonatal outcomes were compared between three diagnostic groups (schizophrenia [n=44], bipolar [n=56] and non-psychotic SMI [n=38]), and with WA obstetric and perinatal statistics for 2008.
The women were at increased risk of developing pre-eclampsia (9% v 3%; P < 0.0001).
30

6.Women by planned place of birth
Study ref LoE N Aim/ methods Findings Comments
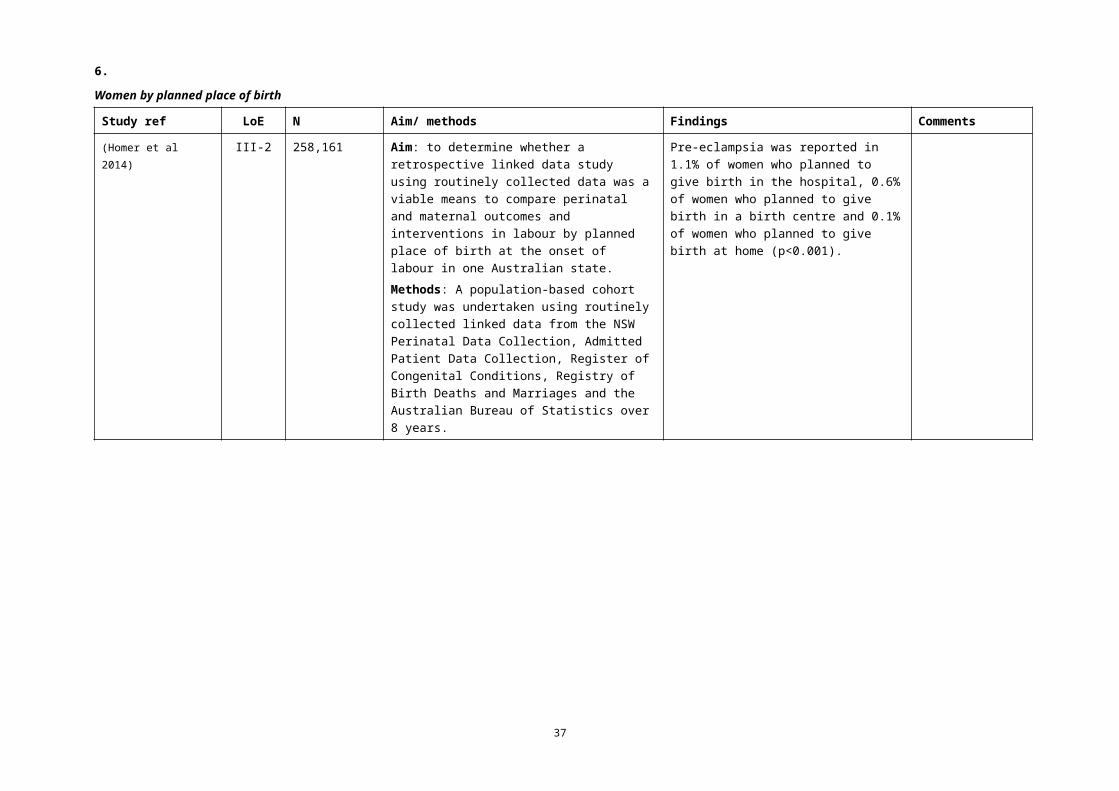
(Homer et al 2014) III-2 258,161 Aim: to determine whether a retrospective linked data study using routinely collected data was a viable means to compare perinatal and maternal outcomes and interventions in labour by planned place of birth at the onset of labour in one Australian state.Methods: A population-based cohort study was undertaken using routinely collected linked data from the NSW Perinatal Data Collection, Admitted Patient Data Collection, Register of Congenital Conditions, Registry of Birth Deaths and Marriages and the Australian Bureau of Statistics over 8 years.
Pre-eclampsia was reported in 1.1% of women who planned to give birth in the hospital, 0.6% of women who planned to give birth in a birth centre and 0.1% of women who planned to give birth at home (p<0.001).
31

6.Women who conceive through assisted reproductive technology
Study ref LoE N Aim/ methods Findings Comments
(Wang et al 2016) III-2 596,520 Aim: To determine the association between assisted reproductive technology (ART) treatment and the rate of combined gestational hypertension (GH), preeclampsia (PE).Methods: The rate of GH/PE for ART and non-ART mothers between 2007 and 2011 was compared, with odds ratio (OR), adjusted odds ratio (AOR), and 95% confidence interval (CI) used to assess the association between ART and GH/PE.
The overall rate of GH/PE was 4.3%, with 6.4% for ART mothers and 4.3% for non-ART mothers. The rate of GH/PE was higher for mothers of twins than singletons (12.4% vs. 5.7% for ART mothers; 8.6% vs. 4.2% for non-ART mothers). The ART mothers had a 17% increased odds of GH/PE compared with the non-ART mothers (AOR 1.17; 95% CI, 1.10-1.24). After stratification by plurality, the difference in GH/PE rates between ART and non-ART mothers was not statistically significant, with AOR 1.05 (95% CI, 0.98-1.12) for mothers of singletons and AOR 1.10 (95% CI, 0.94-1.30) for mothers of twins.
32

6.Women who experience vaginal bleeding in pregnancy
Study ref LoE N Aim/ methods Findings Comments
(Smits et al 2012) III-2 3,431 Aim: To describe patterns of vaginal bleeding in the first 20 weeks of pregnancy and evaluate the association between patterns of bleeding and risk of subsequent pre-eclampsia in nulliparous women.Methods: Participating centres of the Screening for Pregnancy Endpoints (SCOPE) study in Auckland (New Zealand), Adelaide (Australia), Manchester and London (UK) and Cork (Ireland). Population. Healthy nulliparous women (n= 3431). Logistic regression was used to assess the association between bleeding characteristics and pre-eclampsia while controlling for known determinants of pre-eclampsia.
Vaginal bleeding during the first 20 weeks was experienced by 780 (23%) women. Risk of pre-eclampsia was not associated with the presence or absence of bleeding (aOR 0.96; 95% CI 0.67 to 1.38). Analyses confined to women with vaginal bleeding showed that any bleeding episode of five or more consecutive days, compared with shorter episodes, increased risk of pre-eclampsia approximately twofold (aOR 2.15, 95% CI 1.01 to 4.57), as did multiple compared with single episodes of bleeding (aOR 2.33, 95%CI 1.16 to 4.67).
33

6.
Q2 What are the risk factors for developing pre-eclampsia?
Study ref LoE N Aim/ methods Findings Comments
(Bartsch et al 2016) I 92 studies25,356,688 pregnancies
Aim: To develop a practical evidence based list of clinical risk factors that can be assessed by a clinician at < 16 weeks' gestation to estimate a woman's risk of pre-eclampsia.Methods: Systematic review and meta-analysis of cohort studies from PubMed and Embase databases, 2000-15. Cohort studies with >1,000 participants that evaluated the risk of pre-eclampsia in relation to a common and generally accepted clinical risk factor assessed at <16 weeks' gestation. Two independent reviewers extracted data from included studies. A pooled event rate and pooled relative risk for pre-eclampsia were calculated for each of 14 risk factors.
The pooled relative risk for each risk factor significantly exceeded 1.0, except for prior intrauterine growth restriction. Women with antiphospholipid antibody syndrome had the highest pooled rate of pre-eclampsia (17.3%, 95% confidence interval 6.8% to 31.4%). Those with prior pre-eclampsia had the greatest pooled relative risk (8.4, 7.1 to 9.9). Chronic hypertension ranked second, both in terms of its pooled rate (16.0%, 12.6% to 19.7%) and pooled relative risk (5.1, 4.0 to 6.5) of pre-eclampsia. Pregestational diabetes (pooled rate 11.0%, 8.4% to 13.8%; pooled relative risk 3.7, 3.1 to 4.3), prepregnancy body mass index (BMI) >30 (7.1%, 6.1% to 8.2%; 2.8, 2.6 to 3.1), and use of assisted reproductive technology (6.2%, 4.7% to 7.9%; 1.8, 1.6 to 2.1) were other prominent risk factors.
34

6.Blood group
Study ref LoE N Aim/ methods Findings Comments
(Alpoim et al 2013) I 2 studies Aim: to investigate whether ABO blood groups could influence development of pre-eclampsia.Methods: A sensitive search of four databases identified 45 unique titles. The retrieved papers were assessed independently by authors and a rigorous process of selection and data extract was conduct. Methodological quality of the included studies was also evaluated. Two studies met eligibility criteria.
A significant overall effect was observed when comparing pregnant women of blood group AB versus non-AB for the risk of pre-eclampsia (OR 2.42; 95% CI 1.63 to 3.58) with no evidence of heterogeneity and no important variability across studies (P=0.39, I2 =0.0 %).With only primigravid women included in the analysis the effect was greater (OR 2.44; 95%CI 1.46 to 4.07).
Body mass index and adiposity
Study ref LoE N Aim/ methods Findings Comments
(Salihu et al 2012) I Aim: to assess whether maternal obesity causes preeclampsia.Methods. A systematic literature review of the previous two decades (1992-2011) was conducted. The exposure was maternal obesity while the outcome of interest was preeclampsia.
Our review revealed consistent findings showing strong association between obesity and preeclampsia. Multiple biomarkers that potentially explain the mechanistic pathway in this relationship were identified, including leptin and adiponectin, matrix metalloproteinase (MMP), C-reactive protein (CRP), and sex hormone-binding globulin (SHBG). A causative biologic linkage remains, however, elusive.
No access to full text; requested
35
6.
Study ref LoE N Aim/ methods Findings Comments
(Poorolajal & Jenabi 2016)
I 23 studies1,387,599 participants
Aim: to estimate the overall association between overweight or obesity and preeclampsia.Methods: Major electronic databases, including PubMed, Web of Science, and Scopus were searched until August 2015. Rference lists of included studies were screened. Heterogeneity across studies was explored by Q-test and I2 statistic. The possibility of publication bias was assessed using Begg's and Egger's tests.
Preeclampsia was associated with overweight (OR 1.73; 95%CI 1.59 to 1.87; 21 studies) and obesity (OR = 3.15; 95% CI: 2.96, 3.35; 22 studies).
There was no evidence of publication bias.
(Cnossen et al 2007) I 36 studies1,699,073 women (60,584 with pre-eclampsia),
Aim: to determine the accuracy of body mass index (BMI) (pre-pregnancy or at booking) in predicting pre-eclampsia and to explore its potential for clinical application.Methods: Systematic review and bivariate meta-analysis with Medline, Embase, Cochrane Library, MEDION, manual searching of reference lists of review articles and eligible primary articles, and contact with experts. Reviewers independently selected studies and extracted data on study characteristics, quality, and accuracy without language restrictions. Pooled sensitivities and specificities (95% CI), a summary receiver operating characteristic curve, and corresponding likelihood ratios (LRs). The potential value of BMI was assessed by combining its predictive capacity for different prevalences of pre-eclampsia and the therapeutic effectiveness (relative risk 0.90) of aspirin.
The median incidence of pre-eclampsia was 3.9% (interquartile range 1.4–6.8). The area under the curve was 0.64 with 93% of heterogeneity explained by threshold differences. Pooled estimates (95% CI) for all studies with a BMI 25 were 47% (33–61) for sensitivity and 73% (64–83) for specificity; and 21% (12–31) and 92% (89–95) for a BMI 35. Corresponding LRs were 1.7 (0.3–11.9) for BMI 25 and 0.73 (0.22–2.45) for BMI < 25, and 2.7 (1.0–7.3) for BMI 35 and 0.86 (0.68–1.07) for BMI < 35. The number needed to treat with aspirin to prevent one case of pre-eclampsia ranges from 714 (no testing, low-risk women) to 37 (BMI 35, high-risk women).
36
6.
Study ref LoE N Aim/ methods Findings Comments
(Wang et al 2013) I 29 studies1,980,761 participants67,075 pre-eclampsia events
Aim: to estimate the effect of maternal adiposity on pre-eclampsia.Method: We pooled data with a random-effects model, and obtained risk estimates for five predetermined bodyweight groups: low, normal-weight (reference), overweight, obese and severely obese.
In the cohort studies that did not adjust for pre-eclampsia risk factors, the pooled unadjusted relative risks (RR) with 95%CI for pre-eclampsia of overweight, obese and severely obese women were 1.58 (1.44 to 1.72, P<0.001), 2.68 (2.39 to 3.01, P<0.001) and 3.12 (2.24 to 4.36, P<0.001), respectively. In cohorts that adjusted for pre-eclampsia risk factors, the pooled adjusted RRs for pre-eclampsia of overweight, obese and severely obese women were 1.70 (1.60 to 1.81, P<0.001), 2.93 (2.58 to 3.33, P<0.001) and 4.14 (3.61 to 4.75, P<0.001), respectively.
Sensitivity analysis showed maternal adiposity was associated with increased risk of pre-eclampsia in both nulliparous and multiparous women.
Cigarette smoking and exposure to environmental carbon monoxide
Study ref LoE N Aim/ methods Findings Comments
(Wei et al 2015) I 17 studies1.8 million women; 62,089 with pre-clampsia
Aim: To further clarify the relationship between cigarette smoking and pre-eclampsia.Method: we conducted a comprehensive meta-analysis of prospective studies. We searched PubMed and Web of Science up to August 2015 to identify relevant studies. Random-effects models were used to estimate summarized relative risk (RR) and 95% confidence intervals (CIs).
Overall, there was a significant negative association between smoking during pregnancy and incidence of preeclampsia (RR 0.67, 95%CI: 0.60 to 0.75), with significant heterogeneity (I2 91.7%). Such an inverse association was also detected in strata of subgroup analyses according to study location, study sample size, parity of populations, singleton pregnancy, and adjustment for potential confounders including maternal age, diabetes mellitus, chronic hypertension, body mass index, and gender of infant.
37

6.
Study ref LoE N Aim/ methods Findings Comments
(Zhai et al 2012) I 121,158 Aim: to test the hypothesis that carbon monoxide (CO) in cigarette smoke may be the mechanism by which tobacco use during pregnancy decreases the risk of the development of preeclampsia.Methods: Births that occurred between 2004 and 2009 in the Canadian province of Ontario were extracted from the data. Study subjects were divided into 4 groups according to quartiles of CO concentration that were based on maternal residence. Adjusted odds ratio and 95% confidence interval were used to estimate the independent effect of CO on preeclampsia.
An inverse association between CO concentration and preeclampsia risk remained the same after adjustment for several important confounding factors, with a decreased risk among women exposed to 0.29–0.60 vs 0.01–0.16 ppm (aOR 0.63 (0.55 to 0.71).
Physical activity
Study ref LoE N Aim/ methods Findings Comments
(Aune et al 2014) I 12 studies Aim: to conduct a systematic review and dose-response meta-analysis of epidemiologic studies.Methods: PubMed, Embase, and Ovid databases were searched for case-control and cohort studies of physical activity and preeclampsia up to 2 November 2012. We estimated summary relative risks (RRs) using a random effects model. Results:
The summary RR for high versus low prepregnancy physical activity was 0.65 (95% CI 0.47 to 0.89; n=5). In the dose-response analysis, the summary RR was 0.72 (0.53 to 0.99; n=3) per 1 hour per day and 0.78 (0.63-0.96; n=2) per 20 metabolic equivalent task (MET)-hours per week. The summary RR for high versus low physical activity in early pregnancy was 0.79 (0.70 to 0.91; n=11). In the dose-response analysis, the summary RR per 1 hour per day was 0.83 (0.72 to 0.95; n=7) and 0.85 (0.68-1.07; n=3) per 20 MET-hours per week.
38

6.
Study ref LoE N Aim/ methods Findings Comments
(Kasawara et al 2012)
I 17 studies Aim: to evaluate the association between exercise and/or physical activity and occurrence of pre-eclampsia.Methods: We conducted electronic searches without year of publication and language limitations. This was a systematic review designed according to PRISMA. Databases accessed were PubMed; Latin-American and Caribbean Literature in Health Sciences (LILACS); Scientific Electronic Library On-line (SciELO); Physiotherapy Evidence Database (PEDro); and ISI web of Knowledge. Inclusion criteria were studies conducted in adults who were engaged in some physical activity. The selection and methodological evaluation were carried out by two independent reviewers.
Comparison of six case-control studies showed that physical activity had a protective effect on the development of pre-eclampsia [OR 0.77, 95%CI 0.64 to 0.91, p < 0.01]. The 10 prospective cohort studies showed no significant difference (OR 0.99, 95%CI 0.93-1.05, p=0.81). The only randomized clinical trial showed a protective effect on the development of pre-eclampsia in the stretching group (OR 6.34, 95% CI 0.72-55.37, p= 0.09). This systematic review indicates a trend toward a protective effect of physical activity in the prevention of pre-eclampsia.
39

6.
Study ref LoE N Aim/ methods Findings Comments
(Wolf et al 2014) IV 11 studies Aim: to examine the association between leisure time physical activity (LTPA) before and/or during pregnancy and the risk of PE.Method: A systematic search of the EMBASE and PUBMED databases from inception to November 17, 2011 was conducted by two independent reviewers. Only studies describing the association between the intensity or amount of LTPA before and/or during pregnancy and the risk of PE were included. A narrative synthesis of the results was undertaken following the Preferred Reporting Items for Systematic Reviews and Meta-Analyses guidelines. A quality assessment was performed using the Newcastle Ottawa Scale.
None of the studies found light- or moderate-intensity LTPA to be associated with PE. Three studies reported that vigorous-intensity LTPA before and/or during pregnancy may reduce the risk of PE. One study reported a reduced risk among women who participated in LTPA at least 25 times per month or more than 4 h per week. However, one study found an elevated risk of severe PE with high amounts of LTPA, defined as 4.5 h per week or more. Results are mixed, but high intensity LTPA before and/or during pregnancy or more than 4 h per week of LTPA may reduce the risk of PE.
No meta-analysis performed
40

6.Mental health
Study ref LoE N Aim/ methods Findings Comments
(Zhang et al 2013) I 13 studies668,005 women
Aim: to evaluate the relationships between mental stress and gestational hypertension/preeclampsia in pregnant women.Methods: Relevant studies were identified by PubMed, Cochrane, Chinese medical datasets (Wanfang, CNKI, and VIP Database). Only case-control or cohort studies evaluating an association of preeclampsia or gestational hypertension with mental stress were included in the present meta-analysis. Essential information was extracted from the qualified studies. Odds ratio (OR) was used as a pooled effect size. Potential heterogeneity and publication bias were detected as well.
The results indicated that mental stress was associated with an increased risk of gestational hypertension (OR 1.26; 95%CI 1.00 to 1.59; P=0.047) and preeclampsia (OR 1.49; 95%CI 1.27 to 1.74; P<0.001). Work stress (OR 1.50; 95%CI 1.15 to 1.97; P = 0.003) and anxiety or depression (OR 1.88; 95%CI 1.08 to 3.25; P=0.02) were positively associated with risk of preeclampsia.
(Hu et al 2015) I 5 studies3,979 women
Aim: to investigate the association between depression and/or depressive symptoms during pregnancy and the risk of an operative delivery or preeclampsia, and to quantify the strength of the association.Methods: A search of the PubMed, SCI/SSCI, Proquest PsycARTICLES and CINAHL databases was supplemented by manual searches of bibliographies of key retrieved articles and review articles.
The pooled analyses showed that preeclampsia had a statistically significant association with antenatal depressive symptoms (OR 1.63, 95%CI 1.32 to 2.02). When the pre-pregnancy body mass indices were controlled in their initial design, the risk for preeclampsia still existed (OR 1.48, 95%CI 1.04 to 2.01).
Included studies were observational
41

6.
Study ref LoE N Aim/ methods Findings Comments
Antidepressant use
(Uguz 2017) IV 7 studies Aim: to review the current literature examining the potential relationship between use of antidepressants during pregnancy and preeclampsia or gestational hypertension.Methods: PubMed was searched for English-language reports between January 1, 1995, and December 31, 2015. Studies that reported the diagnosis of preeclampsia or gestational hypertension and use of antidepressant were included in the review.
The studies reported that, compared with nonusers, adjusted relative risk of preeclampsia or gestational hypertension in antidepressant users was 1.28 to 1.53 for any antidepressant, 1.05 to 3.16 for selective serotonin reuptake inhibitors, 1.49 to 1.95 for selective serotonin-norepinephrine reuptake inhibitors, and 0.35 to 3.23 for tricyclic antidepressants. Consistently, antidepressant use during the second trimester of pregnancy was associated with increased risk of preeclampsia or gestational hypertension.
No meta-analysis conducted.
Seasonality of birth
Study ref LoE N Aim/ methods Findings Comments
(Beltran et al 2013) IV 35 studies Aim: to review available evidence on the relationships between seasonality or meteorology and three major pregnancy outcomes: the hypertensive disorders of pregnancy (including preeclampsia, eclampsia and gestational hypertension), gestational length and birth weight.
The risks of preeclampsia appear higher for women who conceive during the warmest months, and give birth in the coldest months of the year. Birth in the coldest months is also associated with a higher eclampsia risk.
42

6.Gynaecological and obstetric factors
Study ref LoE N Aim/ methods Findings Comments
Intrauterine device use
(Li et al 2016a) I 2 cohort studies153,780 women;1 case-control study13,900 women
Aim: to quantitatively analyze the association between exposure to intrauterine devices (IUDs) and risks of developing preeclampsia during pregnancy.Methods: Literature search was performed on Pubmed, Medline, EMBASE and COHRANE Library. Both mesh terms and free terms were used. Reference lists were also reviewed. Primary studies that described preeclampsia as one of the outcomes of interest between women exposed (IUD was used during or before pregnancy) and unexposed (no IUD use) to IUDs were included. The summary risk ratios (RRs) were estimated using a fixed effect model. Risk of bias was assessed with the Newcastle-Ottawa Scale (NOS) System.
The summary RR for previous use of IUDs (in situ or early removal) vs no use of IUDs was 0.74 (95% CI, 0.61-0.90). Any use (either before or during pregnancy) of IUDs may contribute to the reduced risk of preeclampsia.
43

6.
Study ref LoE N Aim/ methods Findings Comments
Fetal sex
(Jaskolka et al 2016) I 22 studies3,163,735 women
Aim: to conduct a systematic review and meta-analysis to objectively evaluate the relationship between fetal sex and maternal risk of pre-eclampsia/eclampsia.Methods: Studies from January 1950 to April 2015 were identified from PUBMED and EMBASE. Selection criteria: This systematic review and meta-analysis evaluated 22 articles reporting data on fetal sex and prevalence of pre-eclampsia/eclampsia. Data collection and analysis: Data were extracted by two independent reviewers. Pooled estimates of the relative risk (RR) were calculated by random-effects model.
Pooled analyses of these studies showed no association between male fetal sex and maternal risk of pre-eclampsia/eclampsia (RR 1.01; 95%CI 0.97 to 1.05); however, a subgroup analysis including only studies that evaluated the non-Asian population (n=2,931,771) demonstrated that male fetal sex was associated with increased maternal risk of pre-eclampsia/ eclampsia (RR 1.05; 95%CI 1.03 to 1.06; P=0.33).
44

6.
Study ref LoE N Aim/ methods Findings Comments
Chorionic villus sampling
(Basaran et al 2016) I 9 studies Aim: To perform a meta-analysis for an assessment of the risk of preeclampsia or gestational hypertension following chorionic villus sampling (CVS).Methods: PubMed was systematically searched from its inception through January 2016. Material and Methods: Nine reports were identified. A pre-specified scale was used to assess their quality. Tabulation, integration, and results: We performed pooling into three control subgroups: A) Patients with no invasive prenatal diagnostic procedure; B) Patients with midtrimester diagnostic amniocentesis and patients with no invasive prenatal diagnostic procedure combined; C) patients with midtrimester diagnostic amniocentesis.
Control group A: No significant difference in risk of gestational hypertension (OR 0.76, 95%CI 0.46 to 1.26), preeclampsia (OR 0.83, 95%CI 0.42 to 1.67), severe preeclampsia (0.49, 95%CI 0.04 to 5.78) or pooled hypertension categories (0.80, 95% CI 0.46 to 1.41).Control group B: No significant difference in risk of preeclampsia (OR 1.00, 95%CI 0.46 to 2.18), severe preeclampsia (OR 0.83, 95%CI 0.14 to 4.85) or pooled hypertension categories (OR 1.07, 95% CI 0.63 to 1.84).Control group C: Significant difference in OR for preeclampsia between the CVS and amniocentesis groups (2.47, 95% CI 1.14 to 5.33). There was a marginal difference in ORs for combined pregnancy-induced hypertension categories between the CVS and amniocentesis groups (OR 1.61, 95% CI 1.02 to 2.53).
The heterogeneity and retrospective design of existing studies are limiting factors for our analysis and findings.
45

6.
Study ref LoE N Aim/ methods Findings Comments
Interpregnancy interval
(Cormick et al 2016) I 4 studies77,561 women
Aim: To explore the effect of inter-pregnancy interval on the risk of recurrent pre-eclampsia or eclampia.Methods: MEDLINE, EMBASE and LILACS were searched (inception to July 2015). Cohort studies assessing the risk of recurrent pre-eclampsia in the immediate subsequent pregnancy according to different birth intervals. Two reviewers independently performed screening, data extraction, methodological and quality assessment. Meta-analysis of adjusted odds ratios (aOR) with 95 % confidence intervals (CI) was used to measure the association between various interval lengths and recurrent pre-eclampsia or eclampsia.
The meta-analysis of two studies showed that compared to inter-pregnancy intervals of 2–4 years, the aOR for recurrent pre-eclampsia was 1.01 [95%CI 0.95 to 1.07, I2 0 %] with intervals of <2 years and 1.10 [95%CI 1.02 to 1.19, I2 0%] with intervals >4 years.
The results of this review should be interpreted with caution as included studies are observational and thus subject to possible confounding factors.
46

6.Assisted reproductive technology
Study ref LoE N Aim/ methods Findings Comments
Oocyte donation
(Masoudian et al 2016)
I 19 studies86,515 pregnancies
Aim: to determine whether pregnancies that were achieved via oocyte donation, compared with pregnancies achieved via other assisted reproductive technology methods or natural conception, demonstrate increased risk of preeclampsia or gestational hypertension.Methods: Comparative studies of pregnancies that were achieved with oocyte donation vs other methods of assisted reproductive technology or natural conception with preeclampsia or gestational hypertension were included as 1 of the measured outcomes. Two reviewers independently selected studies, which were assessed for quality with the use of methodological index for non-randomized studies, and extracted the data. Statistical analysis was conducted.
Our pooled data demonstrated that the risk of preeclampsia is higher in oocyte-donation pregnancies compared with other methods of assisted reproductive technology (OR 2.54; 95%CI 1.98 to 3.24; P<0.0001) or natural conception (OR 4.34; 95%CI 3.10 to 6.06; P <.0001). Subgroup analysis conducted for singleton and multiple gestations demonstrated a similar risk for preeclampsia and gestational hypertension in both singleton and multiple gestations.
47

6.
Study ref LoE N Aim/ methods Findings Comments
(Blazquez et al 2016)
I 11 studies Aim: to determine whether there is a higher incidence of preeclampsia (PE) in pregnancies achieved by oocyte donation (OD) compared with pregnancies achieved by in vitro fertilization with autologous oocytes (IVF).Methods: A systematic review was performed to identify relevant studies published from January 1994 until April 2015 with at least an abstract in English using PubMed, ISI Web of Knowledge, and clinicaltrials.gov. The studies included in this systematic review were retrospective and prospective cohort studies of women reporting results on the association between oocyte donation vs. in vitro fertilization (exposure) and preeclampsia (outcome).
Oocyte donation is a risk factor for the development of PE compared to IVF cycles, with a weighted OR of 3.12 under a fixed effects method (FEM: no heterogeneity between the studies). The weighted OR under a random effects model was 2.9 (95%CI 2.19 to 3.85). The meta-regression analysis showed that neither multiple pregnancies (estimate = 0.08; p = 0.19) nor patient age (estimate = -2.29; p = 0.13) significantly explained the variability of the effect of oocyte donation on PE. Q statistic was 12.78 (p = 0.237), suggesting absence of heterogeneity between the studies.
Donor insemination
(Gonzalez-Comadran et al 2014)
I 7 studies10,898 women
Aim: to evaluate whether women who conceive with donor sperm have an increased risk of preeclampsia compared with those who use their partner's sperm.Methods: Studies that compared women who were impregnated by donor (n=2,342) and partner (n=8,556) sperm were included. The main outcomes assessed were preeclampsia and gestational hypertension rates.
Conception using donor sperm was associated with an increased risk of preeclampsia (OR 1.63, 95%CI 1.36 to 1.95) compared with using a partner's sperm. No difference was observed in the risk of gestational hypertension (OR 0.94, 95% CI 0.43-2.03).
Included studies were observational
48

6.Cardiovascular factors
Study ref LoE N Aim/ methods Findings Comments
Hyperlipidaemia
(Spracklen et al 2014)
I 74 studies Aim: to test the association between preeclampsia and maternal total cholesterol, highdensity lipoprotein cholesterol (HDL-C), low-density lipoprotein cholesterol (LDL-C), non-HDL-C, and triglyceride levels measured during pregnancy.Methods: We conducted a systematic search for studies published between the index date until July 2013 reporting maternal lipid levels in women with preeclampsia and normotensive pregnant women. Weighted mean differences in lipid levels were calculated using a random-effects model. Statistical heterogeneity was investigated using the I2 statistic. Meta-regression was used to identify sources of heterogeneity.
Any preeclampsia was associated with elevated total cholesterol in the 1st/2nd trimester (WMD 12.49 mg/dL; 95%CI 3.44 to 21.54; p=0.007; 11 studies) and 3rd trimester (WMD 20.20 mg/dL; 95%CI 8.70 to 31.70; p=0.001; 46 studies), non-HDL-C in the 1st/2nd trimester (WMD 11.57 mg/dL; 95%CI 3.47 to 19.67; p<0.0001; 9 studies) and 3rd trimester (WMD 29.59 mg/dL; 95%CI 12.13 to 47.06; p=0.001; 38 studies) and triglyceride levels in the 1st/2nd trimester (WMD 25.08; 95%CI 14.39 to 35.77; p<0.0001; 13 studies) and 3rd trimester (WMD 80.29 mg/dL; 95%CI 51.45 to 109.13; p<0.0001; 44 studies), and with lower levels of HDL-C in the 3rd trimester (WMD –8.86 mg/dL; 95%CI –11.50 to –6.21; p<0.0001; 41 studies). A marginal association was found with LDL-C levels.
Statistical heterogeneity was detected in all analyses. Meta-regression analyses suggested that differences in body mass index across studies may be partially responsible for the heterogeneity in the triglyceride and LDL-C analyses.
49

6.
Study ref LoE N Aim/ methods Findings Comments
(Gallos et al 2013) I 24 case control studies2,720 women5 cohort studies3,147 women
Aim: to determine the association between hypertriglyceridaemia and pre-eclampsia in pregnant women.Methods: We searched MEDLINE, EMBASE, Web of Science, Excerpta Medica Database, ISI Web of Knowledge, Cumulative Index to Nursing and Allied Health Literature, Cochrane Library from inception until June 2012 and reference lists of relevant studies. Two reviewers independently selected studies on pregnant women where triglycerides were measured and women were followed up until the development of pre-eclampsia or selected on the basis of presence of pre-eclampsia and compared with controls. Data collection and analysis We collected and meta-analysed the weighted mean differences (WMDs) of triglyceride levels from individual studies using a random effects model.
We found strong evidence that pre-eclampsia is associated with higher levels of serum triglycerides (WMD 0.78 mmol/l, 95%CI 0.6 to 0.96, P<0.00001). This finding is also confirmed in cohort studies that recruited women in the second trimester before the onset of pre-eclampsia, which proves that hypertriglyceridaemia precedes the onset of pre-eclampsia (WMD 0.24 mmol/l, 95%CI 0.13 to 0.34, P<0.0001).
Included studies were observational
50

6.
Study ref LoE N Aim/ methods Findings Comments
Arterial stiffness
(Hausvater et al 2012)
I 23 studies Aim: to investigate the association between preeclampsia and arterial stiffness.Method: A systematic review and meta-analysis was conducted using MEDLINE, EMBASE, and the Cochrane Library.
A significant increase in all arterial stiffness indices combined was observed in women with preeclampsia vs women with normotensive pregnancies [SMD 1.62, 95%CI 0.73 to 2.50]; carotid-femoral pulse wave velocity (cfPWV) and augmentation index (AIx) were also significantly increased (WMD cfPWV 1.04, 95%CI 0.34 to 1.74; WMD AIx 15.10, 95%CI 5.08 to 25.11), whereas carotid-radial PWV (crPWV) increase did not reach significance (WMD crPWV 0.99, 95%CI –0.07 to 2.05).
Periodontal disease
Study ref LoE N Aim/ methods Findings Comments
(Wei et al 2013) I 15 studies (13 case-control; 2 cohort)1,089 women with pre-eclampsia
Aim: to ascertain the relationship between PD and preeclampsia.Methods: The PubMed database was searched up to January 12, 2013, for relevant observational studies on an association between PD and the risk of preeclampsia. Data were extracted and analyzed independently by two authors. The meta-analysis was performed using comprehensive meta-analysis software.
Based on a random-effects meta-analysis, a significant association between PD and preeclampsia was identified (OR 2.79, 95% CI 2.01 to 3.01, P<0.0001). Although the causality remains unclear, the association between PD and preeclampsia may reflect the induction of PD by the preeclamptic state, or it may be part of an overall exaggerated inflammatory response to pregnancy.
51
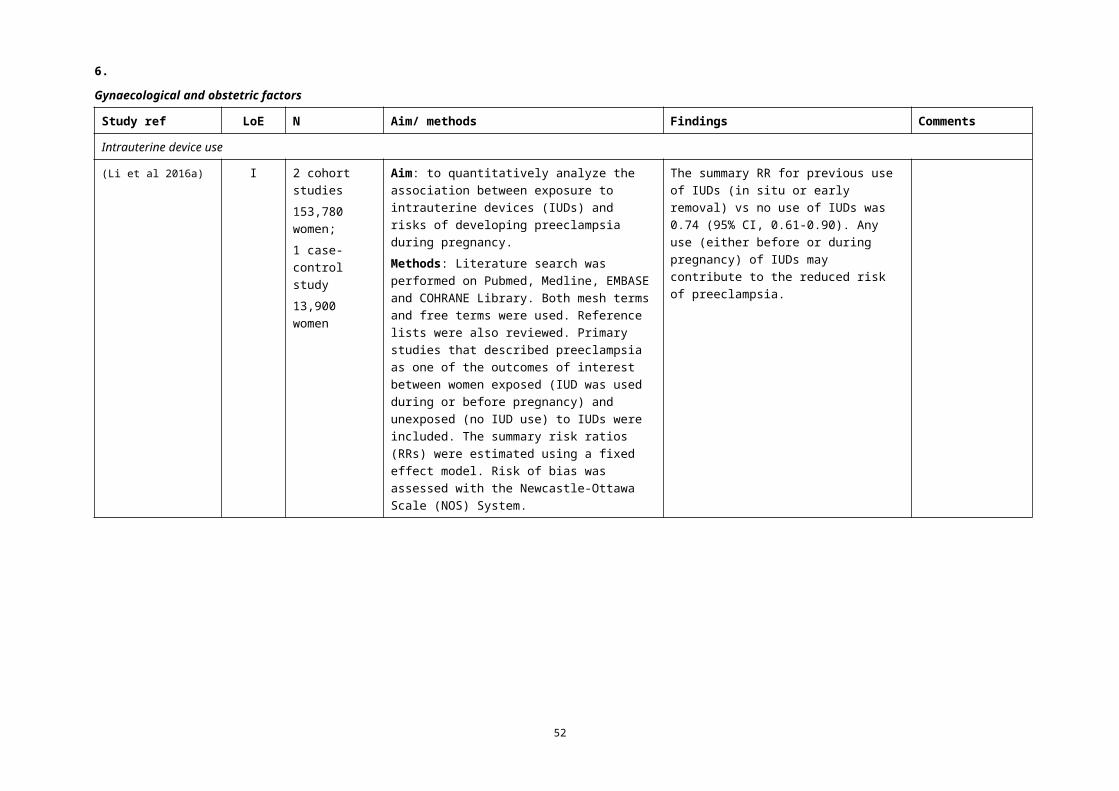
6.
Study ref LoE N Aim/ methods Findings Comments
(Sgolastra et al 2013)
I 15 studies (3 cohort; 12 case-control)
Studies have suggested controversial results regarding a possible association between pre-eclampsia (PE) and periodontal disease (PD) and no meta-analysis has been performed to clarify this issue.METHODS: A literature search of electronic databases was performed for articles published through March 24, 2013, followed by a manual search of several dental and medical journals. The meta-analysis was conducted according to the recommendations of the Cochrane Collaboration and PRISMA. Odds ratios (ORs) and 95% confidence intervals (CIs) were calculated. Heterogeneity was assessed with the chi(2)-based Cochran Q test and I(2) statistic. The level of significance was set at P <0.05.
A positive association was found between PE and PD (OR 2.17, 95%CI 1.38 to 3.41, P 0.0008). However, a high and significant heterogeneity was found (chi(2) 62.42, P<0.00001, I(2) 75%). In most cases, subgroup analysis had low power to detect significant differences between PE and non-PE groups. Based on the findings of the meta-analysis, PD appears to be a possible risk factor for PE. However, there are important differences in the definitions and diagnoses of PD and PE among the studies and a lack of good methodological quality
(Kunnen et al 2010) I 12 observational studies; 3 RCTs
Aim: to evaluate the possible relationship between periodontal disease and pre-eclampsia.Methods: A literature search of PubMed, EMBASE and CINAHL until August 2010 was conducted. It appeared difficult to compare these studies, due to variations in definitions of periodontal disease and pre-eclampsia, timing of periodontal examination and inadequate control for confounding factors.
Eight observational studies reported a positive association, while four studies found no association. None of the RCTs reported reductions in pre-eclamptic rate after periodontal therapy during pregnancy.The observed association in eight observational studies might be the result of induction of periodontal disease due to the pre-eclamptic state or it may be an epiphenomenon of an exaggerated inflammatory response to pregnancy.
52

6.
Study ref LoE N Aim/ methods Findings Comments
(Huang et al 2014) I 11 studies1,118 women with preeclampsia; 2,798 controls
Aim: to evaluate the association between maternal periodontal disease and the risk of preeclampsia.Methods: A literature search of PubMed and Embase was performed to identify relevant papers published before March 2013. Patients' periodontal status was examined at different time points during pregnancy or after delivery (at 14–32 weeks of gestation, within 48 h prior to or within 5 days after delivery). Pooled odds ratios (ORs) and corresponding 95% confidence intervals (CIs) were calculated for cases and controls. Cases were defined as women with concurrent hypertension and proteinuria after 20 weeks of gestation.
Women with periodontal disease before 32 weeks of gestation had a higher risk of developing preeclampsia than their counterparts without periodontal disease (OR 3.69; 95%CI 2.58 to 5.27). Periodontal disease within 48 h prior to delivery was associated with a higher risk of preeclampsia (OR 2.68; 95%CI 1.39 to 5.18). Pregnant women with periodontal disease within 5 days after delivery had a higher risk of preeclampsia than women without periodontal disease (OR 2.22; 95%CI 1.16 to 4.27).
53

6.Immunological factors
Study ref LoE N Aim/ methods Findings Comments
(Yang et al 2014) I 11 studies (IL-18)947 women16 studies (IFN-gamma)2,230 women
Aim: to investigate the relationship between preeclampsia (PE) and circulating interleukin-18 (IL-18) and interferon gamma (IFN-gamma).Method: Three electronic databases (PubMed, EMBASE, and Web of Science) were searched. Results:
There was no significant difference in the IL-18 levels in PE patients compared with controls. However, IFN-gamma was found to be significantly higher in women with PE than that in normotensive pregnant women (SMD 0.93; 95%CI 0.07 to 1.79). Furthermore, stratification by specimen type, quality score, method of estimation of mean and standard deviation, and whether sampling not in labor/premature rupture of membrane/infection also showed significant differences in standardized mean difference of IL-18, as well as IFN-gamma.
54

6.Micronutrient levels
Study ref LoE N Aim/ methods Findings Comments
Antioxidants
(Cohen et al 2015) I 58 studies Aim: To conduct a systematic review of the association between maternal antioxidant levels during pregnancy and preeclampsia or SGA.Methods: We searched PubMed, Embase, and several other databases from 1970-2013 for observational studies that measured maternal blood levels of non-enzymatic antioxidants (vitamins A, C, E, and carotenoids) during pregnancy or within 72 hours of delivery. Study quality was assessed using the Newcastle-Ottawa Scale and additional questions. We pooled the standardized mean difference (SMD) across studies, stratified by outcome and pregnancy trimester, and investigated heterogeneity using meta-regression.
Among studies that addressed preeclampsia, 16% measured levels prior to diagnosis. The SMDs for vitamins A, C, and E were significantly negative for overall preeclampsia, but not for mild or severe preeclampsia subtypes. Significant heterogeneity was observed in all meta-analyses and most could not be explained. Evidence for lower carotenoid antioxidants in preeclampsia was limited and inconclusive.
Most studies were small with important risk of bias.
55

6.
Study ref LoE N Aim/ methods Findings Comments
Vitamin D
(Hypponen et al 2013)
I Aim: To evaluate the role of vitamin D in the development of pre-eclampsia, we conducted a systematic review and meta-analysis including novel data from 2 large-scale epidemiological studies.Methods: PubMed, EMBASE and the Cochrane Central Register of Controlled Trials were searched for prospective observational studies of association between vitamin D supplementation or status (measured by maternal 25-hydroxyvitamin D, 25(OH)D) with a subsequent risk of pre-eclampsia, or randomised controlled trials using vitamin D supplementation to prevent pre-eclampsia. The Hungarian Case-Control Surveillance of Congenital Abnormalities (HCCSCA) and the Avon Longitudinal Study of Parents and Children (ALSPAC) were included in meta-analyses with published studies.
The meta-analysis of published studies with ALSPAC suggested an association between higher serum 25(OH)D levels and a reduced risk of pre-eclampsia (pooled OR 0.52; 95% CI 0.30 to 0.89, p=0.02, 6 studies). Randomised trials of supplementation were suggestive of protective association (pooled OR 0.66; 95%CI 0.52 to 0.83, p=0.001, 4 studies).
The quality of evidence is insufficient to determine a causal association, which highlights the need for adequately powered clinical trials.
56

6.
Study ref LoE N Aim/ methods Findings Comments
Copper
(Fan et al 2016) I 12 studies442 cases463 controls
Aim: to summarize the evidence from epidemiological studies for copper level and PE risk.Methods: Pertinent studies were identified by a search of PubMed and Web of Knowledge up to April 2016. Standardized mean difference (SMD) was performed to combine the results. Random-effect model (REM) was used. Publication bias was estimated using Egger's regression asymmetry test.
Our pooled results suggested that PE patients had a higher copper level compared with healthy pregnancy controls [summary SMD 0.69, 95%CI 0.54 to 0.84, I2 96.7%; P < 0.001]. The association was also significant in Asian population [SMD 0.73, 95%CI 0.57 to 0.90, I2 97.3%] and European populations [SMD 0.50, 95%CI 0.14 to 0.86, I2 58.9%]. After conducting the subgroup analysis and sensitive analysis, the results showed consistent significant association with the one based on all studies. No publication biases were found. Our analysis indicated that plasma or serum copper level in PE patients was significantly higher than in healthy pregnancy women.
All studies were observational
57
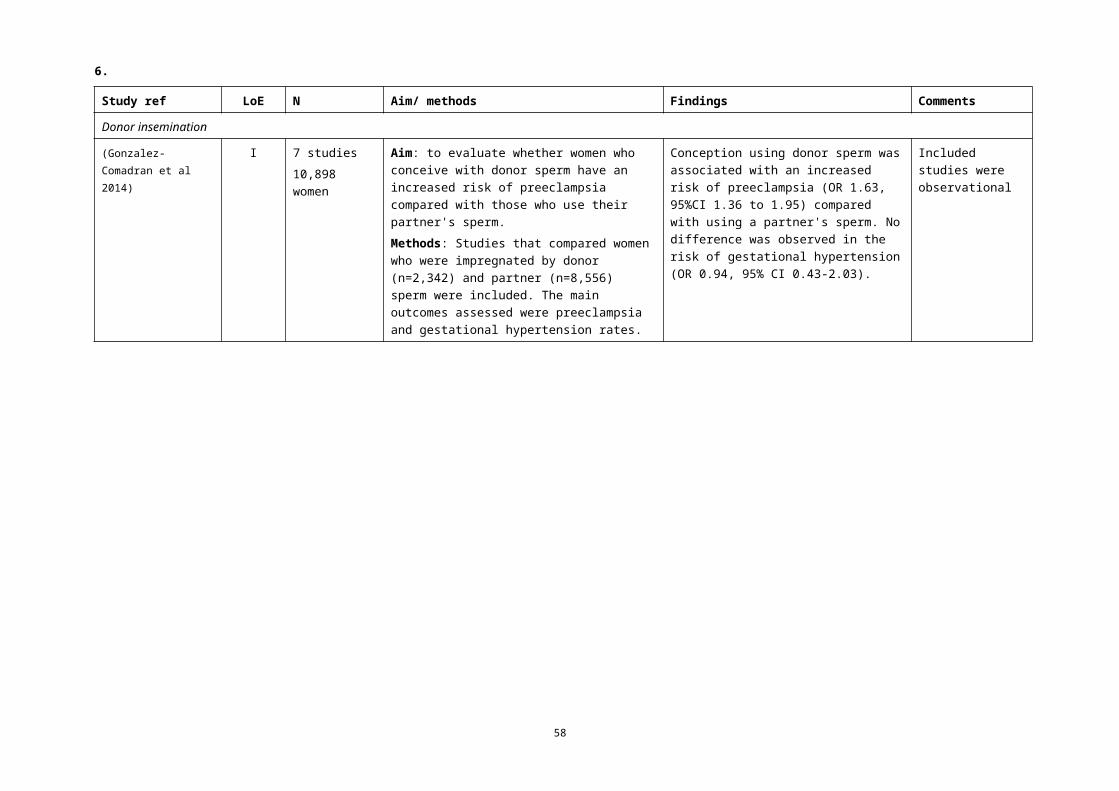
6.
Study ref LoE N Aim/ methods Findings Comments
Zinc
(Ma et al 2015) I 17 studies Aim: To evaluate the association between serum zinc level and pre-eclampsia.Methods: A systematic literature search was performed in PubMed, Web of Science and Embase for relevant available articles. The articles were limited to those in English from January 1990 to April 2015. The I2 was used to assess heterogeneity and the random effect model (REM) was adopted as the pooling method. The pooled standard mean difference (SMD) with 95% confidence interval (CI) was used.
Compared with healthy pregnancy controls, PE patients have lower serum zinc level in 14 studies about total PE (SMD –0.587; 95%CI –0.963 to –0.212; Z=3.06, p for Z=0.002; I2 88.4%, p for I2 <0.0001). In subgroup analysis, a lower serum zinc level in PE patients compared with healthy pregnancy controls was observed in studies conducted in Asia, studies with zinc level measured in serum, and studies involving fasting participants. The SMD did not differ significantly between studies with healthy pregnancy controls matched by individual age (yes or no), and by individual gestational age (yes or no), respectively.
All studies were observational
58

6.
Study ref LoE N Aim/ methods Findings Comments
Selenium
(Xu et al 2016) I 16 studies (13 observational; 3 RTCs)1,950
Aim: to compare the blood selenium level in patients with preeclampsia and healthy pregnant women, and to determine the effectiveness of selenium supplementation in preventing preeclampsia.Methods: We searched PubMed, ScienceDirect, the Cochrane Library, and relevant references for English language literature up to November 25, 2014. Mean difference from observational studies and relative risk from randomized controlled trials were meta-analyzed by a random-effect model.
Using a random-effect model, a statistically significant difference in blood selenium concentration of –6.47 mug/l (95%CI –11.24 to –1.7, p = 0.008) was seen after comparing the mean difference of observational studies. In RCTs, using a random-effect model, the relative risk for preeclampsia was 0.28 (0.09 to 0.84) for selenium supplementation (p=0.02). Evidence from observational studies indicates an inverse association of blood selenium level and the risk of preeclampsia. Supplementation with selenium significantly reduces the incidence of preeclampsia.
59
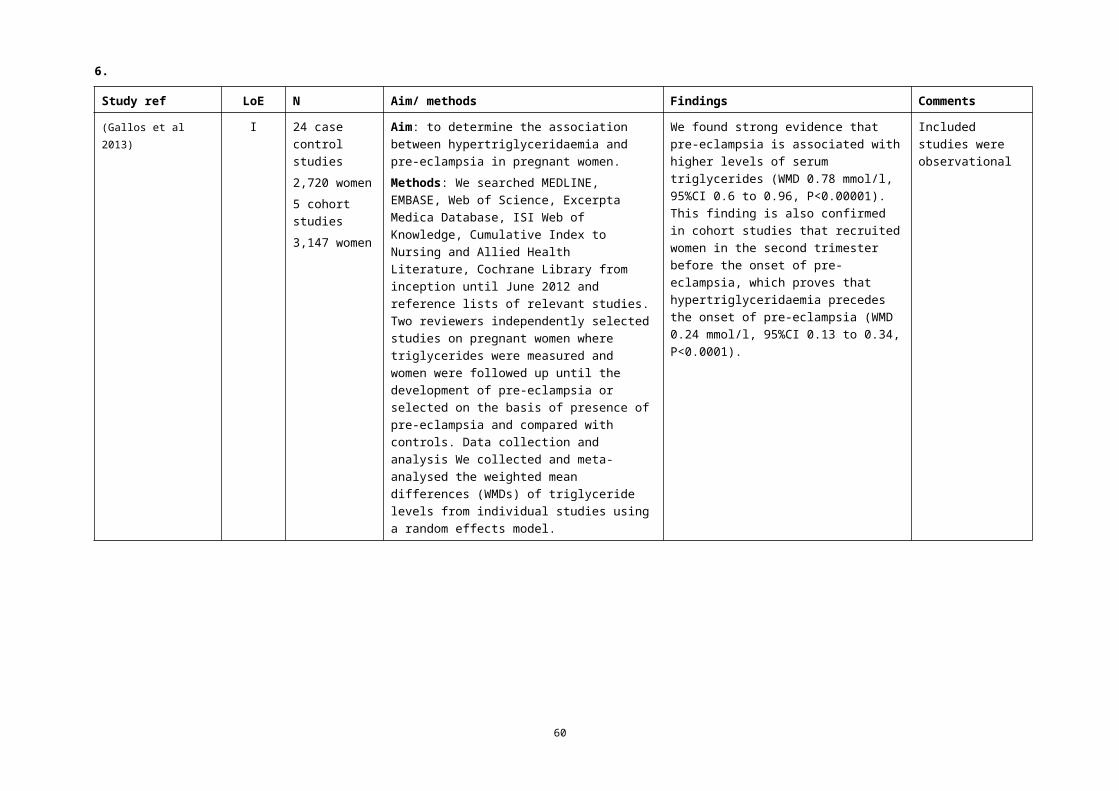
6.Shift work
Study ref LoE N Aim/ methods Findings Comments
(Palmer et al 2013) I 11 studies Aim: to assess the evidence relating to preterm delivery (PTD), low birth weight, small for gestational age (SGA), pre-eclampsia and gestational hypertension to five occupational exposures (working hours, shift work, lifting, standing and physical workload).Methods: We conducted a systematic search in Medline and Embase (1966 to 2011), updating a previous search. Where similar definitions of exposure and outcome existed we calculated pooled estimates of RR.
For pre-eclampsia/ gestational hypertension the evidence base remains insufficient.
1.2 Excluded studies for prevalence
Study Reason for exclusion
Chen, J. S., et al. (2012). "Prevalence of pre-eclampsia, pregnancy hypertension and gestational diabetes in population-based data: impact of different ascertainment methods on outcomes." Australian & New Zealand Journal of Obstetrics & Gynaecology 52(1): 91-95.
Does not answer research question
Chen, J. S., et al. (2013). "Pregnancy outcomes in women with juvenile idiopathic arthritis: A population-based study." Rheumatology (United Kingdom) 52(6): 1119-1125.
Not specific to target population
Costa, F. (2014). "First and second trimester prediction of pre-eclampsia." Journal of Medical Imaging and Radiation Oncology 58: 90.
Does not meet criteria for grading
Gresham, E., et al. (2015). "Agreement between self-reported perinatal outcomes and administrative data in New South Wales, Australia." BMC Pregnancy & Childbirth 15: 161.
Does not answer research question
Murphy, V. E., et al. (2013). "A prospective study of respiratory viral infection in pregnant women with and without asthma." Chest 144(2): 420-427.
Does not answer research question
Roberts, C. L., et al. (2016). "Risk of recurrent early onset preeclampsia." American Journal of Obstetrics and Gynecology 1): S412.
Does not meet criteria for grading
60

6.
Study Reason for exclusion
Tooher, J., et al. (2016). "Hypertension in pregnancy and long-term cardiovascular mortality: A retrospective cohort study." American Journal of Obstetrics and Gynecology 214(6): 722.e721-722.e726.
Does not answer research question
Vlachadis, N., et al. (2014). "The incidence of preeclampsia and eclampsia in Australia: 2000 through 2008." American Journal of Obstetrics and Gynecology 210(2): 173-174
Letter
Von Katterfeld, B., et al. (2012). "Maternal and neonatal outcomes associated with gestational diabetes in women from culturally and linguistically diverse backgrounds in Western Australia." Diabetic Medicine 29(3): 372-377
Not specific to target population
1.3 Excluded studies for risk factors
Study Reason for exclusion
Adams, J. W., et al. (2016). "A systematic review of the effect of HIV infection and antiretroviral therapy on the risk of pre-eclampsia." International Journal of Gynecology and Obstetrics 133(1): 17-21.
Not specific to target population
Afshani, N., et al. (2013). "Utility of B-type natriuretic peptides in preeclampsia: A systematic review." International Journal of Obstetric Anesthesia 22(2): 96-103.
Does not answer research question
Allen, R. E., et al. (2014). "Abnormal blood biomarkers in early pregnancy are associated with preeclampsia: A meta-analysis." European Journal of Obstetrics Gynecology and Reproductive Biology 182: 194-201.
Does not answer research question (included in screening)
Arain N, Mirza WA, Aslam M (2015) Review-Vitamin D and the prevention of preeclampsia: A systematic review. Pak J Pharm Sci 28(3): 1015-21.
Overlap with higher quality systematic review
Cheng, D., et al. (2013). "Vascular endothelial growth factor +936C/T, -634G/C, -2578C/A, and -1154G/A polymorphisms with risk of preeclampsia: A meta-analysis." PLoS ONE 8 (11) (no pagination)(e78173).
Relevant to research to practice
Dai, B., et al. (2013). "The polymorphism for endothelial nitric oxide synthase gene, the level of nitric oxide and the risk for pre-eclampsia: A meta-analysis." Gene 519(1): 187-193.
Relevant to research to practice
Dodd, J. M., et al. (2014). "Preventing pre-eclampsia - Are dietary factors the key?" BMC Medicine 12 (1) (no pagination)(176).
Narrative review
Fong, F. M., et al. (2014). "Maternal genotype and severe preeclampsia: A HuGE review." American Journal of Epidemiology 180(4): 335-345.
Relevant to research not practice
Fong, F., et al. (2012). "Genetic factors affecting risk of pre-eclampsia and its complications-a hugenet field overview and meta-analysis." Archives of Disease in Childhood: Fetal and Neonatal Edition 97: A118-A119.
Does not meet criteria for grading
61

6.
Study Reason for exclusion
Gong, L. L., et al. (2014). "Lack of association between matrix metalloproteinase-9 gene-1562C/T polymorphism and preeclampsia: A meta-analysis." Hypertension in Pregnancy 33(4): 389-394.
Relevant to research not practice
Hlimi, T. (2015). "Association of anemia, pre-eclampsia and eclampsia with seasonality: A realist systematic review." Health and Place 31: 180-192.
Not specific to target population
Homer CS, Thornton C, Scarf VL et al (2014) Birthplace in New South Wales, Australia: an analysis of perinatal outcomes using routinely collected data. BMC Pregnancy Childbirth 14: 206.
Does not answer research question
Huang, Q. T., et al. (2016). "Chronic hepatitis B infection is associated with decreased risk of preeclampsia: A meta-analysis of observational studies." Cellular Physiology and Biochemistry 38(5): 1860-1868.
Not specific to target population
Huppertz, B., et al. (2013). "Placental protein 13 (PP13): A new biological target shifting individualized risk assessment to personalized drug design combating pre-eclampsia." Human Reproduction Update 19(4): 391-405.
Narrative review
Katsi V., et al. (2015). "Preeclampsia: What Does the Father Have to Do with It?" Current Hypertension Reports 17 (8) (no pagination)(60).
Narrative review
Li, X., et al. (2014). "Methylenetetrahydrofolate reductase gene C677T, A1298C polymorphisms and pre-eclampsia risk: A meta-analysis." Molecular Biology Reports 41(8): 5435-5448.
Relevant to research not practice
Li, X., et al. (2014). "Polymorphisms and plasma level of transforming growth factor-beta 1 and risk for preeclampsia: A systematic review." PLoS ONE 9 (5) (no pagination)(e97230)
Relevant to research not practice
Li, Y., et al. (2015). "The effects of gene polymorphisms in angiotensin II receptors on pregnancy-induced hypertension and preeclampsia: A systematic review and meta-analysis." Hypertension in Pregnancy 34(2): 241-260.
Relevant to research not practice
Lin, R., et al. (2012). "Angiotensinogen Gene M235T and T174M Polymorphisms and Susceptibility of Pre-Eclampsia: A Meta-Analysis." Annals of Human Genetics 76(5): 377-386.
Relevant to research not practice
Liu, H. Q., et al. (2016). "Predictive Value of Free beta-hCG Multiple of the Median for Women with Preeclampsia." Gynecologic and Obstetric Investigation 81(2): 137-147.
Does not answer research question (also included in screening studies)
Mogos, M. F., et al. (2016). "Pre-eclampsia and immigrant status: A systematic review and meta-analysis of epidemiological studies." Reproductive Sciences 1): 301A.
Does not meet criteria for grading
Ni, S., et al. (2012). "AGT M235T polymorphism contributes to risk of preeclampsia: Evidence from a meta-analysis." JRAAS - Journal of the Renin-Angiotensin-Aldosterone System 13(3): 379-386.
Relevant to research not practice
62

6.
Study Reason for exclusion
Owusu, J. T., et al. (2013). "Association of maternal sleep practices with pre-eclampsia, low birth weight, and stillbirth among Ghanaian women." International Journal of Gynecology and Obstetrics 121(3): 261-265.
Narrative review
Pabalan, N., et al. (2015). "Meta-analysis of the human leukocyte antigen-G (HLA-G) 14 bp insertion/deletion polymorphism as a risk factor for preeclampsia." Tissue Antigens 86(3): 186-194.
Relevant to research not practice
Pergialiotis, V., et al. (2016). "An evaluation of calprotectin as serum marker of preeclampsia: a systematic review of observational studies." Inflammation Research 65(2): 95-102.
Does not answer research question
Pergialiotis, V., et al. (2016). "Maternal cardiac troponin levels in pre-eclampsia: a systematic review." Journal of Maternal-Fetal and Neonatal Medicine 29(20): 3386-3390.
Does not answer research question
Qi HP, Fraser WD, Luo ZC et al (2013) Endothelial nitric oxide synthase gene polymorphisms and risk of preeclampsia. Am J Perinatol 30(10): 795-804.
Relevant to research not practice
Rebelo, F., et al. (2012). "C-reactive protein and later preeclampsia: Systematic review and meta-analysis taking into account the nutritional status." Journal of Hypertension 30: e287.
Does not meet criteria for grading
Simon, E., et al. (2013). "Mixing Nulliparous and Multiparous Women in Randomised Controlled Trials of Preeclampsia Prevention Is Debatable: Evidence from a Systematic Review." PLoS ONE 8 (6) (no pagination)(e66677).
Does not answer research question
Singh MD, Thomas P, Owens J et al (2015) Potential role of folate in pre-eclampsia. Nutr Rev 73(10): 694-722. Does not answer research question
Spracklen, C. N., et al. (2016). "Genetic predisposition to elevated levels of C-reactive protein is associated with a decreased risk for preeclampsia." Hypertension in Pregnancy: 1-10.
Relevant to research not practice
Storgaard, M. B., et al. (2015). "Risk of preeclampsia and hypertensive disorders of pregnancy (HDP) in singleton and twin oocyte donation (OD) pregnancies-a systematic review and meta-analysis." Human Reproduction 30: i363-i364.
Does not meet criteria for grading
Tabesh M, Salehi-Abargouei A, Tabesh M et al (2013) Maternal vitamin D status and risk of pre-eclampsia: a systematic review and meta-analysis. J Clin Endocrinol Metab 98(8): 3165-73.
Overlap with higher quality systematic review
Vatish, M., et al. (2012). "Association between raised triglycerides and pre-eclampsia: A meta analysis." Archives of Disease in Childhood: Fetal and Neonatal Edition 97: A36.
Does not meet criteria for grading
Wang, X. M., et al. (2013). "Methylenetetrahydrofolate reductase (MTHFR) gene C677T polymorphism and risk of preeclampsia: An updated meta-analysis based on 51 studies." Archives of Medical Research 44(3): 159-168.
Relevant to research not practice
63

6.
Study Reason for exclusion
Wang, X., et al. (2014). "Association between thrombophilia gene polymorphisms and preeclampsia: A meta-analysis." PLoS ONE 9 (6) (no pagination)(e100789).
Relevant to research not practice
Wei, S. Q., et al. (2012). "Endothelial nitric oxide synthase (eNOS) gene polymorphisms and risk for preeclampsia: A metaanalysis." American Journal of Obstetrics and Gynecology 1): S351-S352.
Does not meet criteria for grading
Wei, S. Q., et al. (2012). "Polymorphisms in the microsomal epoxide hydrolase gene and the risk of preeclampsia: A meta-analysis." Reproductive Sciences 1): 374A.
Does not meet criteria for grading
Wei, S. Q., et al. (2013). "Maternal vitamin D status and risk of preeclampia: A systematic review and meta-analysis." American Journal of Obstetrics and Gynecology 208 (1 SUPPL.1): S305.
Does not meet criteria for grading
Wu, X., et al. (2015). "Folate metabolism gene polymorphisms MTHFR C677T and A1298C and risk for preeclampsia: a meta-analysis." Journal of Assisted Reproduction & Genetics 32(5): 797-805.
Relevant to research not practice
Xia, X. P., et al. (2012). "Meta-analysis of the methylenetetrahydrofolate reductase C677T polymorphism and susceptibility to pre-eclampsia." Hypertension Research 35(12): 1129-1134.
Relevant to research not practice
Yang, W., et al. (2014). "Evaluation of association of maternal IL-10 polymorphisms with risk of preeclampsia by A meta-analysis." Journal of cellular and molecular medicine 18(12): 2466-2477.
Relevant to research not practice
Zhang, G., et al. (2016). "Association between gene polymorphisms on chromosome 1 and susceptibility to pre-Eclampsia: An updated meta-analysis." Medical Science Monitor 22: 2202-2214.
Relevant to research not practice
Zhu Q, Zhang L, Chen X et al (2016) Association between zinc level and the risk of preeclampsia: a meta-analysis. Arch Gynecol Obstet 293(2): 377-82.
Overlap with higher quality systematic review
64

7.
2 Screening
2.1 Evidence summary Results of the previous reviewThe same questions on screening for pre-eclampsia were asked in the literature review for Module II of the guidelines (Australian Health Ministers' Advisory Council 2014) and the identified evidence informed the narrative.Results of the current reviewThe primary focus of this review was on screening/tests in the first trimester. Tests conducted in the second and third trimesters are described but did not lend themselves to the same degree of analysis. Novel tests were considered as relevant to research rather than clinical practice and excluded from the analysis.Individual biochemical markers in the first trimesterStudies were largely consistent in finding an association between pre-eclampsia and abnormal levels of pregnancy associated plasma protein A (PAPP-A) (Saxena et al 2013; Allen et al 2014; Ceylan et al 2014; Jelliffe-Pawlowski et al 2015; Kirbas et al 2015; Litwińska et al 2015; Yliniemi et al 2015), placental growth factor (PlGF) (Allen et al 2014; Litwińska et al 2015), placental protein 13 (PP13) (Allen et al 2014; Meiri et al 2014) and inhibin-A (Allen et al 2014). However meta-analyses found that, when used alone, these biomarkers had very low sensitivity in predicting pre-eclampsia (Wu et al 2015; Zhong et al 2015). One study found an association between pre-eclampsia and abnormal levels of beta-human chorionic gonadotropin (β-hCG) (Mikat et al 2012) but another found low detection rates (Litwińska et al 2015).One study found an association between pre-eclampsia and abnormal levels of tumour necrosis factor receptor 1 (TNF-R1) (Allen et al 2014) but a meta-analysis found that this biomarker had very low sensitivity in predicting pre-eclampsia (Wu et al 2015).Meta-analyses found an association between pre-eclampsia and abnormal levels of endoglin, soluble fms-like tyrosine kinase-1 (sFIT-1) and pentraxin (Allen et al 2014) and low predictive value with a disintegrin and metalloprotease 12 (ADAM-12) (Wu et al 2015).Single observational studies found an association between pre-eclampsia and total hCG (Jelliffe-Pawlowski et al 2015) and neutrophil to lymphocyte ratio (Kirbas et al 2015) and no significant difference in levels of nerve growth factor (Sepulveda-Martinez et al 2016), activin-A (Lai et al 2013a), copeptin, midregional proatrial natriuretic peptide, procalcitonin (Birdir et al 2015) of cell-free fetal DNA (Contro et al 2016).Algorithms/models in the first trimesterA systematic review that critically assessed methods to develop first trimester risk prediction models for pre-eclampsia noted that the reliability and validity of models may be limited by methodological deficiencies (Brunelli & Prefumo 2015). Four of the studies evaluated are included in this review: (Di Lorenzo et al 2012; Wright et al 2012; Parra-Cordero et al 2013; Scazzocchio et al 2013). An external validation study (Oliveira et al 2014a) found lower performance than reported in two of the studies included in this review (Parra-Cordero et al 2013; Scazzocchio et al 2013).The observational studies identified through his review were heterogeneous in terms of models investigated and how they were reported, limiting comparison between studies.Screening by maternal characteristics alone gave detection rates of 35 to 77% for any pre-eclampsia (Verghese et al 2012; Wright et al 2015), 40 to 49% for early onset and 38 to 54% for late onset pre-eclampsia (Wright et al 2015; O'Gorman et al 2016).When biophysical markers were added to maternal characteristics, detection rates for any pre-eclampsia and early onset pre-eclampsia were 38 and 50% with UtA Doppler (Sepulveda-Martinez et al 2016) and 57 and 90% with mean arterial pressure (MAP) and uterine artery pulsatility index (UtA PI) (Wright et al 2012).When biochemical markers were added to maternal characteristics, detection rates for early onset pre-eclampsia with a fixed 10% false positive rate (FPR) were 67% with PIGF and beta-hCG (Di Lorenzo et al 2012) and 34% with PAPP-A and RBP4 (Yliniemi et al 2015).
65

7.
A combination of maternal characteristics, PIGF and UtA Doppler gave detection rates of 60% for any pre-eclampsia (Di Lorenzo et al 2012) and 47 and 29% for early and late onset pre-eclampsia (Parra-Cordero et al 2013). A combination of maternal characteristics, PAPP-A and UtA Doppler gave an AUC of 0.76 (Goetzinger et al 2014).Maternal characteristics combined with PAPP-A and MAP gave AUCs of 0.82 and 0.83 for any pre-eclampsia and early onset pre-eclampsia, respectively (Baschat et al 2014). Maternal characteristics with diastolic BP and PIGF gave an AUC of 0.78 (Gabbay-Benziv et al 2016). The inclusion of %hCG with nulliparity, PAPP-A, PIGF and MAP gave higher AUCs for early onset (0.87 vs 0.81) and late onset (0.805 vs 0.756) pre-eclampsia (Keikkala et al 2016).The highest detection rates were found when maternal characteristics were combined with biochemical and both blood pressure and ultrasound testing. The combination of maternal characteristics, PIGF, sFlT-1, MAP and UtA Doppler with a fixed FPR of 10% gave a detection rate of 91% for early onset and 76% for late onset pre-eclampsia (Crovetto et al 2015b). These rates decreased with the addition of VEGF and endoglin (89 and 69%) (Crovetto et al 2014) or LHCGR (83 and 75%) (Crovetto et al 2015a) and were lower when sFIT-1 was not included (75 and 47%) (O'Gorman et al 2016).The Fetal Medicine Foundation algorithm (maternal characteristics, PAPP-A, MAP, UtA PI) had a detection rate for early onset pre-eclampsia of 92% in an Australian population (Park et al 2013) and had similar performance to the PREDICTOR algorithm in predicting requirement for delivery at ≥34 weeks (Skrastad et al 2015). A combination of algorithms for pre-eclampsia and small-for-gestational age had a detection rate of 95% for early onset and 46% for late onset pre-eclampsia (Poon et al 2013).Combinations of maternal characteristics, PAPP-A and UtA Doppler had detection rates for early and late-onset pre-eclampsia of 81 and 40% when combined with blood pressure and free-hCG (Scazzocchio et al 2013) and 44 and 94% when combined with MAP and PIGF (Verma et al 2016).One study found differences in maternal risk factors between nulliparous and multiparous women (Moon & Odibo 2015).Individual markers in the second and third trimestersSingle studies found correlations between the levels of a range of biochemical and biophysical markers and risk of pre-eclampsia. PIGF in the second trimester was considered in more than one study and these were consistent in finding that lower levels were associated with higher risk (Ghosh et al 2012; Dover et al 2013; Ghosh et al 2013), with AUCs of 0.755 and 0.901 for any pre-eclampsia and severe early onset pre-eclampsia (Andersen et al 2016). The sFIT:PIGF ratio at 20–34 weeks had AUCs of 0.74 for any pre-eclampsia and 0.883 for severe early onset pre-eclampsia (Andersen et al 2016) and showed high sensitivity and specificity for onset of pre-eclampsia within 4 weeks at 19–25 weeks (100; 100%), 26–31 weeks (83; 99%) (Ohkuchi et al 2013) and 24–36 weeks (66.2; 83.1%)(Zeisler et al 2016). A systematic review also found high sensitivity in screening for early onset pre-eclampsia (AUC 0.98) (Liu et al 2015b).Combined factors in the second and third trimestersThere was no combination of markers used in the second trimester that was examined in more than one study. As with the first trimester, the highest detection rates were found in models that combined maternal characteristics with biochemical and biophysical markers.There was only one combination of tests used in the third trimester that was investigated in more than one study — maternal characteristics, UtA PI, MAP, PIGF and sFLT-1 at 30–34 weeks. With a fixed 5% false positive rate, the studies found a 98% detection rate for early onset pre-eclampsia or pre-eclampsia requiring delivery in 4 weeks (Garcia-Tizon Larroca et al 2014; Tsiakkas et al 2016). Testing/screening at more than one time-pointSingle observational studies that explored sequential tests for pre-eclampsia found:• sequential application of cardiovascular and metabolic risk profiles in screen positives reduced false
positives by 26% (Gabbay-Benziv et al 2016)
66

7.
• detection of early onset, late onset and any pre-eclampsia with MAP adjusted for maternal characteristics measured at 11–13 weeks (74%, 63%, 49%) increased when MAP measurement was repeated at 20–24 weeks (84%, 66%, 52%) (Gallo et al 2014)
• a three-step approach based on maternal factors at 16–23 weeks and plasma levels of sFlt-1 and PlGF at 19-31 weeks predicted imminent onset of pre-eclampsia at 19–25 weeks (sensitivity 100%; specificity 99.8%; PPV 50%; NPV 100%) and 26–31 weeks (sensitivity 83%; specificity 99.1%; PPV 42%; NPV 99.9%) (Hirashima et al 2014)
• a combination of activin A and PlGF at 11–13 weeks and UtA PI at 22–24 weeks gave an AUC 0.915 (95% CI 0.812 to 0.928; P<0.001) with a sensitivity of 91% at a specificity of 82% (Li et al 2016b)
• the difference between mean second trimester and mean first trimester UtA PI gave AUCs for early onset and late onset pre-eclampsia of 0.851 and 0.786, respectively (Napolitano et al 2012).
Harms and benefits of screeningAn observational study found a benefit from combining screening and treatment with low-dose aspirin (150 mg at night) commenced immediately after screening (11 to 13+6 weeks), with early-onset pre-eclampsia occurring in 0.4% of untreated women and 0.04% of treated women (P<0.01) (Park et al 2015). Evidence from the previous review also found a preventive effect of aspirin on early-onset pre-eclampsia.No evidence was found specific to the harms of screening.Timing of screeningOne observational study found no between trimester associations that would provide important improvements in prediction (Lambert-Messerlian et al 2014). However, as there is some evidence for a preventive effect of aspirin treatment commenced in the first trimester, earlier screening seems preferable.Testing for proteinuriaNo new evidence was identified. Cost effectiveness of screeningAn analysis of studies on the health economics of screening, diagnosis and treatment options in pre-eclampsia found that novel biomarkers in screening for and diagnosing preeclampsia show promise, but their accuracy is a major driver of cost effectiveness, as is prevalence (Zakiyah et al 2015). Universal screening for pre-eclampsia using a biomarker will be feasible only when accuracy is significantly increased.Advice to the EWGAlthough it is clear that maternal characteristics combined with biochemical and biophysical markers is more sensitive in detecting pre-eclampsia than maternal characteristics alone, there is insufficient evidence to support a recommendation on any particular approach.
67

8.
Summary of effects of abnormal levels of individual biochemical markers in the first trimester on risk of pre-eclampsia
Biochemical marker
Outcome Effect (confidence interval) Reference
PAPP-A Normal pregnancy OR 0.2; p=0.002 (Saxena et al 2013)
Any pre-eclampsia OR 2.1 (1.6 to 2.6) (Allen et al 2014)
Any pre-eclampsia No significant difference (P>0.05) (Mikat et al 2012)
Any pre-eclampsia Pooled sensitivity 0.30 (0.29 to 0.32); specificity 0.92 (0.92 to 0.92)
(Wu et al 2015)
Early onset RR 4.2; 95%CI 3.0 to 5.9 (Jelliffe-Pawlowski et al 2015)
Early onset OR 4.8 (2.5, 22.5 (Allen et al 2014)
Early onset Significant inverse correlation; p=0.003 (Ceylan et al 2014)
Early onset Pooled sensitivity 0.26 (0.19 to 0.34); specificity 0.90 (0.89 to 0.90)
(Wu et al 2015)
Early onset 48.3% detection rate with 10% FPR (Litwińska et al 2015)
Late onset Significant reverse correlation; p=0.02 (Ceylan et al 2014)
Late onset Pooled sensitivity 0.19 (0.14 to 0.24); specificity 0.89 (0.89 to 0.90)
(Wu et al 2015)
Late onset 25.9% detection rate with 10% FPR (Litwińska et al 2015)
MOMs in early onset pre-eclampsia vs control 0.80 vs 1.05; p=0.005 (Yliniemi et al 2015)
Mean MOMs in severe pre-eclampsia vs control 0.77±0.12 vs 1.18±0.85; p<0.001 (Kirbas et al 2015)
Mean MOMs in mild pre-eclampsia vs control 0.79±0.33 vs 1.18±0.85; p<0.001 (Kirbas et al 2015)
PlGF Any pre-eclampsia Sensitivity 40% (37 to 43%); specificity 90% (88 to 91%) (Zhong et al 2015)
Any pre-eclampsia Pooled sensitivity 0.65 (0.63 to 0.67); specificity 0.89 (0.89 to 0.89)
(Wu et al 2015)
Early onset OR 3.4 (1.6, 7.2) (Allen et al 2014)
68

8.
Biochemical marker
Outcome Effect (confidence interval) Reference
Early onset Pooled sensitivity 0.37 (0.27 to 0.48); specificity 0.79 (0.78 to 0.81)
(Wu et al 2015)
Early onset 57% detection rate with 10% FPR (Litwińska et al 2015)
Late onset Sensitivity 56% (52 to 61%); specificity 91% (89 to 92%) (Zhong et al 2015)
Late onset 34.4% detection rate with 10% FPR (Litwińska et al 2015)
PP13 Any pre-eclampsia OR 4.4, 95%CI 2.9 to 6.8 (Allen et al 2014)
Any pre-eclampsia Median 0.2MoM vs 0.83MoM; p<0.0001 (Meiri et al 2014)
Any pre-eclampsia Pooled sensitivity 0.37 (0.33 to 0.41); specificity 0.88 (0.87 to 0.89)
(Wu et al 2015)
Early onset OR 7.5, 95% CI 2.5 to 22.5 (Allen et al 2014)
Early onset Pooled sensitivity 0.59 (0.48 to 0.69); specificity 0.92 (0.91 to 0.93)
(Wu et al 2015)
Early onset No significant difference; p=0.7 (Ceylan et al 2014)
Late onset No significant difference; p=0.6 (Ceylan et al 2014)
Inhibin-A Any pre-eclampsia OR 3.6, 95% CI 1.7, 7.6 (Allen et al 2014)
Any pre-eclampsia Pooled sensitivity 0.32 (0.25 to 0.39); specificity 0.90 (0.89 to 0.91)
(Wu et al 2015)
Early onset OR 4.1, 95% CI 1.9, 8.8 (Allen et al 2014)
Late onset OR 1.9, 95% CI 1.4, 2.8 (Allen et al 2014)
β-hCG Any pre-eclampsia OR 2.12; 95%CI 1.07 to 4.21; p=0.03 (Mikat et al 2012)
Early onset 20.3% detection rate with 10% FPR (Litwińska et al 2015)
Late onset 6.9% detection rate with 10% FPR (Litwińska et al 2015)
TNF-R1 Any pre-eclampsia (cut-off value >14 pg/mL) Sensitivity 67.8%; specificity 98%; PPV 79.4%; NPV 96.4% (Gomaa et al 2015)
69

8.
Biochemical marker
Outcome Effect (confidence interval) Reference
Early onset 2.62±0.67 vs 2.04±0.42 ng/mL (Maia E Holanda Moura et al 2016)
Late onset 1.094 MoM vs 1.003 MoM (Mosimann et al 2013)
Late onset 2.12±0.56 vs 2.04±0.42 ng/mL (Maia E Holanda Moura et al 2016)
Endoglin Early onset OR 18.5, 95% CI 8.4, 41.0 (Allen et al 2014)
Late onset OR 2.1, 95% CI 1.9, 2.4 (Allen et al 2014)
sFlt-1 Any pre-eclampsia OR 1.3, 95%CI 2.9 to 6.8 (Allen et al 2014)
Pentraxin Any pre-eclampsia OR 5.3, 95%CI 1.9, 15.0 (Allen et al 2014)
NGF Median MoM any pre-eclampsia vs control 0.97 (0.13 to 3.36) vs 1.00 (0.20 to 2.94) (Sepulveda-Martinez et al 2016)
Median MoM early onset vs control 0.62 (0.16 to 2.19) vs 1.00 (0.20 to 2.94) (Sepulveda-Martinez et al 2016)
Total hCG Early onset RR 3.3; 95%CI 2.1 to 5.2 (Jelliffe-Pawlowski et al 2015)
NLR Severe 4.54±2.98 vs 3.23±1.33; p<0.001 (Kirbas et al 2015)
ADAM-12 Any pre-eclampsia Pooled sensitivity 0.26 (0.21 to 0.32); specificity 0.84 (0.82 to 0.86)
(Wu et al 2015)
Activin-A Late onset No significant difference (Lai et al 2013a)
Copeptin Any pre-eclampsia No significant difference (Birdir et al 2015)
MR-proANP Any pre-eclampsia No significant difference (Birdir et al 2015)
PCT Any pre-eclampsia No significant difference (Birdir et al 2015)
cffDNA Any pre-eclampsia No significant DR (Contro et al 2016)
Early onset DR 18%; FPR 10% (Contro et al 2016)Abbreviations: ADAM-12= a disintegrin and metalloprotease 12; cffDNA=cell-free fetal DNA; hCG=human chorionic gonadotropin; IQR: interquartile range; MoM=multiple of the median; MR-proANP=midregional proatrial natriuretic peptide; NGF=nerve growth factor; NLR=neutrophil to lymphocyte ratio; NPV=negative predictive value; OR=odds ratio; PAPP-A=pregnancy associated plasma protein A; PCT= procalcitonin; PlGF=placental growth factor; PP-13=placental protein 13; PPV=positive predictive value; RR; relative risk; sFlT-1=soluble fms-like tyrosine kinase-1; TNF=tumour necrosis factor; TNF-R1=tumour necrosis factor receptor 1
70
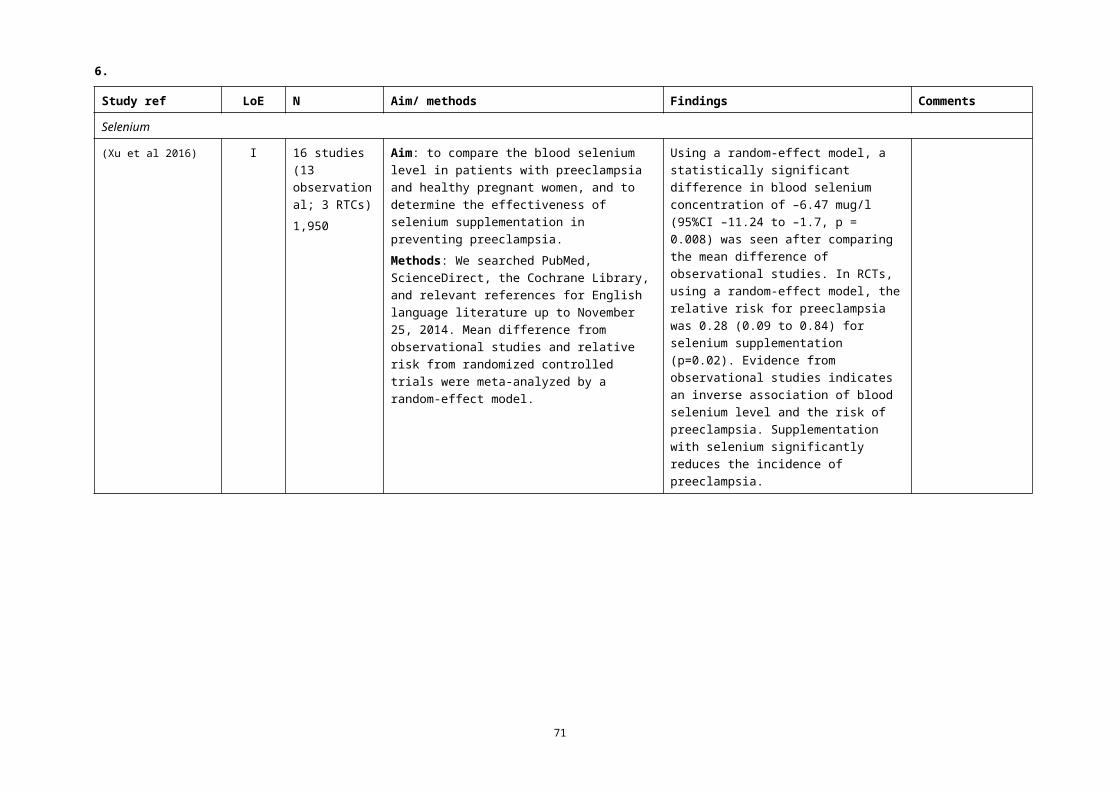
8.
71

8.
Summary of diagnostic accuracy of algorithms/models in the first trimester
Reference Outcome Factors included FPR Findings
Maternal characteristics alone
(Maia E Holanda Moura et al 2016)
Early onset maternal characteristics alone — AUC 0.744 (0.592 to 0.897)
Late onset — AUC 0.701 (0.636 to 0.765)
(O'Gorman et al 2016) Early onset maternal characteristics alone 10% DR 49% (95%CI 43 to 55%)
Late onset 10% DR 38% (95%CI 34 to 41%)
(Wright et al 2015) Any pre-eclampsia
maternal characteristics (competing risks) 10% DR 40%
maternal characteristics (NICE) 10% DR 35%
Early onset maternal characteristics (competing risks) 10% DR 48%
maternal characteristics (NICE) 10% DR 40%
Late onset maternal characteristics (competing risks) 10% DR 54%
maternal characteristics (NICE) 10% DR 44%
(Verghese et al 2012) Any pre-eclampsia
maternal characteristics (NICE) — sensitivity 77% (65 to 87); specificity 54% (44 to 64); PPV 7%
maternal characteristics (PRECOG) — sensitivity 59% (46 to 71); specificity 81% (73 to 88); PPV 11%
Serum markers plus ultrasound
(Gomaa et al 2015) Any pre-eclampsia
TNF-alpha and UtA Doppler — sensitivity 88.6%, specificity 100%, PPV 100%, NPV 98.6%.
(Yucel et al 2016) Any pre-eclampsia
UtA PI, placental volume, PAPP-A — ≥1 parameter abnormal: sensitivity 92.68%; specificity 85.20%
— ≥2 parameters abnormal: sensitivity 85.37%; specificity 98.89%
Maternal characteristics plus ultrasound and/or MAP
(Sepulveda-Martinez et al Early onset previous pre-eclampsia, chronic 10% DR 50%
72
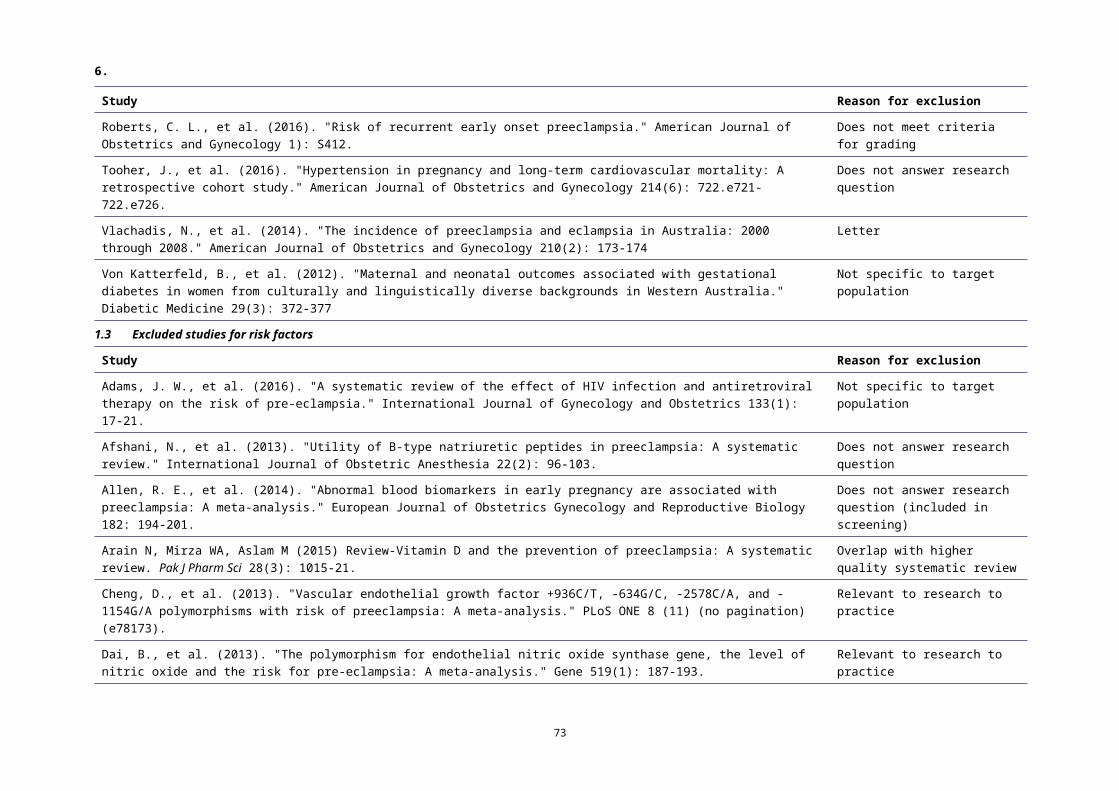
8.
Reference Outcome Factors included FPR Findings
2016) hypertension and UtA DopplerAny pre-eclampsia
10% DR 38%
(Wright et al 2012) Early onset maternal characteristics, MAP, UtA PI 10% DR 90%
Any pre-eclampsia
10% DR 57%
Maternal characteristics plus serum biomarkers
(Di Lorenzo et al 2012) Early onset chronic hypertension, PlGF, free beta-hCG 10% DR 67%
(Maia E Holanda Moura et al 2016)
Early onset maternal characteristics, TNF-R1 — AUC 0.817 (0.677 to 0.958)
Late onset — AUC 0.701 (0.0.636 to 0.765)
(Yliniemi et al 2015) Early onset maternal characteristics, PAPP-A 10% DR 23% (12 to 35)
maternal characteristics, RBP4 10% DR 29% (18 to 43)
maternal characteristics, PAPP-A, RBP4 10% DR 34% (23 to 46)
Maternal characteristics plus serum biomarkers and Doppler
(Di Lorenzo et al 2012) Any pre-eclampsia
chronic hypertension, PlGF, UtA PI 20% DR 60%
(Goetzinger et al 2014) Any pre-eclampsia
maternal characteristics, PAPP-A, UtA Doppler
— AUC 0.76 (95%CI 0.69 to 0.83)
(Parra-Cordero et al 2013) Early onset maternal characteristics, PlGF, UtA Doppler 10% DR 47%
Late onset 10% DR 29%
Maternal characteristics plus serum biomarkers and blood pressure
(Baschat et al 2014) Any pre-eclampsia
Maternal characteristics, PAPP-A, MAP 10% AUC 0.82; sensitivity 49%
Early onset 10% AUC 0.83; sensitivity 55%
(Gabbay-Benziv et al 2016) Any pre-eclampsia
nulliparity, prior preeclampsia, body mass index, diastolic BP, PlGF
— AUC 0.784 (95%CI 0.721 to 0.847)
73

8.
Reference Outcome Factors included FPR Findings
(Keikkala et al 2016) Early onset nulliparity, PAPP-A, PlGF, %hCG-h, MAP — AUC 0.870 (95%CI 0.750–0.988)
Late onset — AUC 0.805 (95%CI 0.699 to 0.912)
Early onset nulliparity, PAPP-A, PlGF, MAP — AUC 0.810 (95% CI 0.682–0.938)
Late onset — AUC 0.756 (95% CI 0.651–0.861)
Maternal characteristics plus serum biomarkers and biophysical testing
(Crovetto et al 2014) Early onset maternal characteristics, PlGF, sFlt-1, VEGF, endoglin, MAP, UtA Doppler
10% DR 88.9% (AUC 0.958; 95%CI 0.920 to 0.996)
Late onset maternal characteristics, PlGF, sFlt-1, MAP, UtA Doppler
10% DR 69% (AUC 0.888; 95%CI 0.840 to 0.936)
(Crovetto et al 2015a) Early onset maternal characteristics, PlGF, sFlt-1, LHCGR, MAP, UtA Doppler
10% DR 83% (AUC 0.961; 95%CI 0.921 to 1.00)
Late onset 10% DR 75% (AUC 0.923; 95%CI 0.871 to 0.976
(Crovetto et al 2015b) Early onset maternal characteristics, PlGF, sFlt-1, MAP, UtA Doppler
10% DR 91.2% (AUC 0.98; 95%CI: 0.97–0.99)
Late onset 10% DR 76.4% (AUC 0.87; 95%CI: 0.84–0.90)
(O'Gorman et al 2016) Early onset maternal characteristics, PlGF, MAP, UtA PI 10% DR 75% (95%CI 70 to 80%)
Late onset 10% DR 47% (95%CI 44 to 51%)
(Park et al 2013) Early onset Fetal Medicine Foundation algorithm (maternal characteristics, PAPP-A, MAP, UtA PI)
10% DR 91.7%
(Skrastad et al 2015) Delivery <37 wks Fetal Medicine Foundation algorithm 10% AUC 0.94 (0.86 to 1.0); sensitivity 80% (95%CI 28.4 to 99.5)
Delivery ≥34 wks Fetal Medicine Foundation algorithm 10% AUC 0.74 (0.63 to 0.85); sensitivity 30% (95%CI 11.9 to 54.3)
PREDICTOR posterior algorithm 10% AUC 0.71 (0.60 to 0.83); sensitivity 30% (95%CI 19.1 to 54.3)
(Poon et al 2013) Early onset maternal characteristics, PAPP-A, PlGF, MAP, UtA PI using combination of SGA (1:150) and PE (1:200) algorithms
10.9% DR 95.3%
Late onset 10.9% DR 45.6%
(Scazzocchio et al 2013) Early onset maternal characteristics, PAPP-A, free-hCG 10% DR 80.8% (AUC 0.95; 95%CI 0.94 to 0.95)
74

8.
Reference Outcome Factors included FPR Findings
at 8–12 weeks; BP, UtA Doppler at 11.0–13.6 weeks
Late onset 10% DR 39.6% (AUC 0.71; 95%CI 0.66 to 0.76)
(Verma et al 2016) Early onset maternal characteristics, PAPP-A, PlGF, MAP, UtA PI
0.0% DR 44.4%
Late onset 2.3% DR 93.8%
(Moon & Odibo 2015) Any pre-eclampsia in nulliparous women
maternal characteristics (maternal age, pre-pregnancy BMI, pre-existing diabetes), PAPP-A, ADAM13, PP13, MAP, UtA PI
— AUC 0.88 (0.80 to 0.94)
Any pre-eclampsia in multiparous women
maternal characteristics (maternal age, past history of pre-eclampsia), PAPP-A, ADAM12, PP13, MAP, UtA PI
— AUC 0.84 (0.75 to 0.91)
Abbreviations: ADAM-12= a disintegrin and metalloprotease 12; AUC=area under the curve; BP=blood pressure; hCG=human chorionic gonadotropin; MAP=mean arterial pressure; NICE=National Institute of Health and Clinical Excellence; NLR=neutrophil to lymphocyte ratio; NPV=negative predictive value; PAPP-A=pregnancy associated plasma protein A; PlGF=placental growth factor; PP-13=placental protein 13; PPV=positive predictive value; PRECOG=Pre-eclampsia Community; RBP4=retinol-binding protein 4; sFlT-1=soluble fms-like tyrosine kinase-1; SGA=small-for-gestational age; TNF=tumour necrosis factor; TNF-R1=tumour necrosis factor receptor 1Summary of effects of abnormal levels of individual biochemical and biophysical markers in the second and third trimesters on risk of pre-eclampsia
Marker Timing Outcome Effect (confidence interval) Reference
PlGF 16–19 wks PlGF level <62.5 vs ≥62.5 pg/mL OR 7.4 (2.226 to 24.601); p<0.001 (Dover et al 2013)
20–22 wks PlGF level <155 pg/mL vs >155 pg/mL OR 8.35 (1.79 to 18.94; P=0.007) (Ghosh et al 2013)
26–28 wks PlGF level normotensive vs mild vs severe 315.71±318.65 vs 52.5±26.83 vs 9±5.07 (Ghosh et al 2012)
20–34 wks Severe early onset AUC 0.901 (0.807 to 0.995) (Andersen et al 2016)
20–34 wks Any pre-eclampsia AUC 0.755 (0.710 to 0.801)
sFlt-1:PlGF ratio — Any pre-eclampsia Pooled sensitivity 0.78; pooled specificity 0.84 (Liu et al 2015b)
20–34 wks Severe early onset AUC 0.883 (0.760 to 1.000) (Andersen et al 2016)
20–34 wks Any pre-eclampsia AUC 0.704 (0.651 to 0.756)
75

8.
Marker Timing Outcome Effect (confidence interval) Reference
24–36 wks No pre-eclampsia in the following wk(cut-off <38)
NPV 99.3% (97.9 to 99.9), sensitivity 80.0% (51.9 to 95.7) specificity 78.3% (74.6 to 81.7)
(Zeisler et al 2016)
Diagnosis of pre-eclampsia within 4 wks(cut-off >38)
PPV 36.7% (28.4 to 45.7), sensitivity 66.2% (54.0 to 77.0) specificity 83.1% (79.4 to 86.3)
19–25 wks Onset within 4 wks (threshold 2.5th percentile)
Sensitivity 100%; specificity 100%; PPV 100% (Ohkuchi et al 2013)
26–31 wks Onset within 4 wks (threshold 2.5th percentile)
Sensitivity 83%; specificity 99.4%; PPV 50%
PAPP-A Median 16.7 wks
Level in any pre-eclampsia vs control 0.97 MoM (0.73 to 1.25) (not significant) (Bestwick et al 2012)
inhibin 16.8±3.2 wks OR in early onset vs late onset OR 4.17 vs 3.08; P <0.001 (Olsen et al 2012)
hCG 16.8±3.2 wks OR in early onset vs late onset OR 3.6 vs 2.0; P <0.001 (Olsen et al 2012)
ADAM-12 Median 16.7 wks
Level in any pre-eclampsia vs control 1.01 MoM (0.91 to 1.13) (not significant) (Bestwick et al 2012)
AFP 16.8±3.2 wks OR in early onset vs late onset OR 8.04 vs 2.91; P <0.001 (Olsen et al 2012)
Calcium-creatinine ratio
20–24 wks Mean pre-eclamptic vs control 0.07±0.007 vs 0.16±0.006, P<0.001 (Vahdat et al 2012)
Cerulopasmin 18–20 wks Level in any pre-eclampsia vs control 1185.87±343.19 vs 1559.88±208.45; p=0.001 (Dey et al 2013)
UtA Doppler velocimetry
24–26 wks Any pre-eclampsia in high risk women RR 5.427 (2.272 to 12.958) (Bhattacharyya et al 2012)
24–26 wks Any pre-eclampsia in low risk women RR 13.65 (5.669 to 32.865) (Bhattacharyya et al 2012)
cffDNA 15–28 wks Any pre-eclampsia DR 37% (Contro et al 2016)
17–28 wks Early onset DR 68.8% (Contro et al 2016)
sENG 30–33 wks Level in any pre-eclampsia vs controls 1.39 (IQR 0.94 to 2.18) vs 0.95 (IQR 0.77 to 1.19) (Lai et al 2013d)
IPG-P — Prediction 2 wks before diagnosis Sensitivity 84.2%, specificity 83.6% (Dawonauth et al 2014)
— Diagnosis of pre-eclampsia AUC 0.99, sensitivity 96.7%, specificity 94.8%
76

8.
Abbreviations: ADAM-12= a disintegrin and metalloprotease 12; AFP=alpha fetoprotein; AUC=area under the curve; cffDNA=cell-free fetal DNA; DR=detection rate; hCG=human chorionic gonadotropin; IPG-P=inositol phosphoglycan-P; IQR=interquartile range; MoM=multiple of the median; NPV=negative predictive value; OR=odds ratio; PAPP-A=pregnancy associated plasma protein A; PlGF=placental growth factor; PP-13=placental protein 13; RR; relative risk; sENG=soluble endoglin; sFlT-1=soluble fms-like tyrosine kinase-1; UtA=uterine artery
Summary of diagnostic accuracy of algorithms/models in the second trimester
Reference Outcome Timing of test Factors included FPR Findings
Serum markers alone
(Hui et al 2012) Any pre-eclampsia
unspecified AFP, hCG — Positive likelihood ratio 5.68 (0.73 to 43.97)
Serum markers plus ultrasound
(Fouad Gomaa et al 2016)
Any pre-eclampsia
<20 wks Serum C3 and UtA Doppler — sensitivity 100%, specificity 97.4%, PPV 80%, NPV 100%
(Puttapitakpong & Phupong 2016)
Any pre-eclampsia
16–18 wks Ang-2 plus UtA Doppler — sensitivity 24.0%, specificity 94.4%, PPV 22.2%, NPV 94.9%,
Early onset — sensitivity 57.1%, specificity 94.1%, PPV 14.8%, NPV 99.2%
(Kulmala & Phupong 2014)
Any pre-eclampsia in women aged 38.4±2.5 y
16–18 wks sFlt-1 plus UtA Doppler — sensitivity 28.6%, specificity 95.7%, PPV 23.5%, NPV 96.6%
Early onset in women aged 38.4±2.5 y
— sensitivity 80%, specificity 95.8%, PPV 23.5%, NPV 99.7%
Maternal characteristics plus biophysical testing
(Zanello et al 2014) Any pre-eclampsia
14–18 wks maternal characterisitics, MAP 10% DR 46.8%
(Prajapati & Maitra 2013)
Late onset 22–24 + 6 wks past history of pre-eclampsia, MAP, UtA Doppler
— AUC 0.721 (0.611 to 0.83)
77

8.
Reference Outcome Timing of test Factors included FPR Findings
Maternal characteristics plus serum biomarkers
(Yu et al 2014) Early onset 17.99±1.17 wks Maternal characteristics, risk co-efficient for trisomy 21 (biochemical markers)
AUC 0.792 (95 % CI 0.701–0.882)
Maternal characteristics plus serum biomarkers and biophysical testing
(Zanello et al 2014) Any pre-eclampsia
14–18 wks maternal characteristics, MAP, PLAC1
10% DR 62.8%
(Gallo et al 2016) Onset <32 wks 19–24 wks maternal characteristics, UtA PI, MAP, PlGF
10% DR 99%
Onset <37 wks 10% DR 85%
Onset >37 wks 10% DR 46%
(Parra-Cordero et al 2014)
Early onset 22–25 wks maternal characteristics, UtA Doppler, OGTT
5% DR 74%
Intermediate onset (34–37 wks)
5% DR 42%
Late onset 5% DR 21%
Abbreviations: ADAM-12= a disintegrin and metalloprotease 12; AFP=alpha fetoprotein; Ang-2=angiopoietin-2; AUC=area under the curve; cffDNA=cell-free fetal DNA; DR=detection rate; hCG=human chorionic gonadotropin; IPG-P=inositol phosphoglycan-P; IQR=interquartile range; MAP=mean arterial pressure; MoM=multiple of the median; NPV=negative predictive value; OR=odds ratio; PAPP-A=pregnancy associated plasma protein A; PlGF=placental growth factor; PLAC1=placenta-specific 1 gene; PP-13=placental protein 13; PPV=positive predictive value; RR; relative risk; sENG=soluble endoglin; sFlT-1=soluble fms-like tyrosine kinase-1; UtA=uterine arterySummary of diagnostic accuracy of algorithms/models in the third trimester
Reference Outcome Timing of test Factors included FPR Findings
Maternal characteristics plus biophysical testing
(Lai et al 2013b) Intermediate onset 30–33 wks maternal characteristics, MAP 10% DR 70.3%
Late onset 10% DR 62.0%
(Lai et al 2013c) Intermediate onset 30–33 wks maternal characteristics, UtA PI 10% DR 70.3%
Late onset 10% DR 54.6%
78

8.
Reference Outcome Timing of test Factors included FPR Findings
(Tayyar et al 2014) Delivery within 4 wks 30–33 wks maternal characteristics, MAP, UtA PI 5% DR 89.7% (78.8 to 96.1)
Delivery within 6 wks 5% DR 65.4% (56.7 to 73.4)
Delivery within 8 wks 5% DR 53.3% (47.2 to 59.4)
Maternal characteristics plus serum biomarkers
(Lai et al 2013d) Intermediate onset 30–33 wks maternal characteristics, soluble endoglin
10% DR 64.3% (35.2 to 87.1)
Late onset 10% DR 50% (32.9–67.1)
(Lai et al 2014) Delivery within 4 wks 30–33 wks maternal characteristics, PlGF, sFlt-1 5% DR 100% (82.4 to 100)
Delivery within 6 wks 5% DR 76% (61.1 to 86.7)
Delivery within 8 wks 5% DR 62% (51.4 to 72.2)
(Mosimann et al 2013) Any pre-eclampsia 30–33 wks maternal characteristics, TNF-R1 10% DR 40% (26.4 to 54.8)
(Lai et al 2013a) Any pre-eclampsia 30–33 wks maternal characteristics, activin 10% DR 50% (35.5 to 64.5)
Maternal characteristics plus serum biomarkers and biophysical testing
(Garcia-Tizon Larroca et al 2014)
Any pre-eclampsia 30–33 wks maternal characteristics, UtA PI, MAP, PlGF, sFlt-1
5% DR 66%
Delivery required in 4 wks
5% DR 98%
Delivery required in 6 wks
5% DR 86%
(Tsiakkas et al 2016) Early onset 30–34 wks Maternal characteristics, UtA PI, MAP, PIGF, sFLT-1
5% DR 98% (88 to 100)
Late onset 5% DR 49% (42 to 57)
Abbreviations: DR=detection rate; MAP=mean arterial pressure; PlGF=placental growth factor; PP-13=placental protein 13; sFlT-1=soluble fms-like tyrosine kinase-1; UtA PI=uterine artery pulsatility index
79

9.
Q3 What is the predictive and diagnostic test accuracy of screening for pre-eclampsia?
Individual biochemical markers in the first trimester
Study ref
Design LoE N Aim/methods Results Comments
(Allen et al 2014)
SLR IV 30 studies65,538 women
Aim: to evaluate the strength of association between abnormal levels of first trimester maternal blood biomarkers and the risk of preeclampsia.Methods: We searched MEDLINE, EMBASE and Cochrane databases from inception until April 2013. Studies that assessed the association between any abnormal maternal blood biomarker in the first trimester and preeclampsia were included. Two independent reviewers selected studies, extracted data and assessed the quality. Results were summarized as pooled odds ratios with 95% confidence intervals.
Twenty four studies assessed preeclampsia of any onset, 10 studied early onset preeclampsia and seven evaluated late onset preeclampsia (after 34 weeks of gestation). The biomarkers PAPP-A (OR 2.1, 95%CI 1.6 to 2.6), PP13 (OR 4.4, 95%CI 2.9 to 6.8), sFlt-1 (OR 1.3, 95%CI 2.9 to 6.8), pentraxin (OR 5.3, 95%CI 1.9, 15.0) and inhibin-A (OR 3.6, 95% CI 1.7, 7.6) were significantly associated with any preeclampsia. The odds of early onset preeclampsia were significantly increased when the biomarkers PlGF (OR 3.4, 95% CI 1.6, 7.2), PAPP-A (OR 4.8, 95% CI 2.5, 22.5), PP13 (OR 7.5, 95% CI 2.5, 22.5), soluble endoglin (OR 18.5, 95% CI 8.4, 41.0) and inhibin-A (OR 4.1, 95% CI 1.9, 8.8) were abnormal. Two biomarkers, soluble endoglin (OR 2.1, 95% CI 1.9, 2.4) and inhibin-A (OR 1.9, 95% CI 1.4, 2.8) were significantly associated with late onset preeclampsia.
Review of cohort and case-control studies
80

9.
Study ref
Design LoE N Aim/methods Results Comments
(Liu et al 2015a)
SLR IV 12 studies8,935
Aim: To investigate the clinical value of using the multiple of the median (MoM) of free β-human chorionic gonadotropin (β-hCG) concentrations in women with normal pregnancy and PE.Methods: This study was based on a dataset available from published studies, and the relevant studies were retrieved from multiple electronic databases. Data were extracted from case-control studies; a random-effects model was employed, and standardized mean difference and 95% confidence intervals were calculated.
Statistical analysis revealed a higher MoM of β-hCG serum levels in women with PE. Ethnicity subgroup analysis showed that the MoM of serum β-hCG levels was significantly higher (SMD 2.48; 95%CI 0.81 to 4.15) in women with PE in both Asian and Caucasian populations.
Review of case-control studies; serum samples taken at different stages of pregnancy: T1 (n=4 studies); T2 (n=5 studies); T3 (n=1 study); unclear (n=2 studies)
(Wu et al 2015)
SLR IV 147 studies
Aim: to assess the accuracy of all biomarkers that have been evaluated so far during the first and early second trimester of pregnancy to predict PE.Methods: systematic review and meta-analysis
We found low predictive values using individual biomarkers which included ADAM-12, inhibin-A, PAPP-A, PlGF and PP-13. The pooled sensitivity of all single biomarkers was 0.40 (95% CI 0.39–0.41) at a false positive rate of 10%. The area under the Summary of Receiver Operating Characteristics Curve (SROC) was 0.786 (SE 0.02). When a combination model was used, the predictive value improved to an area under the SROC of 0.893 (SE 0.03).
Although there are multiple potential biomarkers for PE their efficacy has been inconsistent and comparisons are difficult because of heterogeneity between different studies.
81

9.
Study ref
Design LoE N Aim/methods Results Comments
(Zhong et al 2015)
SLR IV 16 studies
Aim: to investigate the accuracy of serum biochemical markers (PAPP-A, hCG, PlGF, PP13) used in first trimester serum screening in predicting preelampsia, small for gestational age (SGA) and preterm delivery.Methods: The data sources included Medline, Embase, Cochrane library, Medion, hand searching of relevant journals, reference list checking of included articles and contact with experts.
The results showed low predictive accuracy overall. For any preeclampsia, the best predictor was PlGF: sensitivity 40% (37 to 43%), specificity 90% (88 to 91%). The predictive value of serum markers for early preeclampsia was better than that of late preeclampsia: sensitivity 56% (52 to 61%), specificity 91% (89 to 92%).
First trimester screening analytes have low predictive accuracy for pre-eclampsia. However, the predictive value of first trimester analytes is not worse than that of the second trimester markers.
82

9.
Study ref
Design LoE N Aim/methods Results Comments
(Birdir et al 2015)
Cohort III-2 135 Aim: to investigate the potential value of maternal serum copeptin, midregional proatrial natriuretic peptide (MR-proANP) and Procalcitonin (PCT) levels at 11-13 weeks' gestation in the prediction of preeclampsia (PE).Methods: Maternal serum concentration of copeptin, MR-proANP and PCT were measured at 11-13 weeks' gestation in cases of PE (n=35) and controls (n=100). The PE group was divided into early-onset PE and late-onset PE. From the regression model, the value in each case and control was expressed as a multiple of the expected median (MoM). The Mann-Whitney test was used to determine the significance of differences in the median MoM in each outcome group from that in the controls.
In the PE group, compared to controls, maternal serum concentrations of copeptin, MR-proANP and PCT were not significantly different.
83

9.
Study ref
Design LoE N Aim/methods Results Comments
(Ceylan et al 2014)
Case-control
III-2 120 Aim: to evaluate placental protein-13 (PP-13) and pregnancy-associated plasma protein-A (PAPP-A) in first trimester maternal serum, for predicting pre-eclampsia.Methods: A prospective case-control study included women with pre-eclampsia (n=30) and pregnant controls (n=90). Women with pre-eclampsia were divided into two subgroups: early (n=9) and late-onset (n=21), and PP-13 and PAPP-A levels were compared between the groups and the comparison of risks for pre-eclampsia were calculated.
There was a significant inverse correlation between PAPP-A and late pre-eclampsia (p=0.003), with a cut-off value of 0.805 (ROC analysis area under curve 0.751). There was a significant reverse correlation between PAPP-A and early pre-eclampsia (p=0.02). There was no significant relationship between PP13 and early pre-eclampsia, nor with late pre-eclampsia (p=0.7, p=0.6, respectively). It was concluded that neither of these markers can serve as a sufficient and reliable screening test of pre-eclampsia because of inadequate sensitivity in the Turkish pregnant population.
(Gomaa et al 2015)
Cohort III-2 500 Aim: to find indicators with sufficient positive predictive value.Methods: Serum TNF-alpha and uterine artery Doppler were measured at 11-13 weeks in low-risk pregnant women.
TNF-alpha cut-off value >14. pg/mL had a sensitivity of 67.8% and a specificity of 98% in predicting PE with PPV of 79.4% and NPV of 96.4%. Mean uterine artery PI >1.7 had a 100% sensitivity and 84.4% specificity in predicting PE, with a PPV of 41.7% and NPV of 100%.
84

9.
Study ref
Design LoE N Aim/methods Results Comments
(Jelliffe-Pawlowski et al 2015)
Cohort III-2 129,488 Aim: to evaluate the relationship between early-onset severe preeclampsia and first trimester serum levels of pregnancy-associated plasma protein A (PAPP-A) and total human chorionic gonadotropin (hCG).Methods: Levels of first trimester PAPP-A and total hCG in maternal serum were measured in a sample of singleton pregnancies without chromosomal defects that had integrated prenatal serum screening in 2009 and 2010. Logistic binomial regression was used to estimate the relative risk (RR).
Regardless of parity, women with low first trimester PAPP-A or high total hCG were at increased risk for early-onset severe preeclampsia. Women with low PAPP-A (multiple of the median [MoM] ≤ the 10th percentile in nulliparous or ≤ the 5th percentile in multiparous) or high total hCG (MoM ≥ the 90th percentile in nulliparous or ≥ the 95th percentile in multiparous) were at more than a threefold increased risk for early-onset severe preeclampsia (RR 4.2; 95%CI 3.0 to 5.9 and RR 3.3; 95%CI 2.1 to 5.2, respectively).
85

9.
Study ref
Design LoE N Aim/methods Results Comments
(Kirbas et al 2015)
Cohort III-2 614 Aim: To investigate hematological changes in early pregnancy, using simple complete blood count (CBC) and blood concentrations of beta-human chorionic gonadotropin (beta-hCG) and pregnancy-associated plasma protein-A (PAPP-A) to determine whether these measures are of any value in the prediction and early diagnosis of preeclampsia.Methods: Pregnant women with preeclampsia (288 with mild disease and 326 with severe disease) and 320 uncomplicated pregnant women were included. Blood samples for routine CBC and first trimester screen, which combines PAPP-A and free s-hCG blood concentrations, were analysed.
The neutrophil to lymphocyte ratio values were significantly higher in the severe preeclampsia group compared with the control group (4.54±2.98 vs 3.23±1.33; p<0.001). Levels of PAPP-A were lower in women who developed severe (0.77±0.12 vs 1.18±0.85; p<0.001) or mild (0.79±0.33 vs 1.18±0.85; p<0.001) preeclampsia.
86

9.
Study ref
Design LoE N Aim/methods Results Comments
(Litwińska et al 2015)
Case-control
III-2 180 Aim: to evaluate the relationship between the concentrations of placental growth factor (PlGF), pregnancy-associated plasma protein A (PAPP-A) and free beta-human chorionic gonadotropin (beta-hCG) and the risk of early and late preeclampsia (PE) and intrauterine fetal growth restriction (IUGR).Methods: Women between 11+0 and 13+6 weeks gestation were recruited (22 suffered early PE, 29 late PE). Data analyzed during the study included maternal history and concentrations of PAPP-A, PlGF and beta-hCG.
Detection rates with a fixed false positive rate of 10% for early onset pre-eclampsia were PAPP-A MoM 48.3%; PlGF MoM 57%; beta-hCG MoM 20.3% and for late onset pre-eclampsia were PAPP-A MoM 25.9%; PlGF MoM 34.4%; beta-hCG 6.9%.
(Maia E Holanda Moura et al 2016)
Case-control
III-2 426 Aim: To examine whether the maternal serum concentration of the soluble receptor-1 of tumor necrosis factor-alpha (TNF-R1) at 11-13 + 6 weeks of gestation is a predictor of development of pre-eclampsia (PE).Methods: TNF-R1 was measured at 11+0 to 13+6 weeks and values expressed as MoM adjusted for maternal factors. Distributions of log TNF-R1 MoM in the control group and hypertensive disorders (early-PE [ePE], late-PE [lPE] and gestational hypertension [GH]) groups were compared. Logistic regression analysis was employed.
Median concentration of TNF-R1 (ng/ml) was higher in ePE (2.62 +/- 0.67), lPE (2.12 +/- 0.56) and GH (2.19 +/- 0.45) compared to controls (2.04 +/- 0.42), p = 0.001.
87

9.
Study ref
Design LoE N Aim/methods Results Comments
(Meiri et al 2014)
Cohort III-2 82063 with pre-eclampsia
Aim: to evaluate placental protein 13 (PP13) and risk factors (RFs) as markers for predicting preeclampsia (PE) and use of aspirin for PE prevention.Methods: First-trimester pregnancy screening was based on having PP13 level < 0.4 multiple of the median (MoM) and/or at least one major risk factor (RF) for PE. Management was by routine care or combined with daily treatment with 75 mg aspirin between 14 and 35 weeks of gestation.
Median PP13 level was 0.2MoM in the PE group compared with 0.83MoM among unaffected and 1.0MoM in unaffected not treated with aspirin (P<0.0001). Low PP13 was a better predictor for PE versus major RFs, particularly for young nuliparous.
Don’t have full text
(Mikat et al 2012)
Cohort III-2 155 Aim: to investigate a possible correlation between the expression of the placenta-secreted hormones, beta-subunit of human chorionic gonadotrophin (betahCG) and pregnancy-associated plasma protein A (PAPP-A), during the first trimester screening and the development of preeclampsia.Methods. Women between 11 0 and 13 6 weeks of gestation were enrolled. PAPP-A and betahCG levels were measured using the KRYPTOR system.
The serum levels of betahCG were significantly higher in pregnancies which subsequently developed preeclampsia (OR 2.12; 95%CI 1.07 to 4.21; p = 0.03). The PAPP-A concentration did not differ significantly in pregnancies complicated by preeclampsia than in uncomplicated pregnancies (p>0.05).
88

9.
Study ref
Design LoE N Aim/methods Results Comments
(Mosimann et al 2013)
Case-control
III-2 300 Aim: To investigate the potential value of maternal serum concentration of tumour necrosis factor receptor 1 (TNF-R1) at 30-33 weeks' gestation in the prediction of preeclampsia (PE) developing at or after 34 weeks.Methods: Serum TNF-R1 was measured at 11-13 and at 30-33 weeks' gestation in a case-control study of 50 cases that developed PE at or after 34 weeks and 250 unaffected controls. The measured values of TNF-R1 were converted into multiples of the normal median (MoM) and the MoM values in the PE and control groups were compared.
The median MoM TNF-R1 was significantly increased at 11-13 weeks (1.094 MoM versus 1.003 MoM).
89

9.
Study ref
Design LoE N Aim/methods Results Comments
(Saxena et al 2013)
Cohort III-2 427 Aim: to test the hypothesis that first trimester PAPP-A levels correlate with soluble fms-like tyrosine kinase-1 (sFlt-1) levels, an angiogenic marker associated with preeclampsia, throughout pregnancy.Methods: sFlt-1 levels were measured longitudinally in 427 women with singleton pregnancies in all three trimesters. First trimester PAPP-A and PAPP-A Multiples of Median (MOM) were measured. Student’s T and Wilcoxon tests compared preeclamptic and normal pregnancies. A linear mixed model assessed the relationship between log PAPP-A and serial log sFlt-1 levels.
PAPP-A and PAPP-A MOM levels were significantly lower in preeclamptic (n=19), versus normal pregnancies (p=0.02). Although mean third trimester sFlt-1 levels were significantly higher in preeclampsia (p=0.002), first trimester sFlt-1 levels were lower in women who developed preeclampsia, compared with normal pregnancies (p=0.03). PAPP-A levels correlated significantly with serial sFlt-1 levels. Importantly, low first trimester PAPP-A MOM predicted decreased odds of normal pregnancy (OR 0.2, p=0.002).
90

9.
Study ref
Design LoE N Aim/methods Results Comments
(Sepulveda-Martinez et al 2016)
Cohort III-2 137 Aim: to determine the role of nerve growth factor (NGF) in the first-trimester screening for preeclampsia (PE).Methods: UtAD was determined transvaginally. Maternal concentrations of NGF were assessed in women who subsequently developed PE (n=42) and controls (n=95). Quantile and multivariate regression analyses were performed for the NGF and UtAD adjustment and expressed as the multiple of the median (MoM) of the unaffected group. Logistic regression analysis was conducted.
The maternal plasma concentration of NGF exhibited a trend towards lower values in patients who subsequently developed early-onset PE (e-PE) compared to controls (10.7 vs. 38.2 pg/ml, respectively; p = not significant). The median MoM NGF in the all-PE, e-PE and control groups was 0.97 (95% CI 0.13–3.36), 0.62 (95% CI 0.16–2.19) and 1.00 (95% CI 0.20–2.94), respectively (p = not significant).
(Widmer et al 2015)
Cohort III-2 5,121 Aim: To assess the accuracy of angiogenic biomarkers to predict pre-eclampsia.Methods: Pregnant women with risk factors for pre-eclampsia (nulliparity, diabetes, previous pre-eclampsia, chronic hypertension) had their serum tested for sFlt-1, PlGF and sEng levels and their urine for PlGF levels at <20, 23-27 or 32-35 weeks' gestation (index tests, results blinded from carers). Women were monitored for signs of pre-eclampsia appearing after 20 weeks' gestation. Early pre-eclampsia was defined when these signs appeared <34 weeks' gestation.
The median maternal serum concentrations of index tests were significantly altered in women who subsequently developed pre-eclampsia. However, the AUC at <20 weeks' gestation was closer to 0.5 than to 1.0 for all biomarkers both for predicting any pre-eclampsia or at <34 weeks' gestation. The corresponding sensitivity, specificity and likelihood ratios were poor. Multivariable models combining sEng with clinical features slightly improved the prediction capability.
91

9.Algorithms/models in the first trimester
Study ref
Design LoE N Aim/methods Results Comments
(Brunelli & Prefumo 2015)
SLR IV 38 studies
Aim: To systematically review and critically assess the building and reporting of methods used to develop first trimester risk prediction models for pre-eclampsia.Methods: Search of PubMed and EMBASE databases from inception to July 2013. Selection criteria Logistic regression model for predicting the risk of pre-eclampsia in the first trimester, including uterine artery Doppler among independent variables. We extracted information on study design, outcome definition, participant recruitment, sample size and number of events, risk predictors and their selection and treatment, model-building strategies, missing data, overfitting and validation.
The median number of study participants was 697 [interquartile range (IQR) 377- 5126]. The median number of cases of pre-eclampsia per model was 37 (IQR 19-97). The median number of risk predictors was 5 (IQR 3.75-7). In 22% of the models, the number of events per variable was fewer than the commonly recommended value of 10 events per predictor; this proportion increased to 94% in models for early pre-eclampsia. Treatment and handling of missing data were not reported in 37 models. Only three models reported model validation.
Methodological deficiencies were frequent in the studies reporting risk prediction models for pre-eclampsia. This may limit their reliability and validity.Studies included that are also included in this review were: (Di Lorenzo et al 2012), (Parra-Cordero et al 2013), (Scazzocchio et al 2013) and (Wright et al 2012)
92

9.
Study ref
Design LoE N Aim/methods Results Comments
(Oliveira et al 2014b)
Validation study
— 871–2,962
Aim: To evaluate the performance of published first-trimester prediction algorithms for pre-eclampsia (PE) in a prospectively enrolled cohort of women.Methods: A MEDLINE search identified first-trimester screening-prediction algorithms for early-onset (requiring delivery < 34 weeks) and late-onset (requiring delivery > 34 weeks) PE. Maternal variables, ultrasound parameters and biomarkers were determined prospectively in singleton pregnancies enrolled between 9 and 14 weeks. Prediction algorithms were applied to this population to calculate predicted probabilities for PE. The performance of the prediction algorithms was compared with that in the original publication and evaluated for factors explaining differences in prediction.
One early PE prediction algorithm performed better than in the original publication (80% detection rate (DR) of early PE for 10% false-positive rate (FPR)); the remaining five prediction algorithms underperformed (29-53% DR). Prediction algorithms for late PE also underperformed (18-31% DR, 10% FPR). Applying the screening cut-offs based on the highest Youden index probability scores correctly detected 40-80% of women developing early PE and 71-82% who developed late PE. Exclusion of patients on first-trimester aspirin resulted in DRs of 40-83% and 65-82% for early and late PE, respectively.
Two of the studies included in this review (Parra-Cordero et al 2013; Scazzocchio et al 2013) were included in this validation study and found to underperform.
93

9.
Study ref
Design LoE N Aim/methods Results Comments
(Baschat et al 2014)
Prospective cohort
III-2 2,441 Aim: To derive a prediction rule for preeclampsia and early onset preeclampsia requiring delivery <34 weeks using first trimester maternal, ultrasound, and serum markers.Method; women were enrolled at first trimester screening. Maternal history, demographics, anthropometry, ultrasound parameters, and serum analytes were compared between women with preeclampsia and normal outcome. The prediction rule was derived by Lasso logistic regression analysis.
Nulliparity, prior hypertension, diabetes, prior preeclampsia, mean arterial pressure, and the log PAPP-A multiples of the median were primary risk factors. Prediction rules for preeclampsia/early preeclampsia had an area under the curve of 0.82/0.83 respectively. Preeclampsia was predicted with 49% sensitivity and early preeclampsia with 55% sensitivity for a 10% false positive rate.
Don’t have full text
(Crovetto et al 2014)
Case-control
III-2 5,759 Aim: To explore the predictive role of angiogenic factors for the prediction of early and late preeclampsia (PE) in the first trimester.Methods: Maternal characteristics, mean blood pressure (MAP), uterine artery (UtA) Doppler (11-13 weeks), vascular endothelial growth factor, placental growth factor (PlGF), soluble Fms-like tyrosine kinase-1 (sFlt-1) and soluble endoglin (8-11 weeks) were measured/recorded. All parameters were normalized by logarithmic transformation; logistic regression analysis was used to predict PE.
For early PE, significant contributions were chronic hypertension, previous PE, MAP, UtA Doppler, PlGF and sFlt-1. A model including these predictors achieved detection rates (DR) of 77.8 and 88.9% for 5 and 10% false-positive rates (FPR), respectively (AUC 0.958; 95% CI 0.920 to 0.996). For late PE, significant contributions were provided by body mass index, previous PE, UtA Doppler, PlGF and sFlt-1. The model including these factors achieved DR of 51.2 and 69% at 5 and 10% FPR, respectively (AUC 0.888; 95% CI 0.840-0.936).
94

9.
Study ref
Design LoE N Aim/methods Results Comments
(Crovetto et al 2015a)
Case-control
III-2 5,759 Aim: To explore the value of circulating luteinizing human chorionic gonadotropin receptor (LHCGR) forms for the prediction of preeclampsia (PE) in the first trimester of pregnancy.Methods: We recorded/measured maternal characteristics, mean arterial pressure (MAP), uterine artery (UtA) Doppler, placental growth factor (PlGF), soluble Fms-like tyrosine kinase- 1 (sFtl-1), and LHCGR forms (hCG-LHCGR and soluble LHCGR), and their independent predictive values were analyzed by logistic regression.
For early PE, the model included black ethnicity, chronic hypertension, previous PE, MAP, UtA Doppler, PlGF, sFlt-1, and LHCGR forms, achieving detection rates (DR) of 83% at 10% of false-positive rates (FPR) [AUC: 0.961 (95% CI: 0.921–1)]. For late PE, the model included body mass index, previous PE, UtA Doppler, PlGF, sFlt-1, and LHCGR forms, with DR of 75% at 10% of FPR [AUC: 0.923 (95% CI: 0.871–0.976)]. In both early and late PE, LHCGR forms improved DR by 6–15%.
95

9.
Study ref
Design LoE N Aim/methods Results Comments
(Crovetto et al 2015b)
Cohort III-2 9,462 Aim: to develop the best first-trimester screening model for preeclampsia (PE) based on maternal characteristics, biophysical parameters, and angiogenic factors in a low-risk population.Methods: Women undergoing first-trimester screening were included. Logistic regression predictive models were developed for early and late PE (cut-off of 34 weeks’ gestation at delivery). Data included the a priori risk (maternal characteristics), MAP, and UtA Doppler (11–13 weeks). Plasma levels (8–11 weeks) of human chorionic gonadotrophin, PAPP-A, PlGF and sFlt-1 were analyzed using a nested case– control study design.
The best model for early PE (n=57, 0.6%) included a priori risk, MAP, UtA Doppler, PlGF, and sFlt-1 achieving detection rates of 87.7% and 91.2% for 5% and 10% false-positive rates, respectively (AUC: 0.98 [95% CI: 0.97–0.99]).For late PE (n = 246, 2.6%), the best model included the a priori risk, MAP, UtA Doppler, PlGF, and sFlt-1 achieving detection rates of 68.3% and 76.4% at 5% and 10% of false-positive rates, respectively (AUC: 0.87 [95% CI: 0.84–0.90]).
96

9.
Study ref
Design LoE N Aim/methods Results Comments
(Di Lorenzo et al 2012)
Cohort III-2 2,118 Aim: To evaluate the detection of pregnancy hypertensive disorders by integrating maternal history, serum biomarkers and uterine artery Doppler in the first trimester.Methods: From women undergoing 11–13 weeks aneuploidy screening. we gathered information on maternal history, uterine artery Doppler and serum biomarkers (PAPP-A, PlGF, PP-13 and free b-hCG). Models were developed for the prediction of overall preeclampsia (PE), early-onset PE, late-onset PE and gestational hypertension .
For a fixed FPR of 10 and 5%, serum PlGF, free bhCG and chronic hypertension identified respectively 67 and 75% of women who developed early-onset PE.In the model for the prediction of overall PE the combination of the uterine artery Doppler pulsatility index (UtA PI) with PlGF and chronic hypertension reached a sensitivity of 60% for a 20% of FPR.
97

9.
Study ref
Design LoE N Aim/methods Results Comments
(Gabbay-Benziv et al 2016)
Cohort III-2 2,433 Aim: To compare performance of multimarker algorithm, risk profiles and their sequential application in prediction of preeclampsia and determining potential intervention targets.Methods: Maternal characteristics, ultrasound variables and serum biomarkers were collected prospectively at first trimester. Univariate analysis identified preeclampsia associated variables followed by logistic regression analysis to determine the prediction rule. Combined characteristics of the cardiovascular, metabolic and the personal risk factors were compared to the multimarker algorithm.
Probability scores considering nulliparity, prior preeclampsia, body mass index, diastolic blood pressure and placental growth factor had an area under the receiver operating characteristic curve 0.784 (95% CI=0.721-0.847).
98

9.
Study ref
Design LoE N Aim/methods Results Comments
(Goetzinger et al 2014)
Cohort III-2 1,200 Aim: to develop a multiparameter risk-based scoring system for first-trimester prediction of preeclampsia and to validate this scoring system in our patient population.Methods: Secondary analysis of a prospective cohort of women presenting for first-trimester screening. Maternal serum PAPP-A levels were measured and bilateral UA Doppler studies performed. Using the first half of the study population, a prediction model for preeclampsia was created. Test performance characteristics were used to determine the optimal score for predicting preeclampsia. This model was then validated in the second half of the population.
Significant risk factors and their weighted scores derived from the prediction model were chronic hypertension (4), history of preeclampsia (3), pregestational diabetes (2), body mass index > 30 kg/m(2) (2), bilateral UA notching (1), and PAPP-A MoM < 10 th percentile (1). The area under the curve (AUC) for the risk scoring system was 0.76 (95% confidence interval [CI], 0.69-0.83), and the optimal threshold for predicting preeclampsia was a total score of > 6. This AUC did not differ significantly from the AUC observed in our validation cohort (AUC, 0.78 [95% CI, 0.69-0.86]; p = 0.75].
(Gomaa et al 2015)
Cohort III-2 500 Aim: to find indicators with sufficient positive predictive value.Methods: Serum TNF-alpha and uterine artery Doppler were measured at 11-13 weeks in low-risk pregnant women.
Combining both parameters gave 88.6% sensitivity and 100% specificity in predicting PE with a PPV of 100% and NPV of 98.6%. Serum TNF-alpha assay improves the performance of mean uterine artery PI at 11-13 weeks.
99

9.
Study ref
Design LoE N Aim/methods Results Comments
(Keikkala et al 2016)
Case-control
III-2 98 pre-eclampsia25 GH41 SGA177 controls
Aim: To assess whether maternal serum hyperglycosylated human chorionic gonadotropin (hCG-h) improves first trimester prediction of pre-eclampsia when combined with PlGF, PAPP-A and maternal risk factors.Methods: Gestational-age-adjusted concentrations of hCG, hCG-h, PlGF and PAPP-A were analysed in serum samples by time-resolved immunofluorometric assays at 8–13 weeks of gestation.
Women who developed preterm pre-eclampsia had lower concentrations of PlGF, PAPP-A and proportion of hCG-h to hCG (%hCG-h) than controls. In ROC curve analysis, the AUC for the combination of PlGF, PAPP-A, %hCG-h, nulliparity and MAP was 0.805 (95%CI 0.699 to 0.912) for preterm pre-eclampsia and 0.870 (95%CI 0.750–0.988) for early-onset pre-eclampsia. Without %hCG-h, the AUC values were 0.756 (95% CI 0.651–0.861) and 0.810 (95% CI 0.682–0.938) respectively.
100

9.
Study ref
Design LoE N Aim/methods Results Comments
(Maia E Holanda Moura et al 2016)
Case-control
III-2 426 Aim: To examine whether the maternal serum concentration of the soluble receptor-1 of tumor necrosis factor-alpha (TNF-R1) at 11-13 + 6 weeks of gestation is a predictor of development of pre-eclampsia (PE).Methods: TNF-R1 was measured at 11+0 to 13+6 weeks and values expressed as MoM adjusted for maternal factors. Distributions of log TNF-R1 MoM in the control group and hypertensive disorders (early-PE [ePE], late-PE [lPE] and gestational hypertension [GH]) groups were compared. Logistic regression analysis was used to determine whether maternal factors, TNF-R1 or their combination make a significant contribution to the prediction of PE.
Logistic regression analysis demonstrated that the addition of TNFR-1 to maternal factors did not make a significant contribution to the prediction of PE. Area under the curve for early onset pre-eclampsia was 0.744 (0.592 to 0.897), for maternal characteristics, AUC 0.782 (0.592 to 0.972) for TNF-R1 and 0.817 (0.677 to 0.958) for the combination. For late onset AUCs were 0.701 (0.636 to 0.765), 0.531 (0.428 to 0.635) and 0.701 (0.0.636 to 0.765), respectively.
101

9.
Study ref
Design LoE N Aim/methods Results Comments
(Meiri et al 2014)
Cohort III-2 820 Aim: to evaluate placental protein 13 (PP13) and risk factors (RFs) as markers for predicting preeclampsia (PE) and use of aspirin for PE prevention.Methods: First-trimester pregnancy screening was based on having PP13 level < 0.4 multiple of the median (MoM) and/or at least one major risk factor (RF) for PE. Management was by routine care or combined with daily treatment with 75 mg aspirin between 14 and 35 weeks of gestation.
Combining low PP13 with RFs increased prediction accuracy. Mean arterial pressure (not included in the initial prediction), could add to prediction accuracy when combined with low PP13 and RFs.
Don’t have full text
(Moon & Odibo 2015)
1,117 Aim: to investigate the effect of maternal parity on models for screening for PE in the first-trimester and their effectiveness.Methods: Between 11 and 14 weeks gestation, maternal risk factors, UtA Doppler, MAP and serum markers (PAPP-A, ADAM12, PP13) were used to create multi-parameter screening models for PE. The best models for screening in nulliparous versus parous women were developed using backward stepwise logistic regression approach. The AUC and the sensitivity for fixed false positive rates of 10% and 20%, respectively, were compared using non-parametric statistics.
There were significant differences in predicting variables in the final optimal models when stratified by parity; and screening performance also varied by parity. The AUC for the model for nulliparous women was 0.88(95% CI 0.80–0.95); and for multiparous was 0.84 (95% CI, 0.75–0.91). For fixed FPR of 10%, the sensitivity for predicting PE was 70% and 68% for nulliparous and multiparous, respectively. The screening performance for the models were however not statistically or clinically significantly different.
102
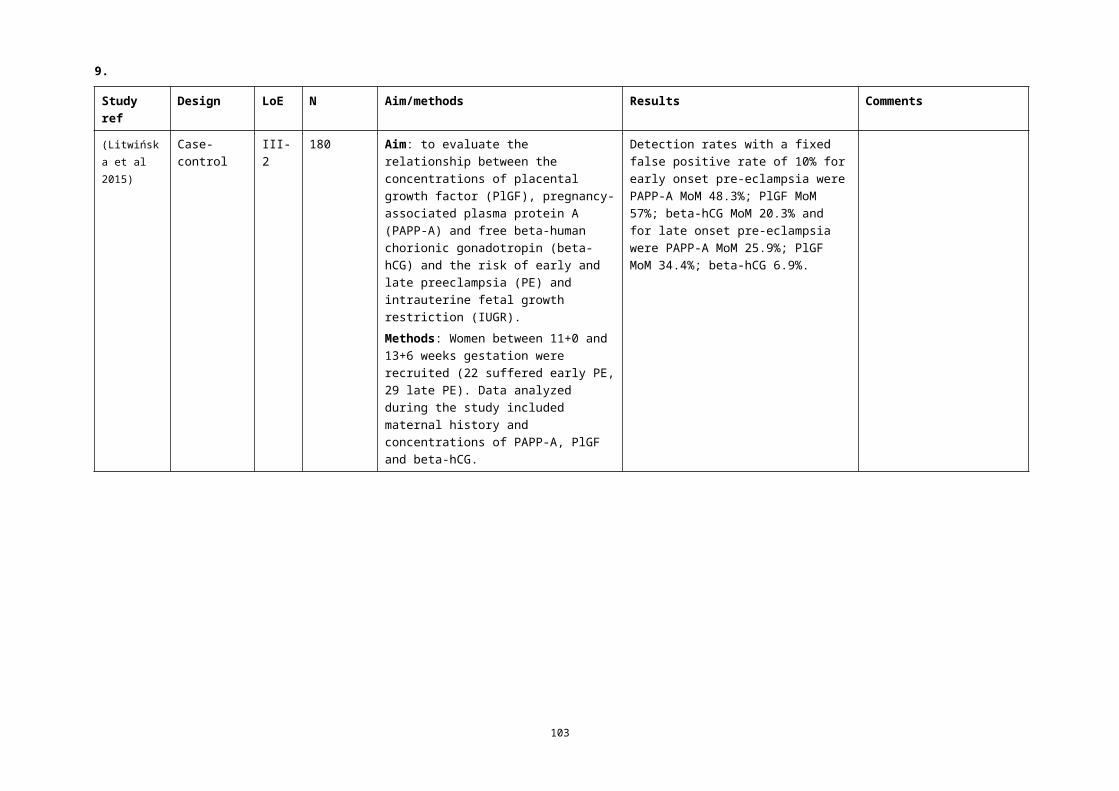
9.
Study ref
Design LoE N Aim/methods Results Comments
(O'Gorman et al 2016)
Cohort III-2 35,948 Aim: to develop a model for preeclampsia based on maternal demographic characteristics and medical history (maternal factors) and biomarkers.Methods: The data for this study were derived from prospective screening for adverse obstetric outcomes in women who attended for their routine first hospital visit at 11-13 weeks gestation in 2 maternity hospitals in England. We screened 35,948 singleton pregnancies that included 1058 pregnancies (2.9%) that experienced preeclampsia. Bayes theorem was used to combine the a priori risk from maternal factors with various combinations of uterine artery pulsatility index, mean arterial pressure, serum pregnancy-associated plasma protein-A, and placental growth factor multiple of the median values. Five-fold cross validation was used to assess the performance of screening for preeclampsia that delivered at <37 weeks gestation (preterm-preeclampsia) and 37 weeks gestation (termpreeclampsia) by models that combined maternal factors with individual biomarkers and their combination with screening by maternal factors alone.
In pregnancies that experienced preeclampsia, the values of uterine artery pulsatility index and MAPwere increased, and the values of serum PAPP-A and PlGF were decreased. For all biomarkers, the deviation from normal was greater for early than late preeclampsia; therefore, the performance of screening was related inversely to the gestational age at which delivery became necessary.Combined screening by maternal factors, uterine artery pulsatility index, mean arterial pressure, and placental growth factor predicted 75% (95%CI 70 to 80%) of preterm-preeclampsia and 47% (95%CI 44 to 51%) of term-preeclampsia, at a false positive rate of 10%; inclusion of PAPP-A did not improve the performance of screening. Such detection rates are superior to the respective values of 49% (95%CI 43 to 55%) and 38% (95%CI 34 to 41%) that were achieved by screening with maternal factors alone.
103
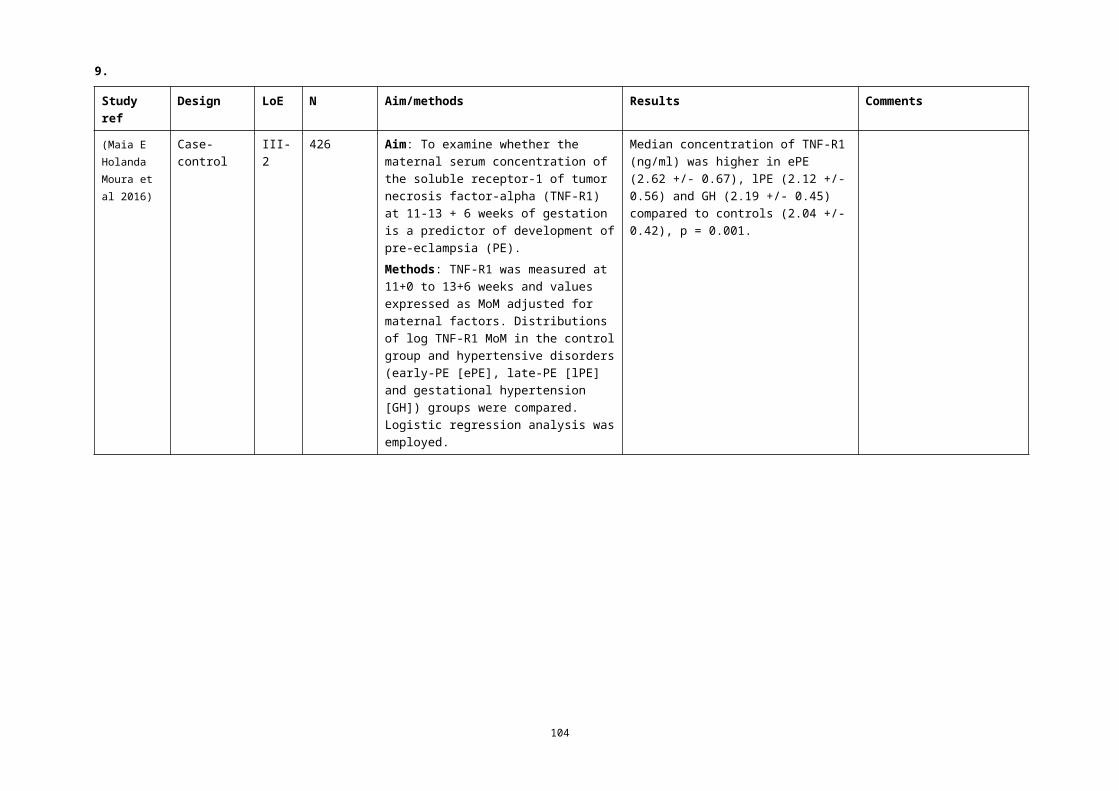
9.
Study ref
Design LoE N Aim/methods Results Comments
(Park et al 2013)
Cohort III-2 3,066 Aim: to validate the Fetal Medicine Foundation (FMF) multiple logistic regression algorithm for prediction of risk of pre-eclampsia in an Australian population.Methods: All women who attended first trimester screening at the Royal Prince Alfred Hospital had their body mass index (BMI), MAP and UtA PI assessed in addition to factors traditionally used to assess aneuploidy (PAPP-A MoM). After delivery, risks of early-onset (delivery <34 weeks) pre-eclampsia, late pre-eclampsia and gestational hypertension were calculated.
The study included 3014 (98.3%) women with a live birth, where risks of early pre-eclampsia were calculated. Twelve women were delivered before 34 weeks because of early pre-eclampsia with a prevalence of early pre-eclampsia of 1 in 256 pregnancies. Risks generated through the use of maternal history, MAP, UtA PI and PAPP-A detected 41.7 and 91.7% of early pre-eclampsia at a false-positive rate of 5 and 10%, respectively.
104

9.
Study ref
Design LoE N Aim/methods Results Comments
(Parra-Cordero et al 2013)
Case-control
III-2 5,367 Aim: To develop a predictive model for pre-eclampsia using clinical, biochemical and ultrasound markers during the first trimester of pregnancy.Methods: asymptomatic pregnant women undergoing routine transvaginal UtA Doppler at 11+0 to 13+6 weeks were included. The lowest, highest and mean of left and right UtA PI were calculated. The distributions of the lowest UtA-PI and the biochemical markers were adjusted for maternal characteristics, expressed as MoMs, and compared between groups. Logistic regression analysis was used to evaluate if any variable was significantly associated with pre-eclampsia.
Different combined models were generated by logistic regression analysis, and the detection rate with a fixed 10% false-positive rate was 47% and 29% for early- and late-onset pre-eclampsia, respectively. Pregnancies that later developed early or late pre-eclampsia were characterized by impaired placentation and an anti-angiogenic state during the first trimester of pregnancy.
An external validation (Oliveira et al 2014a) of this model found sensitivity of 29% for early onset and 18% for late onset pre-eclampsia.
105

9.
Study ref
Design LoE N Aim/methods Results Comments
(Poon et al 2013)
Cohort III-2 1,426 with pre-eclampsia57,458 unaffected
Aim: To combine a specific algorithm for small for gestational age (SGA) without preeclampsia (PE) and another algorithm for PE in the prediction of SGA and PE.Methods: singleton pregnancies at 11-13 weeks were included. We developed a prediction algorithm for SGA requiring delivery before 37 weeks' gestation (preterm-SGA) from maternal characteristics, uterine artery pulsatility index, MAP, serum PAPP-A and PlGF MoM values. We then examined the performance of this algorithm individually and in combination with a previously reported algorithm for early-PE in the prediction of SGA and PE.
When screen positivity was defined by risk cutoff of 1:200 using the algorithm for early-PE and the risk cutoff of 1:150 using the algorithm for preterm-SGA, the false positive rate was 10.9% and the detection rates of early-PE, late-PE, preterm-SGA and term-SGA were 95.3, 45.6, 55.5 and 44.3%, respectively.
(Scazzocchio et al 2013)
Cohort III-2 5,170 Aim: to evaluate the effectiveness of an integrated first-trimester screening test to predict preeclampsia (PE).Methods: A logistic regression-based predictive model for early- and late onset PE was constructed based on: maternal characteristics; levels of PAPP-A and free -hCG at 8–12 weeks; and blood pressure and uterine artery Doppler at 11.0-13.6 weeks.
At 5% and 10% false-positive rates, detection rates were 69.2% and 80.8% for early PE (AUC 0.95; 95%CI 0.94–0.98) and 29.4% and 39.6% for late PE (AUC 0.71; 95%CI 0.66–0.76), respectively.
An external validation (Oliveira et al 2014a) of this model found AUCs of 0.77 (0.67 to 0.86) for early onset and 0.69 (0.64 to 0.75) for late onset pre-eclampsia.
106
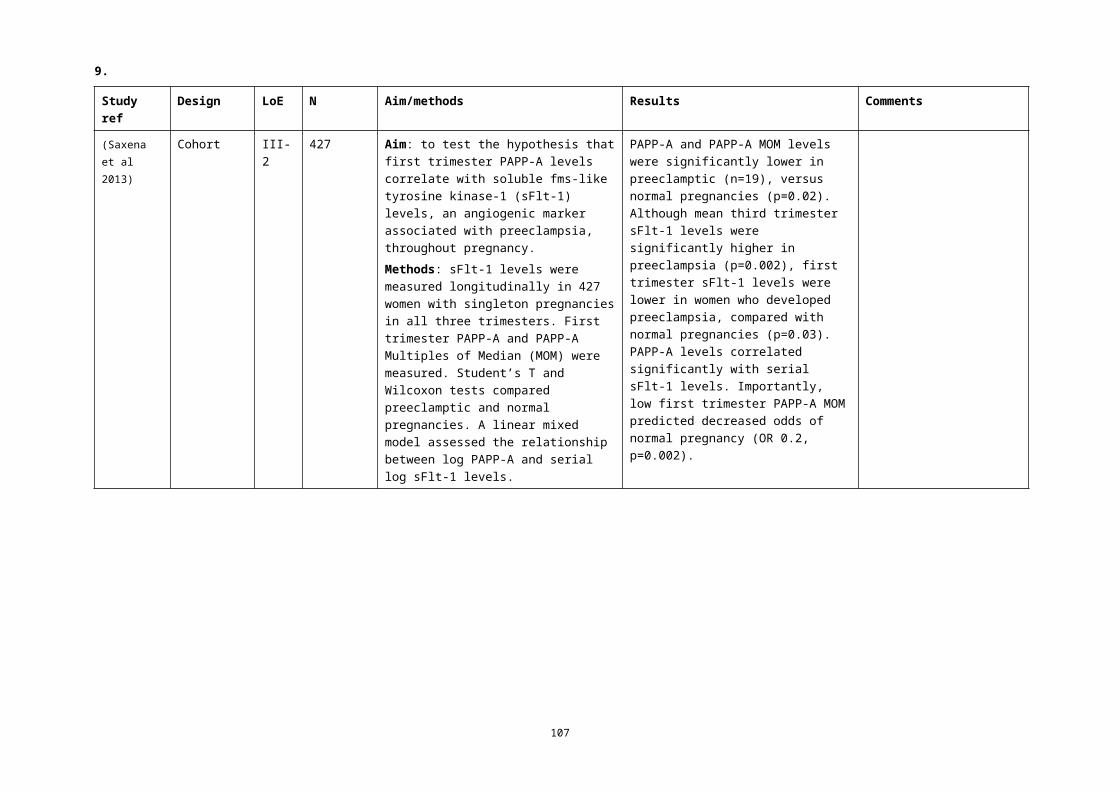
9.
Study ref
Design LoE N Aim/methods Results Comments
(Sepulveda-Martinez et al 2016)
Cohort III-2 137 Aim: to determine the role of nerve growth factor (NGF) in the first-trimester screening for preeclampsia (PE).Methods: Uterine artery Doppler (UtAD) was determined transvaginally. Maternal concentrations of NGF were assessed in 42 patients who subsequently developed PE and in 95 controls. Quantile and multivariate regression analyses were performed for the NGF and UtAD adjustment and expressed as the multiple of the median (MoM) of the unaffected group. Logistic regression analysis was conducted to identify the best model for the prediction of PE.
The best predictors of PE were previous PE, chronic hypertension and UtAD. With a false-positive rate of 10%, the detection rates (DRs) of all-PE and e-PE were 38 and 50%, respectively. The addition of MoM NGF did not improve the DR of PE.
107
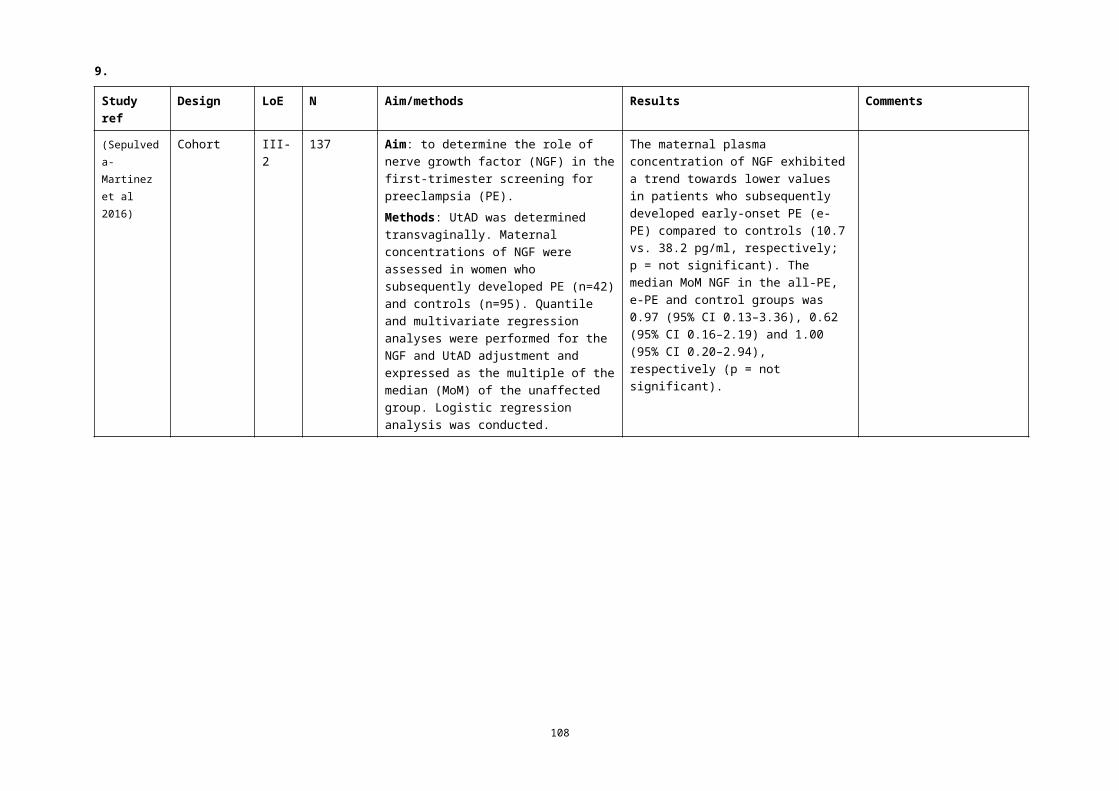
9.
Study ref
Design LoE N Aim/methods Results Comments
(Skrastad et al 2015)
Cohort III-2 541 Aim: To evaluate two algorithms for prediction of preeclampsia in a population of nulliparous women in Norway.Methods: women were examined between 11+0 and 13+6 weeks with interviews for maternal characteristics and measurements of MAP, uterine artery pulsatility index, PAPP-A and PlGF. The First Trimester Screening Program version 2.8 by The Fetal Medicine Foundation (FMF) was compared with the Preeclampsia Predictor TM version 1 revision 2 by Perkin Elmer (PREDICTOR).
The performance of the two algorithms was similar, but quite poor, for prediction of preeclampsia requiring delivery before 42 weeks with an area under the curve of 0.77 (0.67 to 0.87) and sensitivity 40% (95% CI 19.1 to 63.9) at a fixed 10% false positive rate for FMF and 0.74 (0.63 to 0.84) and sensitivity 30% (95% CI 11.9–54.3) at a fixed 10% false positive rate for PREDICTOR. The FMF algorithm for preeclampsia requiring delivery <37 weeks had an area under the curve of 0.94 (0.86–1.0) and sensitivity of 80% (95% CI 28.4–99.5) at a 10% fixed false positive rate.
(Verghese et al 2012)
Cohort III-2 176 Aim: To evaluate the NICE and PRECOG guidelines risk factors for pre-eclampsia to identify mothers at risk before 20 weeks' gestation. Cases (n=64) and controls (n=112) were classified retrospectively as screen positive or negative as recommended by the two guidelines
The NICE guideline had a higher sensitivity rate of 77% (95%CI 65 to 87%) vs 59% (95% CI 46 to 71%) but a lower specificity of 54% (95% CI 44 to 64%) vs 81% (95% CI 73 to 88%) with the PRECOG guideline. Based on an incidence of pre-eclampsia of 4% the PPVs of PRECOG and NICE guidelines were estimated at only 11% and 7%, respectively.The most discriminatory risk factor was history of pre-eclampsia in a previous pregnancy.
108

9.
Study ref
Design LoE N Aim/methods Results Comments
(Verma et al 2016)
Cohort III-2 615 Aim: To determine the diagnostic accuracy of preeclampsia (PE) screening test offered in early pregnancy for the prediction of the risks for early-onset (requiring delivery <32 weeks gestation) and late onset (requiring delivery ≥32 weeks gestation) disease.Methods: In women with singleton pregnancy, the risk for PE was calculated by the combined effect of multiple variables: serum PlGF, PAPP-A, maternal age, parity, ethnicity, MAP, BMI, UtA PI, and previous history of PE or hypertension (HT). The results of the screening test in three different groups of women were validated by pregnancy outcome: control group; history of PE without HT; and (iii) history of HT without PE.
The multivariate screening effectively identified cases of PE with >97% specificity. The detection rate (DR) was 93.8% for late-onset PE at a false positive rate (FPR) of 2.3% and 44.4% for early-onset PE at an FPR of 0.0%. The incidence of PE was 7% overall, with 1.52% and 5.43% for early- and late-onset PE, respectively. The study demonstrated 96.6% diagnostic accuracy of the multi-variable screening test to predict the risk of PE in the first trimester. The negative predictive value (>98%) reinforces the utility of cost-effective noninvasive screening test for the early detection of PE.
109

9.
Study ref
Design LoE N Aim/methods Results Comments
(Wright et al 2012)
Cohort III-2 1,26 pre-eclampsia57,458 controls
Aim: to develop models for the prediction of preeclampsia (PE) based on maternal characteristics and biophysical markers at 11–13 weeks’ gestation in which gestation at the time of delivery for PE is treated as a continuous variable.Methods: We developed a survival time model for the time of delivery for PE in which Bayes’ theorem was used to combine the prior information from maternal characteristics with the uterine artery pulsatility index (PI) and the mean arterial pressure (MAP), using multiple of the median values.
The risk for PE increased with maternal age, weight, Afro-Caribbean and South Asian racial origin, previous pregnancy with PE, conception by in vitro fertilization and a medical history of chronic hypertension, type 2 diabetes mellitus as well as systemic lupus erythematosus or antiphospholipid syndrome. In pregnancies with PE, there was an inverse correlation between MoM values of the UtA PI and MAP with gestational age at delivery. Screening by maternal characteristics, UtA PI and MAP detected 90% of PE cases requiring delivery before 34 weeks and 57% of all PE cases at a fixed false-positive rate of 10%.
110
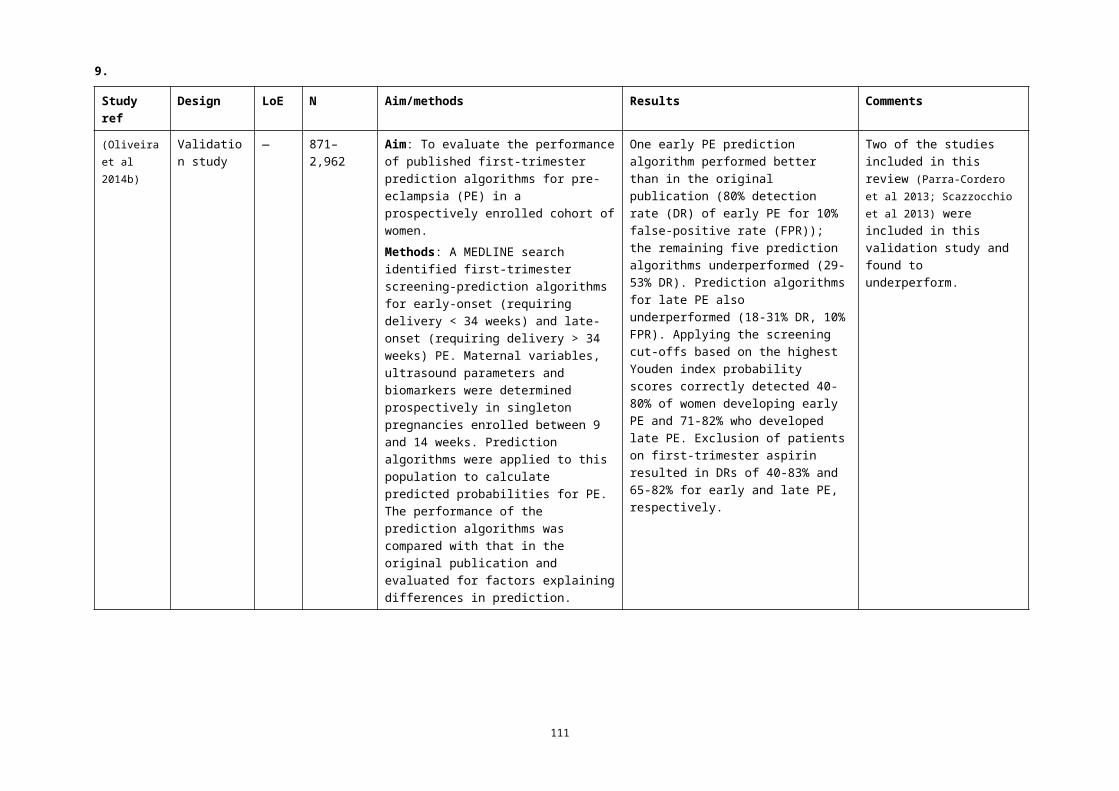
9.
Study ref
Design LoE N Aim/methods Results Comments
(Wright et al 2015)
Cohort III-2 120,492 Aim: to develop a model for preeclampsia based on maternal demographic characteristics and medical history.Methods: Singleton pregnancies at 11-13 weeks' gestation (2704 [2.2%] with preeclampsia. A survival-time model for the gestational age at delivery with preeclampsia was developed from variables of maternal characteristics and history. This approach assumes that, if the pregnancy was to continue indefinitely, all women would experience preeclampsia and that whether they do so or not before a specified gestational age depends on competition between delivery before or after development of preeclampsia. A 5-fold cross validation study was conducted to compare the performance of the new model with the National Institute for Health and Clinical Excellence (NICE) guidelines.
In the new model, increased risk for preeclampsia, with a consequent shift in the Gaussian distribution of the gestational age at delivery with preeclampsia to the left, is provided by advancing maternal age, increasing weight, Afro-Caribbean and South Asian racial origin, medical history of chronic hypertension, diabetes mellitus and systemic lupus erythematosus or antiphospholipid syndrome, family history and personal history of preeclampsia, and conception by IVF. The risk for preeclampsia decreases with increasing maternal height and in parous women with no previous preeclampsia. At a screen-positive rate of 11%, as defined by NICE, the new model predicted 40%, 48%, and 54% of cases of total preeclampsia and preeclampsia requiring delivery at <37 and <34 weeks' gestation, respectively, which were significantly higher than the respective values of 35%, 40%, and 44% achieved by application of NICE guidelines.
111

9.
Study ref
Design LoE N Aim/methods Results Comments
(Yliniemi et al 2015)
Case-control
III-2 807 Aim: to predict early-onset and severe pre-eclampsia.Methods: Women with singleton pregnancy on or after 24 weeks' gestation and had a first trimester trisomy screening, including serum PAPP-A measurement were included. Within this cohort, 65 women experienced early onset pre-eclampsia (EO-PE) 742 uncomplicated deliveries. Retrospectively, we measured placental retinol binding protein 4 (RBP4). PAPP-A and RBP4 were converted to MoMs. Logistic regression analysis was performed to determine whether these biomarkers separately and in combination with maternal characteristics (maternal age, weight and smoking status) can be used to predict the development of early onset pre-eclampsia.
The risk model including maternal characteristics with PAPP-A log10 MoM and RBP4 log10 MoM had the best EO-PE prediction ability. It detected 34% (23%-46%) of females with subsequent EO-PE with a 10% false positive rate.
112

9.
Study ref
Design LoE N Aim/methods Results Comments
(Yucel et al 2016)
Cohort III-2 602 Aim: to evaluate the detection of pre-eclampsia (PE) by integrating uterine artery Doppler, placental volume, and PAPP-A levels in the first trimester.Method: We prospectively recruited women who underwent 11–13 weeks’ aneuploidy screening. The mean UtA PI and the placental volume were measured by ultrasonography. Measurement of PAPP-A levels was performed at the same day of ultrasonographic examinations. The 90th percentile of UtA PI and the 10th percentile of placental volume and PAPP-A levels were used as cut-offs.
UtA PI, placental volume, and PAPP-A levels had similar sensitivities in predicting PE (53.66%, 63.41%, and 70.73%, respectively). Use of the parameters in combination had better sensitivity. If one parameter was positive, the sensitivity was 92.68% with 85.20% specificity. If at least two parameters were positive, the sensitivity was 85.37% with 98.89% specificity.
113

9.Individual markers in the second trimester
Study ref
Design LoE N Aim/methods Results Comments
(Bestwick et al 2012)
Case-control
III-2 301 Aim: To estimate the pre-eclampsia screening performance of PAPP-A and ADAM12 (A Disintegrin And Metalloprotease 12) in the early second trimester of pregnancy.Method: Stored frozen serum samples from a previously published nested case-control study comprising 77 women who developed pre-eclampsia and 224 unaffected controls were thawed and assayed for PAPP-A and ADAM12. Levels were converted into multiple of the unaffected median (MoM) values.
Neither PAPP-A or ADAM12 were significantly different in women who developed pre-eclamspia compared with unaffected controls (PAPP-A: 0.97 MoM [95%CI 0.73 to 1.25], ADAM12: 1.01 MoM [0.91 to 1.13]). Our results do not support the use of PAPP-A or ADAM12 in early second trimester antenatal screening for pre-eclampsia.
(Bhattacharyya et al 2012)
Cohort III-2 179 Aim: To observe the role of uterine artery Doppler flow velocimetry at midtrimester in prediction of preeclampsia.Method: Women <16 weeks of pregnancy, with singleton fetus and without any fetal anomaly were recruited and divided into high-risk and low-risk groups. Doppler velocimetry of UtA was done at 24-26 weeks. Any notch in UtA, unilateral or bilateral, or RI>0.6, was considered abnormal. Women were followed up and development of preeclampsia noted.
Sensitivity and specificity of abnormal UtA Doppler study for prediction of preeclampsia were 73.33 and 86.48 % in high-risk and 57.14 and 95.83 % in low-risk group, respectively. Relative risk with 95% confidence interval was 5.427 (2.272 to 12.958) in high-risk and 13.65 (5.669 to 32.865) in low-risk women.
114

9.
Study ref
Design LoE N Aim/methods Results Comments
(Contro et al 2016)
SLR IV 11 studies
Aim: to estimate whether the increase in the quantity of cell-free fetal DNA (cffDNA) before the onset of preeclampsia (PE) can predict the disease using real-time polymerase chain reaction (PCR).Method: A comprehensive literature search of the PubMed, Scopus, and Web of Knowledge databases was conducted to identify relevant studies that included evaluated cffDNA levels in pregnant women before the clinical onset of PE. A simulation model was generated to calculate the detection rate (DR) of cffDNA for PE.
Four studies (82 cases and 1,315 controls) evaluated cffDNA in early-onset PE, with DRs of 18 and 68.8% at 11–13 and 17–28 weeks, respectively, at a false positive rate of 10%. Nine studies (including two considered for early-onset PE) encompassing 376 cases and 1270 controls were available for the evaluation of ‘any PE’. At 11–14 weeks no significant DR was found, while at 15–28 weeks the DR was 37%.
Due to the heterogeneity and difficulty in interpreting the published data, no conclusion regarding the statistical and clinical relevance, especially for screening ‘any PE’, can be made at present.
(Dey et al 2013)
Cohort III-2 306 Aim: to study ceruloplasmin in nulliparous women as marker of oxidative stress and lipid profile to evaluate their value in prediction of pre-eclampsia.Methods: Women had their serum lipid profile and ceruloplasmin levels measured at 14–16 weeks as sample 1 and at 18-20 weeks as sample 2. All cases were followed up till the end of pregnancy for development of pre-eclampsia.
There was no statistically significant difference between the controls and pre-eclampsia cases at 14–16 week for all the oxidative stress parameters (P > 0.05), but at 18–20 week, there was statistically significant difference between the controls and pre-eclampsia cases in cholesterol and ceruloplasmin parameters (P < 0.05).
115

9.
Study ref
Design LoE N Aim/methods Results Comments
(Dover et al 2013)
Cross-section
III-2 148 Aim: to examine PlGF levels in a pregnant population between 16 and 19 weeks of gestation to determine the value for early diagnosis of preeclampsia.Methods: Nulliparous normotensive pregnant women were selected for the control group and women with chronic hypertension or a history of hypertensive disorders in previous pregnancies were selected for the study group.
The cut-off value for PlGF for discriminating pre-eclamptic and non-pre-eclamptic patients was found to be 62.5 pg/ml (OR 7.4; 95%CI 2.226 to 24.601; p<0.001).
(Ghosh et al 2012)
Cohort III-2 150 Aim: to analyze whether estimation of serum PlGF levels in late second trimester can act as a predictor of preeclampsia.Methods Nulliparous women were divided into three groups: normotensive (n=30), mild (n=60) and severe (n=60) preeclampsia. Serum samples collected from the study groups were subjected to ELISA, and serum PlGF level was calculated.
Mean serum PlGF levels were found to be significantly low in mild and severe pre-eclampsia as compared to normal pregnancy. Serum PlGF levels were highest at 26–28 weeks and were lowered at 28–30 and 30–32 weeks of gestation within each of the three study groups. Cut-off value of serum PlGF levels for predicting pre-eclampsia and severe pre-eclampsia were <20 and <107 pg/mL, respectively.
116

9.
Study ref
Design LoE N Aim/methods Results Comments
(Ghosh et al 2013)
Cohort III-2 722 Aim: To determine whether maternal serum PlGF estimation in early second trimester (20-22 weeks) can predict the occurrence of early onset preeclampsia and/or early onset (<32 wks) IUGR.Methods: Singleton pregnancies were screened and serum PlGF levels were estimated at 20-22 weeks of gestation. A cut-off value of <155 pg/mL for serum PlGF was determined by ROC analysis. Univariate logistic regression analysis was used to analyze the association between serum PlGF level <155 pg/mL and the two outcome measures OR was computed.
Maternal serum PlGF level <155 pg/mL at 20-22 weeks of gestation had a strong association with early onset preeclampsia (OR 8.35; 95%CI 1.79 to 18.94; P=0.007). The sensitivity of serum PlGF <155 pg/mL for predicting early onset preeclampsia was 82.
(Olsen et al 2012)
Cohort III-2 7,767 Aim: to determine the association of abnormal second-trimester serum analytes with early preterm preeclampsia.Methods: Values of maternal serum alpha-fetoprotein (AFP), beta-hCG, and inhibin (INH) were calculated as multiples of the median (MoM) and evaluated by gestational age at delivery and occurrence of preeclampsia.
Elevated AFP, hCG, and INH >2 MoM were associated with preeclampsia, and the OR was higher for the development of preeclampsia <34 weeks than >34 weeks (OR 8.04 vs 2.91 for AFP, 3.6 vs 2 for hCG, and 4.17 vs 3.08 for INH, P <0.001 for all). The higher the MoM for each analyte the greater the likelihood of preeclampsia.
117
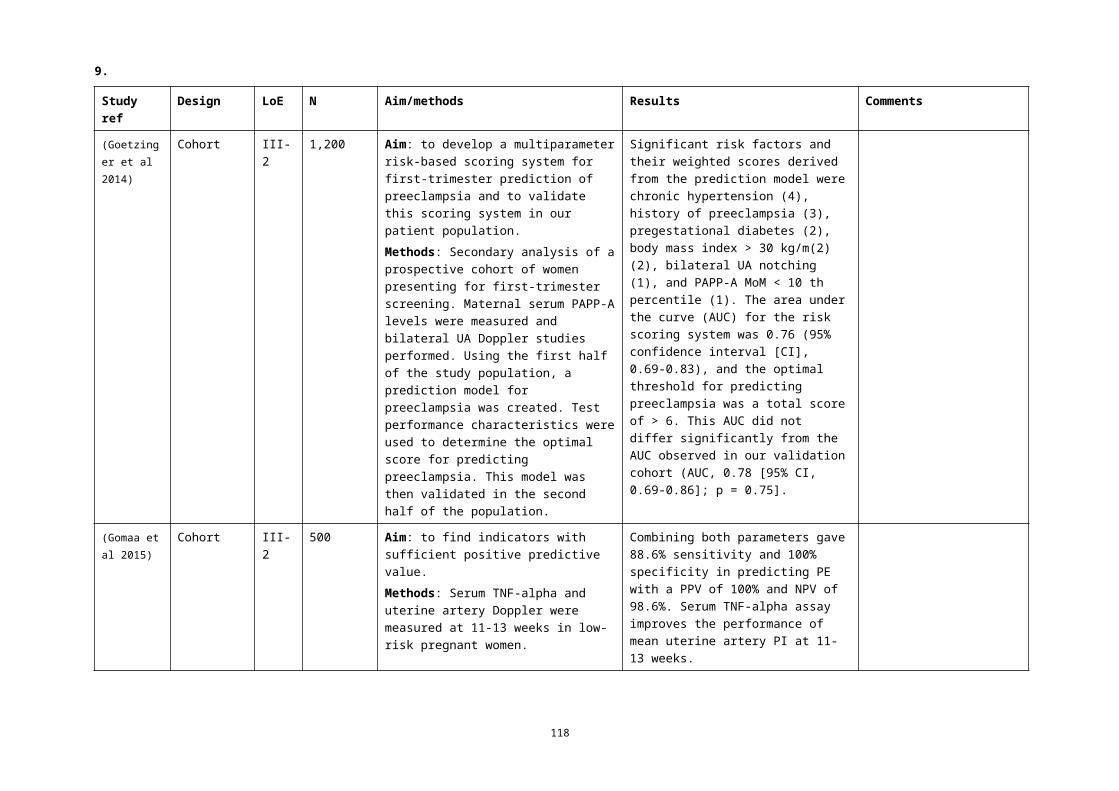
9.
Study ref
Design LoE N Aim/methods Results Comments
(Tache et al 2014)
Cohort III-2 136,139329 early onset; 879 late onset
Aim: to examine the relationship between second-trimester maternal serum biomarkers and the development of early- and late-onset severe preeclampsia in euploid pregnancies.Methods: Included were pregnancies that obtained second-trimester prenatal screening through the California Prenatal Screening Program with live births in 2006-2008. We identified severe preeclampsia diagnoses from hospital discharge records. We used log binomial regression to examine the association between abnormal second-trimester maternal serum biomarkers and the development of severe preeclampsia.
High levels of alpha fetoprotein (AFP), human chorionic gonadotropin, inhibin (MoM >95th percentile), and low unconjugated estriol (MoM <5th percentile), were associated with severe preeclampsia (RR 2.5-11.7). Biomarkers were more predictive of early-onset severe preeclampsia (RR 3.8-11.7). One in 9.5 pregnancies with combined high AFP, inhibin, and low unconjugated estriol levels experienced severe early-onset preeclampsia compared with 1 in 680.5 pregnancies without any abnormal biomarkers.
(Vahdat et al 2012)
Cohort III-2 150 Aim: to evaluate the calcium to creatinine ratio for the prediction of pre-eclampsia.Method: Women aged 15–35 years provided a single urine sample at 20–24 weeks of gestation for measurement of urine calcium to creatinine ratio. The women were then monitored for delivery and this ratio was compared between the women with and without pre-eclampsia.
Mean urine calcium of pre-eclamptic women was significantly lower than normotensive women (179±35-mg/dl vs 272±59-mg/dl, P<0.001). Mean calcium to creatinine ratio was significantly lower in pre-eclamptic women (0.07±0.007 vs 0.16±0.006, P<0.001). The optimal cut off point for calcium to creatinine ratio was calculated to be 0.071 (sensitivity 77%; specificity of 78%).
118

9.
Study ref
Design LoE N Aim/methods Results Comments
(Wald et al 2012)
Case control
III-2 363 Aim: To estimate the pre-eclampsia screening performance of PlGF and endoglin with second-trimester Quadruple test markers used for antenatal Down's syndrome screening.Methods: Frozen maternal serum samples from early second trimester Down's syndrome Quadruple test were thawed and assayed for PlGF and endoglin. Monte Carlo simulation was used to estimate the pre-eclampsia screening performance of a pre-eclampsia detection algorithm using the Quadruple test markers with or without the addition of PlGF and/or endoglin.
Median PlGF was 33% lower (95% CI 24 to 41%) and endoglin 31% (20 to 43%) higher in pre-eclampsia than in unaffected pregnancies. Adding PlGF to the Quadruple test markers increased the pre-eclampsia detection rate from 34% to 45% at a 5% FPR; it increased it to 43% with endoglin and to 50% with both. The corresponding estimates for early pre-eclampsia (< 36 wks) were a few percentage points higher (48%, 48% and 55% respectively). Including information on parity, pre-eclampsia in a previous pregnancy, family history (woman's mother) and assuming a pre-eclampsia prevalence of 2%, the detection rates for a 5% FPR 39% with the Quadruple test markers, 48% with addition of endoglin, 49% with addition of PlGF, and 54% with addition of both.
119

9.
Study ref
Design LoE N Aim/methods Results Comments
(Zeisler et al 2016)
Cohort III-2 1,050 Aim: to derive and validate a ratio of serum sFlt-1 to PlGF that would be predictive of the absence or presence of preeclampsia in the short term in women with singleton pregnancies in whom preeclampsia was suspected (24 weeks 0 days to 36 weeks 6 days of gestation).Methods: In the development cohort (n=500), we identified an sFlt-1:PlGF ratio cut-off of 38 as having important predictive value. This was then applied in a validation cohort (n=550).
In the validation study, an sFlt-1:PlGF ratio of <38 had a NPV (ie no preeclampsia in the subsequent week) of 99.3% (95%CI 97.9 to 99.9), with 80.0% sensitivity (95%CI 51.9 to 95.7) and 78.3% specificity (95%CI 74.6 to 81.7). The positive predictive value of an sFlt-1:PlGF ratio above 38 for a diagnosis of preeclampsia within 4 weeks was 36.7% (95%CI 28.4 to 45.7), with 66.2% sensitivity (95%CI 54.0 to 77.0) and 83.1% specificity (95%CI 79.4 to 86.3).
Funded by Roche Diagnostics
120

9.Algorithms/models in the second trimester
Study ref
Design LoE N Aim/methods Results Comments
(Hui et al 2012)
SLR IV 8 studies115,290 pregnancies
Aim: to review the performance of combined abnormal first and/or second trimester maternal serum markers used in prenatal screening for aneuploidy and open neural tube defects for predicting PE, SGA and stillbirth beyond 24 weeks’ gestation.Methods: Medline, EMBASE, and Cochrane Library databases were searched for studies from 1970 to May 2010 that analyzed predictive abilities of combined serum markers for defined outcomes. Because of the heterogeneity of marker combinations and thresholds, outcome definitions, and analytic methods, limited meta-analysis was possible for the outcomes of PET and SGA only. Three relatively homogeneous studies on prediction of PET were meta-analyzed.
Several single studies demonstrated utility in combining markers to predict adverse outcome; however, this effect was not confirmed after metaanalysis. The most common combination of markers evaluated was alpha fetoprotein and hCG for all outcomes. The highest positive likelihood ratios for predicting PET (5.68; 95% CI 0.73 to 43.97) were seen with combined alpha fetoprotein and hCG (>2.5 multiples of the median).
Currently, no identifiable combination of serum markers performs well as a screening test for preeclampsia, small for gestational age, and stillbirth beyond 24 weeks. Large cohort studies with standardized screening test parameters and outcomes are needed.
121

9.
Study ref
Design LoE N Aim/methods Results Comments
(Fouad Gomaa et al 2016)
Cohort III-2 825 Aim: to identify a method for identifying women at high risk before 20 weeks gestation that is not subject to operator efficiency.Methods: Serum C3 and UtA Doppler indices were measured at 14–20 weeks in low risk primigravidas.
Serum C3 levels at 14–20 weeks of gestation had a sensitivity 83.3%, specificity 100%, PPV 100% and NPV 98.3% when the cut-off value was 53.1 mg/dL. For the mean RI, the best cut off value found was 0.72 with 100% sensitivity, 99.1% specificity, 92.3% PPV and 100% NPV. For the mean PI the best cut off value was 1.35 with 100% sensitivity, 94.1% specificity, 63.2% PPV and 100% NPV. The combination of serum C3 level and mean UtA PI showed 100% sensitivity, 97.4% specificity, 80% PPV and 100%NPV in prediction of PE.
122

9.
Study ref
Design LoE N Aim/methods Results Comments
(Gallo et al 2016)
Cohort 123,406 maternal factors67605 UtA PI31,120 MAP, 10,828PIGF8,079 SFLT-1
Aim: To develop a model for PE based on a combination of maternal factors with second-trimester biomarkers.Methods: With data for maternal factors, UtA PI, MAP, PlGF and SFLT-1, Bayes’ theorem was used to combine risk from maternal factors with various combinations of biomarker MoM values. The modeled performance of screening for PE requiring delivery at <32, <37, and 37 weeks’ gestation was estimated. The modeled performance was compared to the empirical one, which was derived from 5-fold cross validation. We also examined the performance of screening based on risk factors from the medical history, as recommended by ACOG.
In pregnancies that developed PE, the values of MAP, UTPI, and SFLT were increased and PlGF was decreased. For all biomarkers the deviation from normal was greater for early than for late PE, and therefore the performance of screening was inversely related to the gestational age at which delivery became necessary for maternal and/or fetal indications. Screening by maternal factors predicted 52%, 47%, and 37% of PE at <32, <37, and 37 weeks’ gestation, respectively, at a false-positive rate of 10%. The respective values for combined screening with maternal factors and MAP, UTPI, and PlGF were 99%, 85%, and 46%; the performance was not improved by the addition of SFLT. In our population, the DR of PE at <32, <37, and37 weeks with the ACOG recommendations was 91%, 90%, and 91%, respectively, but at a screen positive rate of 67%.
123

9.
Study ref
Design LoE N Aim/methods Results Comments
(Kulmala & Phupong 2014)
Cohort III-2 314 Aim: to determine the predictive value of the combination of sFlt-1 and UtA Doppler for the detection of pre-eclampsia in women of advanced age (38.4—2.5 y) at 16-18 weeks of gestation.Methods: The maternal plasma sFlt-1 level was measured, and uterine artery Doppler was performed at 16-18 weeks of gestation in elderly gravida. The main outcome was preeclampsia. Fourteen women (4.46%) developed preeclampsia.
The sensitivity, specificity, PPV and NPV of UtA Doppler combined with plasma sFlt-1 for preeclampsia prediction were 28.6, 95.7, 23.5 and 96.6%, respectively.For the prediction of early-onset preeclampsia, the sensitivity, specificity, PPV and NPV were 80, 95.8, 23.5 and 99.7%, respectively.
(Parra-Cordero et al 2014)
Case-control
III-2 2,002 Aim: To determine whether OGTs) play a role as predictors of preeclampsia (PE) in pregnant women.Methods: Singleton pregnancies had a UtA Doppler at 22–25 weeks and an OGTT. The UtA Doppler and OGTT were adjusted based on maternal characteristics, and the results were expressed as multiples of the expected normal median and compared between groups. Logistic regression analysis was used to determine whether maternal characteristics, OGTT, and UtA Doppler significantly contribute to the prediction of early- (<34 weeks), intermediate- (34-37 weeks), or late-onset (>37 weeks) PE.
Women who developed PE were characterized by an older maternal age, an increased BMI, and an altered UtA Doppler. The group with intermediate-onset PE was the only one associated with higher 2-hour OGTT levels compared to controls. Combined models using maternal characteristics, UtA Doppler, and OGTT to predict PET were able to detect around 74, 42, and 21% of women who later developed early-, intermediate-, or late-onset PE, respectively, with a 5% false-positive rate.
124

9.
Study ref
Design LoE N Aim/methods Results Comments
(Prajapati & Maitra 2013)
Cohort III-2 200 Aim: To determine the clinical value of UtA Doppler PI at 22–24 + 6 weeks scan and importance of maternal history and MAP in the prediction of pre-eclampsia.Methods: Maternal history and blood pressure were recorded, and MAP was calculated. Transabdominal Doppler ultrasound of UtA was performed. Mean PI was calculated, and the presence or the absence of bilateral early diastolic notch was noted. Women were then followed up through pregnancy and delivery for the development of pre-eclampsia, gestational hypertension, and SGA.
The mean ±SD PI value for subjects who had an adverse pregnancy outcome was significantly higher (0.84±0.28) than for subjects who had normal pregnancy outcome (0.71±0.16); P <0.000.When UtA PI was combined with MAP and past history of pre-eclampsia, the AUC was 0.721 (0.611 to 0.83)
(Puttapitakpong & Phupong 2016)
Cohort III-2 400 Aim: to determine the predictive value of the combination of serum angiopoietin-2 (Ang-2) levels and UtA Doppler for the detection of preeclampsia in women at 16–18 weeks and to identify other pregnancy complications that could be predicted with these combined tests.Methods: Maternal serum Ang-2 levels were measured, and UtA Doppler was performed. The main outcome was preeclampsia. The predictive values of this combination were calculated. Twenty-five women (6.3%) developed preeclampsia.
The sensitivity, specificity, positive predictive value (PPV) and negative predictive value (NPV) of uterine artery Doppler combined with serum Ang-2 levels for the prediction of preeclampsia were 24.0%, 94.4%, 22.2% and 94.9%, respectively. For early-onset preeclampsia, the sensitivity, specificity, PPV and NPV were 57.1%, 94.1%, 14.8% and 99.2%, respectively.
125

9.
Study ref
Design LoE N Aim/methods Results Comments
(Yu et al 2014)
Cohort III-2 1,011 Aim: To explore major risk factors and early prediction methods in the pathogenesis of early onset preeclampsia.Methods: Prenatal screening was performed in second trimester using enzyme-linked immunosorbent assay and epidemiological correlation factors were obtained by telephone. Predictive model of early onset preeclampsia was established and evaluated by single and multiple factor logistic analysis.
Women with early onset pre-eclampsia had significantly elevated hCG (P<0.001). Major risk factors were pregestational BMI >24 (OR 3.649, 95%CI 1.600 to 8.321, P=0.002), history of hypertension, diabetes and nephritis (OR 55.724, 95%CI 8.223 to 377.614, P<0.001), family history of hypertension (OR 6.777, 95%CI 2.917 to 15.742, P<0.001) and risk coefficient for trisomy 21 (OR 3.688, 95%CI 1.013 to 13.429, P=0.048). 0.792 (95 % CI 0.701–0.882).
(Zanello et al 2014)
243 Aim: To develop a model for prediction of late preeclampsia based on maternal history and characteristics, MAP, and circulating levels of mRNA for the placenta- specific 1 (PLAC1) gene in maternal plasma at 14–18 weeks.Method: A Gaussian model was fitted to the log distribution of the multiple of the median (log MoM) PLAC1 mRNA in the PE group and in the unaffected group. Likelihood ratios for log MoM of circulating levels of mRNA for the PLAC1 gene were used to combine the a priori risk from maternal characteristics with MAP to produce patient-specific risks for each case.
Screening by maternal characteristics (including BMI, woman's mother's history of PE, previous PE, and parity) (a priori risk) and MAP detected 46.8% of all cases of late PE at a fixed FPR of 10%. The addition of PLAC1 yielded a DR of 62.8% at the same level of FPR. PLAC1 alone yielded a DR of 30.2%.
126

9.Individual biochemical markers in the third trimester
Study ref
Design LoE N Aim/methods Results Comments
(Andersen et al 2016)
Cohort III-2 1,909 Aim: to investigate how maternal serum soluble Fms-like kinase 1 (sFlt-1), placental growth factor (PlGF), and sFlt-1/PlGF ratio prospectively associate to preeclampsia (PE) and clinical subtypes.Methods: sFlt-1 and PlGF were measured with KRYPTOR assays in gestational weeks (GW) 8–14 and 20–34. Associations to PE were assessed by receiver operating characteristics and logistic regression.
Concentrations of sFlt-1, PlGF, and sFlt-1/PlGF in GW20-34 were predictive of PE development, but not in GW8-14. PlGF outperformed sFlt-1/PlGF ratio with an AUC of 0.755 vs. 0.704, p=0.002. The highest AUC values for PlGF and sFlt-1:PlGF ratio were seen for severe early-onset PE (0.901 and 0.883). NPVs were high for all PE types, but PPVs were low.
(Dawonauth et al 2014)
Cohort III-2 416 Aim: to measure inositol phosphoglycan-P type (IPG-P) in the urine of pregnant women (using an ELISA-based assay).Methods: Women had approximately 10 prenatal visits per pregnancy and a complete follow-up in this same referral centre after the first trimester of pregnancy. Urine samples were collected every 1-4 weeks in all women.
The assay as a diagnostic test showed a positive likelihood ratio of 18.73, a negligible negative likelihood ratio with AUC of 0.99, sensitivity of 96.7%, specificity of 94.8% and remained negative in control women (n=312), women with gestational hypertension (without proteinuria (n=56), and gestational diabetic mothers (n=14). Moreover, as a predictive screening test 2 weeks before the diagnosis of PE, the assay showed sensitivity of 84.2% and specificity of 83.6%.
127

9.
Study ref
Design LoE N Aim/methods Results Comments
(Lai et al 2013d)
Case-control
III-2 300 Aim: To investigate the potential value of maternal serum concentration of soluble endoglin (sEng) at 30-33 weeks' gestation in the prediction of preeclampsia (PE) developing at or after 34 weeks.Methods: Serum sEng was measured at 11-13 and at 30-33 weeks' gestation in women who developed PE at or after 34 weeks in controls. Regression analysis was used to determine which of the factors amongst the maternal characteristics were significant predictors of first- and third-trimester log10 sEng in the control group. MoM values in the PE and controls were compared.
The median sEng MoM at 30-33 weeks was significantly higher in the PE group (1.39, IQR 0.94-2.18) than in the controls (0.95, IQR 0.77-1.19), but at 11-13 weeks there was no significant difference between the groups.
128

9.
Study ref
Design LoE N Aim/methods Results Comments
(Ohkuchi et al 2013)
Cohort III-2 19–25 wks 1,11926–31 wks 798
Aim: to evaluate the onset threshold of plasma levels of the sFlt-1/ PlGF ratio for predicting the imminent onset of PE within 4 weeks after blood sampling.Methods: We prospectively measured the plasma levels of sFlt-1 and PlGF by an automated electrochemi-luminescence immunoassay at 19-25 weeks and 26-31 weeks of gestation. The onset threshold of the sFlt-1/PlGF ratio was determined as the 2.5th percentile of the 95th confidence interval (CI) of a regression line between the onset gestational weeks of PE and the standard deviation score of log 10 (sFlt-1/PlGF), using 25 samples taken within 1 week after the onset of PE.
The imminent onset of PE was identified in 2 (0.2%) women recruited at 19-25 weeks and in 6 (0.8%) women recruited at 26-31 weeks. The onset threshold of plasma levels of the sFlt-1/PlGF ratio at 19-25 weeks showed a sensitivity (SE) of 1.00, a specificity (SP) of 1.00, a positive likelihood ratio (LR+) of and a positive predictive value (PPV) of 1.00; the onset threshold of plasma levels of the sFlt-1/PlGF ratio at 26-31 weeks showed a SE of 0.83, a SP of 0.994, a LR+ of 132 (95% CI: 51-339) and a PPV of 0.50.
129

9.Algorithms/models in the third trimester
Study ref
Design LoE N Aim/methods Results Comments
(Liu et al 2015b)
SLR IV 20 studies
Aim: To investigate the accuracy of the sFlt-1/ PlGF ratio to predict preeclampsia (PE).Methods: A search in the PubMed, Embase, and Cochrane Library was conducted for human studies. We included the studies that reported sufficient data to reconstruct the diagnostic 2 x 2 table of sFlt-1/PlGF with testing of PlGF and sFlt-1 in serum or plasma.
The pooled diagnostic sensitivity and specificity of sFlt-1/PlGF were 0.78 and 0.84 with AUC of 0.88. In subgroup analyses, the diagnostic value of sFlt-1/PlGF for early-onset PE is highest with a pooled diagnostic odds ratio (DOR) of 241 and AUC of 0.98.
The accuracy of sFlt-1/PlGF ratio for screening PE was moderate and was high for early-onset PE. High-quality studies are needed to confirm their usefulness in prediction of PE in clinical practice.
(Garcia-Tizon Larroca et al 2014)
Cohort III-2 4,708 Aim: To assess the risk for preeclampsia (PE) by maternal characteristics, Ut-PI, MAP, PlGF and sFlt-1 at 30-33 weeks' gestation.Methods: We developed a survival time model for the time of delivery for PE by combining maternal characteristics and history with Ut-PI, MAP, PlGF and sFlt-1 MoM values (combined test). Modelled detection rate of all PE and PE requiring delivery within 4 and 6 weeks of the visit was estimated.
Screening by the combined test would detect 66, 98 and 86% of all PE and PE requiring delivery within 4 and 6 weeks of the visit, respectively, at a false positive rate of 5%.
130
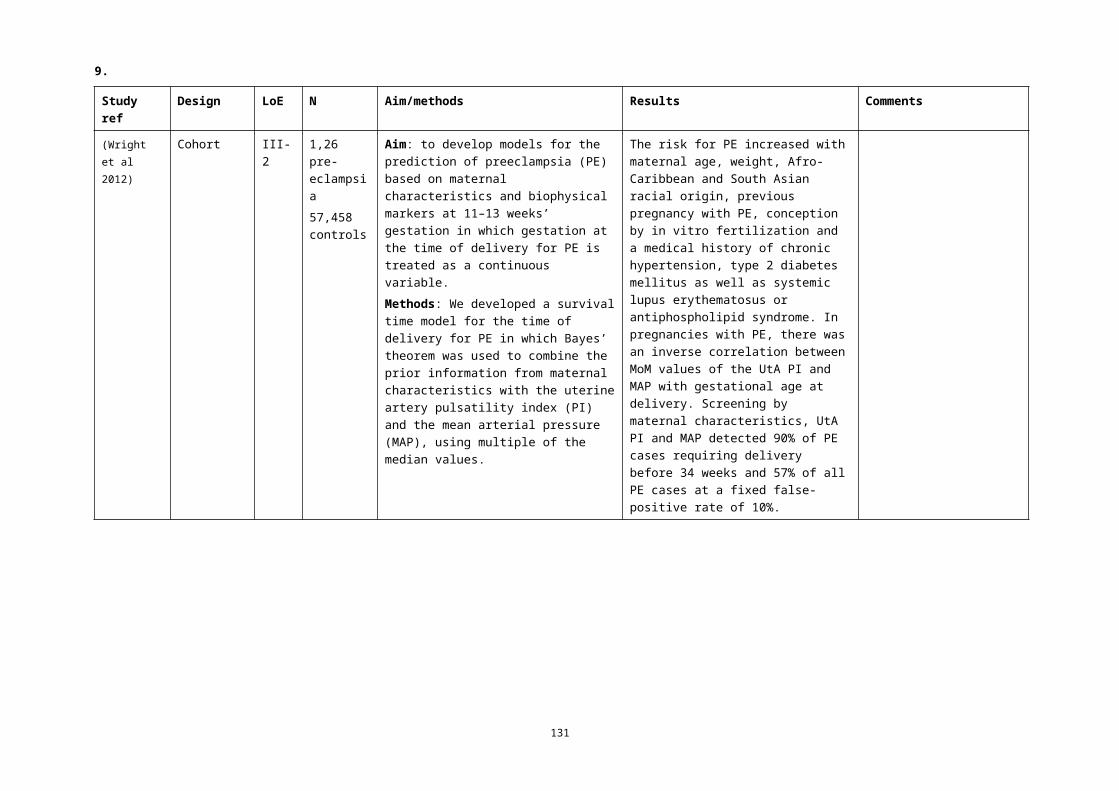
9.
Study ref
Design LoE N Aim/methods Results Comments
(Lai et al 2013a)
Case-control
III-2 300 Aim: To investigate the potential value of maternal serum concentration of activin-A at 30-33 weeks' gestation in the prediction of preeclampsia (PE) developing at or after 34 weeks.Methods: Serum concentrations of activin-A were measured at 11-13 and at 30-33 weeks' gestation in women with pre-eclampsia (n=50) and controls (n=250). The measured values of activin-A were converted into multiples of the unaffected median (MoM), after adjustment for maternal characteristics, and the MoM values in the PE and controls were compared.
The median activin-A MoM at 30-33 weeks was higher in the PE group (1.47, IQR 1.14-2.38 versus 0.99, IQR 0.72-1.42), but at 11-13 weeks there was no significant difference between the groups. In screening by a combination of maternal characteristics and activin-A at 30-33 weeks the detection rate of PE was 50.0% (35.5 to 64.5), at a false positive rate of 10%.
(Lai et al 2013b)
Cohort III-2 4,294 unaffected145 PE161 GH
Aim: To investigate the potential value of measuring MAP, sBP and dBP at 30-33 weeks' gestation in the prediction of preeclampsia (PE) developing at or after 34 weeks.Methods: The a priori risks for intermediate and late PE from maternal demographic characteristics and medical history were determined. The a posteriori risks were calculated by combining the a priori risks with the likelihood ratios for MAP, sBP and dBP, which were calculated from fitted bivariate gaussian distributions.
The mean multiple of median MAP, sBP and dBP were significantly higher in the intermediate and late PE groups than in the normal group. In screening by a combination of maternal characteristics and MAP, the estimated detection rates of intermediate and late PE, at a false-positive rate of 10%, were 70.3 and 62.0%, respectively. The respective detection rates for sBP were 62.2 and 59.3% and for dBP were 62.2 and 57.4%.
131

9.
Study ref
Design LoE N Aim/methods Results Comments
(Lai et al 2013c)
Cohort III-2 145 PE4,294 control
Aim: To investigate the potential value of measuring UtA pulsatility index (PI) at 30-33 weeks' gestation in the prediction of preeclampsia (PE) developing at or after 34 weeks.Methods: The a priori risks for intermediate- and late-PE from maternal demographic characteristics and medical history were derived by logistic regression analysis. The a posteriori risks were calculated by combining the a priori risks with the likelihood ratios for uterine artery PI, which were calculated from fitted bivariate gaussian distributions.
In screening for PE by a combination of maternal characteristics and uterine artery PI, the estimated detection rates of intermediate- and late-PE, at a false-positive rate of 10%, were 70.3 and 54.6%, respectively.
(Lai et al 2013d)
Case-control
III-2 300 Aim: To investigate the potential value of maternal serum concentration of soluble endoglin (sEng) at 30-33 weeks' gestation in the prediction of preeclampsia (PE) developing at or after 34 weeks.Methods: Serum sEng was measured at 11-13 and at 30-33 weeks' gestation in women who developed PE at or after 34 weeks in controls. Regression analysis was used to determine which of the factors amongst the maternal characteristics were significant predictors of first- and third-trimester log10 sEng in the control group. MoM values in the PE and controls were compared.
With a combination of maternal characteristics and third-trimester sEng, the DRs of intermediate- and late-PE, at a false-positive rate of 10%, were 64.3 (35.2 to 87.1)and 50.0% (32.9–67.1), respectively.
132

9.
Study ref
Design LoE N Aim/methods Results Comments
(Lai et al 2014)
Cohort III-2 2,140 PE83,615 unaffected
Aim: To assess the risk for PE by maternal characteristics, PlGF and sFlt-1 at 30–33 weeks' gestation.Methods: We developed a survival time model for the time of delivery (maternal characteristics and history and biochemical test).
In pregnancies with PE, the log10 MoM values of PlGF and sFlt-1 were linearly related to gestational age at delivery. Screening by the biochemical test detected 100, 76, and 62% of PE with delivery within 4, 6 and 8 weeks of the visit, at a fixed false-positive rate of 5%.
(Mosimann et al 2013)
Case-control
III-2 300 Aim: To investigate the potential value of maternal serum concentration of tumour necrosis factor receptor 1 (TNF-R1) at 30-33 weeks' gestation in the prediction of PE developing at or after 34 weeks.Methods: Serum TNF-R1 was measured at 11-13 and at 30-33 weeks' gestation in a case-control study of 50 cases that developed PE at or after 34 weeks and 250 unaffected controls. The measured values of TNF-R1 were converted into multiples of the normal median (MoM) and the MoM values in the PE and control groups were compared.
The median MoM TNF-R1 was significantly increased at both 11-13 weeks (1.094 MoM versus 1.003 MoM) and at 30-33 weeks (1.101 MoM versus 1.006 MoM). In screening for PE by a combination of maternal characteristics and serum TNF-R1 at 30-33 weeks, the estimated detection rates of PE at false positive rate of 10% was 40.0% (26.4–54.8).
133

9.
Study ref
Design LoE N Aim/methods Results Comments
(Tayyar et al 2014)
Cohort III-2 2,140 PE83,615 control
Aim: To assess risk for PE based on maternal characteristics, MAP and Ut-PI at 30-33 weeks' gestation.Methods: We developed a survival time model for the time of delivery for PE by combination of maternal characteristics and history with MAP and Ut-PI multiple of the median (MoM) values (biophysical test). Data on third-trimester MAP and Ut-PI were available in 350 cases of PE and 13,878 of the normal group. The detection rate of PE requiring delivery within 4, 6 and 8 weeks of the visit was estimated.
In pregnancies with PE the log10 MoM values of MAP and Ut-PI were inversely related to gestational age at delivery. Biophysical testing detected 89.7, 65.4 and 53.3% of PE with delivery within 4, 6 and 8 weeks of the visit, at a fixed false-positive rate of 5%.
134

9.
Study ref
Design LoE N Aim/methods Results Comments
(Tsiakkas et al 2016)
Cohort III-2 UTPI 30,935MAP 29,042PIGF 10,123SFLT 8,264
Aim: to examine the performance of screening for PE by a combination of maternal factors with early third-trimester biomarkers.Methods: This was a cohort study and data were derived from consecutive women with singleton pregnancies attending for their routine hospital visit at 30–34 weeks’ gestation in 3 maternity hospitals in England between March 2011 and December 2014.In the first phase of the study, only UTPI was measured and then measurement of MAP was added, and in the final phase, the serum concentration of PlGF was measured and then SFLT was added. The Bayes theorem was used to combine the a priori risk from maternal factors with various combinations of biomarker multiple of the median values. Ten-fold crossvalidation was used to estimate the performance of screening for PE requiring delivery at <37 weeks’ gestation (preterm-PE) and those delivering at ≥37 weeks (term-PE). The empirical performance was compared with model predictions.
In pregnancies that developed PE, the values of MAP, UTPI, and SFLT were increased and PlGF was decreased. For all biomarkers the deviation from normal was greater for preterm-PE than term-PE, and therefore, the performance of screening was inversely related to the gestational age at which delivery become necessary for maternal and/or fetal indications. Combined screening by maternal factors, MAP, UTPI, PlGF, and SFLT predicted 98% (95%CI 88 to 100%) of preterm-PE and 49% (95%CI 42 to 57%) of term-PE, at a false-positive rate of 5%. These empirical detection rates are compatible with the respective model-based rates of 98% and 54%, but the latter were optimistically biased.
135

9.Sequential testing/screening
Study ref
Design LoE N Aim/methods Results Comments
(Gabbay-Benziv et al 2016)
Cohort III-2 2,433 Aim: To compare performance of multimarker algorithm, risk profiles and their sequential application in prediction of preeclampsia and determining potential intervention targets.Methods: Maternal characteristics, ultrasound variables and serum biomarkers were collected prospectively at first trimester. Univariate analysis identified preeclampsia associated variables followed by logistic regression analysis to determine the prediction rule. Combined characteristics of the cardiovascular, metabolic and the personal risk factors were compared to the multimarker algorithm and the sequential application of both methods.
While the multimarker algorithm had the lowest false negative rate, sequential application of cardiovascular and metabolic risk profiles in screen positives reduced false positives by 26% and identified blood pressure and metabolic risk in 49/54 (91%) women with subsequent preeclampsia as treatable risk factors.
136

9.
Study ref
Design LoE N Aim/methods Results Comments
(Gallo et al 2014)
Cohort III-2 17,383 Aim: To assess the performance of screening for PE by MAP at 11-13 and at 20-24 weeks' gestation.Methods: MAP was measured at 11-13 and 20-24 weeks and expressed as MoM after adjustment for maternal characteristics and corrected for adverse pregnancy outcomes. The performance of screening for PE by maternal characteristics and MAP MoM at 11-13 weeks (MAP-1), MAP MoM at 20-24 weeks (MAP-2) and their combination was evaluated.
In screening by maternal characteristics and MAP-1, at a FPR of 10%, the DRs of early PE, preterm PE and total PE were 74.3, 62.9 and 49.3%, respectively; the DR at FPR of 5% were 52.9, 42.7 and 35.8%. In screening by MAP-1 and MAP-2 the DR at FPR of 10%, were 84.3, 65.7 and 52.5%; the DR at FPR of 5% were 60.0, 49.7 and 37.6%, respectively.
(Hirashima et al 2014)
Cohort III-2 Aim: to develop a novel screening model to detect the imminent onset of PE within 4 weeks after blood sampling.Methods: We prospectively collected data regarding past history of PE/gestational hypertension (GH), blood pressure levels at 16-23 weeks and plasma levels of sFlt-1 and PlGF twice at 19-31 weeks.
A three-step approach by sequential selection using maternal factors, including a past history of PE/GH or blood pressure levels >120/80 mm Hg at 16-23 weeks (first step), followed by plasma PlGF in the <5th percentile and sFlt-1 in the >95th percentile yielded both high sensitivity and specificity. The sensitivity, specificity, positive likelihood ratio (95%CI), negative likelihood ratio (95%CI), PPV and NPV for predicting the imminent onset of PE at 19-25 weeks were 100%, 99.8%, 599 (150-2390), 0%, 50% and 100%, respectively; and those at 26-31 weeks were 83%, 99.1%, 94 (42-214), 0.17 (0.03-1.01), 42% and 99.9%, respectively.
137

9.
Study ref
Design LoE N Aim/methods Results Comments
(Li et al 2016b)
Cohort III-2 138 Aim: to evaluate whether the measurement of maternal serum inhibin A, activin A and placental growth factor (PlGF) at 11–13 weeks gestation with the second-trimester UtA PI are useful in predicting preeclampsia in a group of nulliparous women.Methods: All the participants also underwent uterine artery Doppler examination to measure the PI at 22-24 weeks' gestation. Inhibin A, activin A and PlGF were measured using an ELISA by an examiner who was blinded to the pregnancy outcome.
In pregnancies that developed preeclampsia, the UtA PI was increased (1.61±0.047 vs. 1.02±0.049, P<0.001), as was the level of inhibin A (1.72±0.023 vs. 1.03±0.063, P<0.001) and the level of activin A (1.68±0.38 vs. 1.06±0.42, P<0.001) compared with the controls. In contrast, the level of PlGF was decreased in pregnancies that developed preeclampsia (0.69±0.23 vs. 1.00±0.26, P<0.001). A combination of activin A, PlGF and uterine artery PI gave an AUC of 0.915 (95% CI, 0.812 to 0.928; P<0.001) with a sensitivity of 91% at a specificity of 82%.
(Mukhopadhyay et al 2012)
Cohort III-2 160 Aim: to assess the importance of micro-albuminuria and UtA Doppler resistance index as a screening test for pre-eclampsia.Methods: Test for micro-albuminuria was done at 14 weeks, 18 weeks, 28 weeks and 34 weeks of gestation. UtA Doppler resistance index (0.58 taken as cut-off) was recorded at 18 weeks. The subjects were followed up till delivery for development of pre-eclampsia. Sensitivity, specificity, positive and negative predictive value of the tests were calculated.
Sensitivity, specificity, PPV and NPV of micro-albuminuria was 66.67%, 93.24%, 44.44% and 97.18% respectively. Those of UtA Doppler resistance index were 33.33%, 95.96%, 40% and 94.67% respectively. Diagnostic OR of micro-albuminuria and UtA Doppler resistance index were 27.600 and 11.833 respectively.
138

9.
Study ref
Design LoE N Aim/methods Results Comments
(Napolitano et al 2012)
Cohort III-2 3,549 Aim: to assess the relationship of changes in uterine artery (UtA) Doppler pulsatility indices (PI) between first and second trimesters and the subsequent development of pre-eclampsia.Methods: Multiples of median of UtA Doppler PI were used for developing indices describing UtA changes between the two trimesters. Receiver-operating characteristics curves (ROC) were calculated for multiple comparisons.
The best index for predicting pre-eclampsia was the difference between the mean second trimester and mean first trimester UtA PI (AUC for early PE and preterm PE of 0.851 and 0.786, respectively).
139

9.Costs associated with screening, diagnosis and treatment for pre-eclampsia
Study ref
Design LoE N Aim/methods Results Comments
(Zakiyah et al 2015)
Economic analysis
— 6 studies Aim: to provide an overview of the existing evidence on the health economics of screening, diagnosis and treatment options in pre-eclampsia.Methods: We searched PubMed, EMBASE and the Cochrane Library for studies on screening, diagnosis, treatment or prevention of pre-eclampsia, published between 1994 and 2014. Full papers in English containing complete economic assessments were included.Three studies were on the cost effectiveness of treatment (two evaluated magnesium sulphate for prevention of seizures and the third induction of labour vs expectant monitoring). The other three studies were aimed at screening and diagnosis, in combination with subsequent preventive measures.
The screening studies were quite diverse in their objectives as well as in their conclusions. One study concluded that screening is probably not worthwhile, while two other studies stated that in certain scenarios it may be cost effective to screen all pregnant women and prophylactically treat those who are found to be at high risk of developing pre-eclampsia. Universal screening for pre-eclampsia, using a biomarker, will be feasible only when accuracy is significantly increased.The two studies on magnesium sulphate were equivocal on the cost effectiveness in non-severe cases, and the other study suggested that induction of labour in term pre-eclampsia was more cost effective than expectant monitoring.
Q4 What are the harms of not screening for pre-eclampsia?
No studies identified
140
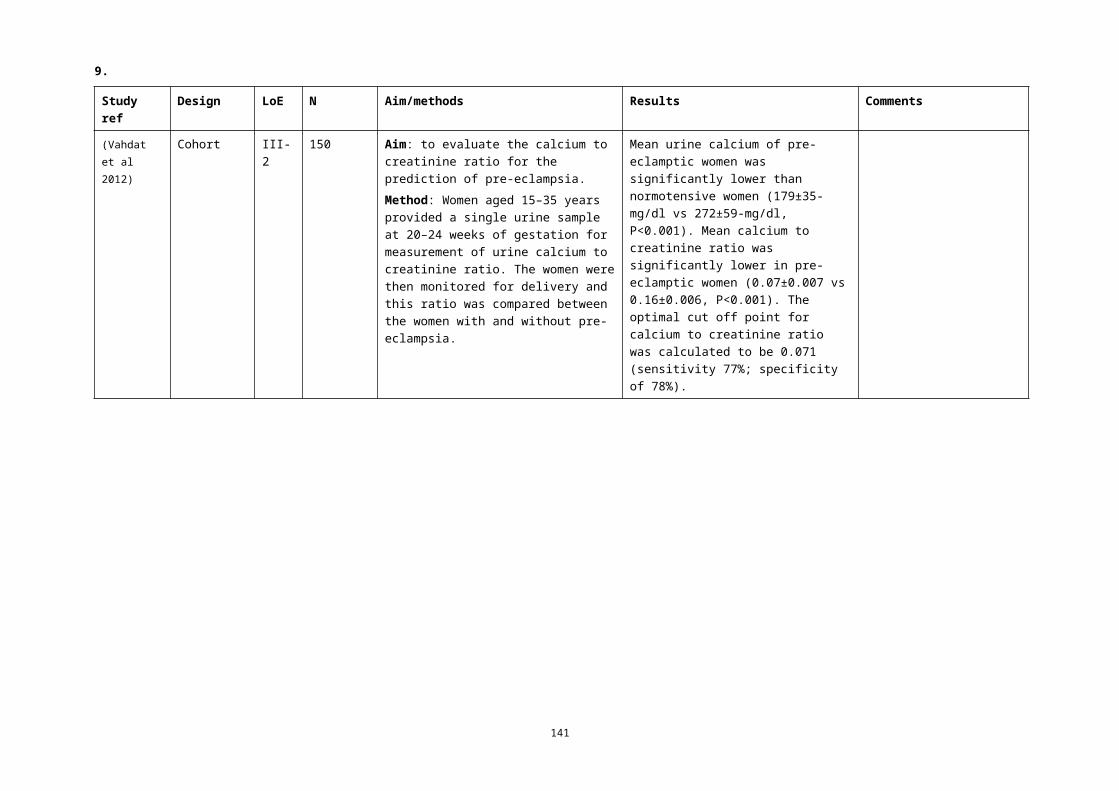
9.
Q5 What are the maternal and/or fetal benefits of screening for pre-eclampsia?
Study ref
Design LoE N Aim/methods Results Comments
(Meiri et al 2014)
Cohort III-2 820 Aim: to evaluate placental protein 13 (PP13) and risk factors (RFs) as markers for predicting preeclampsia (PE) and use of aspirin for PE prevention.Methods: First-trimester pregnancy screening was based on having PP13 level < 0.4 multiple of the median (MoM) and/or at least one major risk factor (RF) for PE. Management was by routine care or combined with daily treatment with 75 mg aspirin between 14 and 35 weeks of gestation.
PE prevention by aspirin was most effective when the risk was determined by low PP13 alone, less effective for combining low PP13 with RFs, and ineffective when determined by RFs alone.
Don’t have full text
141

9.
Study ref
Design LoE N Aim/methods Results Comments
(Park et al 2015)
Cohort III-2 5,783 Aim: To examine the effect of a combination of screening and treatment with low-dose aspirin on the prevalence of early-onset pre-eclampsia (PE).Methods: This was a retrospective analysis of two consecutive cohorts of women screened for early PE. The first cohort (n=3,066) was observed to determine whether algorithms developed to screen for PE at 11 to13+6weeks’ gestation could be applied to our population. High-risk women in the second cohort (n=2,717) were advised on their risk and offered aspirin (150 mg at night), with treatment starting immediately after screening.
There were 12 (0.4%) cases of early PE in the observational cohort and one (0.04%) in the interventional cohort (P<0.01). Among all women with PE delivering before 37 weeks, 25 (0.83%) were in the observational cohort and 10 (0.37%) in the interventional cohort (P=0.03).
142

9.
Q6 When in pregnancy should screening be carried out?
Study ref
Design LoE N Aim/methods Results Comments
(Lambert-Messerlian et al 2014)
Nested case-control
III-2 98 PE each matched to 5 control
Aim: to examine the association between preeclampsia and biochemical markers, in matched first and second trimester maternal serum samples.Method: Stored samples were available from 'integrated' Down syndrome screening. Population distribution parameters and within and between trimester correlations were derived for cases and controls for six markers, as well as in case subgroups.
Second trimester associations were stronger than those in the first (e.g. PAPP-A 2.45, p < 0.01). No between-trimester associations were found that would provide important improvements in prediction.
Q7 What are the benefits and risks of the predictive tests (eg PAPP-A) to identify women at risk of pre-eclampsia?
See Q3
Q8 Should every woman be tested for proteinuria at every antenatal visit if blood pressure remains normal?
No studies identified
2.2 Excluded studies for screening
Background papersBackground papers will inform revision of the narrative.
143

9.
(ACOG 2015) Hypertensive disorders with adverse sequelae (including preterm birth, maternal morbidity and mortality, and long-term risk of maternal cardiovascular disease) complicate 5-10% of pregnancies. Early identification of pregnant women at risk of developing early-onset preeclampsia would theoretically allow referral for more intensive surveillance or application of preventive therapies to reduce the risk of severe disease. In practice, however, the effectiveness of such triage would be hindered by the low positive predictive value for early-onset preeclampsia reported in the literature. In spite of the modest predictive value of first-trimester preeclampsia risk assessment and the lack of data demonstrating improved clinical outcomes, commercial tests are being marketed for the prediction of preeclampsia in the first trimester. Taking a detailed medical history to evaluate for risk factors is currently the best and only recommended screening approach for preeclampsia; it should remain the method of screening for preeclampsia until studies show that a or other interventions reduce the incidence of preeclampsia for women at high risk based on first-trimester predictive tests.
(USPSTF 2016) Obtaining blood pressure measurements to screen for preeclampsia could allow for early identification and diagnosis of the condition, resulting in close surveillance and effective treatment to prevent serious complications. The USPSTF has previously established that there is adequate evidence on the accuracy of blood pressure measurements.The USPSTF found adequate evidence that testing for protein in the urine with a dipstick test has low diagnostic accuracy for proteinuria detection in pregnancy.The USPSTF recommends the use of low-dose aspirin (81 mg/day) as preventive medication after 12 weeks of gestation in women who are at high risk for preeclampsia.
Other exclusions
Study Reason for exclusion
(2012) DELFIA® Xpress PlGF kit antenatal screening test to predict risk of pre-eclampsia (Structured abstract). Does not meet criteria for grading
(2016). "Preeclampsia screening recommended by USPSTF." Clinical Advisor 19(11): 18-18. Summary
Akolekar, R., et al. (2013). "Competing risks model in early screening for preeclampsia by biophysical and biochemical markers." Fetal Diagnosis and Therapy 33(1): 8-15.
Included in SLR
Anderson, U. D., et al. (2012). "Review: Biochemical markers to predict preeclampsia." Placenta 33 Suppl: S42-47. Narrative review
Austdal, M., et al. (2015). "First trimester urine and serum metabolomics for prediction of preeclampsia and gestational hypertension: A prospective screening study." International Journal of Molecular Sciences 16(9): 21520-21538.
Relevant to research not practice
Bahado-Singh, R. O., et al. (2012). "Metabolomics and first-trimester prediction of early-onset preeclampsia." Journal of Maternal-Fetal and Neonatal Medicine 25(10): 1840-1847.
Included in SLR
Baschat, A. A. (2015). "First-trimester screening for pre-eclampsia: moving from personalized risk prediction to prevention." Ultrasound in obstetrics & gynecology : the official journal of the International Society of Ultrasound in Obstetrics and Gynecology 45(2): 119-129.
Editorial
144

9.
Study Reason for exclusion
Black, M. and E. Y. L. Leungb (2014). "A report from #BlueJC: Can measuring angiogenic factors help with predicting preterm pre-eclampsia in low-risk women?" BJOG: An International Journal of Obstetrics and Gynaecology 121(3): 375.
Does not meet criteria for grading
Boucoiran, I., et al. (2013). "Repeated measures of placental growth factor, placental protein 13, and a disintegrin and metalloprotease 12 at first and second trimesters for preeclampsia screening." American Journal of Perinatology 30(8): 681-688.
Included in SLR
Carbillon, L. (2012). "First trimester uterine artery Doppler for the prediction of preeclampsia and foetal growth restriction." Journal of Maternal-Fetal and Neonatal Medicine 25(7): 877-883.
Narrative review
Carolan, MC et al (2013) Very advanced maternal age and morbidity in Victoria, Australia: a population based study. BMC Pregnancy and Childbirth 2013, 13:80.
Does not answer research question
Chen, JS, Ford, JB, Roberts CL et al (Pregnancy outcomes in women with juvenile idiopathic arthritis: a population-based study. Rheumatology 2013;52:1119–1125
Not specific to target population
Craici, I. M., et al. (2013). "Podocyturia predates proteinuria and clinical features of preeclampsia: Longitudinal prospective study." Hypertension 61(6): 1289-1296.
Relevant to research not practice
D'Antonio, F., et al. (2013). "Comparison of wavelet transform and time-domain analysis of second trimester uterine artery doppler waveforms in screening for pre-eclampsia." Fetal Diagnosis and Therapy 33(3): 189-193.
Relevant to research not practice
Delic, R., et al. (2014). "Statistical regression model of standard and new laboratory markers and its usefulness in prediction of preeclampsia." Journal of Maternal-Fetal & Neonatal Medicine 27(4): 388-392.
Not specific to target population
Diguisto, C., et al. (2013). "Second-trimester uterine artery Doppler, PlGF, sFlt-1, sEndoglin, and lipid-related markers for predicting preeclampsia in a high-risk population." Prenatal Diagnosis 33(11): 1070-1074.
Not specific to target population
Dynon, K., et al. (2012). "HtrA3 as an Early Marker for Preeclampsia: Specific Monoclonal Antibodies and Sensitive High-Throughput Assays for Serum Screening." PLoS ONE 7 (9) (no pagination)(e45956).
Does not answer research question
El Hassan, M. A., et al. (2015). "Preeclampsia: An old disease with new tools for better diagnosis and risk management." Clinical Chemistry 61(5): 694-698.
Narrative review
El Sherbiny, W. S., et al. (2012). "Placental protein 13 as an early predictor in egyptian patients with preeclampsia, correlation to risk, and association with outcome." Journal of Investigative Medicine 60(5): 818-822.
Included in SLR
Elliott, S. E., et al. (2014). "Characterization of antibody specificities associated with preeclampsia." Hypertension 63(5): 1086-1093.
Does not answer research question
145

9.
Study Reason for exclusion
Forest, J. C., et al. (2012). "Candidate biochemical markers for screening of pre-eclampsia in early pregnancy." Clinical Chemistry and Laboratory Medicine 50(6): 973-984.
Narrative review
Ghosh, S. K., et al. (2013). "Is serum placental growth factor more effective as a biomarker in predicting early onset preeclampsia in early second trimester than in first trimester of pregnancy?" Archives of Gynecology and Obstetrics 287(5): 865-873.
Included in SLR
Giguere, Y., et al. (2012). "Candidate clinical factors and biomarkers for early prediction of preeclampsia: Performance of a multivariate algorithm in a low-risk population." Clinical Chemistry 1): A144-A145.
Does not meet criteria for grading
Giguere, Y., et al. (2015). "Screening for pre-eclampsia early in pregnancy: Performance of a multivariable model combining clinical characteristics and biochemical markers." BJOG: An International Journal of Obstetrics and Gynaecology 122(3): 402-410.
Included in SLR
Gizzo, S., et al. (2015). "Could molecular assessment of calcium metabolism be a useful tool to early screen patients at risk for pre-eclampsia complicated pregnancy? Proposal and rationale." Clinical Chemistry and Laboratory Medicine 53(7): 975-979.
Narrative review
Goetzinger, K. R., et al. (2013). "Efficiency of first-trimester uterine artery Doppler, a-disintegrin and metalloprotease 12, pregnancy-associated plasma protein a, and maternal characteristics in the prediction of preeclampsia." Journal of ultrasound in medicine : official journal of the American Institute of Ultrasound in Medicine 32(9): 1593-1600.
Included in SLR
Griffin, M. and A. H. Shennan (2014). "Clinical applications of biomarkers in preeclampsia." Biomarkers in Medicine 8(4): 459-470.
Narrative review
Gurgel Alves, J. A., et al. (2014). "First-trimester maternal ophthalmic artery Doppler analysis for prediction of pre-eclampsia." Ultrasound in obstetrics & gynecology : the official journal of the International Society of Ultrasound in Obstetrics and Gynecology 44(4): 411-418.
Does not answer research question
Hagmann, H., et al. (2012). "The promise of angiogenic markers for the early diagnosis and prediction of preeclampsia." Clinical Chemistry 58(5): 837-845.
Narrative review
Hahn, S., et al. (2015). "Biomarker development for presymptomatic molecular diagnosis of preeclampsia: Feasible, useful or even unnecessary?" Expert Review of Molecular Diagnostics 15(5): 617-629.
Narrative review
Hannaford, K. E., et al. (2015). "First-trimester 3-dimensional power Doppler placental vascularization indices from the whole placenta versus the placental bed to predict preeclampsia: does pregnancy-associated plasma protein a or uterine artery Doppler sonography help?" Journal of ultrasound in medicine : official journal of the American Institute of Ultrasound in Medicine 34(6): 965-970.
Relevant to research not practice
146

9.
Study Reason for exclusion
Hashish, N., et al. (2015). "Could 3D placental volume and perfusion indices measured at 11-14 weeks predict occurrence of preeclampsia in high-risk pregnant women?" Journal of Maternal-Fetal and Neonatal Medicine 28(9): 1094-1098.
Relevant to research not practice
Hyde, C. and S. Thornton (2013). "Does screening for pre-eclampsia make sense?" BJOG: An International Journal of Obstetrics and Gynaecology 120(10): 1168-1170.
Narrative review
Inversetti, A., et al. (2014). "Predictive biomarkers of pre-eclampsia and effectiveness of preventative interventions for the disease." Expert Opinion on Biological Therapy 14(8): 1161-1173.
Narrative review
Jorgensen, J. M., et al. (2014). "Ethical issues related to screening for preeclampsia." Bioethics 28(7): 360-367. Narrative review
Jorgensen, J. M., et al. (2014). "Including ethical considerations in models for first-trimester screening for pre-eclampsia." Reproductive BioMedicine Online 28(5): 638-643.
Narrative review
Judd, F et al Adverse obstetric and neonatal outcomes in women with severe mental illness: To what extent can they be prevented? Schizophrenia Research 157 (2014) 305–309
Not specific to target population
Kalousova, M., et al. (2014). "Pregnancy-associated plasma protein a (papp-a) and preeclampsia." (63): 169-209. Narrative review
Kane, S. C. (2016). "First trimester screening for pre-eclampsia." Obstetric Medicine 9(3): 106-112.**fulltext now found. Narrative review
Kane, S. C., et al. (2014). "New directions in the prediction of pre-eclampsia." Australian and New Zealand Journal of Obstetrics and Gynaecology 54(2): 101-107.
Narrative review
Karampas, G. A., et al. (2016). "Prediction of pre-eclampsia combining NGAL and other biochemical markers with Doppler in the first and/or second trimester of pregnancy. A pilot study." European Journal of Obstetrics Gynecology and Reproductive Biology 205: 153-157.
Relevant to research not practice
Katsipi, I., et al. (2014). "The use of pulse wave velocity in predicting pre-eclampsia in high-risk women." Hypertension Research 37(8): 733-740.
Not specific to target population
Kawasaki, K., et al. (2014). "Reliable pre-eclampsia pathways based on multiple independent microarray data sets." Molecular Human Reproduction 21(2): 217-224.
Does not answer research question
Kelder, T. P., et al. (2012). "Quantitative polymerase chain reaction-based analysis of podocyturia is a feasible diagnostic tool in preeclampsia." Hypertension 60(6): 1538-1544.
Relevant to research not practice
Keikkala, E., et al. (2013). "First trimester hyperglycosylated human chorionic gonadotrophin in serum - A marker of early-onset preeclampsia." Placenta 34(11): 1059-1065.
Included in SLR
147

9.
Study Reason for exclusion
Kenny, L. C., et al. (2014). "Early pregnancy prediction of preeclampsia in nulliparous women, combining clinical risk and biomarkers: The Screening for Pregnancy Endpoints (SCOPE) international cohort study." Hypertension 64(3): 644-652.
Included in SLR
Kolialexi, A., et al. (2015). "Validation of serum biomarkers derived from proteomic analysis for the early screening of preeclampsia." Disease Markers 2015 (no pagination)(121848).
Relevant to research not practice
Kuc, S., et al. (2014). "Metabolomics profiling for identification of novel potential markers in early prediction of preeclampsia." PLoS ONE 9 (5) (no pagination)(e98540).
Relevant to research not practice
Lai, J., et al. (2013). "Maternal serum placental growth factor, pregnancy-associated plasma protein-A and free beta-human chorionic gonadotrophin at 30-33 weeks in the prediction of pre-eclampsia." Fetal Diagnosis and Therapy 33(3): 164-172.
Included in SLR
Lehnen, H., et al. (2013). "Prenatal clinical assessment of sFlt-1 (Soluble fms-like tyrosine kinase-1)/PlGF (placental growth factor) ratio as a diagnostic tool for preeclampsia, pregnancy-induced hypertension, and proteinuria." Geburtshilfe und Frauenheilkunde 73(5): 440-445.
Not in English
Liu, Z., et al. (2012). "Soluble fms-like tyrosine kinase 1 and soluble endoglin are elevated circulating anti-angiogenic factors in pre-eclampsia." Pregnancy Hypertension 2(4): 358-367.
Narrative review
Logie, J. J., et al. (2012). "Evaluation of kisspeptin levels in obese pregnancy as a biomarker for pre-eclampsia." Clinical Endocrinology 76(6): 887-893.
Not specific to target population
Lowe, S. A., et al. (2014). "Caution regarding first trimester screening for pre-eclampsia." Australian and New Zealand Journal of Obstetrics and Gynaecology 54(4): 394-395.
Letter
Mace, G., et al. (2012). "Ultrasound markers for the detection of women at risk of developing pre-eclampsia." Clinical Chemistry and Laboratory Medicine 50(6): 1009-1014.
Narrative review
Mathur, P., et al. (2016). "A Prospective Study of Placental Growth Factor Assay as a Novel Biomarker in Predicting Early-Onset Preeclampsia in High-Risk Patients." Journal of Obstetrics and Gynecology of India 66: 98-103.
Not specific to target population
Maymon, R., et al. (2016). "Developing a new algorithm for first and second trimester preeclampsia screening in twin pregnancies." Hypertension in Pregnancy: 1-8.
Not specific to target population
McCarthy, E. A., et al. (2015). "Effectiveness and safety of 1 vs 4 h blood pressure profile with clinical and laboratory assessment for the exclusion of gestational hypertension and pre-eclampsia: a retrospective study in a university affiliated maternity hospital." BMJ Open 5(11): e009492.
Does not answer research question
148

9.
Study Reason for exclusion
McCarthy, F. P., et al. (2015). "Altered Maternal Plasma Glycogen Phosphorylase Isoenzyme BB as a Biomarker for Preeclampsia and Small for Gestational Age." Reproductive Sciences 23(6): 738-747.
Relevant to research not practice
Meher, P. and A. K. Mishra (2015). "Platelet dysfunction in pre-eclamptic mothers." Indian Journal of Physiology and Pharmacology 1): 93-94.
Does not meet criteria for grading
Mikat, B., et al. (2012). "Early detection of maternal risk for preeclampsia." ISRN Obstetrics and Gynecology (no pagination)(172808).
Narrative review
Moiety, F. S., et al. (2014). "Albumin to creatinine ratio in a random urine sample: Correlation with severity of preeclampsia." Alexandria Journal of Medicine 50(2): 139-142.
Not specific to target population
Mone, F., et al. (2016). "An open-label randomized-controlled trial of low dose aspirin with an early screening test for pre-eclampsia and growth restriction (TEST): Trial protocol." Contemporary Clinical Trials 49: 143-148.
protocol
Moore Simas, T. A., et al. (2014). "Angiogenic biomarkers for prediction of early preeclampsia onset in high-risk women." Journal of Maternal-Fetal and Neonatal Medicine 27(10): 1038-1048.
Included in SLR
Myers, J. E., et al. (2013). "Angiogenic factors combined with clinical risk factors to predict preterm pre-eclampsia in nulliparous women: A predictive test accuracy study." BJOG: An International Journal of Obstetrics and Gynaecology 120(10): 1215-1223.
Included in SLR
Myers, J. E., et al. (2013). "Integrated proteomics pipeline yields novel biomarkers for predicting preeclampsia." Hypertension 61(6): 1281-1288.
Relevant to research not practice
Myers, J. E., et al. (2015). "Mid-trimester maternal ADAM12 levels differ according to fetal gender in pregnancies complicated by preeclampsia." Reproductive Sciences 22(2): 235-241.
Does not answer research question
Navaratnam, K., et al. (2013). "A multi-centre phase IIa clinical study of predictive testing for preeclampsia: Improved pregnancy outcomes via early detection (IMPROvED)." BMC Pregnancy and Childbirth 13 (no pagination)(226).
Does not meet criteria for grading
Neto, R. M. and J. G. L. Ramos (2016). "3D power Doppler ultrasound in early diagnosis of preeclampsia." Pregnancy Hypertension 6(1): 10-16.
Relevant to research not practice
O'Gorman, N., et al. (2016). "Study protocol for the randomised controlled trial: Combined multimarker screening and randomised patient treatment with ASpirin for evidence-based PREeclampsia prevention (ASPRE)." BMJ Open 6 (6) (no pagination)(e011801).
protocol
O'Gorman, N., et al. (2016). "The use of ultrasound and other markers for early detection of preeclampsia." Women's Health 12(2): 199-207.
Narrative review
149

9.
Study Reason for exclusion
Oguic, S. K. (2013). "Laboratory parameters in diagnosis of preeclampsia and HELLP sindrome." Neurologia Croatica 62(SUPPL.2): 127-131.
Narrative review
Olatunji, R. B., et al. (2015). "Maternal ophthalmic artery Doppler velocimetry in pre-eclampsia in Southwestern Nigeria." International Journal of Women's Health 7: 723-734.
Does not answer research question
Oliveira, N., et al. (2014). "External validity of first-trimester algorithms in the prediction of pre-eclampsia disease severity." Ultrasound in obstetrics & gynecology : the official journal of the International Society of Ultrasound in Obstetrics and Gynecology 44(3): 286-292.
Does not answer research question
Ozdamar, O., et al. (2014). "The role of maternal serumbeta-Hcg and PAPP-A levels at gestational weeks 10 to 14 in the prediction of Pre-Eclampsia." Pakistan Journal of Medical Sciences 30(3).
Included in SLR
Papantoniou, N., et al. (2013). "RASSF1A as a fetal marker for early screening for preeclampsia." Prenatal Diagnosis 33: 79-80.
Included in systematic review
Park, F., et al. (2016). "Prediction and Prevention of Early-Onset Preeclampsia: Impact of Aspirin after First-Trimester Screening." Obstetrical and Gynecological Survey 71(1): 11-13. Abstract and editorial
Does not meet criteria for grading
Park, H. J., et al. (2014). "Screening models using multiple markers for early detection of late-onset preeclampsia in low-risk pregnancy." BMC Pregnancy and Childbirth 14 (1) (no pagination)(35).
Included in SLR
Park, H. J., et al. (2015). "Combined screening for early detection of pre-eclampsia." International Journal of Molecular Sciences 16(8): 17952-17974.
Narrative review
Parra-Cordero, M. (2013). "Should a first-trimester risk assessment for pre-eclampsia be routinely offered?" Fetal and Maternal Medicine Review 24(2): 129-133. Opinion
Does not meet criteria for grading
Poon, L. C. and K. H. Nicolaides (2014). "First-trimester maternal factors and biomarker screening for preeclampsia." Prenatal Diagnosis 34(7): 618-627.
Narrative review
Quach, K., et al. (2014). "A combination of single nucleotide polymorphisms in the 3'untranslated region of HLA-G is associated with preeclampsia." Human Immunology 75(12): 1163-1170.
Does not answer research question
Redman, C. W. G. and A. C. Staff (2015). "Preeclampsia, biomarkers, syncytiotrophoblast stress, and placental capacity." American Journal of Obstetrics and Gynecology Part S. 213(4): S9.e1-S9.e4.
Does not answer research question
Rodriguez, A., et al. (2016). "First-, Second-, and Third-Trimester Screening for Preeclampsia and Intrauterine Growth Restriction." Clinics in Laboratory Medicine 36(2): 331-351.
Narrative review
150

9.
Study Reason for exclusion
Salvador-Moysen, J., et al. (2012). "Salivary cortisol levels as a predictor of preeclampsia in adolescents." Colombia Medica 43(1): 46-53.
Not in English
Santillan, M. (2015). "Early prediction of preeclampsia: Hope for early intervention?" Current Women's Health Reviews 11(2): 120-126.
Narrative review
Schneuer, F. J., et al. (2012). "First trimester screening of maternal placental protein 13 for predicting preeclampsia and small for gestational age: In-house study and systematic review." Placenta 33(9): 735-740.
Included in SLR
Shaw, S. W. S., et al. (2015). "First trimester screening of preeclampsia in Taiwan." Prenatal Diagnosis 35: 80-81. Does not meet criteria for grading
Sibai, B. M. (2015). "First-trimester screening with combined maternal clinical factors, biophysical and biomarkers to predict preterm pre-eclampsia and hypertensive disorders: Are they ready for clinical use?" BJOG: An International Journal of Obstetrics and Gynaecology 122(3): 282-283.
Does not meet criteria for grading
Smits LJM, North RA, Kenny LC, Myers J, Dekker GA, Mccowan LME. Patterns of vaginal bleeding during the first 20 weeks of pregnancy and risk of pre-eclampsia in nulliparous women: results from the SCOPE study. Acta Obstet Gynecol Scand 2012; 91:1331–1338.
Does not answer research question
Soma-Pillay, P. and P. Macdonald (2016). "Early detection of pre-eclampsia." Obstetrics and Gynaecology Forum 26(3): 5-8.
Narrative review
Song, J., et al. (2015). "Identification of early-onset preeclampsia-related genes and microRNAs by bioinformatics approaches." Reproductive Sciences 22(8): 954-963.
Does not answer research question
Svirsky, R., et al. (2014). "First trimester markers of preeclampsia in twins: Maternal mean arterial pressure and uterine artery Doppler pulsatility index." Prenatal Diagnosis 34(10): 956-960.
Not specific to target population
Wang, T., et al. (2014). "Elevation of urinary adipsin in preeclampsia: correlation with urine protein concentration and the potential use for a rapid diagnostic test." Hypertension 64(4): 846-851.
Not specific to target population
Win, S. H., et al. (2015). "Relationship of urinary calcium creatinine ratio and severity of pre-eclampsia." BJOG: An International Journal of Obstetrics and Gynaecology 122: 314.
Does not meet criteria for grading
Wotherspoon, A. C., et al. (2016). "Evaluation of biomarkers for the prediction of pre-eclampsia in women with type 1 diabetes mellitus: A systematic review." Journal of Diabetes and its Complications 30(5): 958-966.
Not specific to target population
Xu, Q. L., et al. (2014). "The predictive value of the first-trimester maternal serum chemerin level for pre-eclampsia." Peptides 62: 150-154.
Included in SLR
151
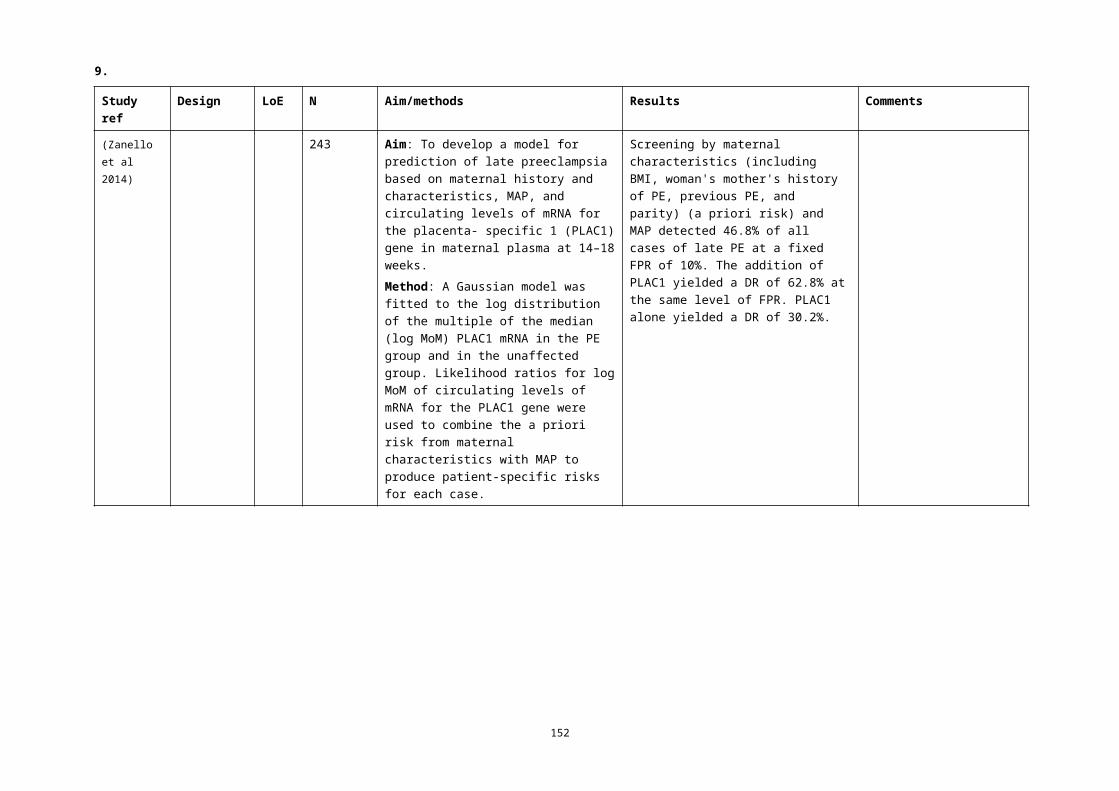
9.
Study Reason for exclusion
Yu, H., et al. (2013). "Quantification of maternal serum cell-free fetal DNA in early-onset preeclampsia." International Journal of Molecular Sciences 14(4): 7571-7582.
Included in SLR
Zhai, T., et al. (2016). "Feasibility of nephrinuria as a screening tool for the risk of pre-eclampsia: Prospective observational study." BMJ Open 6 (8) (no pagination)(e011229).
Does not answer research question
152
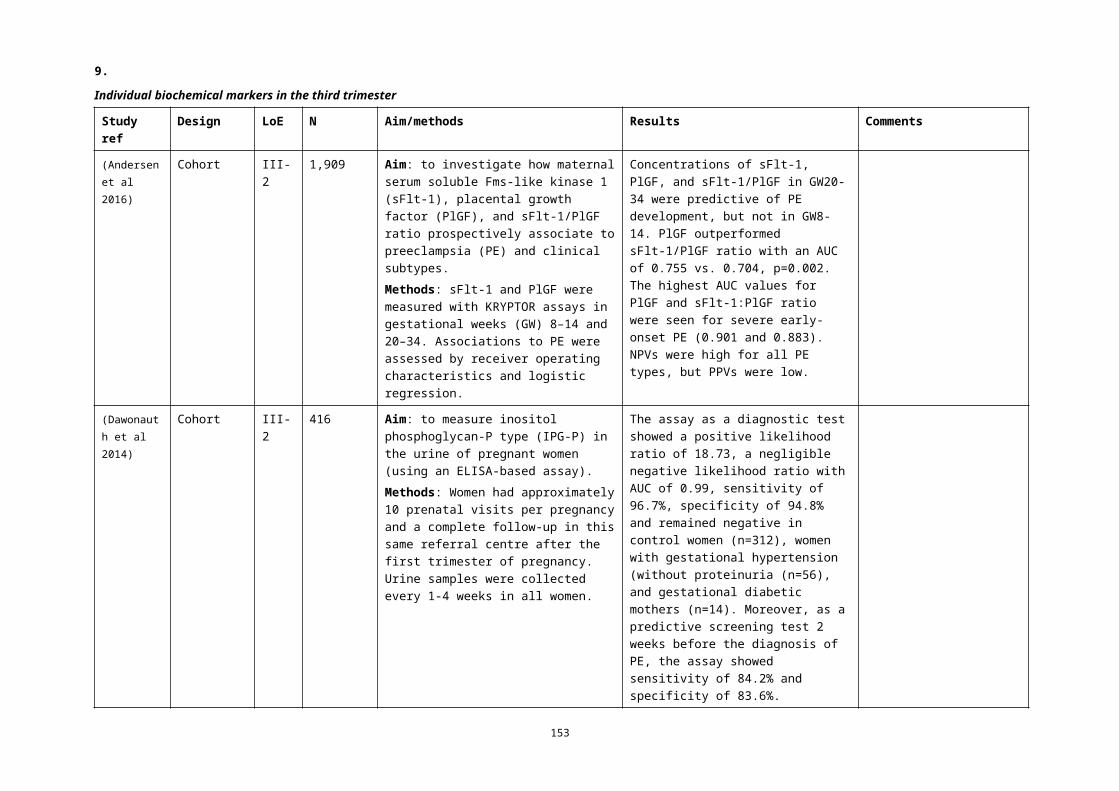
10.
3 Women at risk
3.1 Evidence summaryResults of the previous reviewThe same question on advice for women at risk was asked in the literature review conducted to inform Module II of the guidelines (Australian Health Ministers' Advisory Council 2014). No specific studies were identified.Results of the current reviewOne qualitative study explored women’s responses to advice on their risk of pre-eclampsia and noted two coping styles and potential negative and positive effects of disclosing risk (Harris et al 2014).Advice to EWGInclude the study above in the narrative.
153

11.
Q9 What advice should women who are at risk of developing pre-eclampsia receive?
Study ref
Design LoE N Aim/methods Results Comments
(Harris et al 2014)
Cross-section
IV 20 Aim: to investigate the potential psychological benefits, harms and acceptability of providing pregnant women with formal risk information for pre-eclampsia.Methods: Women were interviewed using a theoretically informed semi-structured schedule and transcripts were analysed thematically using Framework Analysis.
Two types of coping typologies:• 'danger managers' who had an
internal sense of control, were focused on the risk that pre-eclampsia presented to them and exhibited information seeking, positive behaviour changes, and cognitive reappraisal coping mechanisms
• 'fear managers' who had an external sense of control, were focused on the risk that pre-eclampsia presented to the fetus, and exhibited avoidance coping mechanisms.
Three universal themes emerged: 'medicalising the pregnancy', 'embracing technology' and 'acceptability'.There are potential positive (ie self-instigated behaviour change) and negative (ie reduced self-monitoring of fetal movements as the pregnancy develops) unintended consequences following a first-trimester screening test for pre-eclampsia.
Not generalisable to the Australian setting women underwent universal biochemical screening
154
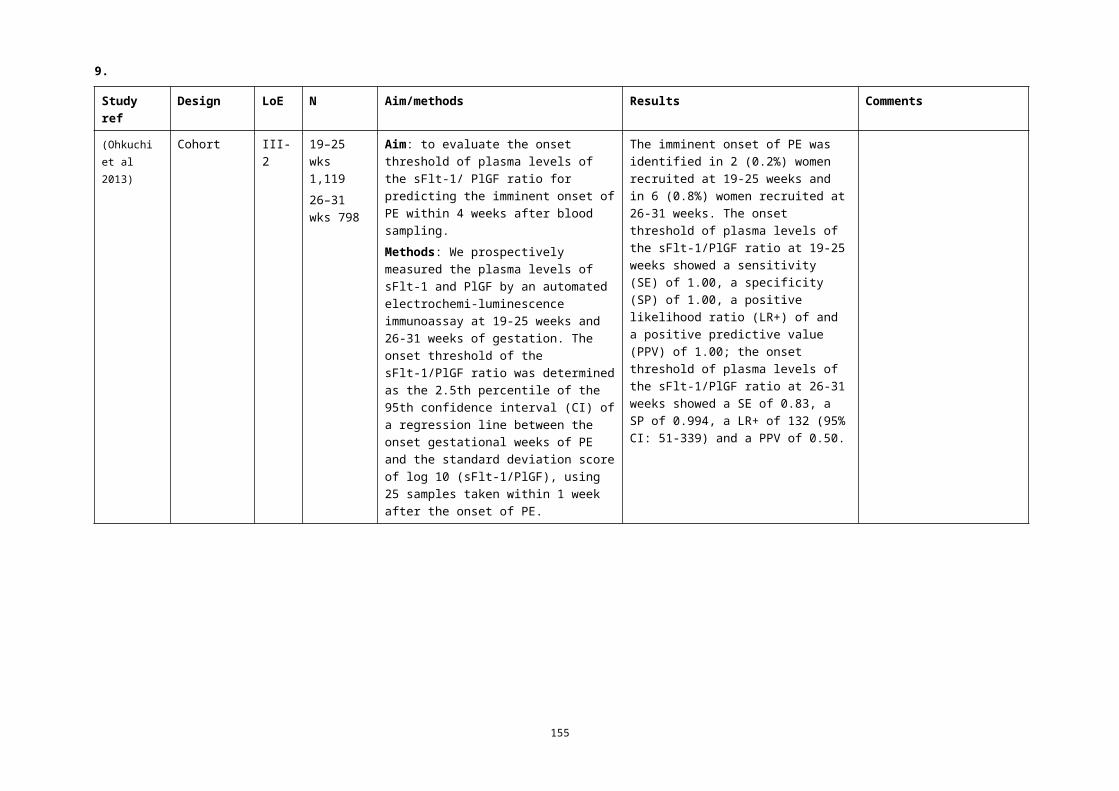
12.
4 What are additional considerations for Aboriginal and Torres Strait Islander women?
Evidence summaryResults of the previous reviewThis question was not asked in the literature review conducted to inform Module II of the Guidelines (Australian Health Ministers' Advisory Council 2014). Results of the current reviewNo studies identified.
155

13.
BibliographyACOG (2015) Committee Opinion No. 638: First-Trimester Risk Assessment for Early-Onset Preeclampsia. Obstet
Gynecol 126(3): e25-7.Allen RE, Rogozinska E, Cleverly K et al (2014) Abnormal blood biomarkers in early pregnancy are associated
with preeclampsia: a meta-analysis. Eur J Obstet Gynecol Reprod Biol 182: 194-201.Alpoim PN, de Barros Pinheiro M, Junqueira DR et al (2013) Preeclampsia and ABO blood groups: a systematic
review and meta-analysis. Mol Biol Rep 40(3): 2253-61.Andersen LB, Dechend R, Jorgensen JS et al (2016) Prediction of preeclampsia with angiogenic biomarkers.
Results from the prospective Odense Child Cohort. Hypertens Pregnancy 35(3): 405-19.Aune D, Saugstad OD, Henriksen T et al (2014) Physical activity and the risk of preeclampsia: a systematic
review and meta-analysis. Epidemiology 25(3): 331-43.Australian Health Ministers' Advisory Council (2014) Clinical Practice Guidelines: Antenatal care — Module II.
Canberra: Australian Government Department of Health. Available at: http://www.health.gov.au/antenatal
Bartsch E, Medcalf KE, Park AL et al (2016) Clinical risk factors for pre-eclampsia determined in early pregnancy: systematic review and meta-analysis of large cohort studies. BMJ 353: i1753.
Basaran A, Basaran M, Topatan B et al (2016) Effect of chorionic villus sampling on the occurrence of preeclampsia and gestational hypertension: An updated systematic review and meta-analysis. J Turk Ger Gynecol Assoc 17(2): 65-72.
Baschat AA, Magder LS, Doyle LE et al (2014) Prediction of preeclampsia utilizing the first trimester screening examination. Am J Obstet Gynecol 211(5): 514 e1-7.
Beltran AJ, Wu J, Laurent O (2013) Associations of meteorology with adverse pregnancy outcomes: a systematic review of preeclampsia, preterm birth and birth weight. Int J Environ Res Public Health 11(1): 91-172.
Bestwick JP, George LM, Wu T et al (2012) The value of early second trimester PAPP-A and ADAM12 in screening for pre-eclampsia. J Med Screen 19(1): 51-4.
Bhattacharyya SK, Kundu S, Kabiraj SP (2012) Prediction of preeclampsia by midtrimester uterine artery Doppler velocimetry in high-risk and low-risk women. J Obstet Gynaecol India 62(3): 297-300.
Birdir C, Janssen K, Stanescu AD et al (2015) Maternal serum copeptin, MR-proANP and procalcitonin levels at 11-13 weeks gestation in the prediction of preeclampsia. Arch Gynecol Obstet 292(5): 1033-42.
Blazquez A, Garcia D, Rodriguez A et al (2016) Is oocyte donation a risk factor for preeclampsia? A systematic review and meta-analysis. J Assist Reprod Genet 33(7): 855-63.
Brunelli VB & Prefumo F (2015) Quality of first trimester risk prediction models for pre-eclampsia: a systematic review. BJOG 122(7): 904-14.
Carolan MC, Davey MA, Biro M et al (2013) Very advanced maternal age and morbidity in Victoria, Australia: a population based study. BMC Pregnancy Childbirth 13: 80.
Ceylan N, Ozaksit G, Unlu BS et al (2014) Can first trimester placental protein-13 and pregnancy-associated plasma protein-A predict pre-eclampsia in Turkish women? J Obstet Gynaecol 34(6): 482-5.
Cnossen JS, Leeflang MM, de Haan EE et al (2007) Accuracy of body mass index in predicting pre-eclampsia: bivariate meta-analysis. BJOG 114(12): 1477-85.
Cohen JM, Beddaoui M, Kramer MS et al (2015) Maternal Antioxidant Levels in Pregnancy and Risk of Preeclampsia and Small for Gestational Age Birth: A Systematic Review and Meta-Analysis. PLoS One 10(8): e0135192.
Contro E, Bernabini D, Farina A (2016) Cell-Free Fetal DNA for the Prediction of Pre-Eclampsia at the First and Second Trimesters: A Systematic Review and Meta-Analysis. Mol Diagn Ther.
Cormick G, Betran AP, Ciapponi A et al (2016) Inter-pregnancy interval and risk of recurrent pre-eclampsia: systematic review and meta-analysis. Reprod Health 13(1): 83.
Crovetto F, Figueras F, Triunfo S et al (2014) Added value of angiogenic factors for the prediction of early and late preeclampsia in the first trimester of pregnancy. Fetal Diagn Ther 35(4): 258-66.
Crovetto F, Figueras F, Crispi F et al (2015a) Forms of Circulating Luteinizing Hormone Human Chorionic Gonadotropin Receptor for the Prediction of Early and Late Preeclampsia in the First Trimester of Pregnancy. Fetal Diagn Ther 38(2): 94-102.
156

13.
Crovetto F, Figueras F, Triunfo S et al (2015b) First trimester screening for early and late preeclampsia based on maternal characteristics, biophysical parameters, and angiogenic factors. Prenat Diagn 35(2): 183-91.
Davies-Tuck M, Mockler JC, Stewart L et al (2016) Obesity and pregnancy outcomes: Do the relationships differ by maternal region of birth? A retrospective cohort study. BMC Pregnancy Childbirth 16(1): 288.
Dawonauth L, Rademacher L, L'Omelette AD et al (2014) Urinary inositol phosphoglycan-P type: near patient test to detect preeclampsia prior to clinical onset of the disease. A study on 416 pregnant Mauritian women. J Reprod Immunol 101-102: 148-52.
Dey M, Arora D, Narayan N et al (2013) Serum Cholesterol and Ceruloplasmin Levels in Second Trimester can Predict Development of Pre-eclampsia. N Am J Med Sci 5(1): 41-6.
Di Lorenzo G, Ceccarello M, Cecotti V et al (2012) First trimester maternal serum PIGF, free beta-hCG, PAPP-A, PP-13, uterine artery Doppler and maternal history for the prediction of preeclampsia. Placenta 33(6): 495-501.
Diouf I, Gubhaju L, Chamberlain C et al (2016) Trends in maternal and newborn health characteristics and obstetric interventions among Aboriginal and Torres Strait Islander mothers in Western Australia from 1986 to 2009. Aust N Z J Obstet Gynaecol 56(3): 245-51.
Dover N, Gulerman HC, Celen S et al (2013) Placental growth factor: as an early second trimester predictive marker for preeclampsia in normal and high-risk pregnancies in a Turkish population. J Obstet Gynaecol India 63(3): 158-63.
Fan Y, Kang Y, Zhang M (2016) A meta-analysis of copper level and risk of preeclampsia: evidence from 12 publications. Biosci Rep 36(4).
Fouad Gomaa M, Elkholy AG, Farid LA et al (2016) Serum C3 and uterine artery Doppler indices at 14-20 weeks gestation for preeclampsia screening in low-risk primigravidas: A prospective observational study. J Reprod Immunol 117: 4-9.
Gabbay-Benziv R, Oliveira N, Baschat AA (2016) Optimal first trimester preeclampsia prediction: a comparison of multimarker algorithm, risk profiles and their sequential application. Prenat Diagn 36(1): 34-9.
Gallo D, Poon LC, Fernandez M et al (2014) Prediction of preeclampsia by mean arterial pressure at 11-13 and 20-24 weeks' gestation. Fetal Diagn Ther 36(1): 28-37.
Gallo DM, Wright D, Casanova C et al (2016) Competing risks model in screening for preeclampsia by maternal factors and biomarkers at 19-24 weeks' gestation. Am J Obstet Gynecol 214(5): 619 e1-19 e17.
Gallos ID, Sivakumar K, Kilby MD et al (2013) Pre-eclampsia is associated with, and preceded by, hypertriglyceridaemia: a meta-analysis. BJOG 120(11): 1321-32.
Garcia-Tizon Larroca S, Tayyar A, Poon LC et al (2014) Competing risks model in screening for preeclampsia by biophysical and biochemical markers at 30-33 weeks' gestation. Fetal Diagn Ther 36(1): 9-17.
Ghosh SK, Raheja S, Tuli A et al (2012) Serum PLGF as a potential biomarker for predicting the onset of preeclampsia. Arch Gynecol Obstet 285(2): 417-22.
Ghosh SK, Raheja S, Tuli A et al (2013) Can maternal serum placental growth factor estimation in early second trimester predict the occurrence of early onset preeclampsia and/or early onset intrauterine growth restriction? A prospective cohort study. J Obstet Gynaecol Res 39(5): 881-90.
Gibson-Helm M, Teede H, Block A et al (2014) Maternal health and pregnancy outcomes among women of refugee background from African countries: a retrospective, observational study in Australia. BMC Pregnancy Childbirth 14: 392.
Goetzinger KR, Tuuli MG, Cahill AG et al (2014) Development and validation of a risk factor scoring system for first-trimester prediction of preeclampsia. Am J Perinatol 31(12): 1049-56.
Gomaa MF, Naguib AH, Swedan KH et al (2015) Serum tumor necrosis factor-alpha level and uterine artery Doppler indices at 11-13 weeks' gestation for preeclampsia screening in low-risk pregnancies: a prospective observational study. J Reprod Immunol 109: 31-5.
Gonzalez-Comadran M, Urresta Avila J, Saavedra Tascon A et al (2014) The impact of donor insemination on the risk of preeclampsia: a systematic review and meta-analysis. Eur J Obstet Gynecol Reprod Biol 182: 160-6.
Hammond G, Langridge A, Leonard H et al (2013) Changes in risk factors for preterm birth in Western Australia 1984-2006. BJOG 120(9): 1051-60.
Harris JM, Franck L, Green B et al (2014) The psychological impact of providing women with risk information for pre-eclampsia: a qualitative study. Midwifery 30(12): 1187-95.
157

13.
Hausvater A, Giannone T, Sandoval YH et al (2012) The association between preeclampsia and arterial stiffness. J Hypertens 30(1): 17-33.
Hilder L, Zhichao Z, Parker M et al (2014) Australia’s mothers and babies 2012. Canberra: Australian Institute of Health and Welfare. Available at: aihw.gov.au
Hirashima C, Ohkuchi A, Takahashi K et al (2014) A novel three-step approach for predicting the imminent onset of preeclampsia within 4 weeks after blood sampling at 19-31 weeks of gestation. Hypertens Res 37(6): 519-25.
Homer CS, Thornton C, Scarf VL et al (2014) Birthplace in New South Wales, Australia: an analysis of perinatal outcomes using routinely collected data. BMC Pregnancy Childbirth 14: 206.
Hu R, Li Y, Zhang Z et al (2015) Antenatal depressive symptoms and the risk of preeclampsia or operative deliveries: a meta-analysis. PLoS One 10(3): e0119018.
Huang X, Wang J, Liu J et al (2014) Maternal periodontal disease and risk of preeclampsia: a meta-analysis. J Huazhong Univ Sci Technolog Med Sci 34(5): 729-35.
Hui D, Okun N, Murphy K et al (2012) Combinations of maternal serum markers to predict preeclampsia, small for gestational age, and stillbirth: a systematic review. J Obstet Gynaecol Can 34(2): 142-53.
Humphrey MD, Bonello MR, Chughtai A et al (2015) Maternal deaths in Australia 2008–2012. Canberra: Australian Institute of Health and Welfare. Available at: aihw.gov.au
Hypponen E, Cavadino A, Williams D et al (2013) Vitamin D and pre-eclampsia: original data, systematic review and meta-analysis. Ann Nutr Metab 63(4): 331-40.
Jaskolka D, Retnakaran R, Zinman B et al (2016) Fetal sex and maternal risk of pre-eclampsia/eclampsia: a systematic review and meta-analysis. BJOG.
Jelliffe-Pawlowski LL, Baer RJ, Currier RJ et al (2015) Early-onset severe preeclampsia by first trimester pregnancy-associated plasma protein A and total human chorionic gonadotropin. Am J Perinatol 32(7): 703-12.
Judd F, Komiti A, Sheehan P et al (2014) Adverse obstetric and neonatal outcomes in women with severe mental illness: to what extent can they be prevented? Schizophr Res 157(1-3): 305-9.
Kasawara KT, do Nascimento SL, Costa ML et al (2012) Exercise and physical activity in the prevention of pre-eclampsia: systematic review. Acta Obstet Gynecol Scand 91(10): 1147-57.
Keikkala E, Koskinen S, Vuorela P et al (2016) First trimester serum placental growth factor and hyperglycosylated human chorionic gonadotropin are associated with pre-eclampsia: a case control study. BMC Pregnancy Childbirth 16(1): 378.
Kirbas A, Ersoy AO, Daglar K et al (2015) Prediction of Preeclampsia by First Trimester Combined Test and Simple Complete Blood Count Parameters. J Clin Diagn Res 9(11): QC20-3.
Kulmala L & Phupong V (2014) Combination of plasma-soluble fms-like tyrosine kinase 1 and uterine artery Doppler for the prediction of preeclampsia in cases of elderly gravida. Hypertens Res 37(6): 538-42.
Kunnen A, van Doormaal JJ, Abbas F et al (2010) Periodontal disease and pre-eclampsia: a systematic review. J Clin Periodontol 37(12): 1075-87.
Lai J, Pinas A, Syngelaki A et al (2013a) Maternal serum activin-A at 30-33 weeks in the prediction of preeclampsia. J Matern Fetal Neonatal Med 26(8): 733-7.
Lai J, Poon LC, Bakalis S et al (2013b) Systolic, diastolic and mean arterial pressure at 30-33 weeks in the prediction of preeclampsia. Fetal Diagn Ther 33(3): 173-81.
Lai J, Poon LC, Pinas A et al (2013c) Uterine artery Doppler at 30-33 weeks' gestation in the prediction of preeclampsia. Fetal Diagn Ther 33(3): 156-63.
Lai J, Syngelaki A, Poon LC et al (2013d) Maternal serum soluble endoglin at 30-33 weeks in the prediction of preeclampsia. Fetal Diagn Ther 33(3): 149-55.
Lai J, Garcia-Tizon Larroca S, Peeva G et al (2014) Competing risks model in screening for preeclampsia by serum placental growth factor and soluble fms-like tyrosine kinase-1 at 30-33 weeks' gestation. Fetal Diagn Ther 35(4): 240-8.
Lambert-Messerlian G, Eklund EE, Chien EK et al (2014) Use of first or second trimester serum markers, or both, to predict preeclampsia. Pregnancy Hypertens 4(4): 271-8.
Li H, Huang S, Zhang J et al (2016a) Association between intrauterine device use and preeclampsia risk: a meta-analysis of observational studies. Int J Clin Exp Med 9(11): 20605–14.
158

13.
Li L, Zheng Y, Zhu Y et al (2016b) Serum biomarkers combined with uterine artery Doppler in prediction of preeclampsia. Exp Ther Med 12(4): 2515-20.
Litwińska E, Litwińska M, Oszukowski P et al (2015) Biochemical markers in screening for preeclampsia and intrauterine growth restriction. Polish Gynaecology 86(8): 611-15.
Liu HQ, Wang YH, Wang LL et al (2015a) Predictive Value of Free beta-hCG Multiple of the Median for Women with Preeclampsia. Gynecol Obstet Invest.
Liu Y, Zhao Y, Yu A et al (2015b) Diagnostic accuracy of the soluble Fms-like tyrosine kinase-1/placental growth factor ratio for preeclampsia: a meta-analysis based on 20 studies. Arch Gynecol Obstet 292(3): 507-18.
Ma Y, Shen X, Zhang D (2015) The Relationship between Serum Zinc Level and Preeclampsia: A Meta-Analysis. Nutrients 7(9): 7806-20.
Magann EF, Doherty DA, Sandlin AT et al (2013) The effects of an increasing gradient of maternal obesity on pregnancy outcomes. Aust N Z J Obstet Gynaecol 53(3): 250-7.
Maia E Holanda Moura SB, Park F, Murthi P et al (2016) TNF-R1 as a first trimester marker for prediction of pre-eclampsia. J Matern Fetal Neonatal Med 29(6): 897-903.
Masoudian P, Nasr A, de Nanassy J et al (2016) Oocyte donation pregnancies and the risk of preeclampsia or gestational hypertension: a systematic review and metaanalysis. Am J Obstet Gynecol 214(3): 328-39.
Meiri H, Sammar M, Herzog A et al (2014) Prediction of preeclampsia by placental protein 13 and background risk factors and its prevention by aspirin. J Perinat Med 42(5): 591-601.
Mikat B, Zeller A, Scherag A et al (2012) betahCG and PAPP-A in first trimester: predictive factors for preeclampsia? Hypertens Pregnancy 31(2): 261-7.
Moon M & Odibo A (2015) First-trimester screening for preeclampsia: impact of maternal parity on modeling and screening effectiveness. J Matern Fetal Neonatal Med 28(17): 2028-33.
Mosimann B, Wagner M, Birdir C et al (2013) Maternal serum tumour necrosis factor receptor 1 (TNF-R1) at 30-33 weeks in the prediction of preeclampsia. J Matern Fetal Neonatal Med 26(8): 763-7.
Mukhopadhyay A, Sharma P, Dasgupta S et al (2012) Prediction of pre-eclampsia: comparative analysis of two screening tests. J Indian Med Assoc 110(8): 546-7.
Napolitano R, Melchiorre K, Arcangeli T et al (2012) Screening for pre-eclampsia by using changes in uterine artery Doppler indices with advancing gestation. Prenat Diagn 32(2): 180-4.
Nguyen TN, Faulkner D, Frayne JS et al (2012) Obstetric and neonatal outcomes of pregnant women with severe mental illness at a specialist antenatal clinic. MJA Open 1(Suppl 1): 26-29.
O'Gorman N, Wright D, Syngelaki A et al (2016) Competing risks model in screening for preeclampsia by maternal factors and biomarkers at 11-13 weeks gestation. Am J Obstet Gynecol 214(1): 103 e1-03 e12.
Ohkuchi A, Hirashima C, Takahashi K et al (2013) Onset threshold of the plasma levels of soluble fms-like tyrosine kinase 1/placental growth factor ratio for predicting the imminent onset of preeclampsia within 4 weeks after blood sampling at 19-31 weeks of gestation. Hypertens Res 36(12): 1073-80.
Oliveira N, Doyle LE, Atlas RO et al (2014a) External validity of first-trimester algorithms in the prediction of pre-eclampsia disease severity. Ultrasound Obstet Gynecol 44(3): 286-92.
Oliveira N, Magder LS, Blitzer MG et al (2014b) First-trimester prediction of pre-eclampsia: external validity of algorithms in a prospectively enrolled cohort. Ultrasound Obstet Gynecol 44(3): 279-85.
Olsen RN, Woelkers D, Dunsmoor-Su R et al (2012) Abnormal second-trimester serum analytes are more predictive of preterm preeclampsia. Am J Obstet Gynecol 207(3): 228 e1-7.
Palmer KT, Bonzini M, Harris EC et al (2013) Work activities and risk of prematurity, low birth weight and pre-eclampsia: an updated review with meta-analysis. Occup Environ Med 70(4): 213-22.
Park F, Russo K, Williams P et al (2015) Prediction and prevention of early-onset pre-eclampsia: impact of aspirin after first-trimester screening. Ultrasound Obstet Gynecol 46(4): 419-23.
Park FJ, Leung CH, Poon LC et al (2013) Clinical evaluation of a first trimester algorithm predicting the risk of hypertensive disease of pregnancy. Aust N Z J Obstet Gynaecol 53(6): 532-9.
Parra-Cordero M, Rodrigo R, Barja P et al (2013) Prediction of early and late pre-eclampsia from maternal characteristics, uterine artery Doppler and markers of vasculogenesis during first trimester of pregnancy. Ultrasound Obstet Gynecol 41(5): 538-44.
159

13.
Parra-Cordero M, Sepulveda-Martinez A, Preisler J et al (2014) Role of the glucose tolerance test as a predictor of preeclampsia. Gynecol Obstet Invest 78(2): 130-5.
Poon LC, Syngelaki A, Akolekar R et al (2013) Combined screening for preeclampsia and small for gestational age at 11-13 weeks. Fetal Diagn Ther 33(1): 16-27.
Poorolajal J & Jenabi E (2016) The association between body mass index and preeclampsia: a meta-analysis. J Matern Fetal Neonatal Med 29(22): 3670-6.
Prajapati SR & Maitra N (2013) Prediction of pre-eclampsia by a combination of maternal history, uterine artery Doppler, and mean arterial pressure (a prospective study of 200 cases). J Obstet Gynaecol India 63(1): 32-6.
Puttapitakpong P & Phupong V (2016) Combination of serum angiopoietin-2 and uterine artery Doppler for prediction of preeclampsia. Hypertens Res 39(2): 95-9.
Roberts CL, Algert CS, Morris JM et al (2015) Increased planned delivery contributes to declining rates of pregnancy hypertension in Australia: a population-based record linkage study. BMJ Open 5(10): e009313.
Salihu HM, De La Cruz C, Rahman S et al (2012) Does maternal obesity cause preeclampsia? A systematic review of the evidence. Minerva Ginecol 64(4): 259-80.
Saxena AR, Seely EW, Rich-Edwards JW et al (2013) First trimester PAPP-A levels correlate with sFlt-1 levels longitudinally in pregnant women with and without preeclampsia. BMC Pregnancy Childbirth 13: 85.
Scazzocchio E, Figueras F, Crispi F et al (2013) Performance of a first-trimester screening of preeclampsia in a routine care low-risk setting. Am J Obstet Gynecol 208(3): 203 e1-03 e10.
Sepulveda-Martinez A, Garrido M, Caamano E et al (2016) Maternal Plasma Nerve Growth Factor at the 11+0-13+6 Weeks' Scan as a Potential Angiogenic Marker of Preeclampsia: A Pilot Study. Fetal Diagn Ther.
Sgolastra F, Petrucci A, Severino M et al (2013) Relationship between periodontitis and pre-eclampsia: a meta-analysis. PLoS One 8(8): e71387.
Skrastad RB, Hov GG, Blaas HG et al (2015) Risk assessment for preeclampsia in nulliparous women at 11-13 weeks gestational age: prospective evaluation of two algorithms. BJOG 122(13): 1781-8.
Smits LJ, North RA, Kenny LC et al (2012) Patterns of vaginal bleeding during the first 20 weeks of pregnancy and risk of pre-eclampsia in nulliparous women: results from the SCOPE study. Acta Obstet Gynecol Scand 91(11): 1331-8.
Spracklen CN, Smith CJ, Saftlas AF et al (2014) Maternal hyperlipidemia and the risk of preeclampsia: a meta-analysis. Am J Epidemiol 180(4): 346-58.
Sullivan EA, Dickinson JE, Vaughan GA et al (2015) Maternal super-obesity and perinatal outcomes in Australia: a national population-based cohort study. BMC Pregnancy Childbirth 15: 322.
Tache V, Baer RJ, Currier RJ et al (2014) Population-based biomarker screening and the development of severe preeclampsia in California. Am J Obstet Gynecol 211(4): 377 e1-8.
Tayyar A, Garcia-Tizon Larroca S, Poon LC et al (2014) Competing risk model in screening for preeclampsia by mean arterial pressure and uterine artery pulsatility index at 30-33 weeks' gestation. Fetal Diagn Ther 36(1): 18-27.
Thornton C, Dahlen H, Korda A et al (2013) The incidence of preeclampsia and eclampsia and associated maternal mortality in Australia from population-linked datasets: 2000-2008. American Journal of Obstetrics and Gynecology 208(6): 476.e1-76.e5.
Thornton C, Tooher J, Ogle R et al (2016) Benchmarking the Hypertensive Disorders of Pregnancy. Pregnancy Hypertens 6(4): 279-84.
Tsiakkas A, Saiid Y, Wright A et al (2016) Competing risks model in screening for preeclampsia by maternal factors and biomarkers at 30-34 weeks' gestation. Am J Obstet Gynecol 215(1): 87 e1-87 e17.
Uguz F (2017) Is There Any Association Between Use of Antidepressants and Preeclampsia or Gestational Hypertension?: A Systematic Review of Current Studies. J Clin Psychopharmacol 37(1): 72-77.
Urquia ML, Glazier RH, Gagnon AJ et al (2014) Disparities in pre-eclampsia and eclampsia among immigrant women giving birth in six industrialised countries. BJOG 121(12): 1492-500.
USPSTF (2016) Draft Recommendation Statement Preeclampsia: Screening. United States Preventive Services Taskforce. Accessed: 26 January 2017.
160

13.
https://www.uspreventiveservicestaskforce.org/Page/Document/draft-recommendation-statement167/preeclampsia-screening1
Vahdat M, Kashanian M, Sariri E et al (2012) Evaluation of the value of calcium to creatinine ratio for predicting of pre-eclampsia. J Matern Fetal Neonatal Med 25(12): 2793-4.
Vanderlelie J, Scott R, Shibl R et al (2016) First trimester multivitamin/mineral use is associated with reduced risk of pre-eclampsia among overweight and obese women. Matern Child Nutr 12(2): 339-48.
Verghese L, Alam S, Beski S et al (2012) Antenatal screening for pre-eclampsia: evaluation of the NICE and pre-eclampsia community guidelines. J Obstet Gynaecol 32(2): 128-31.
Verma J, Thomas DC, Jhingan G et al (2016) MoM cutoffs for variables, an important tool for multivariate analysis and accurate interpretation of preeclampsia risk in high-risk pregnancy at 11-13+6 weeks gestation. Hypertens Pregnancy 35(4): 548-58.
Wald NJ, Bestwick JP, George LM et al (2012) Screening for pre-eclampsia using serum placental growth factor and endoglin with Down's syndrome Quadruple test markers. J Med Screen 19(2): 60-7.
Wang YA, Chughtai AA, Farquhar CM et al (2016) Increased incidence of gestational hypertension and preeclampsia after assisted reproductive technology treatment. Fertil Steril 105(4): 920-26 e2.
Wang Z, Wang P, Liu H et al (2013) Maternal adiposity as an independent risk factor for pre-eclampsia: a meta-analysis of prospective cohort studies. Obes Rev 14(6): 508-21.
Wei BJ, Chen YJ, Yu L et al (2013) Periodontal disease and risk of preeclampsia: a meta-analysis of observational studies. PLoS One 8(8): e70901.
Wei J, Liu CX, Gong TT et al (2015) Cigarette smoking during pregnancy and preeclampsia risk: a systematic review and meta-analysis of prospective studies. Oncotarget 6(41): 43667-78.
Widmer M, Cuesta C, Khan KS et al (2015) Accuracy of angiogenic biomarkers at 20weeks' gestation in predicting the risk of pre-eclampsia: A WHO multicentre study. Pregnancy Hypertens 5(4): 330-8.
Wolf HT, Owe KM, Juhl M et al (2014) Leisure time physical activity and the risk of pre-eclampsia: a systematic review. Matern Child Health J 18(4): 899-910.
Wright D, Akolekar R, Syngelaki A et al (2012) A competing risks model in early screening for preeclampsia. Fetal Diagn Ther 32(3): 171-8.
Wright D, Syngelaki A, Akolekar R et al (2015) Competing risks model in screening for preeclampsia by maternal characteristics and medical history. Am J Obstet Gynecol 213(1): 62 e1-10.
Wu P, van den Berg C, Alfirevic Z et al (2015) Early Pregnancy Biomarkers in Pre-Eclampsia: A Systematic Review and Meta-Analysis. Int J Mol Sci 16(9): 23035-56.
Xu M, Guo D, Gu H et al (2016) Selenium and Preeclampsia: a Systematic Review and Meta-analysis. Biol Trace Elem Res 171(2): 283-92.
Yang Y, Su X, Xu W et al (2014) Interleukin-18 and interferon gamma levels in preeclampsia: a systematic review and meta-analysis. Am J Reprod Immunol 72(5): 504-14.
Yliniemi A, Nurkkala MM, Kopman S et al (2015) First trimester placental retinol-binding protein 4 (RBP4) and pregnancy-associated placental protein A (PAPP-A) in the prediction of early-onset severe pre-eclampsia. Metabolism 64(4): 521-6.
Yu H, Shen YT, Li HL et al (2014) The relationship between maternal serum prenatal screening combined with epidemiological study and early onset preeclampsia. Arch Gynecol Obstet 289(4): 749-53.
Yucel B, Gedikbasi A, Dundar O et al (2016) The utility of first trimester uterine artery Doppler, placental volume and PAPP-A levels alone and in combination to predict preeclampsia. Pregnancy Hypertens 6(4): 269-73.
Zakiyah N, Postma MJ, Baker PN et al (2015) Pre-eclampsia Diagnosis and Treatment Options: A Review of Published Economic Assessments. Pharmacoeconomics 33(10): 1069-82.
Zanello M, Sekizawa A, Purwosunu Y et al (2014) Circulating mRNA for the PLAC1 gene as a second trimester marker (14-18 weeks' gestation) in the screening for late preeclampsia. Fetal Diagn Ther 36(3): 196-201.
Zeisler H, Llurba E, Chantraine F et al (2016) Predictive Value of the sFlt-1:PlGF Ratio in Women with Suspected Preeclampsia. N Engl J Med 374(1): 13-22.
Zhai D, Guo Y, Smith G et al (2012) Maternal exposure to moderate ambient carbon monoxide is associated with decreased risk of preeclampsia. Am J Obstet Gynecol 207(1): 57 e1-9.
161

13.
Zhang S, Ding Z, Liu H et al (2013) Association between mental stress and gestational hypertension/preeclampsia: a meta-analysis. Obstet Gynecol Surv 68(12): 825-34.
Zhong Y, Zhu F, Ding Y (2015) Serum screening in first trimester to predict pre-eclampsia, small for gestational age and preterm delivery: systematic review and meta-analysis. BMC Pregnancy Childbirth 15: 191.
162