process improvement process analysis & problem solving to improve productivities chap 7
TRANSCRIPT
Process Improvement
Process analysis & problem solvingto improve productivities
Chap 7
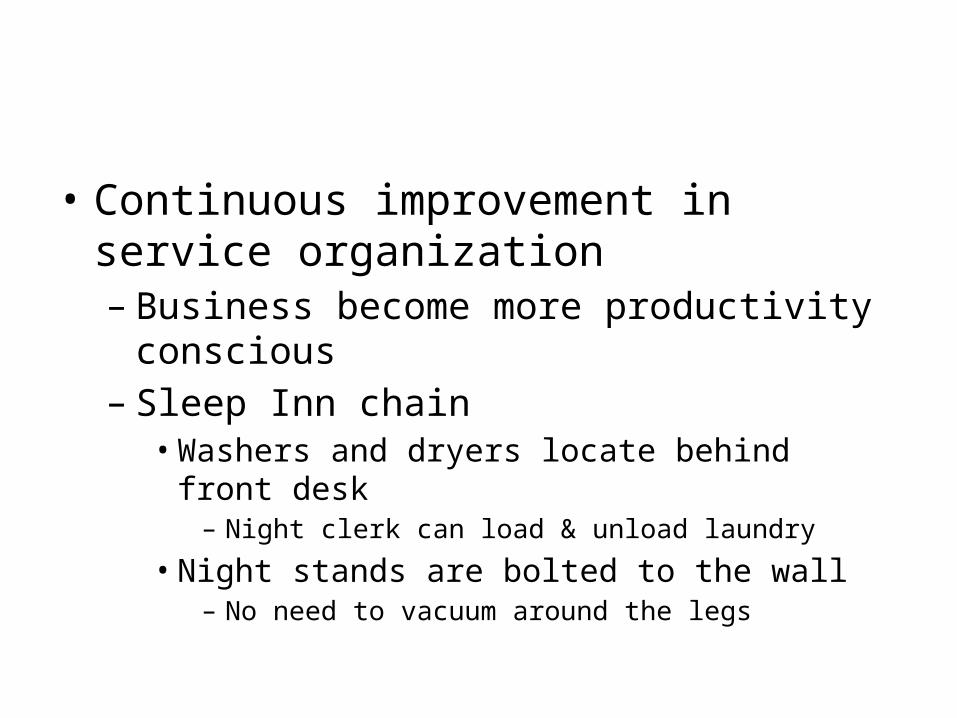
• Continuous improvement in service organization– Business become more productivity conscious– Sleep Inn chain• Washers and dryers locate behind front desk
– Night clerk can load & unload laundry
• Night stands are bolted to the wall– No need to vacuum around the legs

Quality & Productivity improvement process
• Foundation of Continuous Improvement– Deming
– Helping Japanese industries recover from WWII» Quality» Low cost
• Customer satisfaction– Putting the customers first
• Management by fact– Decision based on objective data– Formal data gathering– Statistical analysis

• Respect for people– Companywide quality improvement program
» Train employee with capacity • Problem solving• Self motivated
» Encourage problems to be solved at the lowest level• 現地現物
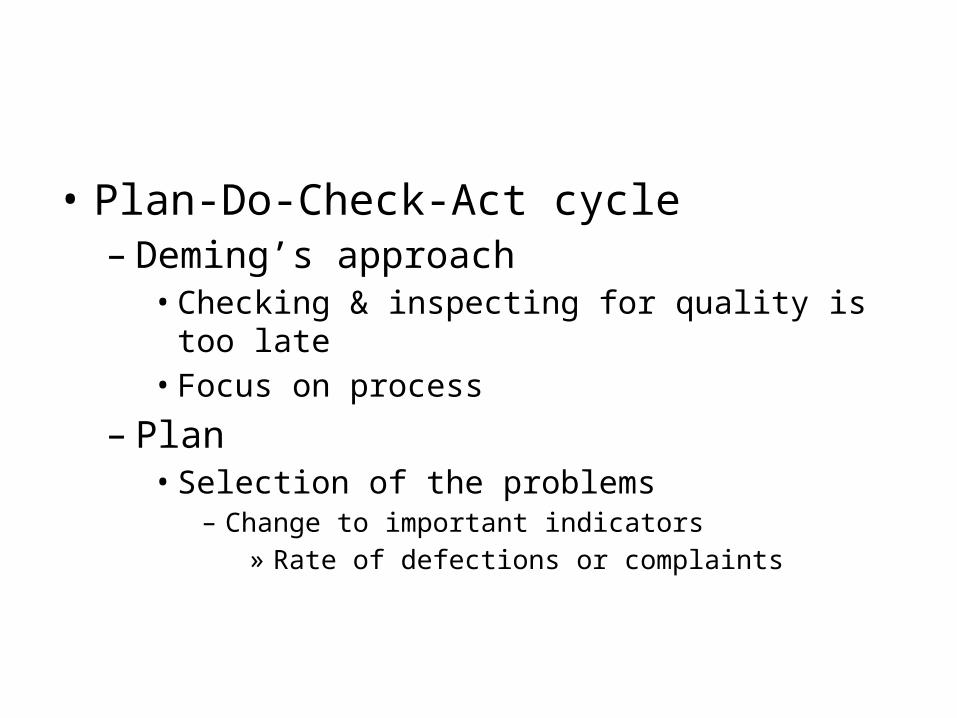
• Plan-Do-Check-Act cycle– Deming’s approach• Checking & inspecting for quality is too late• Focus on process
– Plan• Selection of the problems
– Change to important indicators» Rate of defections or complaints
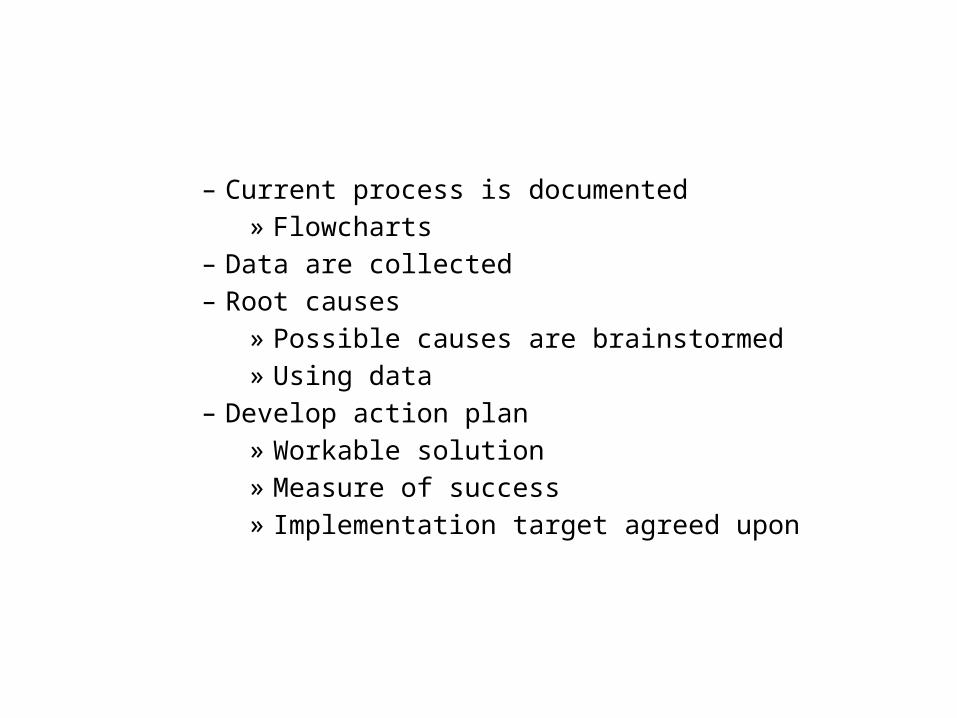
– Current process is documented» Flowcharts
– Data are collected– Root causes
» Possible causes are brainstormed» Using data
– Develop action plan» Workable solution» Measure of success» Implementation target agreed upon

– Do• Implement the solution• Monitor the implementation plan
– Collect data on performance measure– Noting progress against milestones
– Check• Evaluate the results of change
– Intended effects– Unforeseen consequence
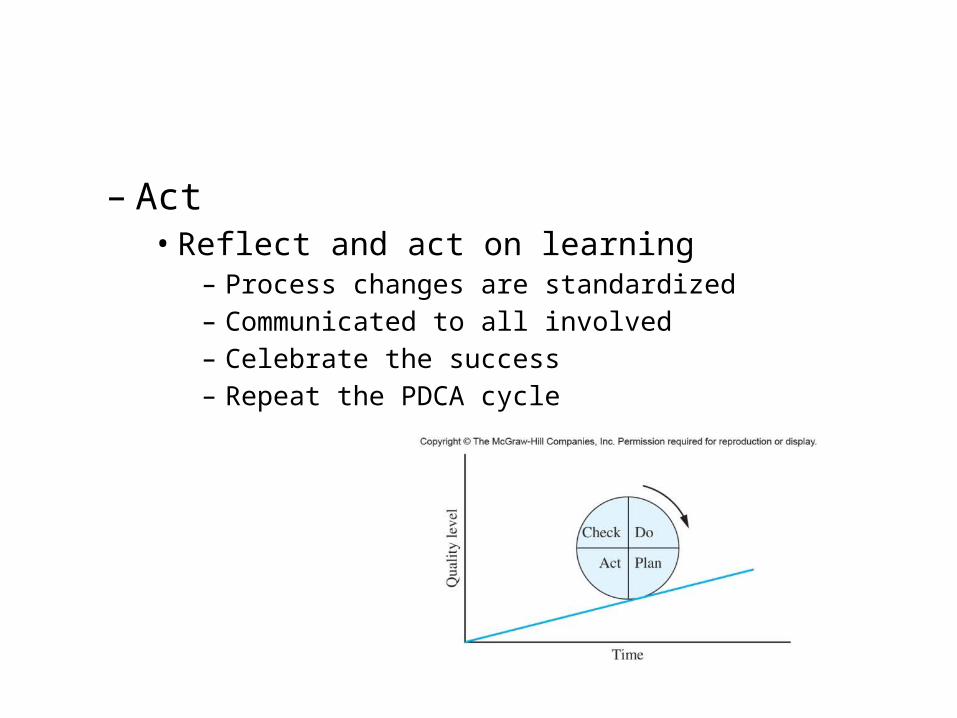
– Act• Reflect and act on learning
– Process changes are standardized– Communicated to all involved– Celebrate the success– Repeat the PDCA cycle

• Problem solving– Table 7.1

Quality Tools for analysis and problem solving
• Midway Airlines– Systemwide on-time performance had deteriorate• Check sheet• Run chat• Histogram• Pareto chart• Flowchart• …
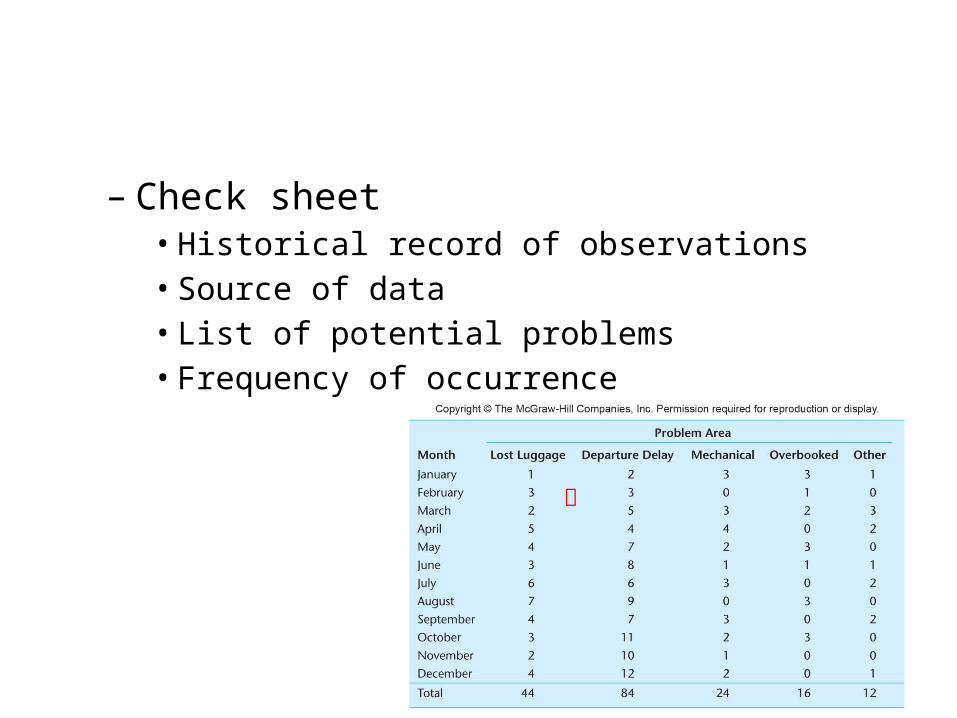
– Check sheet• Historical record of observations• Source of data• List of potential problems• Frequency of occurrence
正

• Run chart– Track change of
important variable over time• Trends• Shifts• Cycles

• Histogram– Frequency distribution
• Lack of symmetry• Skewness• Two peaks
– Two distributions
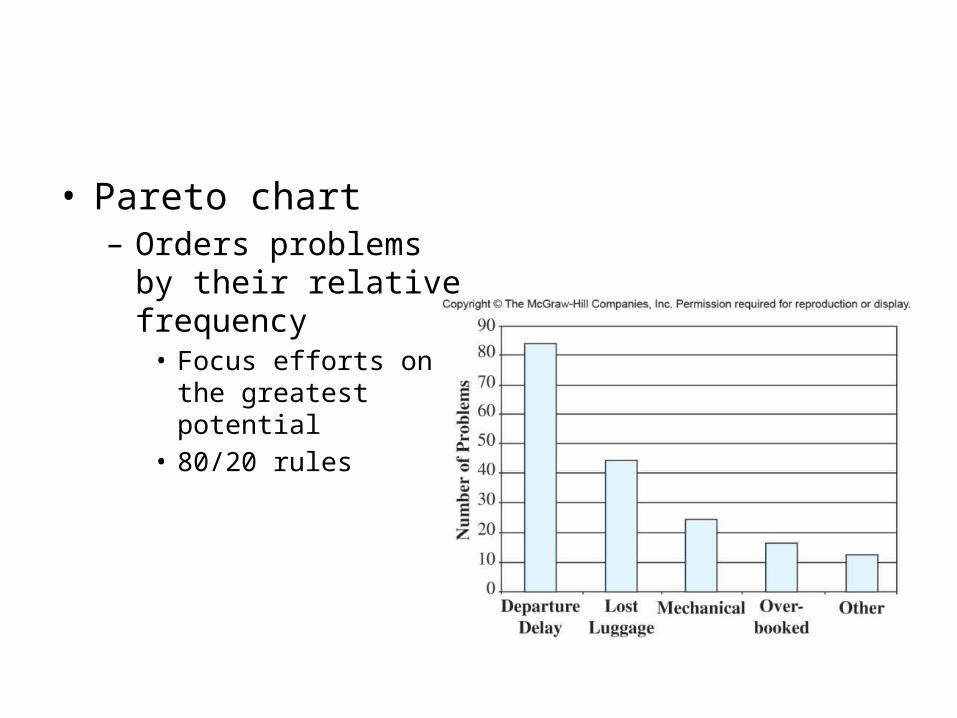
• Pareto chart– Orders problems by their
relative frequency• Focus efforts on the
greatest potential• 80/20 rules

• Flowchart– Visual presentation of
process– Identify problems or
intervention points• Diamond: decision• Rectangle: activity• Oval: beginning, ending,
connection
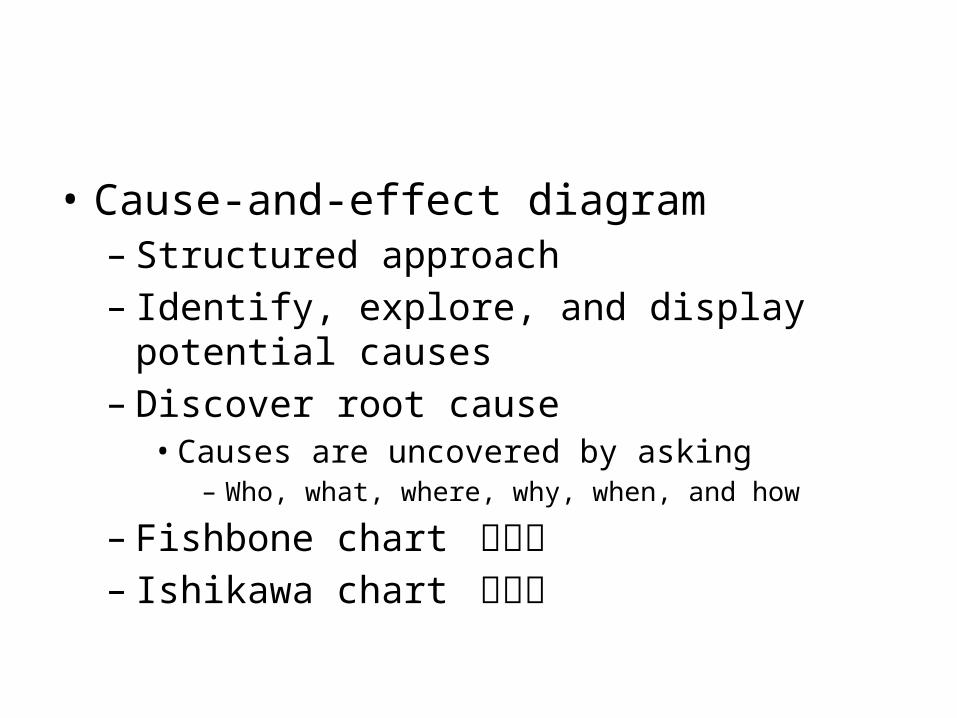
• Cause-and-effect diagram– Structured approach– Identify, explore, and display potential causes– Discover root cause• Causes are uncovered by asking
– Who, what, where, why, when, and how
– Fishbone chart 魚骨圖– Ishikawa chart 石川圖


• Scatter Diagram– Visually display the
relationship between two variables• Identify possible
correlation
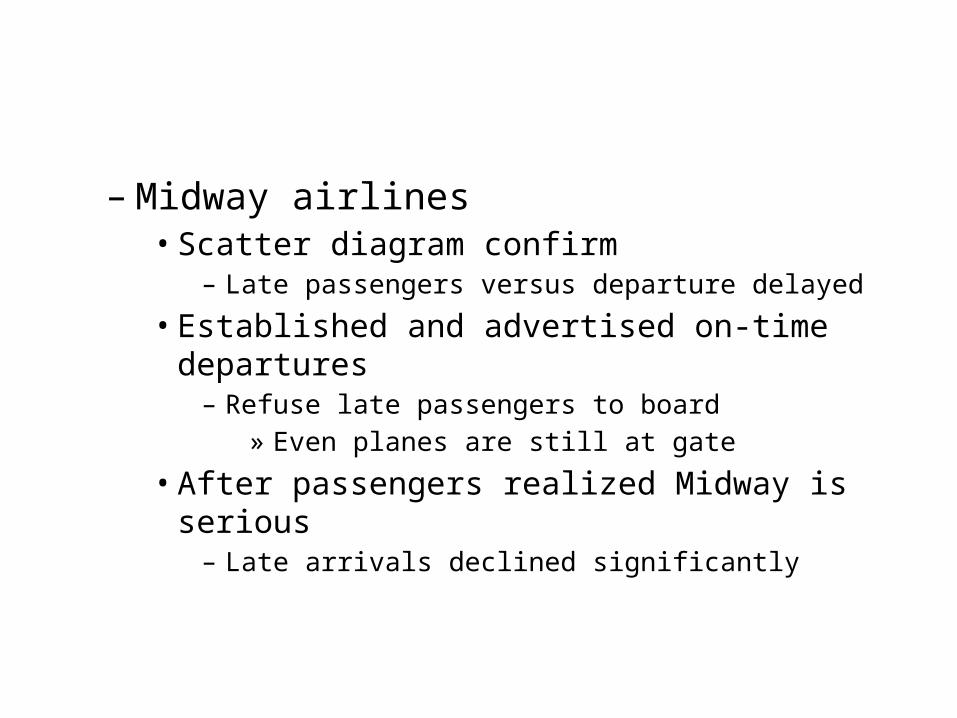
– Midway airlines• Scatter diagram confirm
– Late passengers versus departure delayed
• Established and advertised on-time departures– Refuse late passengers to board
» Even planes are still at gate
• After passengers realized Midway is serious– Late arrivals declined significantly
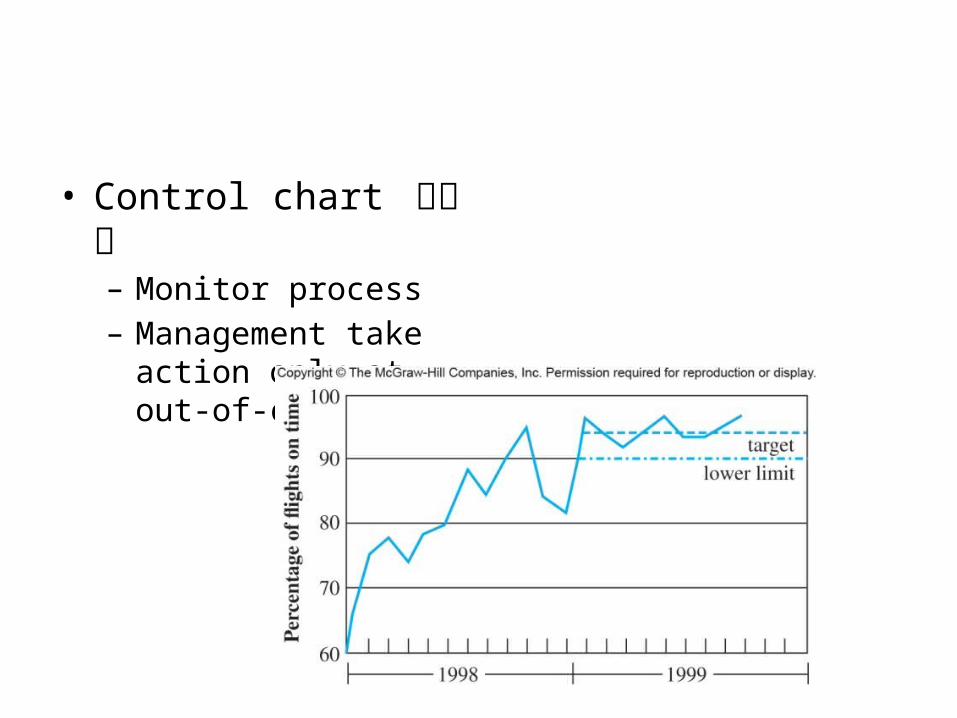
• Control chart 管制圖– Monitor process– Management take action
only at out-of-control

Benchmarking
• Comparison with the performance of “best in class”– Singapore airlines: outstanding cabin service– Fedex: consistent overnight delivery– Hampton Inn: clean room– Nordstrom: attentive salesperson

– Visiting the leading firm to learn the firsthand– Going outside one’s own field• Manufacturing
– Pit-stop of auto racing» Quick production-line changeover
– Domino’s pizza» Deliver customized pizza within 30 minutes

– Benchmarking process• Select a critical process the need improvement• Identify an organization that excels in the process• Contact the benchmark firm
– Make a visit– Study the process
• Analyze the finding• Improve our process accordingly
Improvement programs
• Quality begins– Develop positive attitude among all people• Employee selection• Training• Initial job assignments• Career advancement

• Deming’s 14-points program– Management is responsible 85 percent of all
quality problems– Management needs to provide leadership in
changing• The system• The processes
1. Create constancy of purpose for improvements of product and service• Stop focus on next quarter solely• Build for future
2. Adopt new philosophy• Refuse to allow commonly accepted poor level of
work, delay, and lax service
3. Cease dependence on mass inspection• Focus on improving the process

4. End the practice of awarding business on price tag only• Purchase should based on quality, not price• Reduce the number of vendors• Reward high-quality suppliers with long-term
contracts
5. Constantly and forever improve the system of production and service• Search problems in the system, • Seek ways of improvement
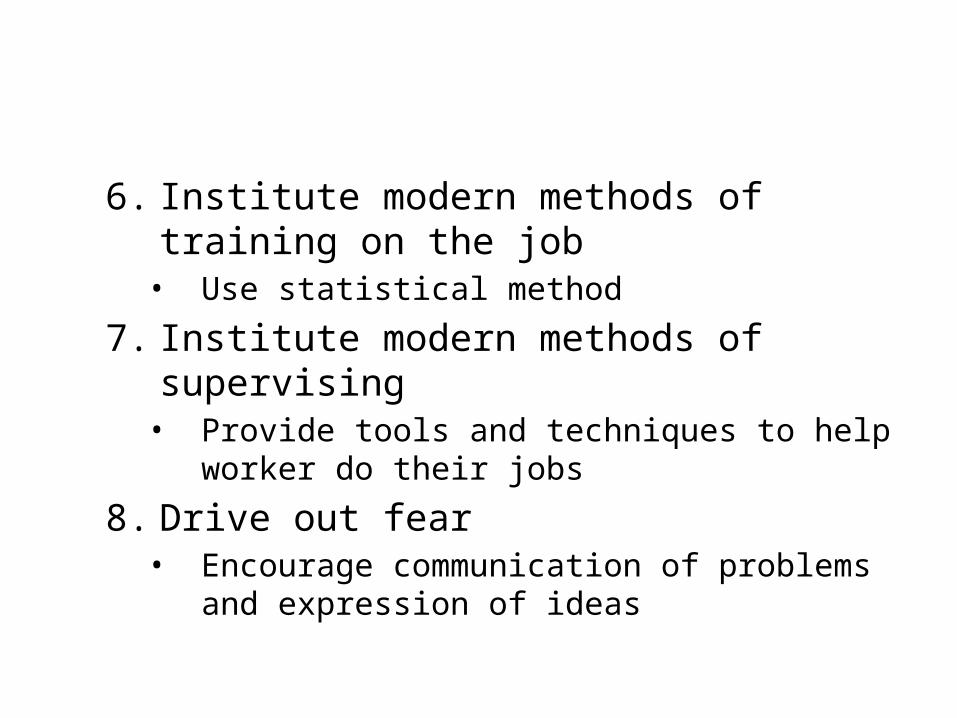
6. Institute modern methods of training on the job• Use statistical method
7. Institute modern methods of supervising• Provide tools and techniques to help worker do their
jobs
8. Drive out fear• Encourage communication of problems and
expression of ideas

9. Break down barriers between departments• Encourage problem solving through
– Teamwork– quality control circle
10. Eliminate numerical goals for the workforce• Numerical goals do not work by itself• Most of needed changes are outside workers’ control
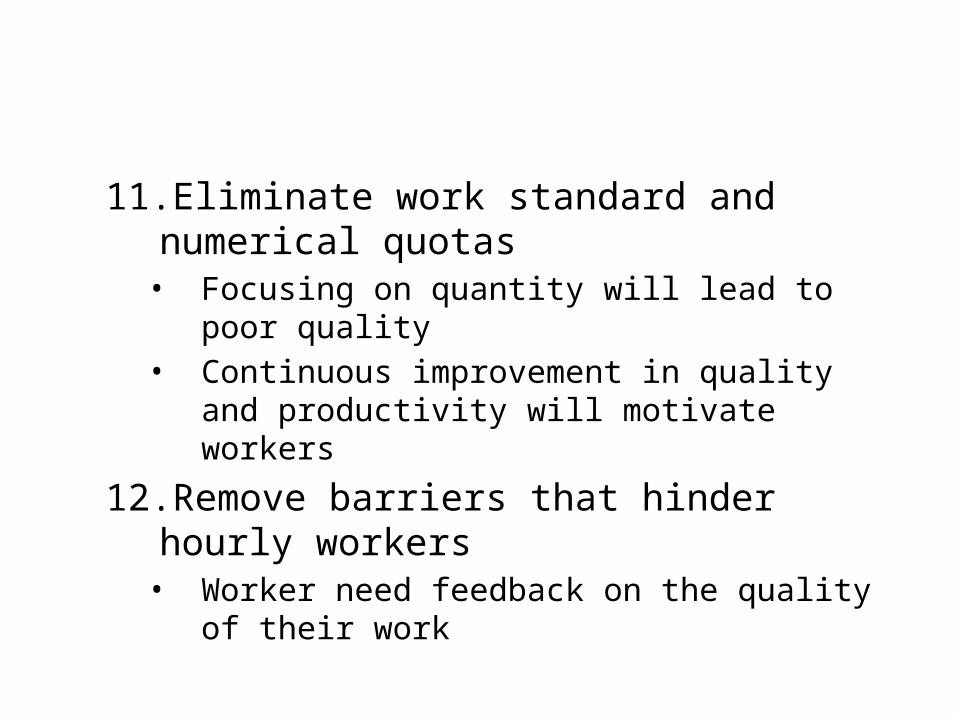
11. Eliminate work standard and numerical quotas• Focusing on quantity will lead to poor quality• Continuous improvement in quality and productivity
will motivate workers
12. Remove barriers that hinder hourly workers• Worker need feedback on the quality of their work
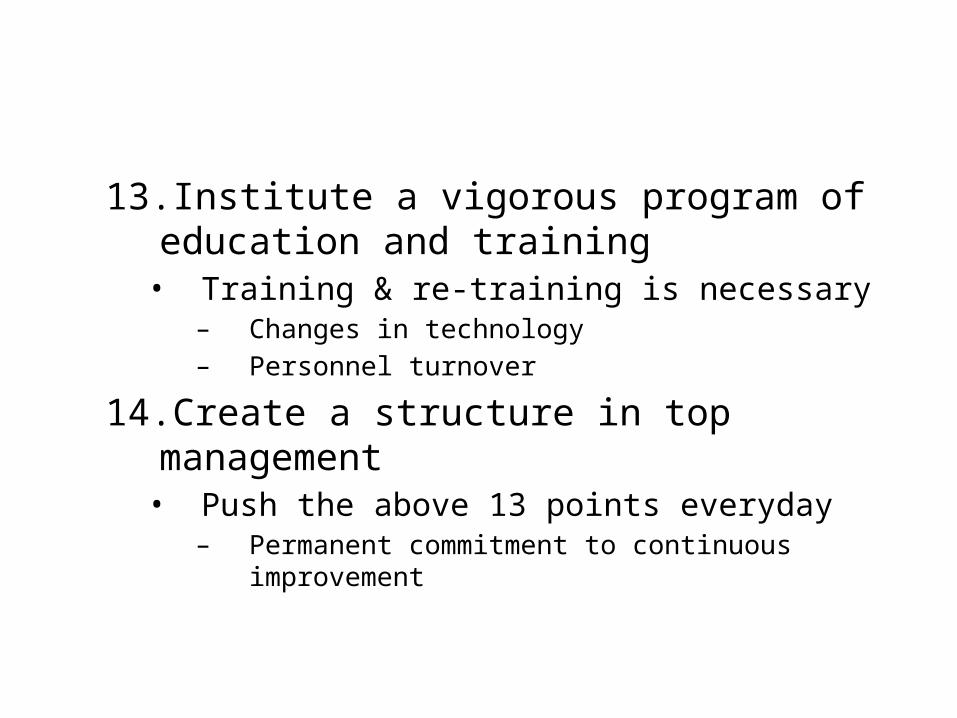
13. Institute a vigorous program of education and training• Training & re-training is necessary
– Changes in technology– Personnel turnover
14. Create a structure in top management• Push the above 13 points everyday
– Permanent commitment to continuous improvement

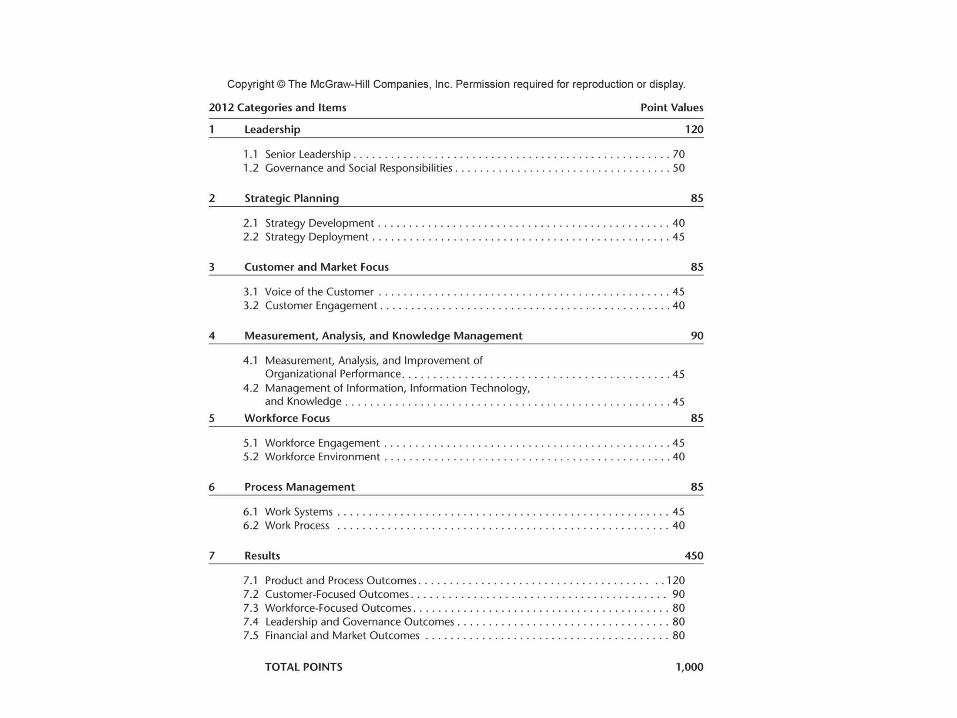
• Baldrige National Quality Award– 1987– Recognize US companies excel in quality• Manufacturing• Service• Healthcare• Education• Small business
• ISO 9000– Quality management system standards– De facto requirement for doing business• “qualifier”
– International organization of standardization– Certification• Signal a quality management system in place
– Ensures consistency of output quality– “say what you do, and do what you say”

– ISO 9000 important characteristics• Does not prescribe specific practices• Does not say anything directly about the quality• Certification is provided by a highly decentralized
system

– ISO 9000 implement a three-component cycle• Planning
– Activities affecting quality must be planned» Goals, authority, and responsibility
• Control– Activities affect quality must be controlled
» At all levels» Problems are anticipated and averted» Corrective actions are planned and carried out

• Documentation– Activities affecting quality must be documented
» Quality objectives and methods» Smooth interaction within organization» Feedback for planning cycle» Objective evidence of quality system performance
• Six Sigma– Rigorous and disciplined methodology• Use data and statistical analysis
– Measure and improve company’s performance
• Identify and eliminate defects– Enhance customer satisfaction
– Motorola, 1980s– Jack Welch, General Electric

– Objective of Six Sigma• To reduce or narrow
variation in performance• Variation
– Natural part of any process
• Statistical measure of process variation– Cp: process capability
index– Cpk: process capability
index » (if mean is not
centered between USL, LSL)

– Training and responsibility hierarchy

– Improvement methodology• Define
– Define customer’s requirements
• Measure– Measure current performance
• Analyze– Identify potential causes
• Improve– Process design/redesign
• Control– Standardization
• Lean service– Principles pioneered by Toyota• Toyota Production Systems (TPS)• Waste elimination• Continuous flow• Customer demand pull• Just in time
– Continuous rapid flow of value-adding activities to satisfy customer needs

– Process flow improvement• Service blueprinting
– Potential source for improvement
– Ex. Mapping patient’s flow thru hospital
– Internal groups for quality improvements• Continuous improvement teams• Quality control circle (QCC)
– Better housekeeping• 5S
– 整理 / 常組織( Seiri, Structurise )– 整顿 / 常整頓( Seiton, Systematise )– 清掃 / 常清潔( Seiso, Sanitise )– 清潔 / 常規範( Seiketsu, Standardise ) – 身美 / 常自律( Seitsuke, Self-discipline )

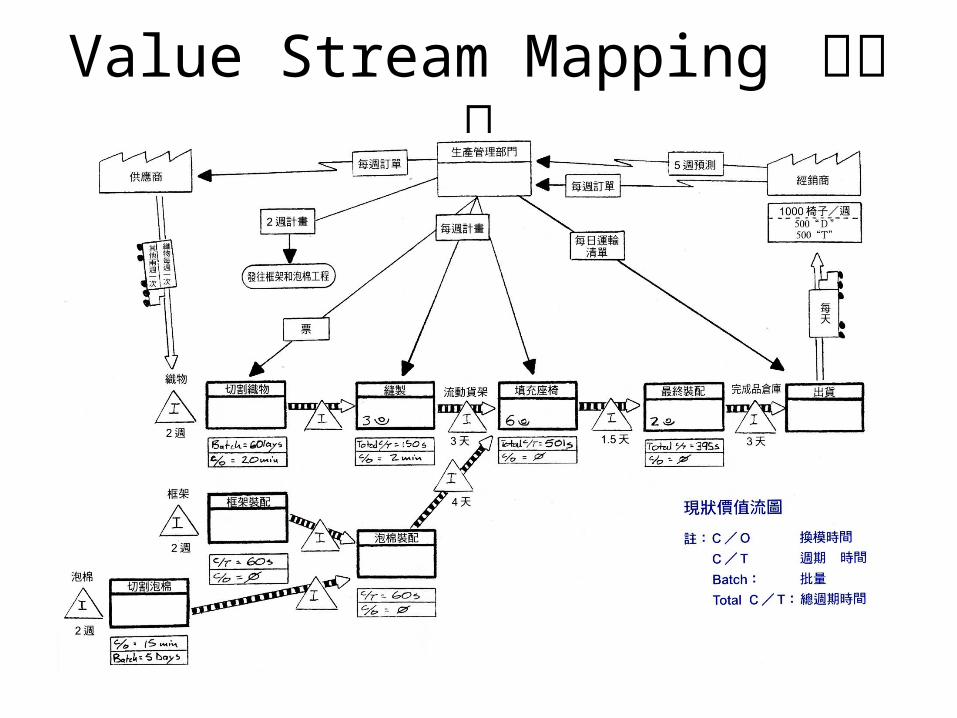
Value Stream Mapping 現狀圖

• Mini cases– Case 7.1 Sonora County Sheriff– Case 7.2 Mega Bytes Restaurant
– 本章不需要引用『本土個案』