process capability - site.iugaza.edu.pssite.iugaza.edu.ps/.../02/dr....process_capability.pdf · 2...
TRANSCRIPT
1
Islamic University, Gaza - Palestine
Department of Industrial Engineering
Statistical Quality Control
Presented by
Dr. Eng. Abed Schokry
Islamic University, Gaza - Palestine
Department of Industrial Engineering
Process Capability
Presented by
Dr. Eng. Abed Schokry
Islamic University, Gaza - Palestine
• Process capability refers to the ability of a process to produce products or provide services capable of meeting the specifications set by the customer or designer.
• Specification limits are set by management in response to customers’ expectations
• The upper specification limit (USL) is the largest value that can be obtained and still conform to customers’ expectations
• The lower specification limit (LSL) is the smallest value that is still conforming
Process Capability
Islamic University, Gaza - Palestine
• Tolerances or specifications
– Range of acceptable values established by engineering design or customer requirements
• Process variability
– Natural variability in a process
• Process capability
– Process variability relative to specification
Process Capability

2
Islamic University, Gaza - Palestine
Tolerance Limits vs. Process Capability
Actual Process Width
Specification Width
Specification Width
Actual Process Width
Islamic University, Gaza - Palestine
Process Capability
A capable process
PROCESS SPREAD
` SPECIFIED TOLERANCES
An incapable process
SPECIFIED TOLERANCES
` PROCESS SPREAD
Islamic University, Gaza - Palestine
• A process capability index is an aggregate measure of a process’s ability to meet specification limits
• The larger the value, the more capable a process is of meeting requirements
Process Capability
Islamic University, Gaza - Palestine
• Specification limits, the allowable spread of the individuals, are compared with the spread of the process to determine how capable the process is of meeting the specifications. Three different situations can exist when specifications and are compared:
(I) The process spread can be less than the spread of the specification limits;
(II) The process spread can be equal to the spread of the specification limits;
(III) The process spread can be greater than the spread of the specification limits.
Specification limits

3
Islamic University, Gaza - Palestine
• The control limits have been placed on the diagram, as well as the spread of the process averages (dotted line).
• The spread of the process individuals is shown by the solid line. As expected, the spread of the individual values is greater than the spread of the averages; however, the values are still within the specification limits.
• This allows for more room for process shifts while staying within the specifications.
• Notice that even if the process drifts out of control, the change must be dramatic before the parts are considered out of specification.
(I)The spread of the individuals is less than the spread of the specifications
Islamic University, Gaza - Palestine
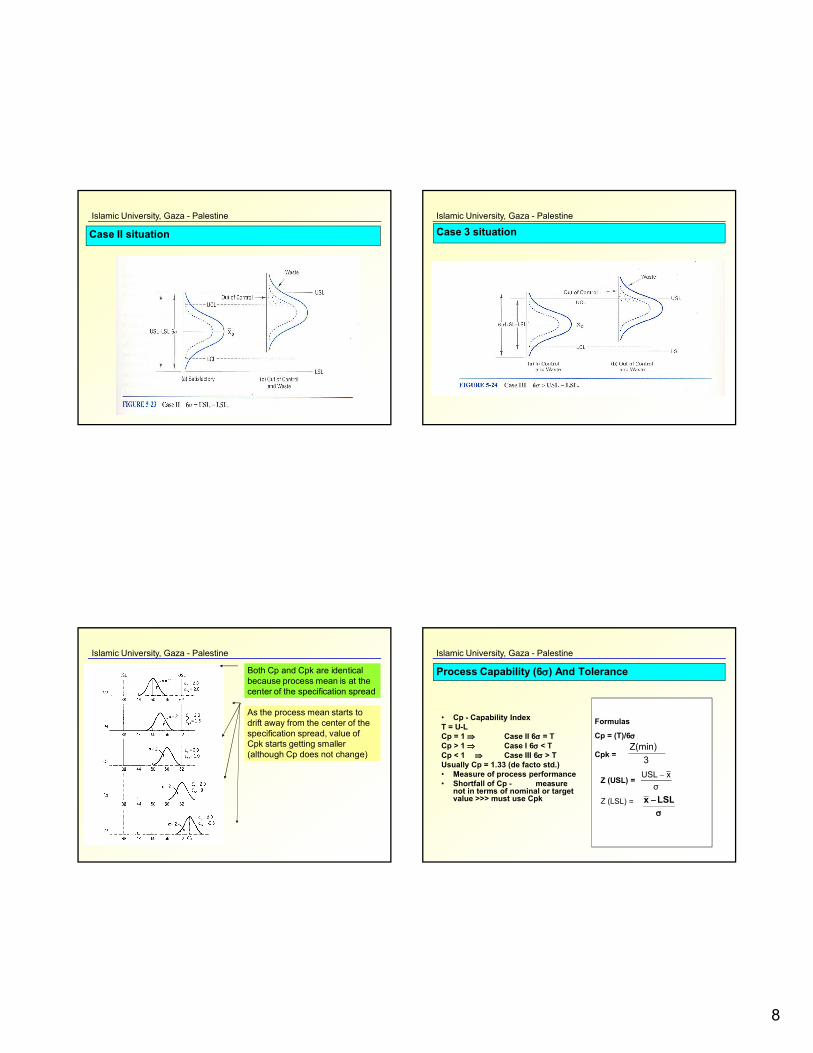
• In this situation, is equal to the tolerance
• As long as the process remains in control and centered, with no change in process variation, the parts produced will be within specification.
• A shift in the process mean will result in the production of parts that are out of specification. An increase in the variation present in the process also creates an out-of-specification situation.
(II) The process spread can be equal to the spread of the specification limits
Islamic University, Gaza - Palestine
• Case III: The spread is greater than the tolerance spread.
• Even though the process is exhibiting only natural patterns of variation, it is incapable of meeting the specifications set by the customer.
• To correct this problem, management intervention will be necessary in order to change the process to decrease the variation.
• The capability of the process cannot be improved without changing the existing process.
(III) The spread is greater than the tolerance spread
Islamic University, Gaza - Palestine
• The capability index Cp is the ratio of tolerance (USL –LSL) and
Cp= USL - LSL
6s
6s
The capability index Cp

4
Islamic University, Gaza - Palestine
• Capability ratio Cr
Cr= 6
USL - LSL
s
Capability ratio Cr
Islamic University, Gaza - Palestine
• Cpk is the ratio that reflects how the process is performing in terms of a nominal, center, or target value:
Cpk
Z(min)
3
where Z(min) is the smaller of Z(USL) = USL - X
or Z(LSL) = X - LSL
s
s
Capability ratio Cpk
Islamic University, Gaza - Palestine
1. When Cp has a value of 1.0 or greater, the process is producing product capable of meeting specifications.
2. The Cp value does not reflect process centering.
3. When the process is centered, Cp = Cpk.
4. Cpk is always less than or equal to Cp.
5. When Cp is greater than or equal to 1.0 and Cpk has a value of 1.00 or more, it indicates the process is producing product that conforms to specifications.
The relationships between Cp and Cpk
Islamic University, Gaza - Palestine
6. When Cpk has a value less than 1.00, it indicates the process is producing product that does not conform to specifications.
7. A Cp value of less than 1.00 indicates that the process is not capable.
8. A Cpk value of zero indicates the process average is equal to one of the specification limits.
9. A negative Cpk value indicates that the average is outside the specification limits.
The relationships between Cp and Cpk (Cont.)
5
Islamic University, Gaza - Palestine
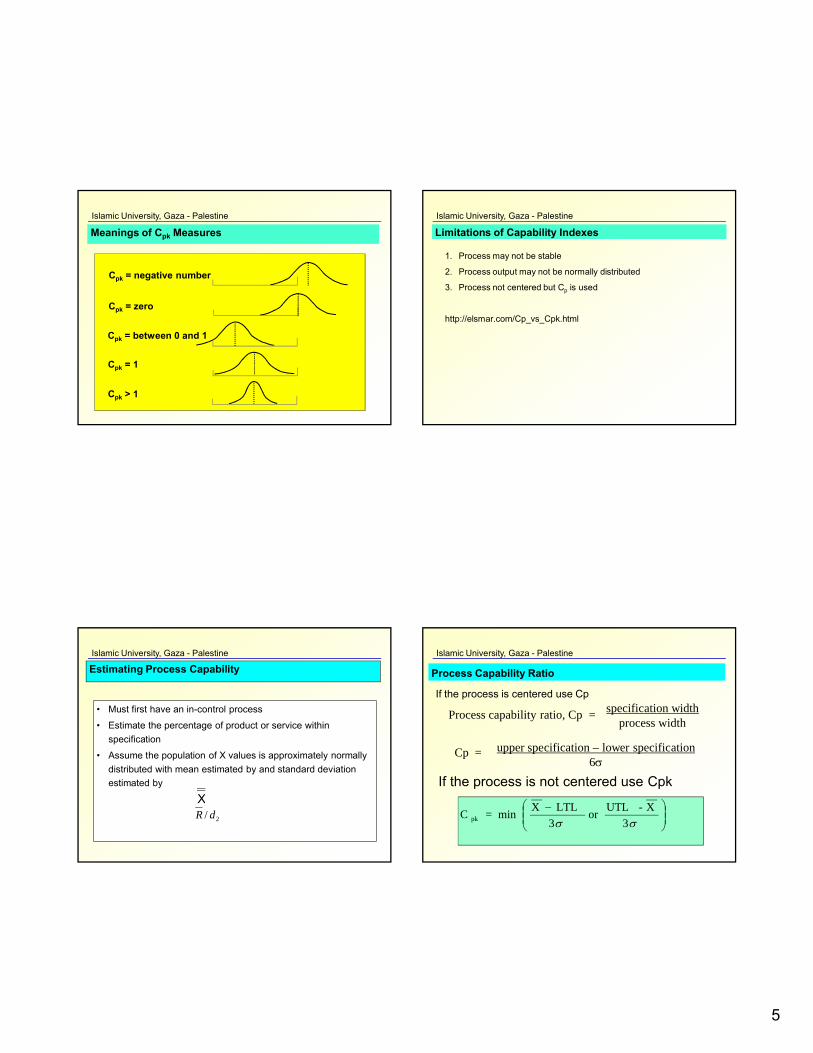
Meanings of Cpk Measures
Cpk = negative number
Cpk = zero
Cpk = between 0 and 1
Cpk = 1
Cpk > 1
Islamic University, Gaza - Palestine
Limitations of Capability Indexes
1. Process may not be stable
2. Process output may not be normally distributed
3. Process not centered but Cp is used
http://elsmar.com/Cp_vs_Cpk.html
Islamic University, Gaza - Palestine
Estimating Process Capability
• Must first have an in-control process
• Estimate the percentage of product or service within
specification
• Assume the population of X values is approximately normally
distributed with mean estimated by and standard deviation
estimated by
X
2/ dR
Islamic University, Gaza - Palestine
Process Capability Ratio
Process capability ratio, Cp = specification widthprocess width
upper specification – lower specification6
Cp =
3
X-UTLor
3
LTLXmin=C pk
If the process is centered use Cp
If the process is not centered use Cpk
6
Islamic University, Gaza - Palestine
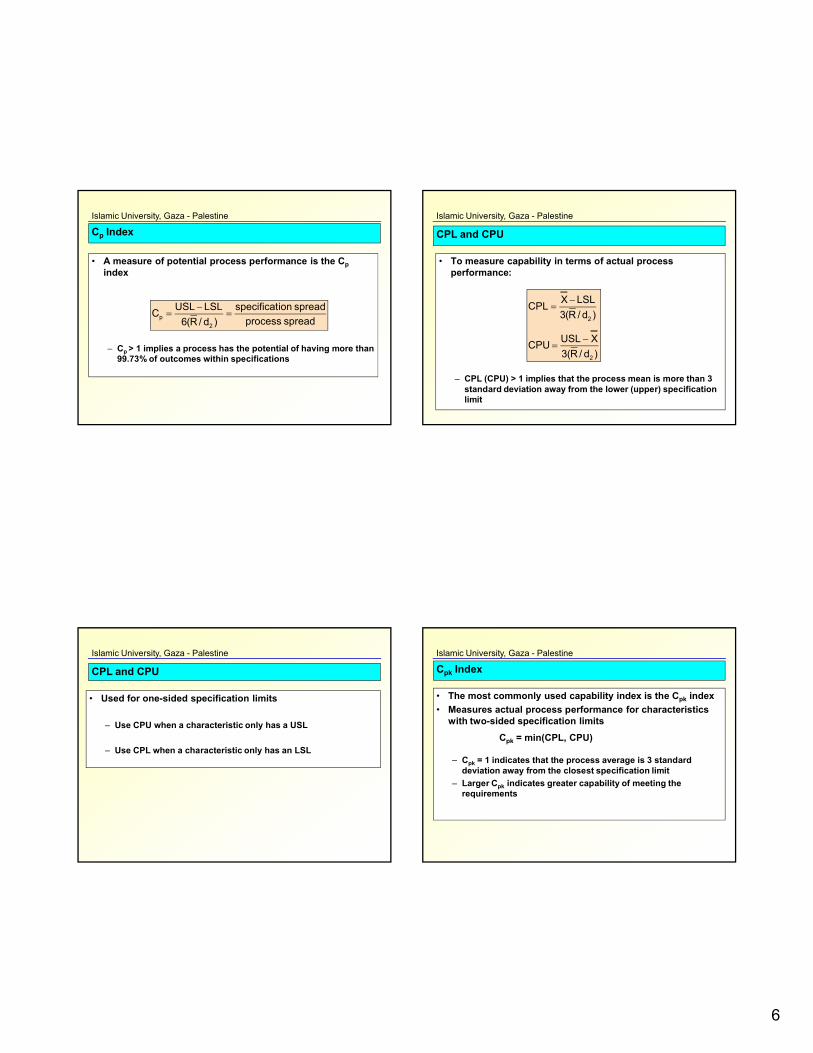
Cp Index
• A measure of potential process performance is the Cp
index
– Cp > 1 implies a process has the potential of having more than 99.73% of outcomes within specifications
spreadprocess
spreadionspecificat
)d/R(6
LSLUSLC
2
p
Islamic University, Gaza - Palestine
CPL and CPU
• To measure capability in terms of actual process performance:
– CPL (CPU) > 1 implies that the process mean is more than 3standard deviation away from the lower (upper) specification limit
)d/R(3
XUSLCPU
)d/R(3
LSLXCPL
2
2
Islamic University, Gaza - Palestine
CPL and CPU
• Used for one-sided specification limits
– Use CPU when a characteristic only has a USL
– Use CPL when a characteristic only has an LSL
Islamic University, Gaza - Palestine
Cpk Index
• The most commonly used capability index is the Cpk index
• Measures actual process performance for characteristics with two-sided specification limits
Cpk = min(CPL, CPU)
– Cpk = 1 indicates that the process average is 3 standard deviation away from the closest specification limit
– Larger Cpk indicates greater capability of meeting the requirements
7
Islamic University, Gaza - Palestine
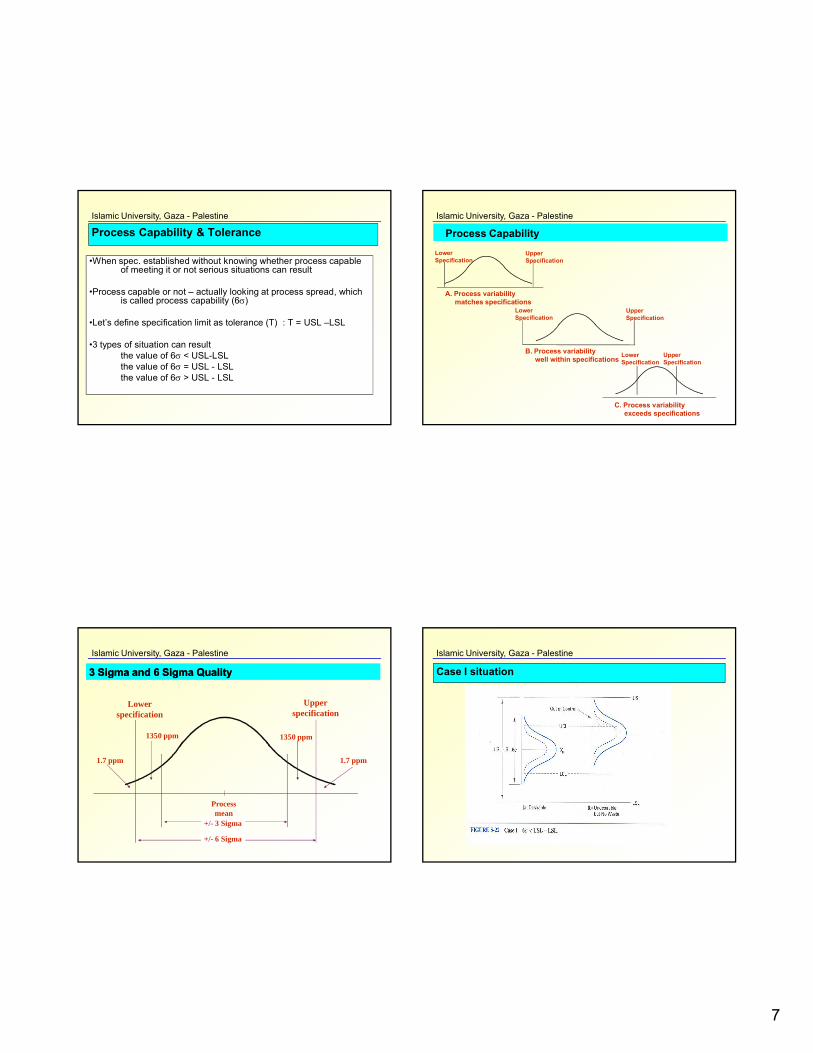
Process Capability & Tolerance
•When spec. established without knowing whether process capable of meeting it or not serious situations can result
•Process capable or not – actually looking at process spread, which is called process capability (6)
•Let’s define specification limit as tolerance (T) : T = USL –LSL
•3 types of situation can resultthe value of 6 < USL-LSLthe value of 6 = USL - LSLthe value of 6 > USL - LSL
Islamic University, Gaza - Palestine
Process Capability
LowerSpecification
UpperSpecification
A. Process variability matches specifications
LowerSpecification
UpperSpecification
B. Process variabilitywell within specifications
LowerSpecification
UpperSpecification
C. Process variability exceeds specifications
Process Capability
Islamic University, Gaza - Palestine
Processmean
Lowerspecification
Upperspecification
1350 ppm 1350 ppm
1.7 ppm 1.7 ppm
+/- 3 Sigma
+/- 6 Sigma
33 Sigma and Sigma and 66 Sigma QualitySigma Quality
Islamic University, Gaza - Palestine
Case I situation
8
Islamic University, Gaza - Palestine
Case II situation
Islamic University, Gaza - Palestine
Case 3 situation
Islamic University, Gaza - Palestine
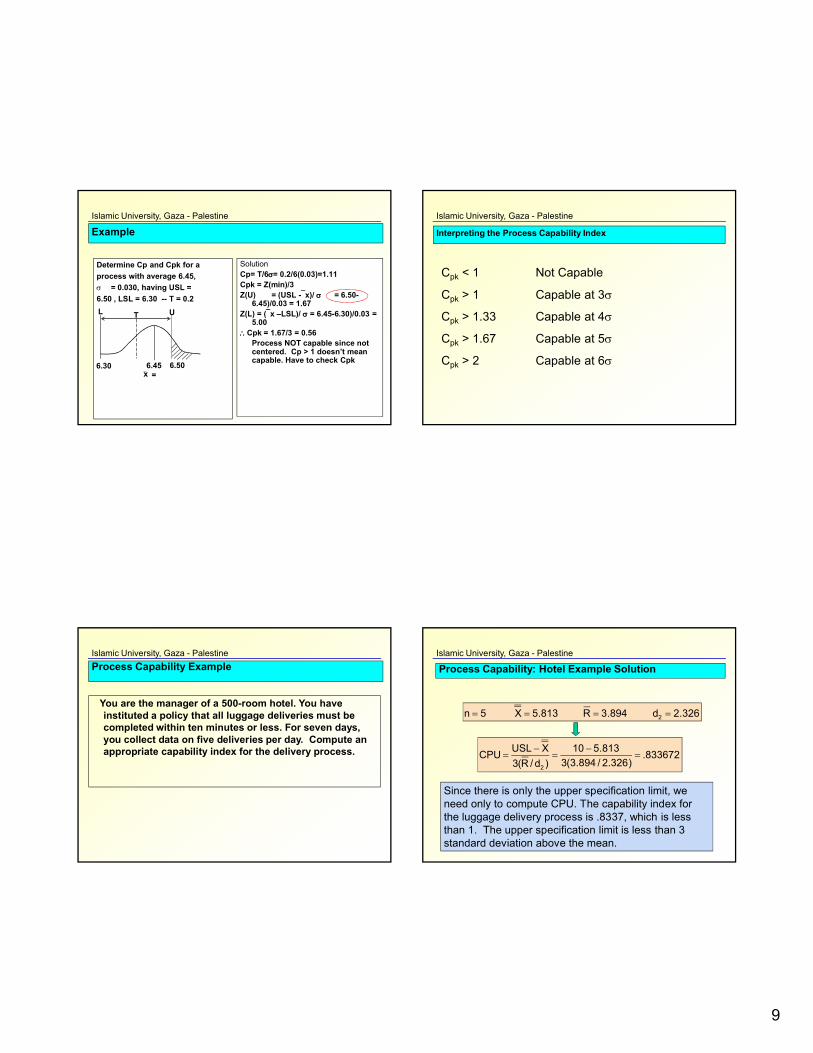
Both Cp and Cpk are identical because process mean is at the center of the specification spread
As the process mean starts to drift away from the center of the specification spread, value of Cpk starts getting smaller (although Cp does not change)
Islamic University, Gaza - Palestine
Process Capability (6) And Tolerance
• Cp - Capability IndexT = U-LCp = 1 Case II 6 = TCp > 1 Case I 6 < TCp < 1 Case III 6 > TUsually Cp = 1.33 (de facto std.)• Measure of process performance• Shortfall of Cp - measure
not in terms of nominal or target value >>> must use Cpk
Formulas
Cp = (T)/6
Cpk = 3
Z(min)
Z (USL) =σ
xUSL
LSLx
9
Islamic University, Gaza - Palestine
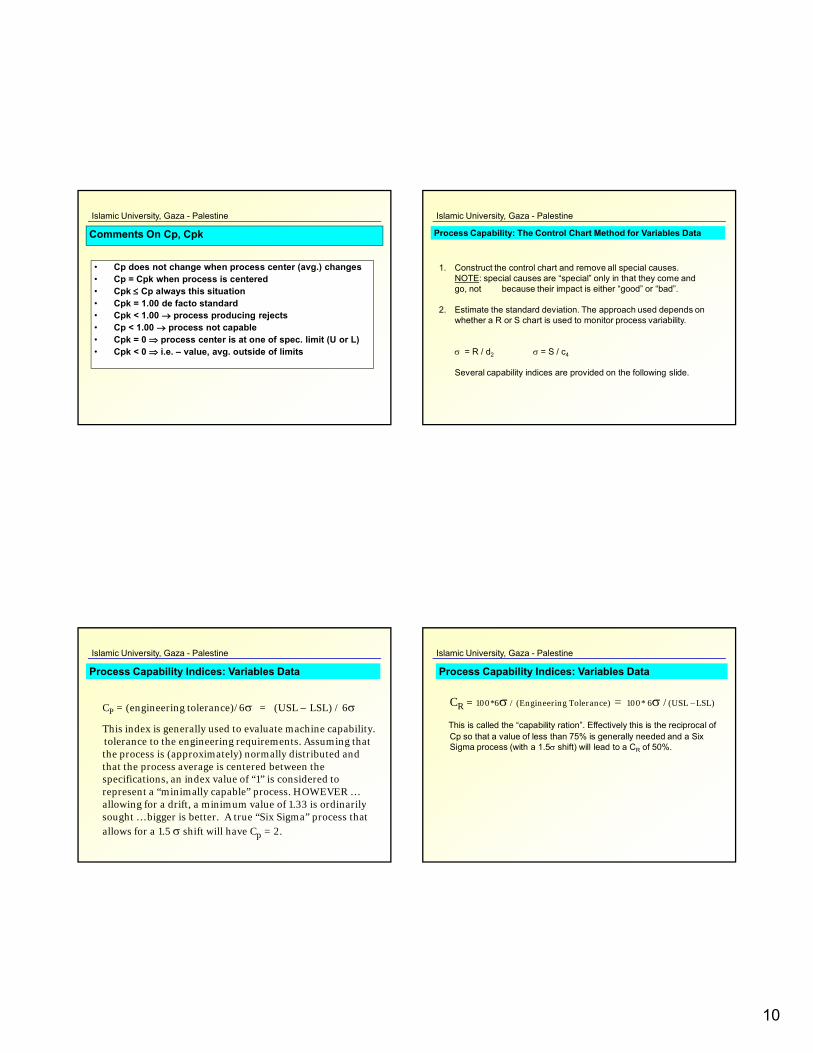
Example
Determine Cp and Cpk for a
process with average 6.45,
= 0.030, having USL =
6.50 , LSL = 6.30 -- T = 0.2
SolutionCp= T/6= 0.2/6(0.03)=1.11Cpk = Z(min)/3Z(U) = (USL -x)/ = 6.50-
6.45)/0.03 = 1.67Z(L) = (x –LSL)/ = 6.45-6.30)/0.03 =
5.00Cpk = 1.67/3 = 0.56
Process NOT capable since not centered. Cp > 1 doesn’t mean capable. Have to check Cpk
UL T
6.30 6.506.45= x
Islamic University, Gaza - Palestine
Interpreting the Process Capability Index
Cpk < 1 Not Capable
Cpk > 1 Capable at 3
Cpk > 1.33 Capable at 4
Cpk > 1.67 Capable at 5
Cpk > 2 Capable at 6
Islamic University, Gaza - Palestine
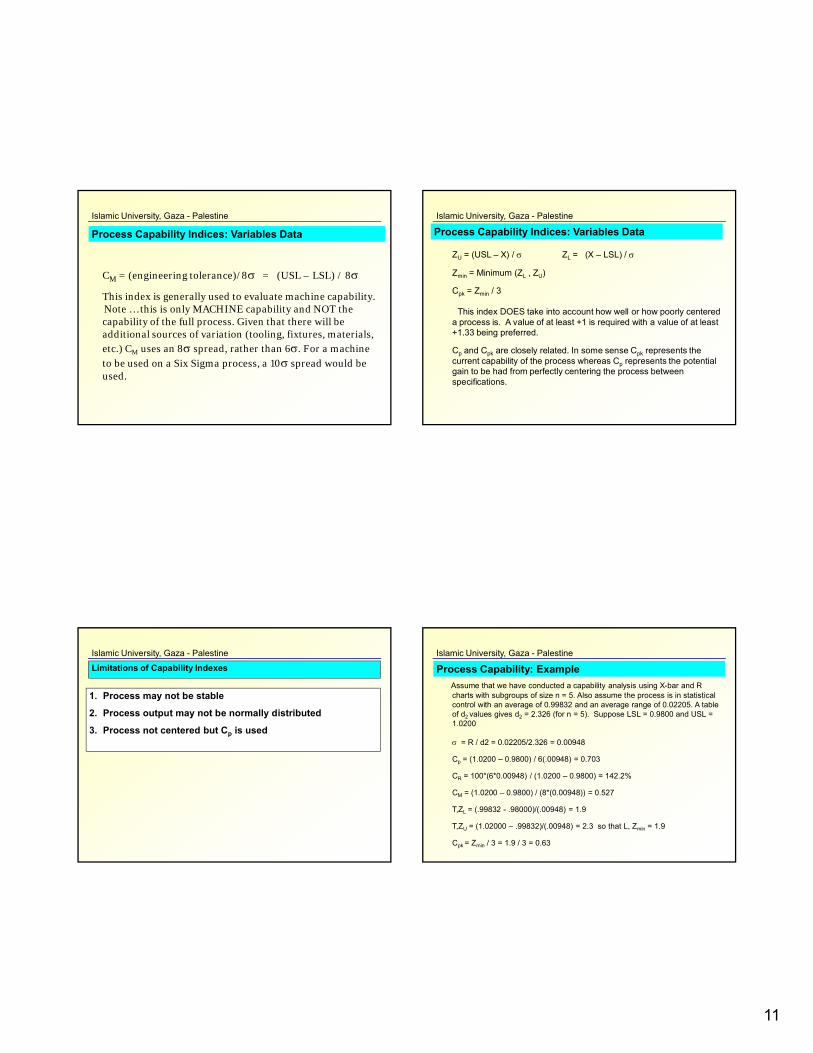
You are the manager of a 500-room hotel. You have instituted a policy that all luggage deliveries must be completed within ten minutes or less. For seven days, you collect data on five deliveries per day. Compute an appropriate capability index for the delivery process.
Process Capability ExampleIslamic University, Gaza - Palestine
Process Capability: Hotel Example Solution
326.2d 894.3R 813.5X 5n 2
833672.)326.2/894.3(3
813.510
)d/R(3
XUSLCPU
2
Since there is only the upper specification limit, we need only to compute CPU. The capability index for the luggage delivery process is .8337, which is less than 1. The upper specification limit is less than 3standard deviation above the mean.
10
Islamic University, Gaza - Palestine
Comments On Cp, Cpk
• Cp does not change when process center (avg.) changes• Cp = Cpk when process is centered• Cpk Cp always this situation• Cpk = 1.00 de facto standard• Cpk < 1.00 process producing rejects• Cp < 1.00 process not capable• Cpk = 0 process center is at one of spec. limit (U or L)• Cpk < 0 i.e. – value, avg. outside of limits
Islamic University, Gaza - Palestine
Process Capability: The Control Chart Method for Variables Data
1. Construct the control chart and remove all special causes.NOTE: special causes are “special” only in that they come and go, not because their impact is either “good” or “bad”.
2. Estimate the standard deviation. The approach used depends onwhether a R or S chart is used to monitor process variability.
= R / d2 = S / c4
Several capability indices are provided on the following slide.
Islamic University, Gaza - Palestine
Process Capability Indices: Variables Data
CP = (engineering tolerance)/6 = (USL – LSL) / 6
This index is generally used to evaluate machine capability.tolerance to the engineering requirements. Assuming that the process is (approximately) normally distributed and that the process average is centered between the specifications, an index value of “1” is considered to represent a “minimally capable” process. HOWEVER … allowing for a drift, a minimum value of 1.33 is ordinarily sought … bigger is better. A true “Six Sigma” process that allows for a 1.5 shift will have Cp = 2.
Islamic University, Gaza - Palestine
Process Capability Indices: Variables Data
CR = 100*6 / (Engineering Tolerance) = 100* 6 /(USL –LSL)
This is called the “capability ration”. Effectively this is the reciprocal of Cp so that a value of less than 75% is generally needed and a Six Sigma process (with a 1.5 shift) will lead to a CR of 50%.
11
Islamic University, Gaza - Palestine
Process Capability Indices: Variables Data
CM = (engineering tolerance)/8 = (USL – LSL) / 8
This index is generally used to evaluate machine capability.Note … this is only MACHINE capability and NOT the capability of the full process. Given that there will be additional sources of variation (tooling, fixtures, materials, etc.) CM uses an 8 spread, rather than 6. For a machine to be used on a Six Sigma process, a 10 spread would be used.
Islamic University, Gaza - Palestine
Process Capability Indices: Variables Data
ZU = (USL – X) / ZL = (X – LSL) /
Zmin = Minimum (ZL , ZU)
Cpk = Zmin / 3
This index DOES take into account how well or how poorly centered a process is. A value of at least +1 is required with a value of at least +1.33 being preferred.
Cp and Cpk are closely related. In some sense Cpk represents the current capability of the process whereas Cp represents the potential gain to be had from perfectly centering the process between specifications.
Islamic University, Gaza - Palestine
Limitations of Capability Indexes
1. Process may not be stable
2. Process output may not be normally distributed
3. Process not centered but Cp is used
Islamic University, Gaza - Palestine
Process Capability: Example
Assume that we have conducted a capability analysis using X-bar and R charts with subgroups of size n = 5. Also assume the process is in statistical control with an average of 0.99832 and an average range of 0.02205. A table of d2 values gives d2 = 2.326 (for n = 5). Suppose LSL = 0.9800 and USL = 1.0200
= R / d2 = 0.02205/2.326 = 0.00948
Cp = (1.0200 – 0.9800) / 6(.00948) = 0.703
CR = 100*(6*0.00948) / (1.0200 – 0.9800) = 142.2%
CM = (1.0200 – 0.9800) / (8*(0.00948)) = 0.527
T,ZL = (.99832 - .98000)/(.00948) = 1.9
T,ZU = (1.02000 – .99832)/(.00948) = 2.3 so that L, Zmin = 1.9
Cpk = Zmin / 3 = 1.9 / 3 = 0.63
12
Islamic University, Gaza - Palestine
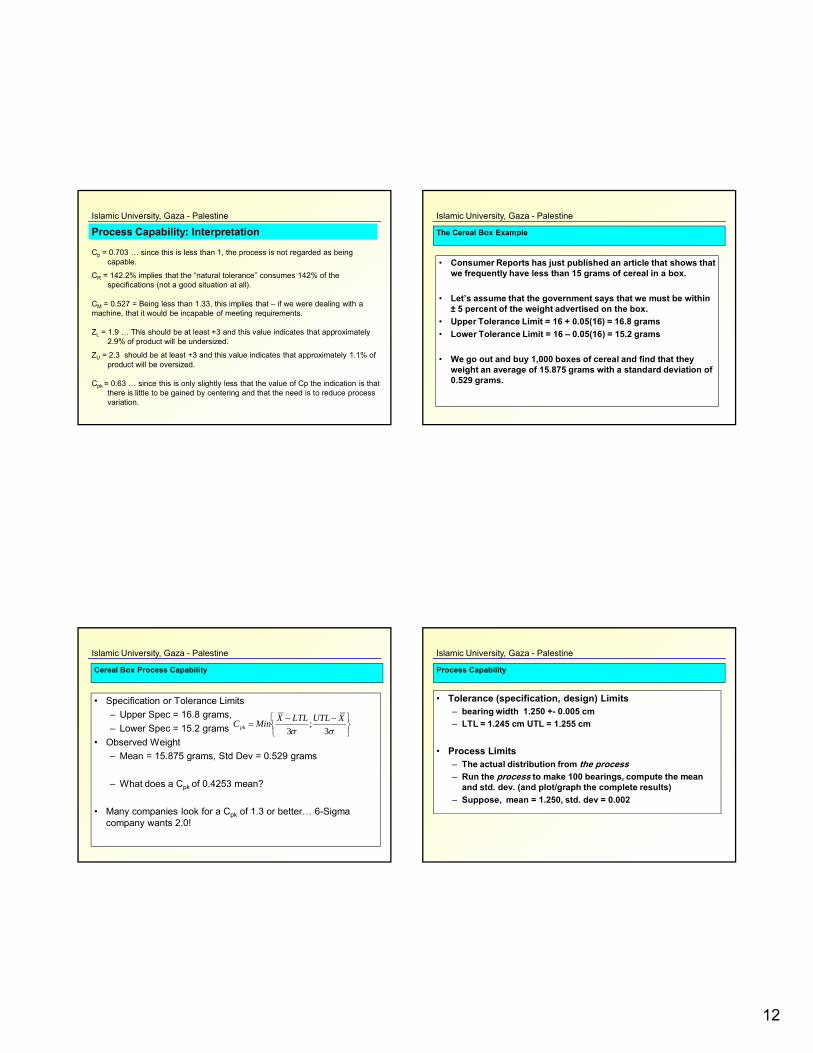
Process Capability: Interpretation
Cp = 0.703 … since this is less than 1, the process is not regarded as being capable.
CR = 142.2% implies that the “natural tolerance” consumes 142% of the specifications (not a good situation at all).
CM = 0.527 = Being less than 1.33, this implies that – if we were dealing with amachine, that it would be incapable of meeting requirements.
ZL = 1.9 … This should be at least +3 and this value indicates that approximately 2.9% of product will be undersized.
ZU = 2.3 should be at least +3 and this value indicates that approximately 1.1% of product will be oversized.
Cpk = 0.63 … since this is only slightly less that the value of Cp the indication is that there is little to be gained by centering and that the need is to reduce process variation.
Islamic University, Gaza - Palestine
The Cereal Box Example
• Consumer Reports has just published an article that shows that we frequently have less than 15 grams of cereal in a box.
• Let’s assume that the government says that we must be within ± 5 percent of the weight advertised on the box.
• Upper Tolerance Limit = 16 + 0.05(16) = 16.8 grams
• Lower Tolerance Limit = 16 – 0.05(16) = 15.2 grams
• We go out and buy 1,000 boxes of cereal and find that they weight an average of 15.875 grams with a standard deviation of 0.529 grams.
Islamic University, Gaza - Palestine
Cereal Box Process Capability
• Specification or Tolerance Limits
– Upper Spec = 16.8 grams,
– Lower Spec = 15.2 grams
• Observed Weight
– Mean = 15.875 grams, Std Dev = 0.529 grams
– What does a Cpk of 0.4253 mean?
• Many companies look for a Cpk of 1.3 or better… 6-Sigma company wants 2.0!
3
;3
XUTLLTLXMinCpk
Islamic University, Gaza - Palestine
Process Capability
• Tolerance (specification, design) Limits– bearing width 1.250 +- 0.005 cm
– LTL = 1.245 cm UTL = 1.255 cm
• Process Limits – The actual distribution from the process– Run the process to make 100 bearings, compute the mean
and std. dev. (and plot/graph the complete results)
– Suppose, mean = 1.250, std. dev = 0.002
13
Islamic University, Gaza - Palestine
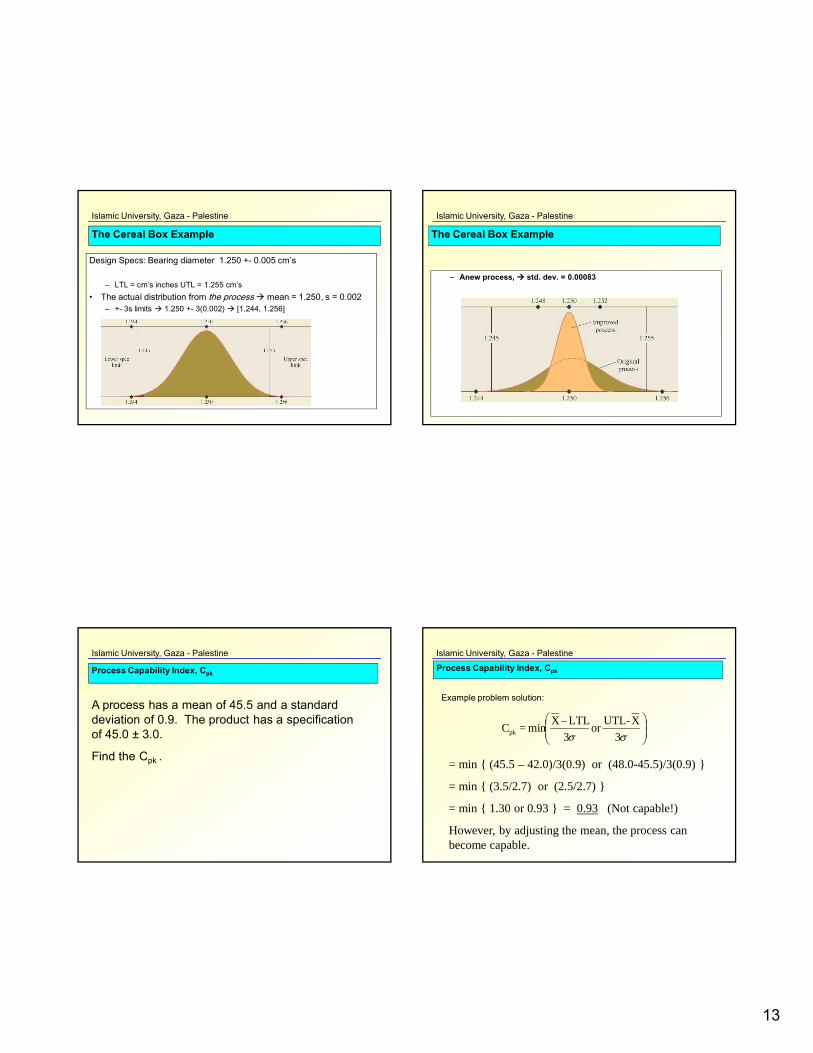
Design Specs: Bearing diameter 1.250 +- 0.005 cm’s
– LTL = cm’s inches UTL = 1.255 cm’s
• The actual distribution from the process mean = 1.250, s = 0.002– +- 3s limits 1.250 +- 3(0.002) [1.244, 1.256]
The Cereal Box Example
Islamic University, Gaza - Palestine
– Anew process, std. dev. = 0.00083
The Cereal Box Example
Islamic University, Gaza - Palestine
Process Capability Index, Cpk
A process has a mean of 45.5 and a standard deviation of 0.9. The product has a specification of 45.0 ± 3.0.
Find the Cpk .
Islamic University, Gaza - Palestine
Process Capability Index, Cpk
3
X-UTLor
3
LTLXmin=Cpk
= min { (45.5 – 42.0)/3(0.9) or (48.0-45.5)/3(0.9) }
= min { (3.5/2.7) or (2.5/2.7) }
= min { 1.30 or 0.93 } = 0.93 (Not capable!)
However, by adjusting the mean, the process can become capable.
Example problem solution:
14
Islamic University, Gaza - Palestine
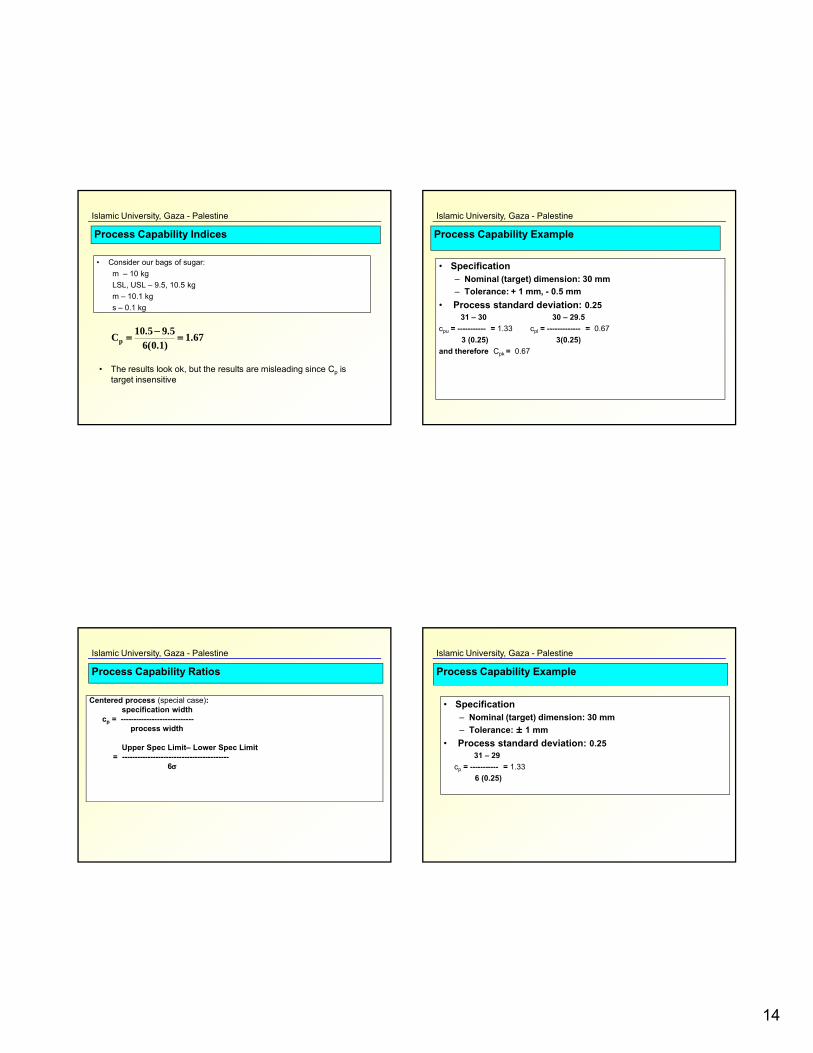
Process Capability Indices
• Consider our bags of sugar:
m – 10 kg
LSL, USL – 9.5, 10.5 kg
m – 10.1 kg
s – 0.1 kg
67.1)1.0(6
5.95.10Cp
• The results look ok, but the results are misleading since Cp is target insensitive
Islamic University, Gaza - Palestine
Process Capability Example
• Specification– Nominal (target) dimension: 30 mm
– Tolerance: + 1 mm, - 0.5 mm
• Process standard deviation: 0.2531 – 30 30 – 29.5
cpu = ----------- = 1.33 cpl = ------------- = 0.67
3 (0.25) 3(0.25)
and therefore Cpk = 0.67
Islamic University, Gaza - Palestine
Process Capability Ratios
Centered process (special case):specification width
cp = ----------------------------process width
Upper Spec Limit– Lower Spec Limit= -----------------------------------------
6
Islamic University, Gaza - Palestine
Process Capability Example
• Specification– Nominal (target) dimension: 30 mm
– Tolerance: ± 1 mm
• Process standard deviation: 0.2531 – 29
cp = ----------- = 1.33
6 (0.25)
15
Islamic University, Gaza - Palestine
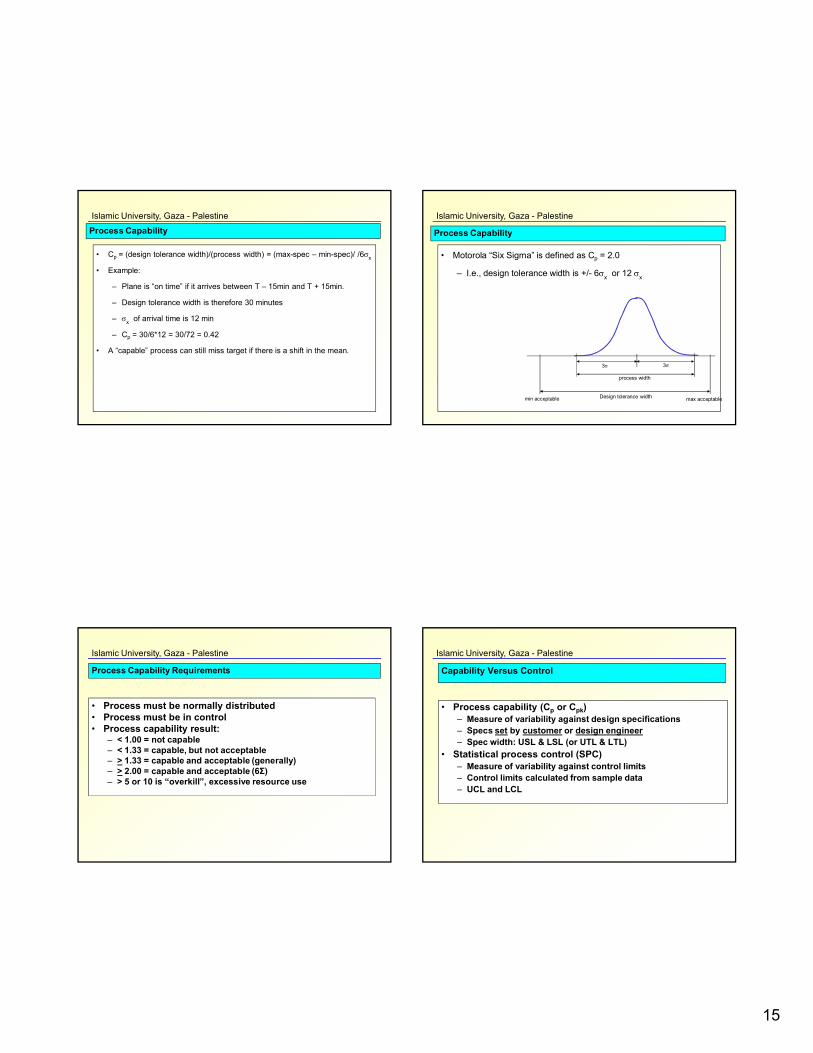
Process Capability
• Cp = (design tolerance width)/(process width) = (max-spec – min-spec)/ /6x
• Example:
– Plane is “on time” if it arrives between T – 15min and T + 15min.
– Design tolerance width is therefore 30 minutes
– x of arrival time is 12 min
– Cp = 30/6*12 = 30/72 = 0.42
• A “capable” process can still miss target if there is a shift in the mean.
Islamic University, Gaza - Palestine
Process Capability
• Motorola “Six Sigma” is defined as Cp = 2.0
– I.e., design tolerance width is +/- 6x or 12 x
3 3
process width
min acceptable max acceptableDesign tolerance width
Islamic University, Gaza - Palestine
Process Capability Requirements
• Process must be normally distributed• Process must be in control• Process capability result:
– < 1.00 = not capable– < 1.33 = capable, but not acceptable– > 1.33 = capable and acceptable (generally)– > 2.00 = capable and acceptable (6Σ)– > 5 or 10 is “overkill”, excessive resource use
Islamic University, Gaza - Palestine
Capability Versus Control
• Process capability (Cp or Cpk)– Measure of variability against design specifications– Specs set by customer or design engineer– Spec width: USL & LSL (or UTL & LTL)
• Statistical process control (SPC)– Measure of variability against control limits– Control limits calculated from sample data– UCL and LCL
16
Islamic University, Gaza - Palestine
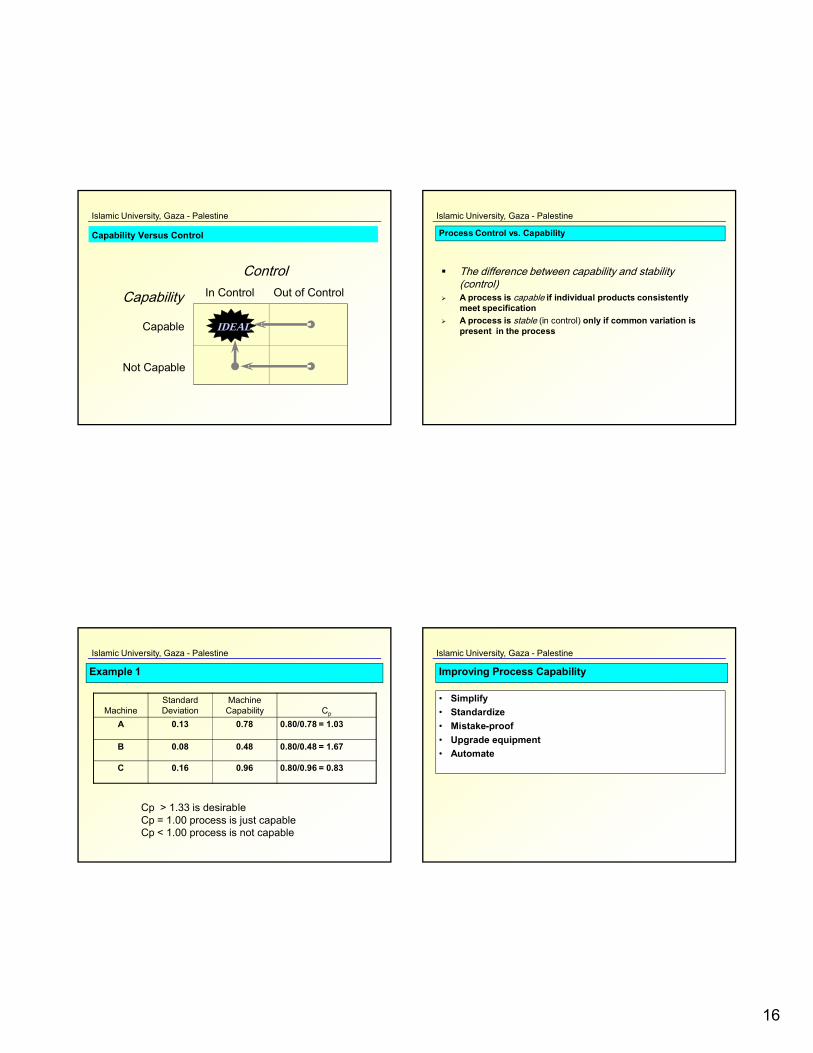
Capability Versus Control
Control
Capability
Capable
Not Capable
In Control Out of Control
IDEAL
Islamic University, Gaza - Palestine
Process Control vs. Capability
The difference between capability and stability (control)
A process is capable if individual products consistently meet specification
A process is stable (in control) only if common variation is present in the process
Islamic University, Gaza - Palestine
Example 1
MachineStandard Deviation
Machine Capability Cp
A 0.13 0.78 0.80/0.78 = 1.03
B 0.08 0.48 0.80/0.48 = 1.67
C 0.16 0.96 0.80/0.96 = 0.83
Cp > 1.33 is desirableCp = 1.00 process is just capableCp < 1.00 process is not capable
Islamic University, Gaza - Palestine
Improving Process Capability
• Simplify
• Standardize
• Mistake-proof
• Upgrade equipment
• Automate
17
Islamic University, Gaza - Palestine
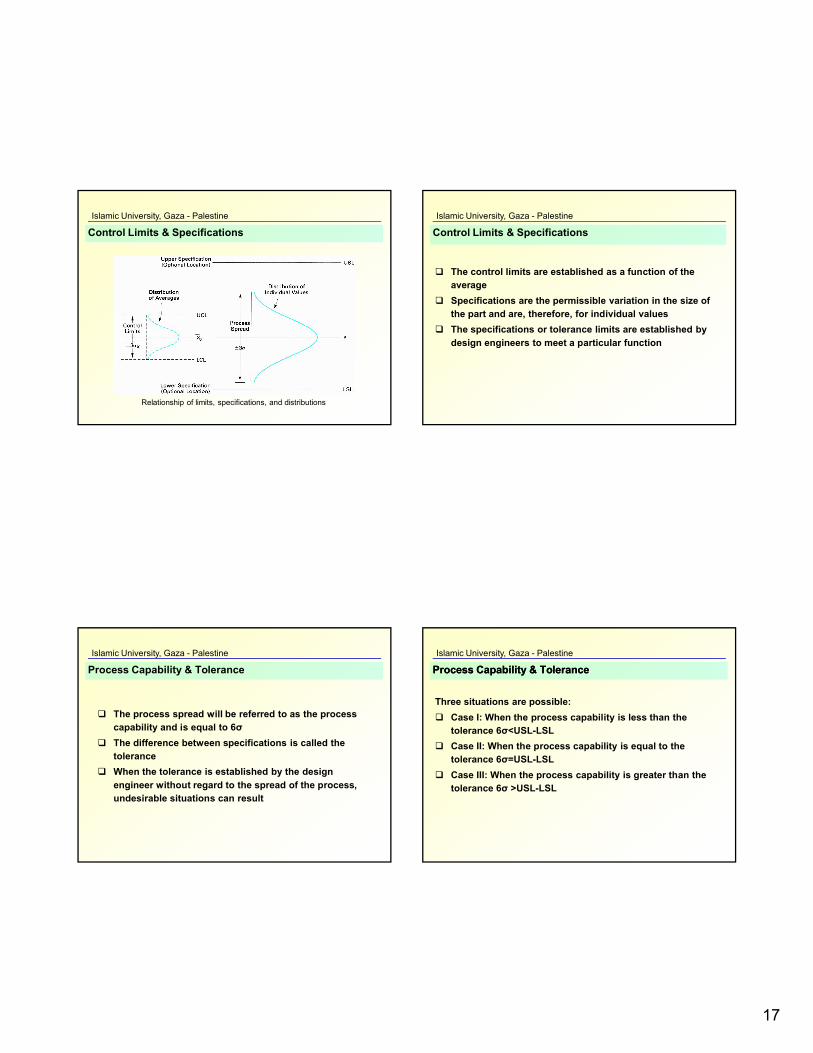
Relationship of limits, specifications, and distributions
Control Limits & Specifications
Islamic University, Gaza - Palestine
The control limits are established as a function of the average
Specifications are the permissible variation in the size of the part and are, therefore, for individual values
The specifications or tolerance limits are established by
design engineers to meet a particular function
Control Limits & Specifications
Islamic University, Gaza - Palestine
The process spread will be referred to as the process capability and is equal to 6σ
The difference between specifications is called the tolerance
When the tolerance is established by the design
engineer without regard to the spread of the process, undesirable situations can result
Process Capability & Tolerance
Islamic University, Gaza - Palestine
Three situations are possible:
Case I: When the process capability is less than the tolerance 6σ<USL-LSL
Case II: When the process capability is equal to the tolerance 6σ=USL-LSL
Case III: When the process capability is greater than the tolerance 6σ >USL-LSL
Process Capability & ToleranceProcess Capability & Tolerance
18
Islamic University, Gaza - Palestine
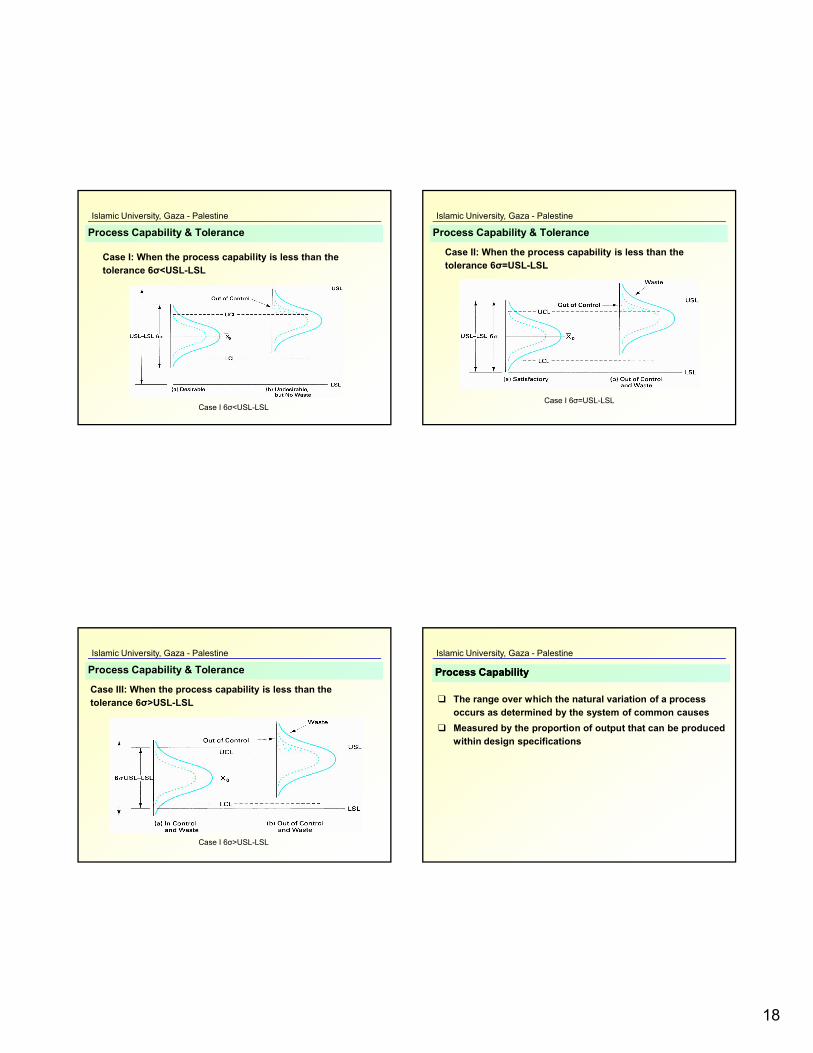
Case I: When the process capability is less than the tolerance 6σ<USL-LSL
Process Capability & Tolerance
Case I 6σ<USL-LSL
Islamic University, Gaza - Palestine
Case II: When the process capability is less than the tolerance 6σ=USL-LSL
Process Capability & Tolerance
Case I 6σ=USL-LSL
Islamic University, Gaza - Palestine
Case III: When the process capability is less than the tolerance 6σ>USL-LSL
Process Capability & Tolerance
Case I 6σ>USL-LSL
Islamic University, Gaza - Palestine
The range over which the natural variation of a process occurs as determined by the system of common causes
Measured by the proportion of output that can be produced within design specifications
Process CapabilityProcess Capability
19
Islamic University, Gaza - Palestine
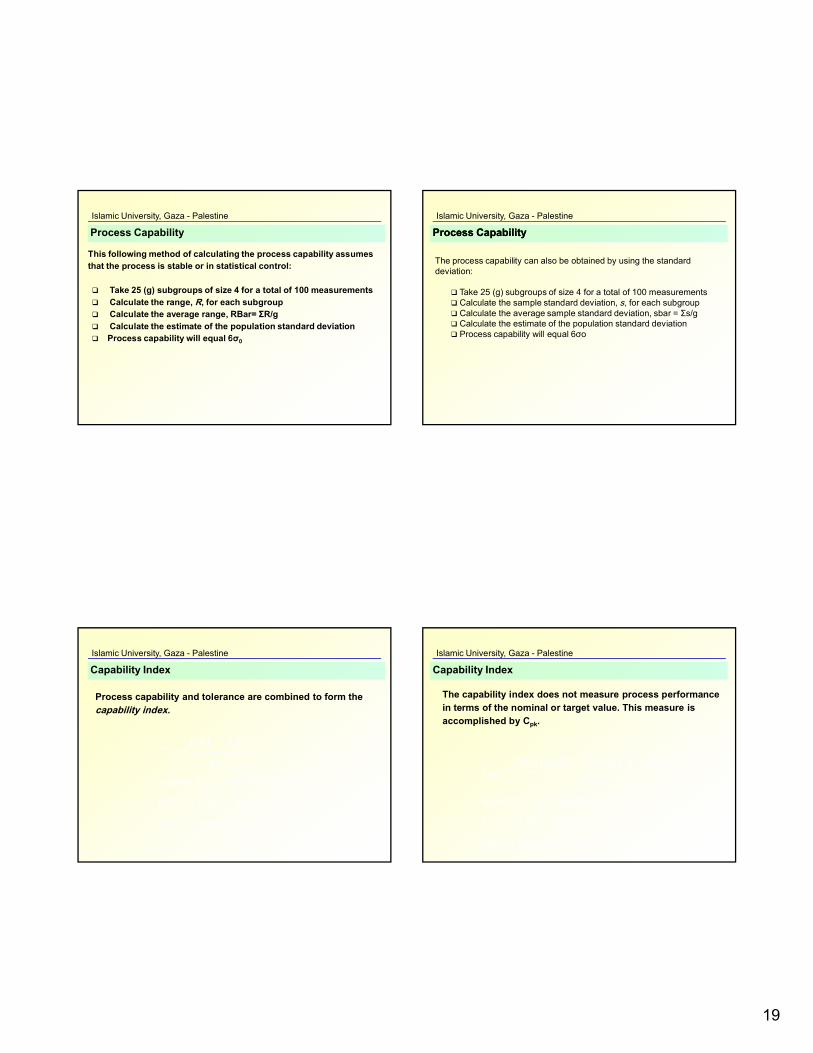
This following method of calculating the process capability assumes that the process is stable or in statistical control:
Take 25 (g) subgroups of size 4 for a total of 100 measurements Calculate the range, R, for each subgroup Calculate the average range, RBar= ΣR/g Calculate the estimate of the population standard deviation Process capability will equal 6σ0
Process Capability
0
2
R
d
Islamic University, Gaza - Palestine
The process capability can also be obtained by using the standard deviation:
Take 25 (g) subgroups of size 4 for a total of 100 measurements Calculate the sample standard deviation, s, for each subgroup Calculate the average sample standard deviation, sbar = Σs/g Calculate the estimate of the population standard deviation Process capability will equal 6σo
Process CapabilityProcess Capability
0
4
s
c
Islamic University, Gaza - Palestine
Process capability and tolerance are combined to form the capability index.
Capability Index
0
0
6
6
p
p
USL LSLC
where C capabilityindex
USL LSL tolerance
process capability
Islamic University, Gaza - Palestine
The capability index does not measure process performance in terms of the nominal or target value. This measure is accomplished by Cpk.
Capability Index
0
{( ) ( )
3
6
pk
p
Min USL X or X LSLC
where C capabilityindex
USL LSL tolerance
process capability
20
Islamic University, Gaza - Palestine
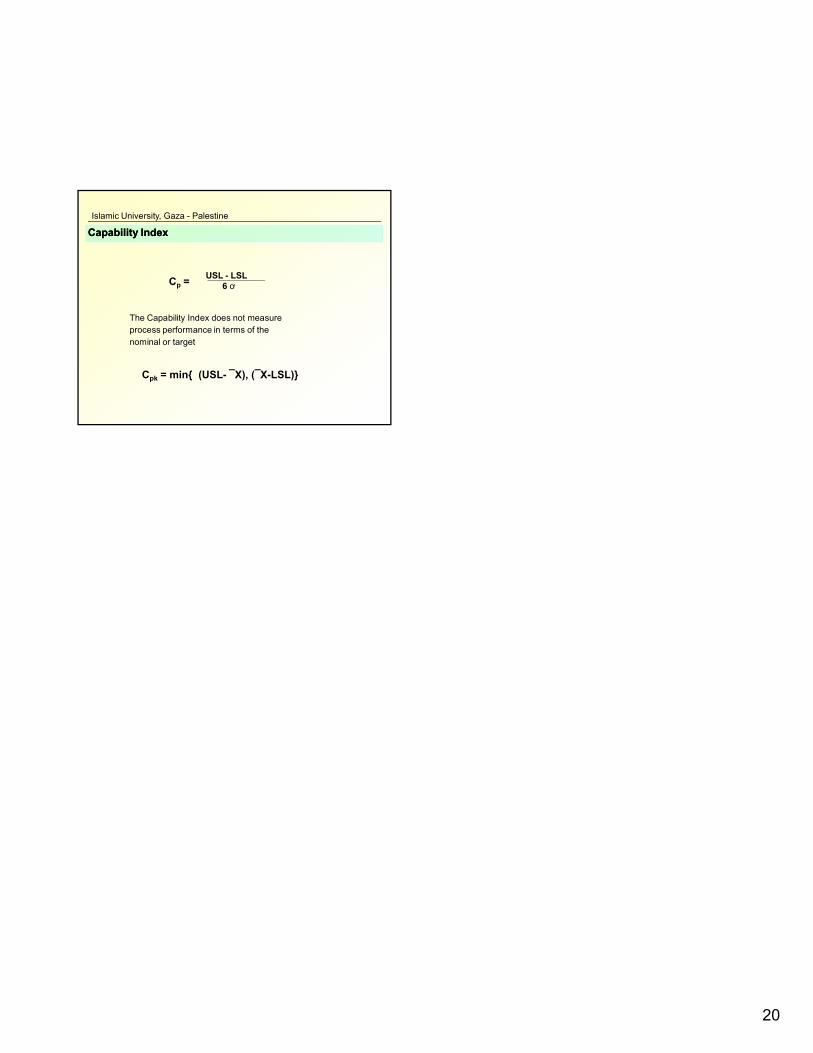
Cp = USL - LSL
6 ơ
(USL- ¯X), (¯X-LSL)} Cpk = min{
The Capability Index does not measureprocess performance in terms of the nominal or target
Capability IndexCapability Index