proceedings of the international conference on … · only dedicated to producing one product. in...
TRANSCRIPT

Proceedings of the International Conference on Industrial Engineering and Operations Management
Bandung, Indonesia, March 6-8, 2018
© IEOM Society International
Remodelling The Process Flow of Metal Division Assembly
Line
Joshua Wong Kha Choon, Ezutah Udoncy Olugu and Zuliani Zulkoffli
Department of Mechanical Engineering, Faculty of Engineering Technology & Built Environment.
UCSI University
Wilayah Persekutuan Kuala Lumpur, Malaysia
Abstract
Assembly line design has direct influence on manufacturing productivity. Poor assembly line design will
increase the cost of production. The aim of this project was to remodel the production assembly line for
cost reduction while not decreasing the productivity by conducting process flow evaluation and developing
an improved model of the assembly line. The weight-distance method was applied to determine the score
of current shop-floor layout of the metal division assembly line. Using the same method, a proposed shop
floor layout is developed. Using the precedence diagram, manufacturing critical path for the current and
proposed layout was identified and reviewed using a discrete event simulation software. Total weight-
distance of the current layout was calculated and valued at 10584.822. Ranking of each department base on
the total closeness factor was used to justify the development of the layout design. Layout design A has a
weight-distance score of 7708.842 whereas layout design B has a weight distance score of 8564.902.
Through a discrete event simulation software, process flow for hood was simulated with batch size of 100,
150 and 200. Future research can focus on machining line balancing and methods of implementing
ergonomic standards and automation for repetitive processes.
Keywords
Automotive, Assembly Line, Weight-Distance, Shop Floor Layout, Simulation
1. Introduction
1.1 Background of Study
In manufacturing industries, the quality and quantity of product depends mostly on the design of the assembly line.
There are various problems that are associated with assembly line which can affect the overall productivity of a
manufacturing company. Poor line balancing cause increase in idle time and lead time. Having excessive process steps
in an assembly line requires more capital investment for machineries, equipment and workstations. Furthermore, poor
utilization of machines and equipment can cause inefficient utilization of available floor space and bottleneck is more
likely to occur in the assembly line. All these problems contribute by increasing the production cost of assembly line.
In order to improve the productivity without incurring additional cost, there is a need to carefully study the assembly
line in order to develop a solution to these problems.
3425
Proceedings of the International Conference on Industrial Engineering and Operations Management
Bandung, Indonesia, March 6-8, 2018
© IEOM Society International
The aim of this presented paper is to remodel the production assembly line process flow in order to boost the
productivity. The study will identify problems in a production assembly line and develop an improved model of the
assembly line process flow. This is then followed by the evaluation of proposed process flow model of assembly line
using Flexsim simulation software.
2. Literature Review
According to Askin (2002) a product is any item designed, manufactured and delivered with the intention of making
a profit for the producer by enhancing the quality of life of the customer. Products and parts are core components in
an assembly line. Majority of products consist of several parts which constitute the final product. Thus, parts can be
described as a unit of production that make up the final product. There are four major process types that engineers
take into consideration before selecting the right assembly layout. These are job process, batch process, line process
and continuous process. Each of these production type have a unique characteristic. The job-shop process method has
low production volume but workers will be able to perform vast variety of processes. Process method is flexible and
can have many different configured sequence of process. The batch process has a moderate production volume. This
method allow manufacturer to produce several variety of products either in small batches or large batches. This process
type is flexible as workers only need to set-up workstations and production equipment for a specific batch. The line
process has a high production volume and usually consist of a few major product. It is a repetitive process as all
product undergo the same standardized process. The continuous process has the highest production volume and is
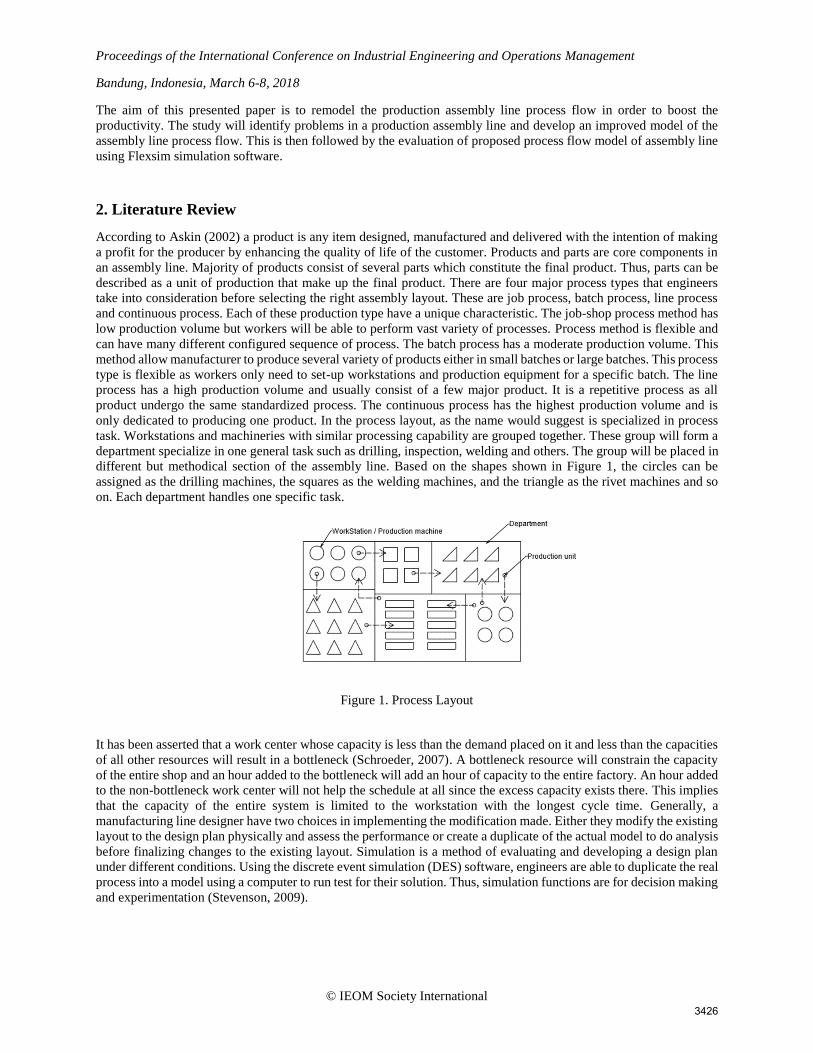
only dedicated to producing one product. In the process layout, as the name would suggest is specialized in process
task. Workstations and machineries with similar processing capability are grouped together. These group will form a
department specialize in one general task such as drilling, inspection, welding and others. The group will be placed in
different but methodical section of the assembly line. Based on the shapes shown in Figure 1, the circles can be
assigned as the drilling machines, the squares as the welding machines, and the triangle as the rivet machines and so
on. Each department handles one specific task.
Figure 1. Process Layout
It has been asserted that a work center whose capacity is less than the demand placed on it and less than the capacities
of all other resources will result in a bottleneck (Schroeder, 2007). A bottleneck resource will constrain the capacity
of the entire shop and an hour added to the bottleneck will add an hour of capacity to the entire factory. An hour added
to the non-bottleneck work center will not help the schedule at all since the excess capacity exists there. This implies
that the capacity of the entire system is limited to the workstation with the longest cycle time. Generally, a
manufacturing line designer have two choices in implementing the modification made. Either they modify the existing
layout to the design plan physically and assess the performance or create a duplicate of the actual model to do analysis
before finalizing changes to the existing layout. Simulation is a method of evaluating and developing a design plan
under different conditions. Using the discrete event simulation (DES) software, engineers are able to duplicate the real
process into a model using a computer to run test for their solution. Thus, simulation functions are for decision making
and experimentation (Stevenson, 2009).
3426

Proceedings of the International Conference on Industrial Engineering and Operations Management
Bandung, Indonesia, March 6-8, 2018
© IEOM Society International
3. Methodology
The research methodology is divided into three phases for an organized approach to the solutions. Each phases are
described in the following:
Table 1. Methodology Layout Phase Objective Description
1 Identify problems in the
Assembly Line
- Detailed study of assembly line and manufacturing process
flow to identify the root cause of problems.
2 Develop an improved model of
the assembly line process flow
- Data collection and analysis
- Productivity evaluation of current process flow
- Remodel process flow for comparison with current process
flow
- Development of proposed assembly line
3 Evaluate proposed model of the
assembly line using DES
- Test proposed assembly line through model simulation using
DES software.
3.1 Data Collection
Prior to conducting time study of the assembly line, Pareto chart analysis will be used to determine product with
highest production frequency as shown in Figure 2. Thus, data analysis will be conducted on the most frequent
production item for the most benefit.
Figure 2. Pareto Chart
The method of sample data collection is shown in Table 2 using Equation 1. Measurement will be repeated multiple
times for obtaining a precise and accurate data.
Table 2. Sample of Data Collection
Workstation Process Predecessors X1 X2 X3 R
A Process 1 - 36 32 33 4
B Process 2 - 13 18 15 5
C Process 3 A 21 23 24 3
D
E
Process 4
Process 5
B
D
31
22
28
21
29
23
3
2
R = Xmax - Xmin …………………………………………(1)
Where,
Xmax = Time maximum, Xmin = Time minimum and R = Range
3427
Proceedings of the International Conference on Industrial Engineering and Operations Management
Bandung, Indonesia, March 6-8, 2018
© IEOM Society International
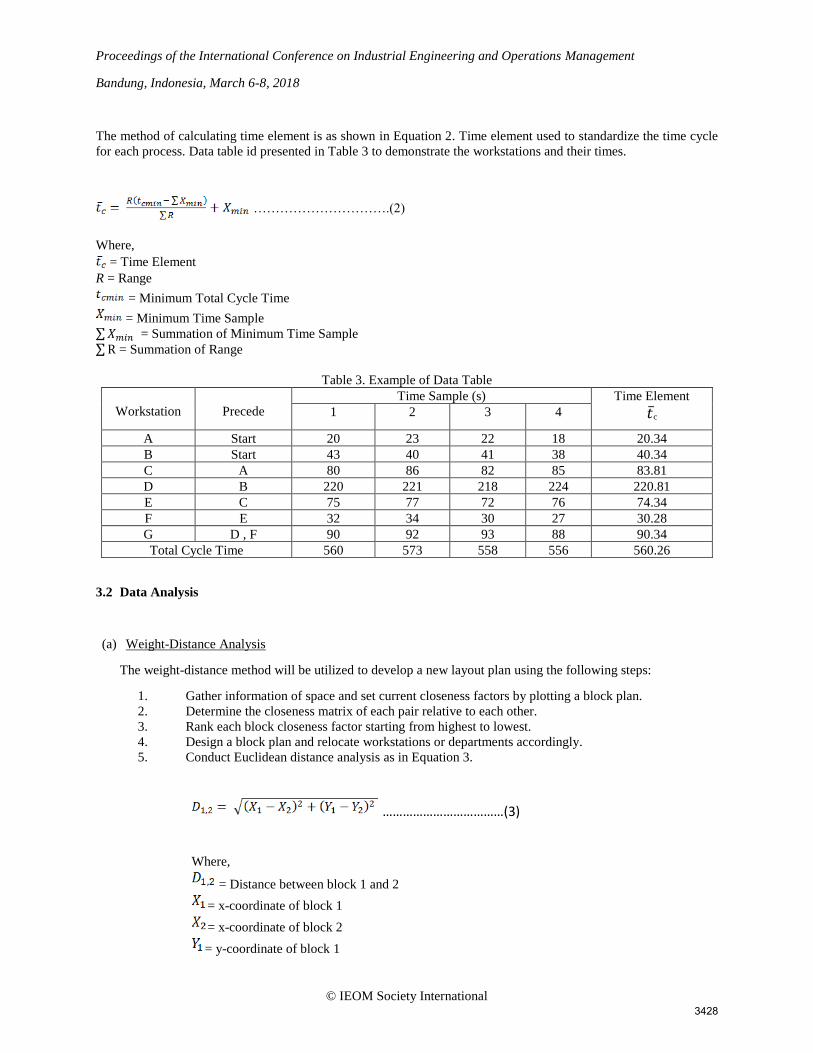
The method of calculating time element is as shown in Equation 2. Time element used to standardize the time cycle
for each process. Data table id presented in Table 3 to demonstrate the workstations and their times.
………………………….(2)
Where,
= Time Element
R = Range
= Minimum Total Cycle Time
= Minimum Time Sample ∑𝑋𝑚𝑖𝑛 = Summation of Minimum Time Sample
∑R = Summation of Range
Table 3. Example of Data Table
Workstation
Precede
Time Sample (s) Time Element
𝑡c 1 2 3 4
A Start 20 23 22 18 20.34
B Start 43 40 41 38 40.34
C A 80 86 82 85 83.81
D B 220 221 218 224 220.81
E C 75 77 72 76 74.34
F E 32 34 30 27 30.28
G D , F 90 92 93 88 90.34
Total Cycle Time 560 573 558 556 560.26
3.2 Data Analysis
(a) Weight-Distance Analysis
The weight-distance method will be utilized to develop a new layout plan using the following steps:
1. Gather information of space and set current closeness factors by plotting a block plan.
2. Determine the closeness matrix of each pair relative to each other.
3. Rank each block closeness factor starting from highest to lowest.
4. Design a block plan and relocate workstations or departments accordingly.
5. Conduct Euclidean distance analysis as in Equation 3.
………………………………(3)
Where,
= Distance between block 1 and 2
= x-coordinate of block 1
= x-coordinate of block 2
= y-coordinate of block 1
3428
Proceedings of the International Conference on Industrial Engineering and Operations Management
Bandung, Indonesia, March 6-8, 2018
© IEOM Society International
= y-coordinate of block 2
6. Calculated the weight-distance as in Equation 4.
………………….(4)
Where,
= weight-distance between block 1 and 2
= weightage
7. Choose the layout with lowest weight-distance.
(b) Time Analysis
Time analysis will be calculated based on distance between workstations or departments’ changes after
relocation. Thus the transport time between the pair will differ. The following procedure using Equation 5 and
Equation 6 will be applied to determine the theoretical transport time between the workstations or departments
pair.
…………………….(5)
Where,
= Transport speed
= Distance
= Current Transport Time
……………………………..(6)
Where,
= Transport speed
= Distance
= Current Transport Time
(c) Discrete Event Simulation
The current assembly line is modelled using DES software such as FlexSim by plotting blocks and inputting all
necessary parameter as in Figure 3 and block description in Table 4. The model is simulated and the result shows
which workstations with high idle time and lead time of operation. Then, a comparison between the current
assembly line and redesigned assembly line will be evaluated to observe improvements in idle, processing and
total run time.
3429

Proceedings of the International Conference on Industrial Engineering and Operations Management
Bandung, Indonesia, March 6-8, 2018
© IEOM Society International
Table 4. Block Description
Figure 3. Sample of Process Flow
4. Results and Discussions
4.1 Process Flow of Metal Division Assembly Line
Figure 4 shows the current shop floor layout of the automotive manufacturing and the list of acronyms in Table 5.
Figure 4. Automotive Part Manufacturing Metal Division Shop Floor Layout
Table 5. Acronyms for Metal Division Shop Floor Departments
GS- Guillotine Shearing
HP1- Hydraulic Press 1
HP2- Hydraulic Press 2
HP3- Hydraulic Press 3
HP4- Hydraulic Press 4
PP1- Part Production 1
RSW1- Robotic Spot Welding 1
RSW2- Robotic Spot Welding 2
RHR1- Robotic Hemming Roller 1
WAL1&3- Weld Assembly Line 1 and 3
WAL 2- Weld Assembly Line 2
LSM1,2,3,4- Laser Machining 1,2,3 and 4
TS&DS1- Tool and Die Storage 1
TS&DS2- Tool and Die Storage 2
Blocks Description
Start Material flow begin from here
Buffer Temporarily stores work piece until a target
quantity is fulfilled for next process
Processor Process work piece receive from buffer block
End No more further processing is require
3430

Proceedings of the International Conference on Industrial Engineering and Operations Management
Bandung, Indonesia, March 6-8, 2018
© IEOM Society International
CED- Chemical Electro Dialysis
Using the Pareto analysis, the highest demand item produced in Category A is identified to be ‘Hood’.
Figure 5. Pareto Chart for top 64 Item Number produced from January 2016 to June 2017
The top 16 items account for nearly 30% of the product output. Figure 6 shows the current layout material flow for
hood according base on task and Table 6 shows the weight distance of this current layout.
Figure 6. Current Layout Material Flow for Hood
Although the output quantity in percentage in both category B and C are higher than that of Category A, the variation
in items requires significantly more effort for a similar improvement benefit.
Table 6. Weight-Distance of Current Layout
Department Pair Current Layout
W D WD
A,B 12 113.782 1365.384
A,C 12 169.190 2030.280
A,D 12 171.353 2056.236
A,E 4 106.558 426.232
B,G 8 70.212 561.696
C,F 8 59.841 478.728
D,F 8 56.939 455.512
E,I 12 49.340 592.080
F,H 4 77.175 308.700
3431

Proceedings of the International Conference on Industrial Engineering and Operations Management
Bandung, Indonesia, March 6-8, 2018
© IEOM Society International
G,I 8 29.949 239.592
H,I 8 29.949 239.592
I,J 12 144.774 1737.288
J,K 2 46.751 93.502
Total Weight-Distance 10584.822
4.2 Proposed Layout Design
Two layout were proposed, which were layout design A in Figure 7 and layout design B in Figure 8. Based on this
layout, total closeness factor will be calculated and this factor value will ranked the layout from the highest to the
lowest. The highest ranking department will be selected first during consideration for the design of the proposed
layout. The weight distance comparison is presented in Table 7.
Figure 7. Layout Design A Figure 8. Layout Design B
Table 7. Weight-Distance Comparison
Department Pair Layout Design A Layout Design B
W D WD D WD
A,B 12 79.958 959.496 99.642 1195.704
A,C 12 92.332 1107.984 93.385 1120.62
A,D 12 104.722 1256.664 88.446 1061.352
A,E 4 154.127 616.508 176.974 707.896
B,G 8 26.649 293.192 47.340 378.720
C,F 8 36.920 295.36 80.474 643.792
D,F 8 36.834 294.672 77.900 623.200
E,I 12 83.796 1005.552 67.065 804.780
F,H 4 23.614 94.456 47.510 190.040
G,I 8 34.808 278.464 38.173 305.384
H,I 8 34.808 278.464 38.173 305.384
I,J 12 94.544 1134.528 94.544 1134.528
J,K 2 46.751 93.502 46.751 93.502
3432

Proceedings of the International Conference on Industrial Engineering and Operations Management
Bandung, Indonesia, March 6-8, 2018
© IEOM Society International
Total Weight-Distance 7708.842 8564.902
Layout Design A is selected as the proposed layout for having the lower weight-distance score of 7708.842
4.3 Discrete Event Simulation
Figure 9 shows model of process flow using FlexSim simulation software. The batch size simulated for 100, 150 and
200 and the run time will stop once all material flow path are blocked. Idle time and processing time are recorded in
the following Table 8, Table 9 and Table 10 depending on the batch size simulated.
Figure 9. Model of Process Flow using FlexSim
Table 8. FlexSim State report for batch size 100
Batch Size: 100 Current Layout Proposed Layout
Run Time: 224831.91 s Run Time: 222425.44 s
Block Idle Time, % Processing
Time,%
Idle Time, % Processing
Time,%
GS_A 1.90% 69.38% 2.05% 87.01%
HP1_B 18.59% 0.36% 17.89% 0.40%
HP2_C 14.77% 0.29% 14.26% 0.35%
HP3_D 15.15% 0.36% 14.63% 0.40%
PP1_E 12.91% 0.07% 11.41% 0.09%
RSW1_F 6.97% 14.57% 6.46% 14.36%
LSM1_G 8.95% 14.16% 7.91% 16.43%
LSM2_H 18.94% 55.67% 19.63% 55.65%
WAL2_I 5.58% 35.45% 5.41% 35.36%
CED_J 93.18% 6.82% 93.24% 6.76%
Average Time, % 19.69% 19.71% 19.29% 21.68%
3433

Proceedings of the International Conference on Industrial Engineering and Operations Management
Bandung, Indonesia, March 6-8, 2018
© IEOM Society International
Table 9. FlexSim State report for batch size 150
Batch Size: 150 Current Layout Proposed Layout
Run Time: 338197.57 s Run Time: 334588.49 s
Block Idle Time, % Processing
Time,%
Idle Time, % Processing
Time,%
GS_A 1.35% 50.95% 1.59% 65.22%
HP1_B 18.37% 0.17% 16.70% 0.23%
HP2_C 14.99% 0.14% 14.48% 0.16%
HP3_D 15.23% 0.17% 14.71% 0.20%
PP1_E 11.88% 0.04% 11.21% 0.05%
RSW1_F 6.95% 14.51% 6.44% 14.30%
LSM1_G 8.88% 14.11% 7.85% 16.37%
LSM2_H 19.13% 55.47% 19.82% 55.45%
WAL2_I 5.48% 35.33% 5.31% 35.23%
CED_J 93.20% 6.80% 93.26% 6.74%
Average Time, % 19.55% 17.77% 19.14% 19.40%
Table 10. FlexSim State report for batch size 200
Batch Size: 200 Current Layout Proposed Layout
Run Time: 451563.06 s Run Time: 446754.14 s
Block Idle Time, % Processing
Time,%
Idle Time, % Processing
Time,%
GS_A 1.27% 46.17% 1.42% 60.04%
HP1_B 18.11% 0.12% 17.43% 0.13%
HP2_C 15.02% 0.10% 14.51% 0.11%
HP3_D 15.56% 0.12% 15.03% 0.14%
PP1_E 12.40% 0.02% 11.06% 0.03%
RSW1_F 7.04% 14.49% 6.54% 14.28%
LSM1_G 8.79% 14.08% 7.76% 16.35%
LSM2_H 19.22% 55.37% 19.91% 55.35%
WAL2_I 5.52% 35.27% 5.34% 35.17%
CED_J 93.22% 6.78% 93.27% 6.73%
Average Time, % 19.62% 17.25% 19.23% 18.83%
3434

Proceedings of the International Conference on Industrial Engineering and Operations Management
Bandung, Indonesia, March 6-8, 2018
© IEOM Society International
4.4 Discussion
It can be observed from the results that a relocation of the layout can have noticeable improvement on the efficiency
and productivity of the layout. During data collection, five data sample were collected to determine the time element
of the assembly line. By determining Euclidean distance of departments’ pair, the transport speed was determined.
Using the weight-distance method, the relocation of each department were justified and the proposed theoretical
Euclidean distance was determined. Presuming the transport speed is unchanged, the new time element between
department pair was determined. Table 11 shows the comparison between current and proposed layout using weight-
distance method analysis.
Table 11. Comparison of Total Weight-Distance Score
Current Layout Weight-Distance 10548.422
Proposed Layout Weight-Distance 7708.842
Improvement 26.92 %
5. Conclulsion and recommendations
Evaluation of the process flow was conducted to determine current productivity of the assembly line. Through
remodeling of the shop floor layout configuration, a lower weight-distance score was achieved by ranking each
department from the total closeness factor. Selecting the highest ranking department as the priority department in
design eliminated the need to guess and randomly select departments to reconfigure. A DES was implemented to
support the proposed shop floor layout design reconfiguration from weight-distance analysis. According to the results
obtained, the proposed shop floor layout yielded a higher productivity which is in line with the the objective of this
project. Although these improvement focuses on the Hood (Item no: JS105-44), other variation of hood product will
obtain similar results.
It was observed that the tools and dye used for manufacturing product in the assembly line was not properly maintained
or stored. The manufacturer have a large and diverse array of tools that manufacture specific models of product. It is
necessary to remove disruption by doing periodic tools and dyes’ maintenance. As a batch of work piece get
transported to another department for the following process, it was observed that the pallet of work piece was just
placed in the designated space based on order number but not in any specific order. This caused a number of issues
such as lower productivity and efficiency. Most work piece were made of metal that rust if left unused over a long
period of time. A recommendation for this problem is to organize work-piece according to item type followed by order
number as opposed to order number only to minimize lead and setup time. In each work cell, there are workstations
which utilize machine for processing. It is possible to reduce the number of processes or improve the process method
by machining line balancing to reduce processing time cycle. Implementing ergonomic standards and automation for
repetitive processes will allow operators to be assigned to task that requires more technical skills or task that cannot
be done by machines. Having ergonomic standards means to develop a workstation that is designed for efficiency and
comfort for the operator. Further studies can be conducted on this topic to reduce the fatigue among operators.
References
Askin, R., & Standridge, C. 1993. Modeling and analysis of manufacturing systems 1st Ed. New York: Wiley.
Adeppa, A. 2015. A Study on Basics of Assembly Line Balancing. International Journal On Emerging
Technologies, 6(2), 294-297.
Adrian, P., Romeo, P., Serban, M., 2016. Using Six Sigma Methology to Improve the Assembly Process in an
Automotive Company. Procedia- Social and Behavioral Sciences, 221, 308-316
3435

Proceedings of the International Conference on Industrial Engineering and Operations Management
Bandung, Indonesia, March 6-8, 2018
© IEOM Society International
Aljorephani, Sufian K., & Hoda A. ElMaraghy. 2016. Impact Of Product Platform And Market Demand On
Manufacturing System Performance And Production Cost . Procedia CIRP ,52(1), 74-79.
Azizi, A., 2015. Evaluation Improvement of Production Productivity Performance using Statistical Process Control,
Overall Equipment Efficiency, and Autonomous Maintenance. Procedia Manufacturing, 2, 186-190.
Bralla, J. 1996. Design for excellence 1st Ed.). New York,N.Y.: McGraw-Hill.
Bhattacharjee,T.K. 1988. A heuristic approach to general assembly line balancing. International Journal of
Operations & Production Management,1, 67-77
Chen, C., Mestry, S., Damodaran, P., & Wang, C. 2009. The capacity planning problem in make-to-order enterprises.
Mathematical And Computer Modelling, 50(9-10), 1461-1473.
Cleveland, G., Schroeder, R.G., Anderson, J.C. 1989 A Theory of Production Competence. Decision Sciences,20 (4),
655–668
Falkenauer, E. 2013. Real-world Line Balancing of Very Large Products. IFAC Proceedings Volumes, 46(9), 1732-
1737.
FlexSim Simulation Software,n.d. Manufacturing Simulation [Online]. Available from:
<https://www.flexsim.com/manufacturing-simulation/> [Accessed 23 March 2017]
Groover M.P. 2010.Fundamentals of Modern Manufacturing: Materials, Processes, and Systems 4th Ed. John
Wiley & Sons
Goetsch, D., & Rickman, R. 2005. Technical drawing and engineering communication 1st Ed. Clifton Park, NY:
Thomson Delmar Learning
Hammarberg, M., & Sunden, J. 2014. Kanban in action 1st Ed. Shelter Island, N.Y.: Manning.
Iwata, Y., Taji, K., & Tamura, H. 2003. Multi-objective capacity planning for agile semiconductor manufacturing.
Production Planning & Control, 14(3), 244-254.
Kalpakjian, S., Schmid, S., & Kok, C. 2010. Manufacturing processes for engineering materials 1st Ed. Singapore:
Pearson-Prentice Hall.
Krishnamoorthi, K., & Krishnamoorthi, V. 2006. A first course in quality engineering 1st Ed. Upper Saddle River,
NJ: Pearson Prentice Hall.
Kumar, S., & Suresh, N. 2009. Operations management 1st Ed. New Delhi: New Age International.
Krajewski, L., Ritzman, L., & Malhotra, M. 2010. Operations management (9th ed.). Upper Saddle River, NJ:
Pearson Prentice Hall.
Metternich, J., Bechtloff, S., & Seifermann, S. 2013. Efficiency and Economic Evaluation of Cellular Manufacturing
to Enable Lean Machining. Procedia CIRP, 7, 592-597.
Mileham, A. 1991. Computer integrated manufacturing. Computer Integrated Manufacturing Systems, 4(2), 115
Nguyen, M. & Do, N. 2016. Re-engineering Assembly Line with Lean Techniques. Procedia CIRP, 40, 590-595.
Pannerselvam.R 2004, Production and Operations Management 9th Ed, Hall of India Private Limited: Pearson
Prentice-Hall
Peterson, W., Eschenbach, T., & Eschenbach, T. 2009. Cases in engineering economy 1st Ed. Oxford: Oxford
University Press.
Saptari, A., Leau, J., & Nor Akramin, M. 2015. Optimizing Assembly Line Production through Line Balancing: A
Case Study. Applied Mechanics And Materials, 761, 104-108.
Sculli, D. 1979. Dynamic aspects of line balancing. Omega, 7(6), 557-561.
3436

Proceedings of the International Conference on Industrial Engineering and Operations Management
Bandung, Indonesia, March 6-8, 2018
© IEOM Society International
Stevenson, W., Simpson, N., Hancock, P., & Stevenson, W. 2009. Study guide for use with Operations management
1st Ed. Boston, Mass.: McGraw-Hill/Irwin.
Sushma T.S., 2014. Research Methodology in Education 1st ed., USA: Lulu Publication
Thomopoulos, N. 2014. Assembly Line Planning and Control 1st Ed, Cham Heidelberg New York Dodrecht London:
Springer, 10-11
Torenli, A. 2009. Restructuring and balancing of the bus pre-assembly line at MAN Nutzfahrzeuge AG Ankara
factory. Master’S Thesis In The International Master’S Programme Automotive Engineering, 1(1), 1-23.
Voaden, G. 1991. Flexible Manufacturing Cells and Systems in CIM. Manufacturing Engineer, 70(4), 10.
Vitanov, V., Tjahjono, B., & Marghalany, I. 2007. A decision support tool to facilitate the design of cellular
manufacturing layouts. Computers & Industrial Engineering, 52(4), 380-403.
Wu, X., Chu, C., Wang, Y., & Yan, W. 2006. Concurrent design of cellular manufacturing systems: a genetic
algorithm approach. International Journal Of Production Research, 44(6), 1217-1241.
Zhang, W. 1998. The Qin terracotta army 1st ed. London: Scala Books
Biodata of authors
Joshua Wong Kha Choon was born in Malaysia. He obtained his Bachelors in Engineering in Mechanical
Engineering from UCSI University Kuala Lumpur in 2017. He is currently involved in Industry practice.
Ezutah Udoncy Olugu was born in Umuahia, Nigeria. He received the B.Eng degree in Mechanical and Production
Engineering from Nnamdi Azikiwe University Awka, Nigeria, in 2002, and M.Eng and Ph.D. degrees in Mechanical
Engineering from Universiti Teknologi Malaysia, Johor, Malaysia, in 2008 and 2011, respectively. Dr. Olugu is a
chattered engineer (C.Eng) and member of the Institute of Mechanical Engineers, United Kingdom (IMechE UK).
Currently an academic staff at the Department of Mechanical & Mechatronics Engineering, Faculty of Engineering,
UCSI University as an Assistant Professor. His current research interests include green supply chain management,
reverse logistics management, sustainable manufacturing, quality management, maintenance & Reliability
engineering, ergonomics and occupational safety.
Zuliani binti Zulkoffli was born in Pahang, Malaysia. She received her B. Eng degree in Mechanical
(Manufacturing) field in 2007, and Master of Science in Materials Engineering in 2010 from National University of
Malaysia, Selangor, Malaysia. Dr. Zuliani obtained a PhD in Machine Vision from University of Science Malaysia
(USM) in 2017. Currently, she is an academic staff at Department of Mechanical and Mechatronic Engineering,
Faculty of Engineering, UCSI University. Her current research interests includes manufacturing inspection, materials
science, smart manufacturing and embedded system development.
3437

Proceedings of the International Conference on Industrial Engineering and Operations Management
Bandung, Indonesia, March 6-8, 2018
© IEOM Society International 3438