proceedings of the 54th annual transportation …ageconsearch.umn.edu/bitstream/206958/2/14...
TRANSCRIPT

March 21-23, 2013
DOUBLETREE HOTEL
ANNAPOLIS, MARYLAND
www.trforum.org
Proceedings of the
54th Annual
Transportation Research Forum

Page 141
FACTORS INFLUENCING INTERSECTION CRASH SEVERITY Lei Zhang, University of Florida Fazil T. Najafi, University of Florida ABSTRACT
The objective of this paper is to develop intersection crash severity prediction model using ordered probit model. Motor vehicle fatalities is reported the major cause of death for people aging from 15 to 44. Moreover, intersections are recognized as the most hazardous locations on the roads. It is estimated that approximately 2.4 million intersection-related crashes occurred, representing 40 percent of all reported crashes and 21.5 percent of traffic fatalities in 2007. Furthermore, study shows that comprehensive cost of crash increases sharply with the aggregation of crash severity. Thus there is an urgent need to explore the significant factors influencing intersection crash severity.
The explanatory factors in the paper include the characteristics of the environment, vehicle, and the driver. The estimated model captures the marginal effects of all important explanatory factors simultaneously. For example, the model indicates the impacts of geometry elements, alcohol/drug use, and etc on the severity of intersection crashes. Thus the results can assist engineers and government officials to have better understanding and find solutions to eliminate fatal crashes at intersections.
1. Introduction
Road crashes are considered the leading cause of death and serious injuries in both developed and developing countries. In the United States, reported by the Federal Highway Administration (FHWA) they are the major cause of death for those who are 15 to 44 years old (FHWA
a, 2009). Moreover, intersections are recognized as the most hazardous locations on the
roads. In 2007, property damage only (PDO) crashes occurred at intersections or intersection related account for 37.82 percent of total PDO crashes, injury crashes are 44.83 percent, and facilities crashes take up to 21.53 percent (Figure 1). Furthermore, according to Figure 2, study shows that comprehensive cost of crash increases sharply with the aggregation of severity (FHWA
b, 2010). However, on the one hand, previous studies put great effort on crash frequency (Qin et al, 2004, Ye
et al, 2009, Dixon et al, 2012, Castro et al, 2012, Zhang et al, 2012) rather than crash severity. On the other hand, though present traffic management and practices are trying to reduce the crash frequency as well as severity, most judgments are based on the data collected by the police, in other words, aggregate analyses, rather than factors that contribute to the causation and consequences of crashes. Thus, intersection crash severity prediction model by using appropriate method plays a vital role in studying the roles of factors that influence crash severity.
The objective of the paper is to study on intersection crash severity prediction model. The ordered probit model will be applied. The results can help engineers and government officials to have better understanding and identify the impact of significant factors on the crash severity at intersections, and find solutions to eliminate fatal crashes.
Figure 1 Intersection Severity Source: FHWA
a, FHWA-SA-10-005 The National Intersection Safety Problem, November 2009

Page 142
In this paper, an extensive literature review is initially presented followed by the explanation of the proposed methodology. The third part gives a brief description of data sets. Presentation and discussion of the estimated crashed severity prediction model are provided afterwards. The paper ends with the conclusions.
Figure 2 Crash Costs by Injury Severity Level Source: FHWAb, FHWA-SA-09-029 Highway Safety Improvement Program Manual, 2010
2. Literature review In this section, an extensive literature devoted to crash modeling will be presented focusing on the most relevant and rigorous studies and works. The first part is to give a brief review about the modeling approaches applied, and the second part is the summation of finding of significant factors impact on the crash severity level.
2.1 Modeling Approaches
Considering the nature of discreteness and ordinal property among crashes injury severity, multinomial logit model (MNL) and ordered probit model (OP) are widely used. Both of them are more appropriate than standard regression model to analyze crash data (Tay& Rifaat, 2007, Kara & Young-Jun, 2002).
MNL model is popular because it is by far the easiest discrete choice model (Shankar and Mannering, 1996, Lee and Mannering, 1999, Sharma et al, 2012). Venkataraman and Fred (1996) convince that multinomial logit formulation is a promising approach to evaluate determinates in accident severity. However, it has limitation of "Independence of Irrelevant Alternatives (IIA)” property. Moreover, it cannot capture the ordinal nature of discrete data into the model.
Another popular approach is ordered probit response model such as ordered probit and logit model which can address the IIA problem. The major difference between probit and logit is that the former assumes the error term is normal distributed while the later assumes logistic distributed. However, some scholars are convinced that OP models are sensitive to underreporting of crash-injury data. Moreover, there is constrains of thresholds which have to shift in the same direction (Sharma et al, 2012).
Some scholars confirm that it is the most appropriate to apply ordered response models because dependent variables are in ordinal bringing about consistent and efficient estimates (Richard & Shakil, 2007; Kara & Young-Jun , 2002). However, others prefer unordered response models which enable them to have some flexibility in the parameter estimates (Tay & Rifaat, 2010).
Moreover, researchers further find that results got from these two models are quite similar (O’Donnell and Connor, 1996). Ye and Lord (2011) apply both MNL and OP to estimate crash severity and get the result that OP includes more significant variables and have a relatively higher adjusted rho-squared value. However, it still has a limitation of assuming normal distributions for all unobserved components.
The extension of OP is ordered ML which allows highly flexible error term. ML is to assume that the unobserved terms are independent from one severity type to another. Intuitively, it is possible that some severity types could share unobserved

Page 143
terms and have a correlation that violates the assumption. For example, PDO and possible injury accidents may share unobservable such as internal injury or effects associated with lower-severity accidents (Zhang, 2010).
So far, there is no consensus on which model is the best, as the selection of the model is often governed by the availability and characteristics of the data. Abdel-Aty and Keller (2005) find that data, including the information of both crash-specific and intersection characteristics, can result the highest prediction rate of injury level by using ordered probit model. 2.2 Severity Factors
Pervious researchers classify factors impacting on transportation crashes into three general categories including environment conditions, vehicle and driver attributes (Venkataraman & Fred, 1996; Kara & Young-Jun, 2002; Tay et al, 2011). Environment conditions include the design and control elements of facilities, and external conditions such as weather, lighting conditions, and etc. Vehicles attributes refers to vehicles size and performance characteristics. Driver attributes are driver characteristics and behaviors (Elefteriadou, 2012).
2.2.1 Environment
Previous studies shows that road conditions have impact on crash severity. Tay and Rifaat (2007) find that, low visibility as well as late-night drowsiness increases the possibility of intersection crashes. They also agree that crash time plays an important role in influencing intersection crash especially increasing fatal crash which is also confirmed by Doherty et al (1998). Nighttime is found to bring about more crash rates than daytime across all driver groups (Richard & Shakil, 2007). Another study conducted by Doherty et al (1998) shows that there are more crashes of all three injury severity levels which are PDO, injury and fatality occurred on Friday and Saturday than on any other weekdays. In addition, there witnesses more intersection crashes occurred in public housing estates than private estates.
Xiao et al (2004) find the relationship between crash severity and the daily volume is non-linear, and differs from crash type which is quite different from the relationship between crashes and segment length among all crash severity. Wong et al (2007) utilize Poisson regression and negative binomial regression. Their study focused on investigating impact of various factors on signalized intersection crash of three different severity levels in Hong Kong. They define crash risk as crash count divided by AADT and find that it increases with the increase of traffic volume.
Sharma et al (2012) uses quantile regression model and seemingly unrelated regression estimation to investigate the relationship between the reduction of speed limits and crash severity. They find that 10 mph reduction causes a lower probability of possible injury crashes and a higher probability of PDO crashes at 90% confidence level while 5 mph reductions does not show any significant effect on reducing crash severity. Moreover, lower speed limits are also found to reduce the probability of fatal and injury crashes in vicinity of the signalized intersection. O'Cinneide (1995) convinces that 11% decrease of causalities would be lead by every 10 kilometer per hour reduction of speed limit on average.
For the weather conditions, studies show that rain or wet surface contributes to several crashes (Woolley, 2012). Zhu and Srinivasan (2011) apply the ordered-probit model and find the negative effect of wet road surface on crash severity.
Researchers are also interested in geometry factors. Ivan et al (2011) conclude that wet- and dry-pavement crash rates decrease as skid resistance values increase. Moreover, they find interactive influence between wet-pavement friction and road sections. More specifically, mild and non-isolated curves are found to have the greatest reductions of frequency of serious injury and fatal crashes than more severe and/or isolated curves with the increase of wet-pavement friction. However, Cairney (2007) thinks that there exists a major limitation of data in most studies. Seasonal variation in skid resistance should be taken into consideration and controlled by measuring the data at the same time of year or adjustment the predication changes in skid resistance. Moreover, because of the different traffic flow and heavy vehicles, the skid resistance would be expected to vary from lane to lane.
When it comes to area type, Sprattler (2012) is convinced that driving in rural areas is more risky compared with urban areas. Moreover, rural crashes fatalities are found mainly ascribed to lower rates of occupant restraint usage, higher rates of alcohol-impaired driving, and higher driver speeds. He also finds that the probability of teenage involved fatal or severe injury crashes in rural areas is five to six times than that in urban areas.
2.2.2 Vehicles
Studies indicate the relationship between vehicle attributes and crash severity. Setting car as reference variable in the model, motorcycle-related and bicycle-related accidents are more severe than that only involving vehicle. Besides, trucked-related and bus-related accidents also have higher risk involved in fatal intersection crash. Many scholars believe that crashes involving heavy vehicles often have fatal outcomes (Tay & Rifaat, 2007, Woolley, 2012).
2.2.3 Drivers

Page 144
Previous studies indicate us that driver characteristics are positively associated with crash severity. Abdel-aty et al (1998) use aggregation count by category of specific factor to investigate the impact of drivers’ age on crashes utilizing the 1994 and 1995 Florida crash data. The categories in Abdel-aty’s research are classified into three injury levels including no injury, injury, and fatality. They draw the conclusion that drivers’ age is positively related with crash severity. More specifically, they find that drivers in middle-age are higher than other groups getting involved in crashes. Yet, elderly drivers are most likely to be associated with fatal crashes.
Findings in the current safety literature concerning teenager drivers in Minnesota are: seat belt use in fatal teen driver crashes is the lowest in remote rural areas for drivers; failure to yield, inexperience, distraction, and speed are contributing factors; after school and early evening hours are the most high risk times of the day (Sprattler et al, 2012).
Gebers (1998) finds that some driver characteristics have significantly impact on crash severity such as crash involvement rate, drivers’ traffic-citations record. Moreover, male as well as younger drivers have higher possibility to be involved into more sever crash.
Tay & Rifaat (2007) find that different ages of drivers bring about different tendency of intersection accidents. What’s more, drinking violations are positively related with fatal crash based on the recent crash history. More interestingly, Lourens et al (1999) find that there is no relationship between drivers’ education level and crash involvement.
Figure 3 shows that young drivers have higher not only frequency of all claims but also that of catastrophic claims in 2010 survey by Association of British Insures (ABI). Moreover, the age of the drivers rather than driving experience has significant impact on the likelihood of catastrophic injury (ABI, 2012).
Figure 3 Proportion of catastrophic claims by years of driving experience
Source: ABI, 2012, Improving the Safety of Young Drivers,
http://trid.trb.org/view/2012/M/1224243, access date December 2012.
3. Methodology
Owning to the natural ordering of the severity levels, the ordered probit modeling approach will be adopted to depict the determinants of intersection crash. According to ordered response model, the injury severity should be re-categorized starting from zero. Thus, the crash injury severity level is ranked from 0 to 4 with no-injury corresponding to the lowest level. By assuming the normal distribution of variation, the ordered probit model has the following form,
(1)
Where is a latent variable measuring the injury severity of crash i
is a vector of explanatory variable

Page 145
is a vector of unknown parameter
is the normally distributed error term
Since there are five ordinal categories for the response variables in this study, if the severity index is above an upper threshold ( ≤ ), then a fatal crash injury is recorded (y=4). On the other hand, if the severity injury is below a lower threshold ( ≤ ), then a minor crash is recorded (y=0). Finally, if the severity level is between the three thresholds ( ≤ or or ), then a serious injury crash is recorded (y=1 or y=2 or y=3). Thus, the estimated probability that driver i sustains an crash injury severity level of j is equal to the probability that the unobserved injury risk
Where is the cumulative standard normal distribution function
For all the probabilities to be positive, it requires .
The model is estimated for this analysis by using NLogit 4.0 software.
4. Data
The Florida Traffic Crash Redacted Records data used for this analysis are provided by the Florida Department of Transportation Office Research and Statistics. Due to the limitation of the data accessibility, the data of Hillsborough County, Florida in 2005 is applied. The database consisting of three separate files: crash, vehicle and occupant. Data is applied by merging these three files and matching the crash number which is unique for each crash accident. Thus all the information can be integrated. However, there are still limitations of the database. On the one hand, the data is only categorized by location including at intersection, influenced by intersection, driveway access, and etc. There is no subcategory for different types of intersection such as T-intersection, Y-intersection, and etc. On the other hand, information is not complete. For example, the gender information is missing.
For the crash severity, there are five types of severity level defined in the database as follow: 1. No injury indicates there is no reason to believe any person received bodily harm from the crash;
2. Possible Injury is defined as no visible signs of injury but complaint of pain or momentary unconsciousness;
3. Non-Incapacitating Evident Injury means visible injuries such as bruises, abrasions, limping, etc.
4. Incapacitating Injury indicates any visible signs of injury from the crash and person(s) had to be carried from the
scene;
5. Fatal Injury is the one in which an injury sustained in a crash that results in death within 30 days.
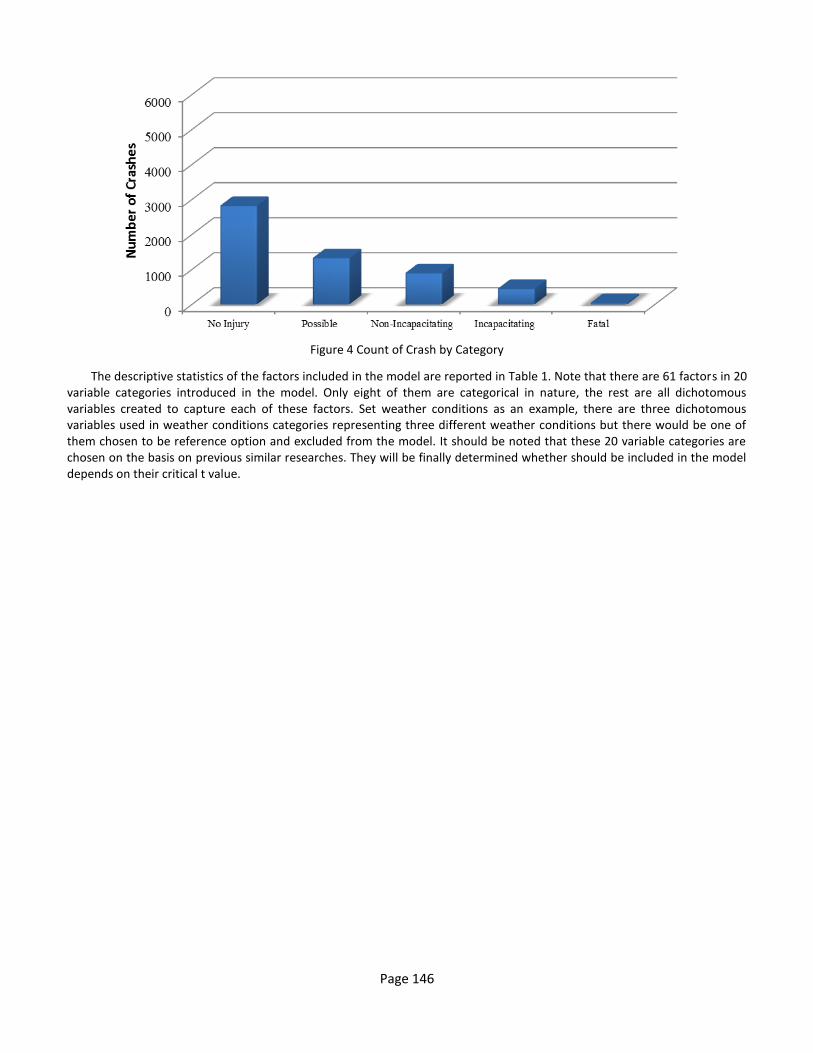
There are 5498 accident in Hillsborough County in 2005 in total. Figure 4 shows the count of crashes by different categories.
Page 146
Figure 4 Count of Crash by Category
The descriptive statistics of the factors included in the model are reported in Table 1. Note that there are 61 factors in 20 variable categories introduced in the model. Only eight of them are categorical in nature, the rest are all dichotomous variables created to capture each of these factors. Set weather conditions as an example, there are three dichotomous variables used in weather conditions categories representing three different weather conditions but there would be one of them chosen to be reference option and excluded from the model. It should be noted that these 20 variable categories are chosen on the basis on previous similar researches. They will be finally determined whether should be included in the model depends on their critical t value.

Page 147
Table 1 Summary Statistics for the Variables Included in the Models
Variable Type Description Mean Std_Dev
Injury level 0=No injury; 1=Possible Injury; 2=Non-Incapacitating Evident Injury; 3=Incapacitating Injury;4=Fatal Injury 0.85 1.018
Environment Conditions
Skid number Value of the average skid test results for the segment of road where the crash occurred. Skid number is between 25 and 55 35.648 4.406
Ln(AADT) Annual Average Daily Traffic which is between 7.65 and 12.23 10.44 0.62
Surface Width Surface width is between 10 and 60ft 30.404 9.133
Median Width Median width is between 0ft and 999ft 24.883 56.731
Average Truck Ratio The percentage of the AADT consisting of 6.409 3.351
trucks which is between 0% and 45.88% Speed Limit Speed limit is between 30mph and 70mph 44.991 6.619
Divided 1=Divided; 0=Undivided 0.365 0.481
Weather Conditions
Clear 1=Clear; 0=Otherwise 0.724 0.447
Cloudy 1=Cloudy; 0=Otherwise 0.175 0.38
Others 1=Rain/Frog/Others; 0=Otherwise 0.101 0.302
Lighting Conditions
Day Light 1=Day light/Unknown; 0=Otherwise 0.71 0.454
Dusk 1=Dusk; 0=Otherwise 0.031 0.173
Dawn 1=Dawn; 0=Otherwise 0.014 0.116
Dark (Street Light) 1=Day with street light; 0=Otherwise 0.215 0.411
Dark (No Light) 1=Dark without light; 0=Otherwise 0.031 0.172
Road Surface Conditons
Dry 1=Dry; 0=Otherwise 0.853 0.354
Wet 1=Wet; 0=Otherwise 0.139 0.345
Others 1=Slippery/Icy/All Other/Unknown; 0=Otherwise 0.008 0.09
Road Surface Type
Slag/Gravel/Stone 1=Slag/Grave/Stone; 0=Otherwise 0.019 0.138
Blacktop 1=Blacktop; 0=Otherwise 0.919 0.274
Concrete 1=Concrete; 0=Otherwise 0.057 0.231
Others 1=Brick/Block/Dirt/All Others/Unknown; 0=Otherwise 0.006 0.074
Road Conditions
No defect 1=No defect; 0=Otherwise 0.978 0.148
Repair/Construction 1=Repair/Construction; 0=Otherwise 0.012 0.111
Others 1=Other road conditions; 0=Otherwise 0.01 0.1
Work Area
None 1=None; 0=Otherwise 0.954 0.209
Nearby Work Area 1=Nearby work area; 0=Otherwise 0.027 0.161
Enter Work Area 1=Enter work area; 0=Otherwise 0.019 0.138
Crash time The time when accidents occurred 13.828 5.35
Week of Day Monday 1=Monday; 0=Otherwise 0.142 0.349

Page 148
Tuesday 1=Tuesday; 0=Otherwise 0.151 0.358
Wednesday 1=Wednesday; 0=Otherwise 0.144 0.351
Thursday 1=Thursday; 0=Otherwise 0.159 0.366
Friday 1=Friday; 0=Otherwise 0.176 0.381
Saturday 1=Saturday; 0=Otherwise 0.127 0.333
Sunday 1=Sunday; 0=Otherwise 0.101 0.302
Vision Obstruction
No obstruction 1=No vision obstruction; 0=Otherwise 0.939 0.24
Inclement Weather 1=Inclement weather; 0=Otherwise 0.02 0.139
Vehicles 1=Parked/Stopped Vehicles; 0=Otherwise 0.025 0.156
Others
1=Trees/Crops/Bushes/Load On Vehicle/Building or Fixed Object/Signs/Billboards/Fog/Smoke/Glare; 0=Otherwise
0.016 0.127
Vehicle
Vehicle Movement
Straight Ahead 1=Straight ahead at the time of crash; 0=Otherwise 0.549 0.498
Stop/Stopped/Stalled 1=Stop/Stopped/Stalled at the time of crash; 0=Otherwise 0.035 0.183
Left-turn 1=Making Left-turn at the time of crash; 0=Otherwise 0.242 0.428
Backing 1=Backing at the time of crash; 0=Otherwise 0.01 0.099
Right-turn 1=Making Right-turn at the time of crash; 0=Otherwise 0.066 0.248
Changing Lane 1=Changing lanes at the time of crash; 0=Otherwise 0.062 0.241
U-turn 1=Making U-turn at the time of crash; 0=Otherwise 0.011 0.104
Others
1=Entering or Leaving Parking/Properly Parked/Improperly Parked/Passing/Driverless or Runaway Vehicle/All Other/Unknown; 0=Otherwise
0.026 0.159
Vehicle Type
Automobile 1=Automobile; 0=Otherwise 0.636 0.481
Van 1=Van; 0=Otherwise 0.071 0.257
Light Truck/Pick Up 1=Light truck/Pick Up; 0=Otherwise 0.203 0.402
Medium Truck 1=Medium, truck; 0=Otherwise 0.015 0.122
Heavy Truck 1=Heavy truck; 0=Otherwise 0.015 0.12
Truck-Tractor 1=Truck-Tractor; 0=Otherwise 0.015 0.123
Bicycle 1=Bicycle; 0=Otherwise 0.01 0.1
Others 1=Motor Home(RV)/Bus/Motorcycle/Moped/All Terrain Vehicle/Train/Low Speed Vehicle/Other/Unknown; 0=Otherwise
0.035 0.183
Driver
Age Age of drivers at time of crash 38.062 17.055
Alcohol/Drug
1=Under influence of alcohol/drug/both; 0=No Alcohol/Drug Use 0.075 0.311

Page 149
5. EMPIRICAL RESULTS
Three groups of variables were considered in the empirical analysis: (1) Environment conditions, (2) Vehicle, and (3) Driver characteristic. The final specification is based on systematic procedures of eliminating statistically insignificant variables.
The final empirical results from the ordered response model of severity level are given in Table 2. The sign of variables can directly make the conclusion that a positive coefficient implies an increase in the corresponding variable will cause more serious crash injury and vice versa The impact of explanatory variables on the crash severity level is discussed by variable category in the following section. 5.1 Environment Conditions
First of all, the negative sign of the coefficient of road surface width (β= -.005) indicates that the propensity of crash injury severity level could decrease significantly by increasing road surface width. It can be explained by the reason that the wider road width can allow driver to have more space to take action to avoid hitting others. What’s more, the surface width is highly correlated with number of lanes. Roads with higher surface width might have more number of lanes which can also decrease the accident provided by similar studies (Roy Jorgensen Associates Inc, 1978, Wong et al, 2007).
Median width has no impact on crash severity level. This finding is consistent with some studies. A table included in the Danish design standards represents the relationship between crash severity and road median width indicating that medians can reduce the severity of crashes, yet once median width is over 3.0 m (9.8ft), it has little extra benefits (O’Cinneide, 1995). This conclusion is consistent with the fact of crash road information in the database. We can find that most of crash accounting about 84% on the roads with medium width over than 3m.
We can learn from the model that crash time has no impact on the severity level which is contrast with other similar study (Tay & Rifaat, 2010). However, it could be reasonable because crash with higher severity might be significantly caused by the lighting and visibility conditions rather than time. Neither weather conditions have impact on crash severity. This result is contrast with the findings by other researcher (Tay et al, 2011).
Lighting conditions in table 2 shows us that daylight and dark with street light can decrease the crash severity level; street light in dark has no relative different impact from any other lighting conditions including dusk and dawn. This result is consistent with previous one regarding with crash time. The reason why dark with street light has the same impact as daylight might be street light are bright enough to relief drivers’ vision obstruction problem. Therefore, we can reach conclusion that one of the best way to improve safety especially at night is to provide enough bright street light.
We can find that among the road surface category, blacktop will aggregate the crash severity compared with slag/grave/stone and concrete. This result is consistent with the finding conducted by Li & Bai (2008). When it comes to work zone, results indicate that traffic nearby work zone rather than entering work zone has the highest possibility to be involved in more serious accidents. This finding is consistent with the study conducted by Mokkapati (2007). The reason might lies in that drivers have enough warning information within the work zone and pay more attention to the traffic conditions while drivers do not have nearby the work zone.
AADT, average truck ratio, skid, speed limit and road surface conditions are tested to be insignificant in determining the crash severity level. The phenomenon might be ascribed to the high correlation between variables.
First of all, AADT might have a high correlation with other variables included in the model such as surface width. Thus it does not have impact on the crash severity. Additionally, the road surface conditions might also be highly related with the weather conditions resulting in its insignificant in the prediction model. Skid number which is the indicator of friction resistance might be resulted from the road surface type. Speed limit is set based on roadway geometrics (US Department of Transportation, 1985). Thus it might be highly correlated with other environment factors such as surface width, surface type, and etc. Additionally, the speed limit might not stand for actual speed of the vehicles involved in the crashes. Thus, speed limit might have nothing to do with the crash severity level. In other words, the data about the actual speed at the crash time rather than the speed limit could be more accurate to predict the severity level.
We can find that more severe crashes have high possibility to happen on the weekend which is out of expectation. However, after further consideration, the result can be reasonable. On the one hand, there is high possibility for people to hang out on weekend such as party and any other activities relating with alcohol which would increase the damage of crashes. On the other hand, initially the police patrol will check the road condition, conduct alcohol test, and give warning to those disobeyed drivers and force people to pay more attention and be careful when they are driving. However, the patrol will be less or even off on the weekend, thus, causing more ‘wild’ drivers.
In addition, serious crashed can also be related with poor vision especially caused by vehicles. Vision obstruction relating with weather such as inclement weather and other obstruction has no impact on crash severity. The result is consistent with what the model has predicted in the weather conditions category.

Page 150
5.2 Vehicle
Table 2 shows us that the type of vehicle involved plays a significant role in crash severity level as follows. First of all, van, truck including light truck, medium truck, and heavy truck have the same effect compared with automobile. Second, other vehicle types will cause damage effect on crash severity level. According to the variable description (Table 1), others vehicle type including bus, RV, and any other terrain vehicles types have large mass in commons. Thus, this finding is understandable owning to the principle of inertia. It is widely acknowledge that the greater mass of vehicles, the more time it will need to slow down speed. In crashes, mass vehicles are less capable to slow down the speed in a short time to avoid conflict. This finding is consistent with the result found by similar studies (Kara & Young-Jun, 2002, Tay & Rifaat, 2010, Tay et al, 2011). Additionally, truck tractor will decrease the accident severity though it also can be associated with mass vehicle. Truck tractor generally has lower speed and, at the same time, drivers will pay more attention to the nearby environment. Moreover, other drivers will also be more careful when they notice a truck tractor nearby. Last but not least, the coefficient of bicycle (β=.903) shows that bicycle involved intersection crashes will be most harmful. This result is consistent with the study conducted by Abdel-Aty & Keller (2005). The reason might be the comparatively large exposure of bicyclist.
When it comes to the vehicle movement, on the one hand, left turn, other movement including driverless/runaway vehicle, improperly parked and etc, and straight ahead cause the most severe injury levels compared with stopped/stalled movement; on the other hand, movement such as right turn, braking and change lanes caused less serious crash. The reason might lie in that when people making right turn or changing lanes, they would slow down speed and pay more attention than they just drive straight ahead. And the difference between left turn and right turn might be there are more conflict collision when drivers making left turn than right turn. This finding is also consistent with Abdel-Aty & Keller’s (2005). However, it is contrast with Tay and Rifaat’s (2010).
5.3 Effect of Driver Characteristic
The model shows us that in 2005, aging people are more likely to be involved in sever crash. The finding might be reasonable, because during the crash the old are slower to response and take action than the young. However, this result was in contrast to the results obtained in other study that examined the safety effects of elderly people (Tay et al, 2011). Moreover, the coefficient of Alcohol/Drug (β=.114) shows us that people under the influence of alcohol or drug are significant more likely to be involved in sever accidents.
5.4 Threshold Parameters
Both the constant and threshold parameters listed at the end of all tables do not have any physical meaning. They simply serve as the association between the observed crash severity level categories to the underlying factor influencing crash severity level.
5.5 Model Fit
The log-likelihood at convergence of the models is -5798 while the log-likelihood of the model that predicts market share in all the five crash severity level categories is -5627. A statistical comparison of corresponding two models gives us a test statistic value of 342, which is larger than the chi-squared value with 14 degrees of freedom at 95% confidence level. Therefore, we are confident that the independent variables included in the model provide substantial value in predicting the crash severity level.

Page 151
Table 2 Empirical Results
Explanatory variables Param. t-stat
Constant -0.159 -1.323
Environment Conditions
Skid number - -
AADT - -
Road Surface Width -0.005 -2.795
Road Medium Width - -
Average Truck Ratio - -
Speed Limit - -
Divided - -
Weather Conditions
Clear - -
Cloudy - -
Others - -
Lighting Conditions
Day Light -0.184 -3.186
Dusk - -
Dawn - -
Dark (Street Light) -0.21 -3.271
Dark (No Light) - -
Dry - -
Wet - -
Others - -
Slag/Gravel/Stone - -
Blacktop 0.144 2.527
Concrete - -
Others - -
No defect - -
Repair/Construction - -
Others - -
None - -
Nearby Work Area 0.164 2.156
Enter Work Area - -
Crash time - -
Week of Day
Monday - -
Tuesday - -
Wednesday - -
Thursday - -
Friday - -
Saturday 0.108 2.312
Sunday 0.135 2.677

Page 152
Vision Obstruction
No obstruction - -
Inclement Weather - -
Vehicles 0.289 3.338
Others - -
Vehicle Movement
Straight Ahead 0.144 1.932
Stop/Stopped/Stalled - -
Left-turn 0.273 3.513
Braking -1.008 -4.712
Right-turn -0.295 -3.019
Changing Lane -0.376 -3.833
U-turn - -
Others 0.348 2.772
Automobile - -
Van - -
Light Truck/Pick Up - -
Medium Truck - -
Heavy Truck - -
Truck-Tractor -0.642 -4.591
Bicycle 1.018 7.202
Others 0.446 4.913
Driver Characteristic
Age 0.004 4.527
Alcohol/Drug 0.114 2.209
Mu(1) 0.68 43.525
Mu(2) 1.392 58.904
Mu(3) 2.596 40.616
Number of cases 5498
Log likelihood at convergence -6483
Log likelihood for constants -6672
k 18
chi-squared 378
Rho2 0.0283
Adjusted Rho2 0.0258

Page 153
6. Conclusions Based on the empirical results, it is recommended that: First of all, regarding with the road conditions, blacktop seems
not be the best choice for the safety reason. Roads where high sever crashes occurred frequently are suggested to be widened if it is possible while median width is less helpful; action should be made to improve the maintenance of street light; adjacent warning sign should be given nearby the work zone area especially on the straight ahead segments where serve accidents have high possibility of occurrence; action should also be taken on the left-turn movement. Last but not least, from the perspective of driver characteristics, on the one hand, police patrol had better to be reinforced on the weekend; on the other hand, anti-alcohol and drug program for the designed drivers should be enforced.
For the future study, more years, and statewide or even nationwide data are need to validate the influence of significant factors identified in the paper. Moreover finding contrasts with similar studies indentified also need further study. In addition, because of the limitation and incomprehensiveness of the database, for example some data are missing such as drivers’ age. The crash prediction model needs to be updated by using more recent and comprehensive crash database by the same methodology. Last but not lease, for this paper, variables are introduced into the model individually. However, variables are sometimes play roles by affecting each other. Thus interaction variables need to be created to investigate the mutual affection between different variables.
REFERENCE
1. FHWAa. “FHWA-SA-10-005 The National Intersection Safety Problem,” Last modified November, 2009.
http://safety.fhwa.dot.gov/intersection/resources/fhwasa10005/brief_2.cfm.
2. FHWAb. “FHWA-SA-09-029 Highway Safety Improvement Program Manual,” Last modified January 2010.
http://safety.fhwa.dot.gov/hsip/resources/fhwasa09029/index.cfm#toc.
3. Qin, X., Ivan, J., and Ravishanker, N., “Selecting exposure measures in crash rate prediction for two-lane highway
segments,” Accident Analysis and Prevention 36 (2004): 183–191, accessed December 10, 2012.
http://www.sciencedirect.com/science/article/pii/S0001457502001483.
4. Ye, X., Pendyala R., Washington S., Konduri K., and Oh, J., “A simultaneous equations model of crash frequency by
collision type for rural intersections,” Safety Science 47 (2009): 443–452, accessed December 8, 2012.
http://www.sciencedirect.com/science/article/pii/S0925753508000933.
5. Dixon, M., Abdel-Rahim, A., and Elbassuoni, S., “Evaluation of the Impacts of Differential Speed Limits on Interstate
Highways in Idaho,” Idaho Transportation Department (2012), access December 10, 2012.
http://www.itd.idaho.gov/highways/research/archived/reports/DSL%20Final%20Report%2011-26-12.pdf.
6. Castro, M., Paleti, R., and Bhat, C.,”A latent variable representation of count data models to accommodate spatial and
temporal dependence: Application to predicting crash frequency at intersections,” Transportation Research Part B 46
(2012): 253–272, access December 02, 2012. http://www.sciencedirect.com/science/article/pii/S0191261511001366.
7. Zhang, Y., Xie, Y., and Li, L., “Crash frequency analysis of different types of urban roadway segments using generalized
additive model, ” Journal of Safety Research 43 (2012): 107–114, access December 02, 2012.
http://www.sciencedirect.com/science/article/pii/S0022437512000072. .
8. Tay, R. and Rifaat, S., “Factors Contributing to the Severity of Intersection Crashes,” Journal of Advanced Transportation
41 (2007): 245-265, access December 02, 2012. http://onlinelibrary.wiley.com/doi/10.1002/atr.5670410303/abstract.
9. Kara K. & Young-Jun K. (2002), “Driver injury severity: an application of ordered probit models”, Accident Analysis and
Prevention 34, pp.313–321, access December 02, 2012.
http://www.sciencedirect.com/science/article/pii/S0001457501000288.
10. Shankar, V., & Mannering, F. (1996). “An exploratory multinomial logit analysis of single vehicle motorcycle accident
severity’’, Journal of Safety Research, 27, no. 3, pp. 183-194.
11. Lee, J. and Mannering, F., “Research Project T9903, Task 97 Analysis of Roadside Accident Frequency and Severity and
Roadside Safety Management,” Washington State Transportation Center (1999), access date December 2012.
http://www.wsdot.wa.gov/research/reports/fullreports/475.1.pdf.
12. Sharma, A., Rilett, L., Wu, Z., and Wang, S., “Report # UNL: SPR-P1 (11) M307 Speed Limit Recommendation in
Vicinity of Signalized, High-speed Intersection,” Nebraska Transportation Center (2012), access December 20, 2012.
http://ntl.bts.gov/lib/45000/45600/45688/Sharma_SpeedLimitRecommendations_FINAL.pdf.

Page 154
13. Zhu, X. and Srinivasan, S., “A comprehensive analysis of factors influencing the injury severity of large-truck crashes”,
Accident Analysis and Prevention 43 (2011): 49-57, access December 20, 2012.
http://www.sciencedirect.com/science/article/pii/S0001457510001958.
14. Venkataraman S. & Fred M., “An Exploratory Multinomial Logit Analysis of Single-Vehicle Motorcycle Accident
Severity,” Journal of Safety R-h 27 (1996): 183-194, access December 20, 2012.
http://www.sciencedirect.com/science/article/pii/0022437596000102.
15. Tay, R. and Rifaat, S., “Factors Contributing to the Severity of Intersection Crashes,”Journal of Advanced Transportation
41(2010): 245-26, access December 20, 2012. http://onlinelibrary.wiley.com/doi/10.1002/atr.5670410303/abstract.
16. O'Donnell, J. and Connor, H., “Predicting the Severity of Motor Vehicle Accident Injuries Using Models of Ordered
Multiple Choice,” Accident Analysis & Prevention 28 (1996): 739-753, access November 20, 2012.
http://www.sciencedirect.com/science/article/pii/S0001457596000504.
17. Ye, F. and Lord, D., “Comparing Three Commonly Used Crash Severity Models on Sample Size Requirements:
Multinomial Logit, Ordered Probit and Mixed Logit Models,” Texas A&M University (2011), accessed March, 20, 2012.
https://ceprofs.civil.tamu.edu/dlord/Papers/Ye_and_Lord_Crash-Severity_Sample_Size.pdf.
18. Zhang, H., “Identifying and quantifying factors affecting traffic crash severity in Louisiana.” PhD diss., Louisiana State
University, 2010.
19. Abdel-Aty, M. and Keller J., “Exploring the overall and specific crash severity levels at signalized intersections,” Accident
Analysis and Prevention 37 (2005): 417–425, accessed March, 10, 2012.
http://www.sciencedirect.com/science/article/pii/S0001457504001186.
20. Tay, R., Choi, J., Kattan, L., and Khan A., (2011), “A Multinomial Logit Model of Pedestrian–Vehicle Crash Severity, A
Multinomial Logit Model of Pedestrian–Vehicle Crash Severity”, International Journal of Sustainable Transportation, 5,
233-249.
21. Elefteriadou, L., An Introduction to Traffic Flow Theory, University of Florida, 2012.
22. Doherty, S., Andrey, J., and MacGregor, C., “The situational risks of young drivers: the influence of passengers, time of
day and day of week on accident rates,” Accident Analysis and Prevention 30 (1998: 45–52, accessed March, 10, 2012.
http://www.sciencedirect.com/science/article/pii/S0001457597000602.
23. Xiao Q., Ivan, J., and Ravishanker, N., “Selecting exposure measures in crash rate prediction for two-lane highway
segments,” Accident Analysis and Prevention 36 (2004): 183–191, accessed April, 10, 2012.
http://www.sciencedirect.com/science/article/pii/S0001457502001483.
24. Wong, S., Sze, N. and Li, Y., “Contributory factors to traffic crashes at signalized intersections in Hong Kong,” Accident
Analysis & Prevention 39 (2007): 1107–1113, accessed March, 18, 2012.
http://www.sciencedirect.com/science/article/pii/S0001457507000279.
25. O'Cinneide, D., “The Relationship between Geometric Design Standards and Safety,” Boston, August 30 - September 1,
1995, accessed by March, 20, 2012. http: //trid.trb.org/view.aspx?id=656831.
26. Woolley, J., “AP-R418-12 Traffic management and infrastructure: lessons from in-depth crash investigation,” Austroads
(2012) access December 5, 2012. http://trid.trb.org/view/2012/M/1218574.
27. Ivan, J., Ravishanker, N., Jackson, E., Aronov, B., and Guo, S., “A Statistical Analysis of the Effect of Wet-Pavement
Friction on Highway Traffic Safety,” Journal of Transportation Safety & Security 4 (2011): 116-136, accessed January 8,
2013. http://www.tandfonline.com/doi/abs/10.1080/19439962.2011.620218.
28. Cairney, P., “Skid resistance and crashes – A review of the literature (Research Report No. 311),” Vermont, South
Victoria, Australia: ARRB Transport Research Ltd. (2007), accessed January 8, 2013.
http://www.arrb.com.au/admin/file/content13/c6/ARR%20311%20Skid%20resistance.pdf.
29. Sprattler, K. and Sprattler Group. “Minnesota Rural Teen Crash Project (CTS 12-22)”, University of Minnesota (2012),
accessed December 10, 2012. http://trid.trb.org/view/2012/M/1212616.
30. Gebers, M., “Exploratory multivariable analyses of California driver record accident rates,” Transportation Research
Record 1635 (1998): 72–80, accessed December 10, 2012.
https://www.dmv.ca.gov/portal/server.pt/document/15605/166_explortory_multi_analy.pdf.
31. Lourens, P., Vissers, J., and Jessurun, M., “Annual mileage, driving violations, and accident involvement in relation to
drivers’ sex, age, and level of education,” Accident Analysis & Prevention 31(1999): 593–597, accessed January 10, 2013.
http://www.sciencedirect.com/science/article/pii/S0001457599000159.

Page 155
32. Association of British Insurers. ” Improving the Safety of Young Drivers,” (2012), access date December 2012.
http://trid.trb.org/view/2012/M/1224243.
33. Roy Jorgensen Associates, Inc, Cost and Safety Effectiveness of Highway Design Elements Report 197, National
Cooperative Highway Research Program Report, Washington, DC, 1978.
34. Li, Y. and Bai, Y., “Development of crash-severity-index models for the measurement of work zone risk level,” Accident
Analysis and Prevention 40 (2008): 1724–1731, accessed by April, 23th, 2012.
http://www.iri.ku.edu/publications/AAP_Bai.pdf.
35. Mokkapati, N., “Determining the extent and characteristics of overrepresentation of large truck crashes in daytime and
nighttime work zones,” Master diss., Texas A&M University 2007.
36. US Department of Transportation, “FHwA Speed Limit Synthesis Report Number FHWA/RD-85/096” (1985), access by
January 2013. http://www.ibiblio.org/rdu/sl-synth.html.