procedural modeling of cities · 2019-04-03 · yoav i h parish pascal müller...
TRANSCRIPT
ABSTRACT
Modeling a city poses a number of problems to computer graph-ics. Every urban area has a transportation network that followspopulation and environmental influences, and often a superim-posed pattern plan. The buildings appearances follow historical,aesthetic and statutory rules. To create a virtual city, a roadmaphas to be designed and a large number of buildings need to begenerated. We propose a system using a procedural approachbased on L-systems to model cities. From various image mapsgiven as input, such as land-water boundaries and populationdensity, our system generates a system of highways and streets,divides the land into lots, and creates the appropriate geometryfor the buildings on the respective allotments. For the creation ofa city street map, L-systems have been extended with methodsthat allow the consideration of global goals and local constraintsand reduce the complexity of the production rules. An L-systemthat generates geometry and a texturing system based on textureelements and procedural methods compose the buildings.
CR categories:
F.4.2 [Mathematical Logic and Formal Lan-guages]: Grammars and Other Rewriting Systems: ParallelRewriting Systems, I.3.7 [Computer Graphics]: Three-Dimen-sional Graphics and Realism, I.6.3 [Simulation and Modeling]:Applications
Keywords:
L-system, software design, developmental mod-els, modeling, urban development, architecture
1 INTRODUCTION
Modeling and visualization of man-made systems such as largecities is a great challenge for computer graphics. Cities are sys-tems of high functional and visual complexity. They reflect thehistorical, cultural, economic and social changes over time inevery aspect in which they are seen. Examining pictures of alarge-scale city such as New York reveals a fantastic diversity ofstreet patterns, buildings, forms and textures. The modeling andvisualization of large-area cities using computers has becomefeasible with the large memory, processing and graphics powerof todays hardware. The potential applications for a proceduralcreation range from research and educational purposes such asurban planning and creation of virtual environments to simula-tion. Especially the entertainment market such as the movie andgame industry have a high demand for the quick creation ofcomplex environments in their applications.Visual modeling of large, complex systems has a long traditionin computer graphics. Most of these approaches address theappearance of natural phenomena. Much of the appeal of suchrenderings lies in the possibility to depict the complexity oflarge-scale systems, which are composed of simpler elements.
Some of these systems include: the simulation of erosion [23],particle based forests [28] and cloud modeling [25].Grammar-based generation of models (especially L-systems) areemployed in computer graphics mainly to create plant geometry[26]. L-systems have evolved into very sophisticated and power-ful tools [20, 27] and have been extensively used in the modelingof plant ecosystems described in [8].
1.1 Related Work in Urban Modeling
One approach to modeling existing cities is the use of aerialimagery to extract the buildings and streets thereof, using com-puter vision methods. There are various research projects thatrely on this approach, e.g. [15]. This method can be used torebuild cities, but is not designed to create new models withoutphotographic input data.The existing research work concerning the visualization of cities[6, 7, 13, 29] focuses on techniques for data management, fastreal-time visualization and memory-usage optimization.In [1], Alexander et al. describe a pattern language, which con-sists of over 250 relevant patterns for the successful constructionof cities, buildings and houses. They range from very generalpatterns like “Ring Roads” to very specific ones like “Pavingwith cracks between the stones”. Since these patterns are notformalized, they cannot be used in the automatic creation pro-cess of an urban environment.
Space Syntax
has been developed by Hillier [16]. Space syntaxcan be viewed as a set of theories analyzing the complexity oflarge-scale spaces, such as cities. It tries to explain humanbehaviors and activities from a spatial point of view and hasbeen used in the analysis of city pedestrian flows [17] or way-finding processes [24]. This approach is analytical and relies onthe availability of city-maps. In the field of architectural interac-tive design one approach might be mentioned: the
shape
gram-mar
developed by Stiny [31]. This method uses production rules,but instead of operating on strings, a shape grammar definesrules directly on shapes. Shape grammars have been used to gen-erate two-dimensional patterns and in interactive design applica-tions.
1.2 Our approach
We present a system called
CityEngine
which is capable ofmodeling a complete city using a comparatively small set of sta-tistical and geographical input data and is highly controllable bythe user. To our knowledge, there is no such system available,although one very similar project outline is presented under [34].In [5], a method for generating urban models is presented byrefinement of existing geometry. However, in this approach abasic model of the city buildings has to be created manually.Other systems [4, 32] rely on aerial pictures as the main inputfor building and road placement. Our
CityEngine
createsurban environments from scratch, based on a hierarchical set ofcomprehensible rules that can be extended depending on theusers needs.In [33], Wegener splits the urban model into subsystems. Hestates that the subsystems
networks
,
land use
and
housing
areamong the slowest changing elements in an urban environment.Therefore, in our system
CityEngine
, the creation of the cityis reduced to generating a traffic network and buildings. Landuse data is provided by the user in form of image-maps. Whenstudying maps and aerial photographs of large cities, it is obvi-ous that the streets follow some sort of pattern on different
Procedural Modeling of Cities
Yoav I H Parish Pascal Müller
[email protected] [email protected]
ETH Zürich, Switzerland Central Pictures, Switzerland
scales. Roads are the transportation medium for the urban popu-lation distributed over the area. L-systems have been used in asimilar application [20], support branching very well and havethe advantage of database amplification [30]; this suggests theirpotential use to generate convincing large-scale road patterns.We have adapted the model of L-systems to enable the creationof large cities, based on the data that has been collected in [11]on four huge cities around the world, i.e. New York, Paris, Tokyoand London.Although we simplified the underlying model of the virtual city,the main design goal for the system is easy extensibility. Wewant to be able to add new subsystems, such as different trans-portation networks (underground, train) and alternative landuses. To achieve this, we extended the L-system with a higher-level mechanism that makes the addition of new rules very easy.
1.3 Overview
In Chapter 2 we describe the concept and the pipeline of the
CityEngine
system, and the methods used therein. In Chapter3 the idea of extended L-systems, which allow the implementa-tion of global goals and local constraints is introduced. We dem-onstrate the use of this extended concept on the creation of theroadmap. Chapter 4 gives a brief overview of the generation ofallotments and buildings and explains our proposed mechanismto simplify the texturing of facades. Finally, the results weachieved are shown and discussed in Chapter 5.
2 SYSTEM ARCHITECTURE
The
CityEngine
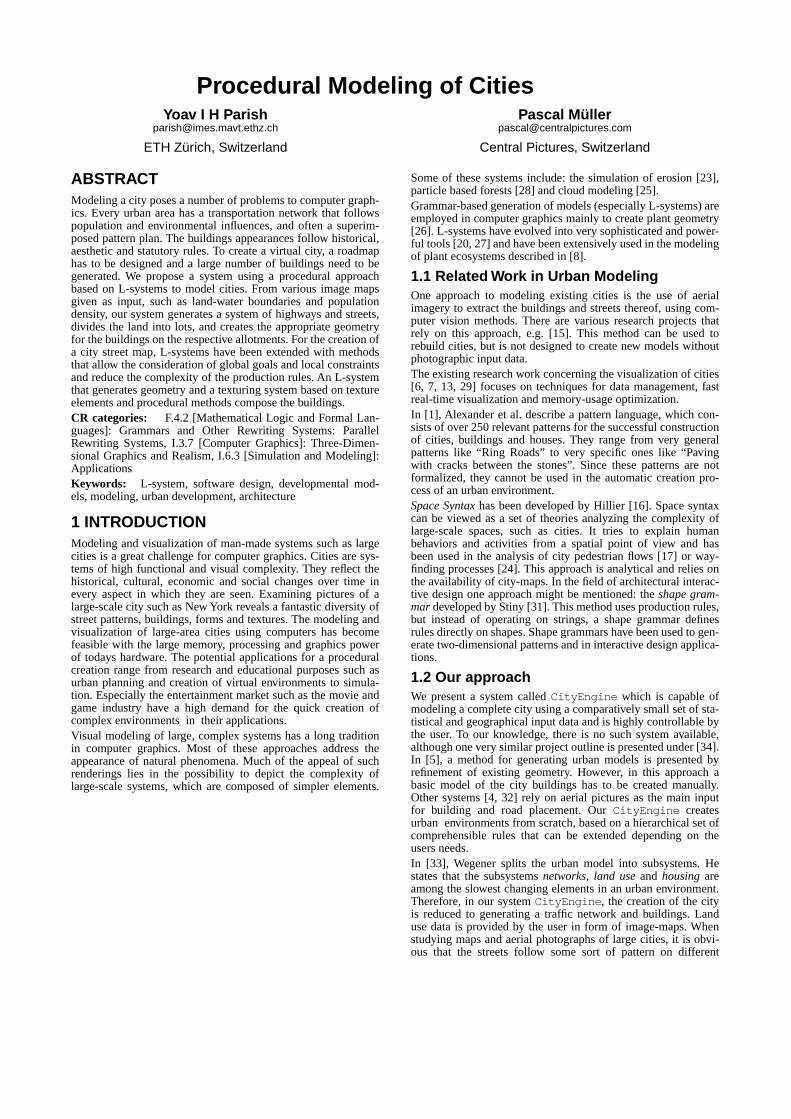
system consists of several different toolswhich form the pipeline that is shown in figure 1. In a first step,the input data is fed to the road-generation system, using anextended L-system described in 3.4. The areas between the roadsare then subdivided to define the allotments the buildings areplaced on. In a third step, by applying another L-system, thebuildings are generated as a string representation of booleanoperations on simple solid shapes. Finally, a parser interprets allthe results for the visualization software. The visualization soft-ware should be able to process polygonal geometry and texturemaps. This is the case for practically any 3D renderer. Addition-ally, most scanline renderers support procedural textures, so theproposed mechanism to generate facades of buildings can beincorporated into the pipeline.
Most of the input data to build up the virtual city is representedby 2D image maps which control the behavior of the system.Those images can be easily generated either by drawing them orby scanning from statistical and geographical maps, as found in[11]. The data can be categorized into two general classes:
• Geographical Maps- Elevation maps- Land/water/vegetation maps
• Sociostatistical maps- Population density- Zone maps (residential, commercial or mixed zones)- Street patterns (control behavior of streets)- Height maps (maximal house height)
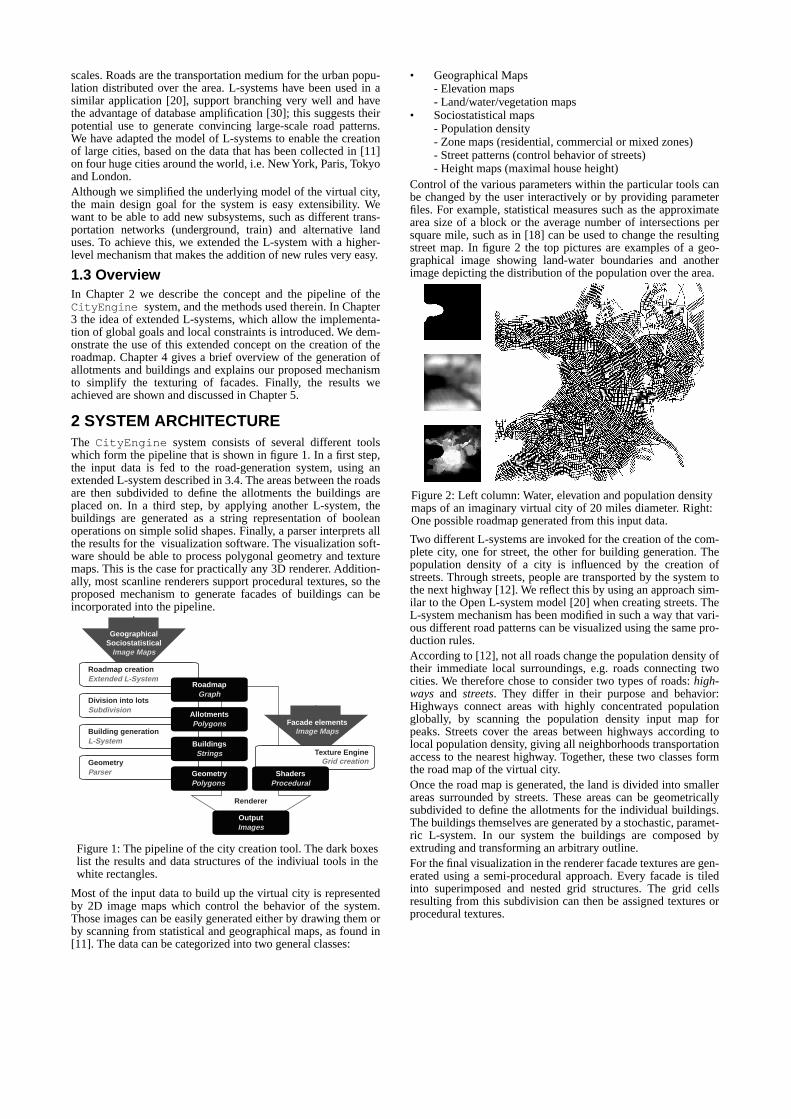
Control of the various parameters within the particular tools canbe changed by the user interactively or by providing parameterfiles. For example, statistical measures such as the approximatearea size of a block or the average number of intersections persquare mile, such as in [18] can be used to change the resultingstreet map. In figure 2 the top pictures are examples of a geo-graphical image showing land-water boundaries and anotherimage depicting the distribution of the population over the area.
Two different L-systems are invoked for the creation of the com-plete city, one for street, the other for building generation. Thepopulation density of a city is influenced by the creation ofstreets. Through streets, people are transported by the system tothe next highway [12]. We reflect this by using an approach sim-ilar to the Open L-system model [20] when creating streets. TheL-system mechanism has been modified in such a way that vari-ous different road patterns can be visualized using the same pro-duction rules. According to [12], not all roads change the population density oftheir immediate local surroundings, e.g. roads connecting twocities. We therefore chose to consider two types of roads:
high-ways
and
streets
. They differ in their purpose and behavior:Highways connect areas with highly concentrated populationglobally, by scanning the population density input map forpeaks. Streets cover the areas between highways according tolocal population density, giving all neighborhoods transportationaccess to the nearest highway. Together, these two classes formthe road map of the virtual city.Once the road map is generated, the land is divided into smallerareas surrounded by streets. These areas can be geometricallysubdivided to define the allotments for the individual buildings.The buildings themselves are generated by a stochastic, paramet-ric L-system. In our system the buildings are composed byextruding and transforming an arbitrary outline.For the final visualization in the renderer facade textures are gen-erated using a semi-procedural approach. Every facade is tiledinto superimposed and nested grid structures. The grid cellsresulting from this subdivision can then be assigned textures orprocedural textures.
GeographicalSociostatistical
Image Maps
Roadmap creationExtended L-System
Division into lotsSubdivision
Building generationL-System
GeometryParser
RoadmapGraph
AllotmentsPolygons
BuildingsStrings
GeometryPolygons
Texture EngineGrid creation
ShadersProcedural
Facade elementsImage Maps
Renderer
OutputImages
Figure 1: The pipeline of the city creation tool. The dark boxeslist the results and data structures of the indiviual tools in thewhite rectangles.
Figure 2: Left column: Water, elevation and population densitymaps of an imaginary virtual city of 20 miles diameter. Right:One possible roadmap generated from this input data.
3 CREATING THE STREET MAP
3.1 Extended L-systems
An L-system is a parallel string rewriting mechanism based on aset of production rules. Each string consists of a number of dif-ferent modules which are interpreted as commands. The parame-ters for these commands are stored within the modules. Whenwriting a complex rule system to create a street map, there are alarge number of parameters and conditions that have to be imple-mented to the L-system. The number of productions and theircomplexity grows very quickly. Every time a new constraint isimplemented, many rules have to be rewritten. This makesextensibility a very difficult task. Thus, instead of trying to setthe parameters of the modules inside the productions, the L-sys-tem creates only a generic template at each step. We call thisgeneric template the
ideal successor
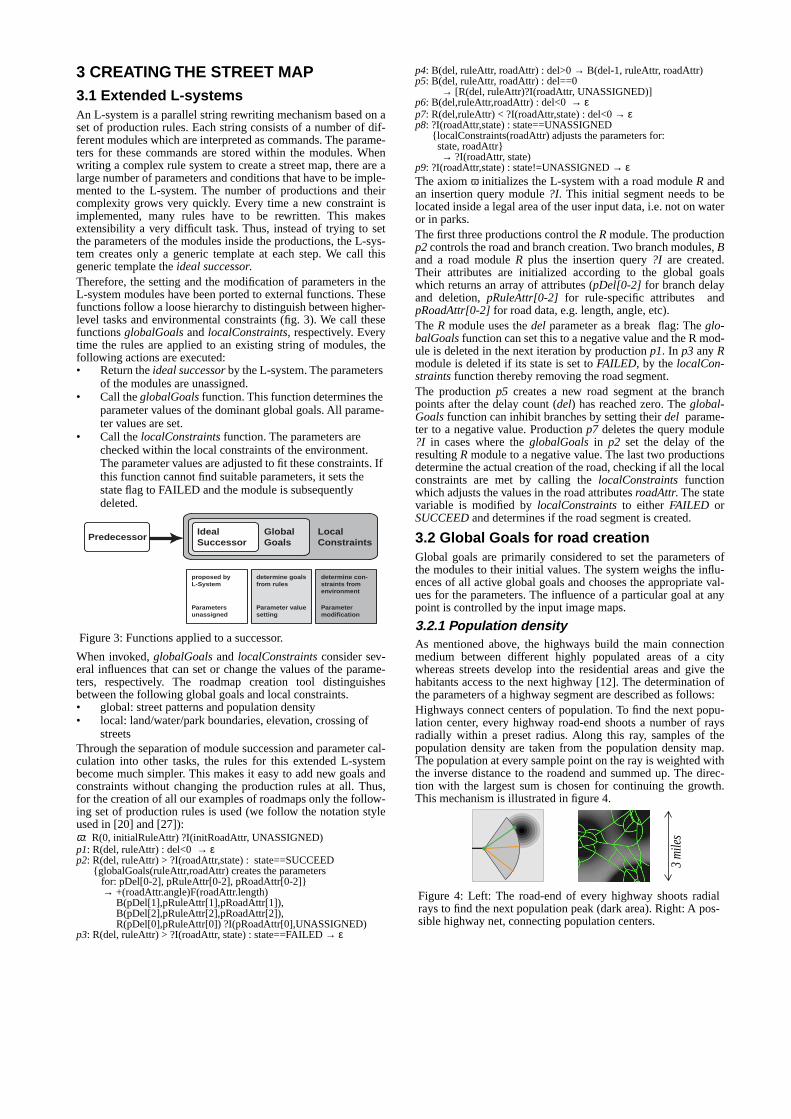
. Therefore, the setting and the modification of parameters in theL-system modules have been ported to external functions. Thesefunctions follow a loose hierarchy to distinguish between higher-level tasks and environmental constraints (fig. 3). We call thesefunctions
globalGoals
and
localConstraints
, respectively. Everytime the rules are applied to an existing string of modules, thefollowing actions are executed:• Return the
ideal successor
by the L-system. The parameters of the modules are unassigned.
• Call the
globalGoals
function. This function determines the parameter values of the dominant global goals. All parame-ter values are set.
• Call the
localConstraints
function. The parameters are checked within the local constraints of the environment. The parameter values are adjusted to fit these constraints. If this function cannot find suitable parameters, it sets the state flag to FAILED and the module is subsequently deleted.
When invoked,
globalGoals
and
localConstraints
consider sev-eral influences that can set or change the values of the parame-ters, respectively. The roadmap creation tool distinguishesbetween the following global goals and local constraints.• global: street patterns and population density• local: land/water/park boundaries, elevation, crossing of
streetsThrough the separation of module succession and parameter cal-culation into other tasks, the rules for this extended L-systembecome much simpler. This makes it easy to add new goals andconstraints without changing the production rules at all. Thus,for the creation of all our examples of roadmaps only the follow-ing set of production rules is used (we follow the notation styleused in [20] and [27]):
ω
: R(0, initialRuleAttr) ?I(initRoadAttr, UNASSIGNED)
p1
: R(del, ruleAttr) : del<0
→ ε
p2
: R(del, ruleAttr) > ?I(roadAttr,state) : state==SUCCEED{globalGoals(ruleAttr,roadAttr) creates the parameters for: pDel[0-2], pRuleAttr[0-2], pRoadAttr[0-2]}
→
+(roadAttr.angle)F(roadAttr.length) B(pDel[1],pRuleAttr[1],pRoadAttr[1]), B(pDel[2],pRuleAttr[2],pRoadAttr[2]), R(pDel[0],pRuleAttr[0]) ?I(pRoadAttr[0],UNASSIGNED)
p3
: R(del, ruleAttr) > ?I(roadAttr, state) : state==FAILED
→ ε
p4
: B(del, ruleAttr, roadAttr) : del>0
→
B(del-1, ruleAttr, roadAttr)
p5
: B(del, ruleAttr, roadAttr) : del==0
→
[R(del, ruleAttr)?I(roadAttr, UNASSIGNED)]
p6
: B(del,ruleAttr,roadAttr) : del<0
→ ε
p7
: R(del,ruleAttr) < ?I(roadAttr,state) : del<0
→ ε
p8
: ?I(roadAttr,state) : state==UNASSIGNED{localConstraints(roadAttr) adjusts the parameters for: state, roadAttr}
→
?I(roadAttr, state)
p9
: ?I(roadAttr,state) : state!=UNASSIGNED
→ ε
The axiom
ω
initializes the L-system with a road module
R
andan insertion query module
?I
. This initial segment needs to belocated inside a legal area of the user input data, i.e. not on wateror in parks. The first three productions control the
R
module. The production
p2
controls the road and branch creation. Two branch modules,
B
and a road module
R
plus the insertion query
?I
are created.Their attributes are initialized according to the global goalswhich returns an array of attributes (
pDel[0-2]
for branch delayand deletion,
pRuleAttr[0-2]
for rule-specific attributes
and
pRoadAttr[0-2]
for road data, e.g. length, angle, etc).The
R
module uses the
del
parameter as a break flag: The
glo-balGoals
function can set this to a negative value and the R mod-ule is deleted in the next iteration by production
p1
. In
p3
any
R
module is deleted if its state is set to
FAILED
, by the
localCon-straints
function thereby removing the road segment. The production
p5
creates a new road segment at the branchpoints after the delay count (
del
) has reached zero. The
global-Goals
function can inhibit branches by setting their
del
parame-ter to a negative value. Production
p7
deletes the query module
?I
in cases where the
globalGoals
in
p2
set the delay of theresulting
R
module to a negative value. The last two productionsdetermine the actual creation of the road, checking if all the localconstraints are met by calling the
localConstraints
functionwhich adjusts the values in the road attributes
roadAttr
. The statevariable is modified by
localConstraints
to either
FAILED
or
SUCCEED
and determines if the road segment is created.
3.2 Global Goals for road creation
Global goals are primarily considered to set the parameters ofthe modules to their initial values. The system weighs the influ-ences of all active global goals and chooses the appropriate val-ues for the parameters. The influence of a particular goal at anypoint is controlled by the input image maps.
3.2.1 Population density
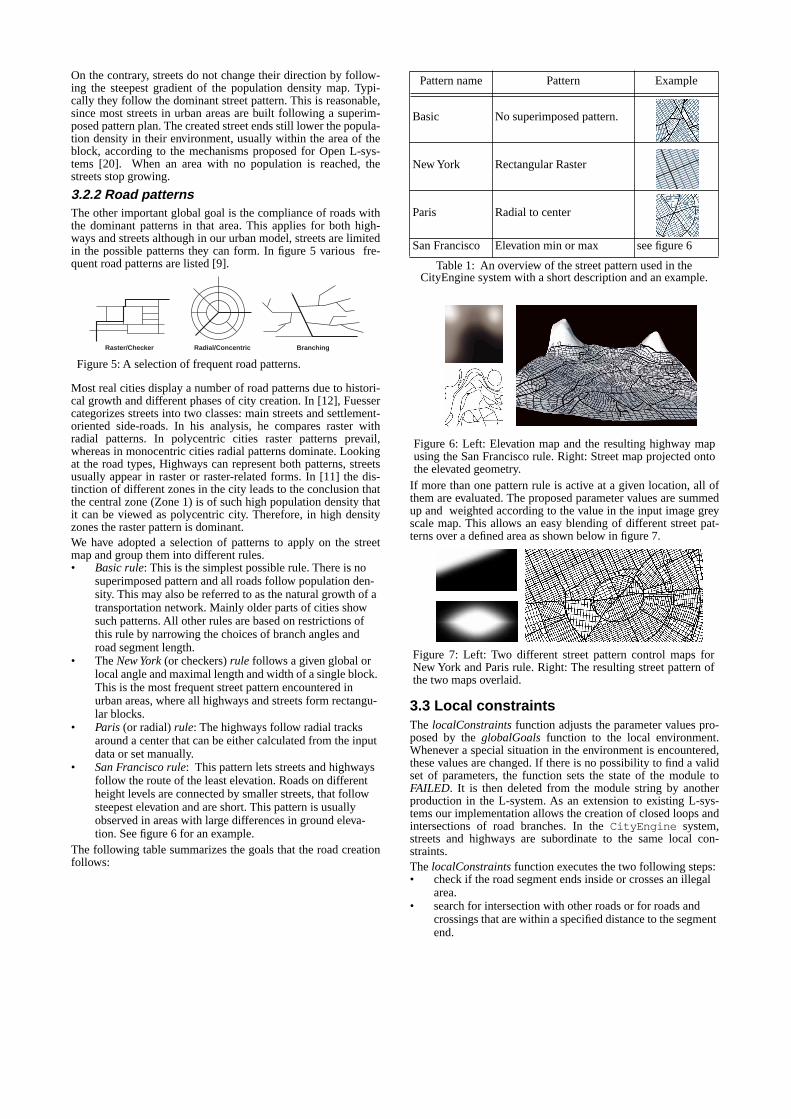
As mentioned above, the highways build the main connectionmedium between different highly populated areas of a citywhereas streets develop into the residential areas and give thehabitants access to the next highway [12]. The determination ofthe parameters of a highway segment are described as follows:Highways connect centers of population. To find the next popu-lation center, every highway road-end shoots a number of raysradially within a preset radius. Along this ray, samples of thepopulation density are taken from the population density map.The population at every sample point on the ray is weighted withthe inverse distance to the roadend and summed up. The direc-tion with the largest sum is chosen for continuing the growth.This mechanism is illustrated in figure 4.
IdealSuccessor
GlobalGoals
LocalConstraints
proposed byL-System
Parametersunassigned
determine goalsfrom rules
Parameter valuesetting
determine con-straints from environment
Parametermodification
Predecessor
Figure 3: Functions applied to a successor.
Figure 4: Left: The road-end of every highway shoots radialrays to find the next population peak (dark area). Right: A pos-sible highway net, connecting population centers.
3 m
iles
On the contrary, streets do not change their direction by follow-ing the steepest gradient of the population density map. Typi-cally they follow the dominant street pattern. This is reasonable,since most streets in urban areas are built following a superim-posed pattern plan. The created street ends still lower the popula-tion density in their environment, usually within the area of theblock, according to the mechanisms proposed for Open L-sys-tems [20]. When an area with no population is reached, thestreets stop growing.
3.2.2 Road patterns
The other important global goal is the compliance of roads withthe dominant patterns in that area. This applies for both high-ways and streets although in our urban model, streets are limitedin the possible patterns they can form. In figure 5 various fre-quent road patterns are listed [9].
Most real cities display a number of road patterns due to histori-cal growth and different phases of city creation. In [12], Fuessercategorizes streets into two classes: main streets and settlement-oriented side-roads. In his analysis, he compares raster withradial patterns. In polycentric cities raster patterns prevail,whereas in monocentric cities radial patterns dominate. Lookingat the road types, Highways can represent both patterns, streetsusually appear in raster or raster-related forms. In [11] the dis-tinction of different zones in the city leads to the conclusion thatthe central zone (Zone 1) is of such high population density thatit can be viewed as polycentric city. Therefore, in high densityzones the raster pattern is dominant. We have adopted a selection of patterns to apply on the streetmap and group them into different rules.•
Basic rule
: This is the simplest possible rule. There is no superimposed pattern and all roads follow population den-sity. This may also be referred to as the natural growth of a transportation network. Mainly older parts of cities show such patterns. All other rules are based on restrictions of this rule by narrowing the choices of branch angles and road segment length.
• The
New York
(or checkers)
rule
follows a given global or local angle and maximal length and width of a single block. This is the most frequent street pattern encountered in urban areas, where all highways and streets form rectangu-lar blocks.
•
Paris
(or radial)
rule
: The highways follow radial tracks around a center that can be either calculated from the input data or set manually.
•
San Francisco rule
: This pattern lets streets and highways follow the route of the least elevation. Roads on different height levels are connected by smaller streets, that follow steepest elevation and are short. This pattern is usually observed in areas with large differences in ground eleva-tion. See figure 6 for an example.
The following table summarizes the goals that the road creationfollows:
If more than one pattern rule is active at a given location, all ofthem are evaluated. The proposed parameter values are summedup and weighted according to the value in the input image greyscale map. This allows an easy blending of different street pat-terns over a defined area as shown below in figure 7.
3.3 Local constraints
The
localConstraints
function
adjusts the parameter values pro-posed by the
globalGoals
function to the local environment.Whenever a special situation in the environment is encountered,these values are changed. If there is no possibility to find a validset of parameters, the function sets the state of the module to
FAILED
. It is then deleted from the module string by anotherproduction in the L-system. As an extension to existing L-sys-tems our implementation allows the creation of closed loops andintersections of road branches. In the
CityEngine
system,streets and highways are subordinate to the same local con-straints.The
localConstraints
function executes the two following steps:• check if the road segment ends inside or crosses an illegal
area.• search for intersection with other roads or for roads and
crossings that are within a specified distance to the segment end.
Raster/Checker Radial/Concentric Branching
Figure 5: A selection of frequent road patterns.
Pattern name Pattern Example
Basic No superimposed pattern.
New York Rectangular Raster
Paris Radial to center
San Francisco Elevation min or max see figure 6
Table 1: An overview of the street pattern used in the CityEngine system with a short description and an example.
Figure 6: Left: Elevation map and the resulting highway mapusing the San Francisco rule. Right: Street map projected ontothe elevated geometry.
Figure 7: Left: Two different street pattern control maps forNew York and Paris rule. Right: The resulting street pattern ofthe two maps overlaid.
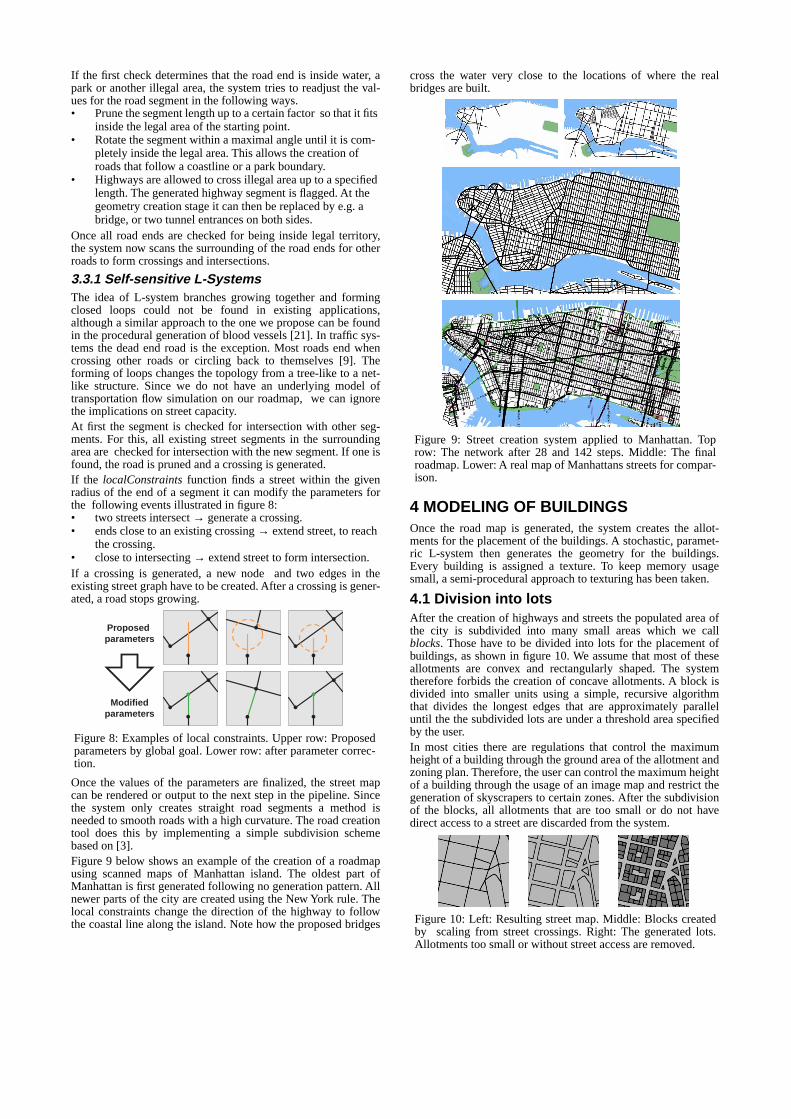
If the first check determines that the road end is inside water, apark or another illegal area, the system tries to readjust the val-ues for the road segment in the following ways.• Prune the segment length up to a certain factor so that it fits
inside the legal area of the starting point.• Rotate the segment within a maximal angle until it is com-
pletely inside the legal area. This allows the creation of roads that follow a coastline or a park boundary.
• Highways are allowed to cross illegal area up to a specified length. The generated highway segment is flagged. At the geometry creation stage it can then be replaced by e.g. a bridge, or two tunnel entrances on both sides.
Once all road ends are checked for being inside legal territory,the system now scans the surrounding of the road ends for otherroads to form crossings and intersections.
3.3.1 Self-sensitive L-Systems
The idea of L-system branches growing together and formingclosed loops could not be found in existing applications,although a similar approach to the one we propose can be foundin the procedural generation of blood vessels [21]. In traffic sys-tems the dead end road is the exception. Most roads end whencrossing other roads or circling back to themselves [9]. Theforming of loops changes the topology from a tree-like to a net-like structure. Since we do not have an underlying model oftransportation flow simulation on our roadmap, we can ignorethe implications on street capacity. At first the segment is checked for intersection with other seg-ments. For this, all existing street segments in the surroundingarea are checked for intersection with the new segment. If one isfound, the road is pruned and a crossing is generated.If the
localConstraints
function finds a street within the givenradius of the end of a segment it can modify the parameters forthe following events illustrated in figure 8:• two streets intersect
→
generate a crossing.• ends close to an existing crossing
→
extend street, to reach the crossing.
• close to intersecting
→
extend street to form intersection.If a crossing is generated, a new node and two edges in theexisting street graph have to be created. After a crossing is gener-ated, a road stops growing.
Once the values of the parameters are finalized, the street mapcan be rendered or output to the next step in the pipeline. Sincethe system only creates straight road segments a method isneeded to smooth roads with a high curvature. The road creationtool does this by implementing a simple subdivision schemebased on [3].Figure 9 below shows an example of the creation of a roadmapusing scanned maps of Manhattan island. The oldest part ofManhattan is first generated following no generation pattern. Allnewer parts of the city are created using the New York rule. Thelocal constraints change the direction of the highway to followthe coastal line along the island. Note how the proposed bridges
cross the water very close to the locations of where the realbridges are built.
4 MODELING OF BUILDINGS
Once the road map is generated, the system creates the allot-ments for the placement of the buildings. A stochastic, paramet-ric L-system then generates the geometry for the buildings.Every building is assigned a texture. To keep memory usagesmall, a semi-procedural approach to texturing has been taken.
4.1 Division into lots
After the creation of highways and streets the populated area ofthe city is subdivided into many small areas which we call
blocks
. Those have to be divided into lots for the placement ofbuildings, as shown in figure 10. We assume that most of theseallotments are convex and rectangularly shaped. The systemtherefore forbids the creation of concave allotments. A block isdivided into smaller units using a simple, recursive algorithmthat divides the longest edges that are approximately paralleluntil the the subdivided lots are under a threshold area specifiedby the user. In most cities there are regulations that control the maximumheight of a building through the ground area of the allotment andzoning plan. Therefore, the user can control the maximum heightof a building through the usage of an image map and restrict thegeneration of skyscrapers to certain zones. After the subdivisionof the blocks, all allotments that are too small or do not havedirect access to a street are discarded from the system.
Figure 8: Examples of local constraints. Upper row: Proposedparameters by global goal. Lower row: after parameter correc-tion.
Proposed parameters
Modifiedparameters
Figure 9: Street creation system applied to Manhattan. Toprow: The network after 28 and 142 steps. Middle: The finalroadmap. Lower: A real map of Manhattans streets for compar-ison.
Figure 10: Left: Resulting street map. Middle: Blocks createdby scaling from street crossings. Right: The generated lots.Allotments too small or without street access are removed.
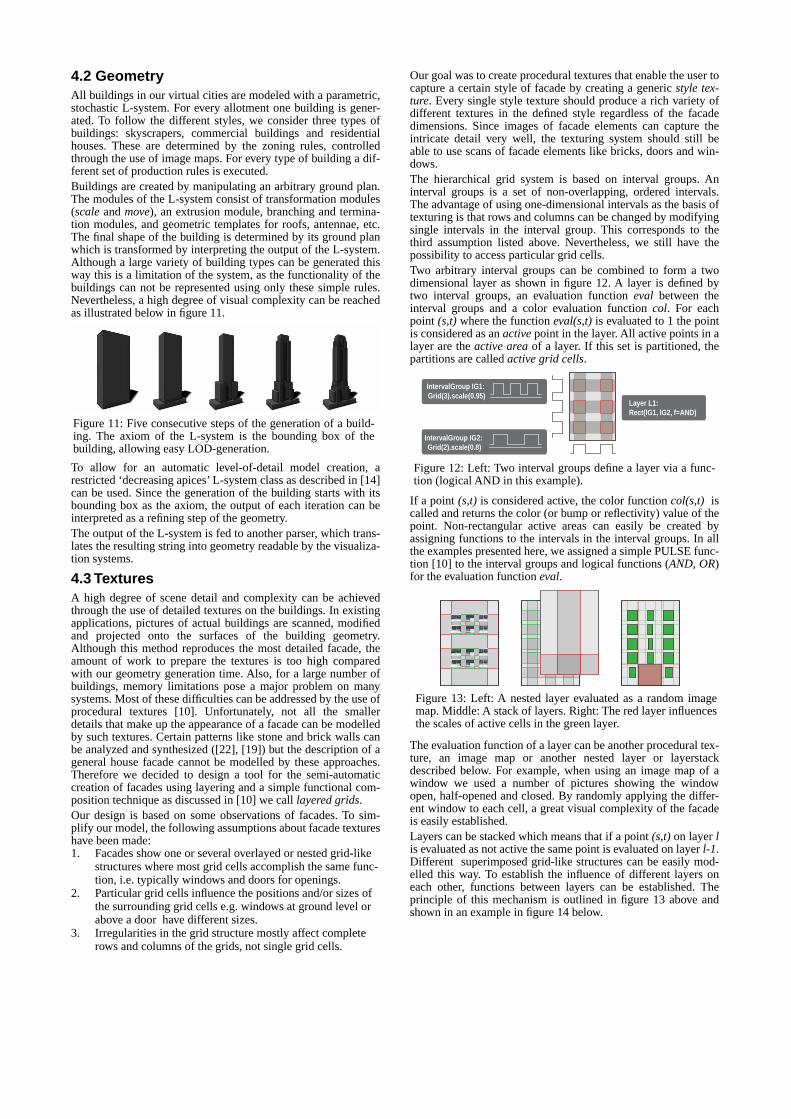
4.2 Geometry
All buildings in our virtual cities are modeled with a parametric,stochastic L-system. For every allotment one building is gener-ated. To follow the different styles, we consider three types ofbuildings: skyscrapers, commercial buildings and residentialhouses. These are determined by the zoning rules, controlledthrough the use of image maps. For every type of building a dif-ferent set of production rules is executed.Buildings are created by manipulating an arbitrary ground plan.The modules of the L-system consist of transformation modules(
scale and move), an extrusion module, branching and termina-tion modules, and geometric templates for roofs, antennae, etc.The final shape of the building is determined by its ground planwhich is transformed by interpreting the output of the L-system.Although a large variety of building types can be generated thisway this is a limitation of the system, as the functionality of thebuildings can not be represented using only these simple rules.Nevertheless, a high degree of visual complexity can be reachedas illustrated below in figure 11.
To allow for an automatic level-of-detail model creation, arestricted ‘decreasing apices’ L-system class as described in [14]can be used. Since the generation of the building starts with itsbounding box as the axiom, the output of each iteration can beinterpreted as a refining step of the geometry. The output of the L-system is fed to another parser, which trans-lates the resulting string into geometry readable by the visualiza-tion systems.
4.3 TexturesA high degree of scene detail and complexity can be achievedthrough the use of detailed textures on the buildings. In existingapplications, pictures of actual buildings are scanned, modifiedand projected onto the surfaces of the building geometry.Although this method reproduces the most detailed facade, theamount of work to prepare the textures is too high comparedwith our geometry generation time. Also, for a large number ofbuildings, memory limitations pose a major problem on manysystems. Most of these difficulties can be addressed by the use ofprocedural textures [10]. Unfortunately, not all the smallerdetails that make up the appearance of a facade can be modelledby such textures. Certain patterns like stone and brick walls canbe analyzed and synthesized ([22], [19]) but the description of ageneral house facade cannot be modelled by these approaches.Therefore we decided to design a tool for the semi-automaticcreation of facades using layering and a simple functional com-position technique as discussed in [10] we call layered grids.Our design is based on some observations of facades. To sim-plify our model, the following assumptions about facade textureshave been made:1. Facades show one or several overlayed or nested grid-like
structures where most grid cells accomplish the same func-tion, i.e. typically windows and doors for openings.
2. Particular grid cells influence the positions and/or sizes of the surrounding grid cells e.g. windows at ground level or above a door have different sizes.
3. Irregularities in the grid structure mostly affect complete rows and columns of the grids, not single grid cells.
Our goal was to create procedural textures that enable the user tocapture a certain style of facade by creating a generic style tex-ture. Every single style texture should produce a rich variety ofdifferent textures in the defined style regardless of the facadedimensions. Since images of facade elements can capture theintricate detail very well, the texturing system should still beable to use scans of facade elements like bricks, doors and win-dows.The hierarchical grid system is based on interval groups. Aninterval groups is a set of non-overlapping, ordered intervals.The advantage of using one-dimensional intervals as the basis oftexturing is that rows and columns can be changed by modifyingsingle intervals in the interval group. This corresponds to thethird assumption listed above. Nevertheless, we still have thepossibility to access particular grid cells.Two arbitrary interval groups can be combined to form a twodimensional layer as shown in figure 12. A layer is defined bytwo interval groups, an evaluation function eval between theinterval groups and a color evaluation function col. For eachpoint (s,t) where the function eval(s,t) is evaluated to 1 the pointis considered as an active point in the layer. All active points in alayer are the active area of a layer. If this set is partitioned, thepartitions are called active grid cells.
If a point (s,t) is considered active, the color function col(s,t) iscalled and returns the color (or bump or reflectivity) value of thepoint. Non-rectangular active areas can easily be created byassigning functions to the intervals in the interval groups. In allthe examples presented here, we assigned a simple PULSE func-tion [10] to the interval groups and logical functions (AND, OR)for the evaluation function eval.
The evaluation function of a layer can be another procedural tex-ture, an image map or another nested layer or layerstackdescribed below. For example, when using an image map of awindow we used a number of pictures showing the windowopen, half-opened and closed. By randomly applying the differ-ent window to each cell, a great visual complexity of the facadeis easily established.Layers can be stacked which means that if a point (s,t) on layer lis evaluated as not active the same point is evaluated on layer l-1.Different superimposed grid-like structures can be easily mod-elled this way. To establish the influence of different layers oneach other, functions between layers can be established. Theprinciple of this mechanism is outlined in figure 13 above andshown in an example in figure 14 below.
Figure 11: Five consecutive steps of the generation of a build-ing. The axiom of the L-system is the bounding box of thebuilding, allowing easy LOD-generation.
IntervalGroup IG2: Grid(2).scale(0.8)
IntervalGroup IG1: Grid(3).scale(0.95)
Layer L1:Rect(IG1, IG2, f=AND)
Figure 12: Left: Two interval groups define a layer via a func-tion (logical AND in this example).
Figure 13: Left: A nested layer evaluated as a random imagemap. Middle: A stack of layers. Right: The red layer influencesthe scales of active cells in the green layer.
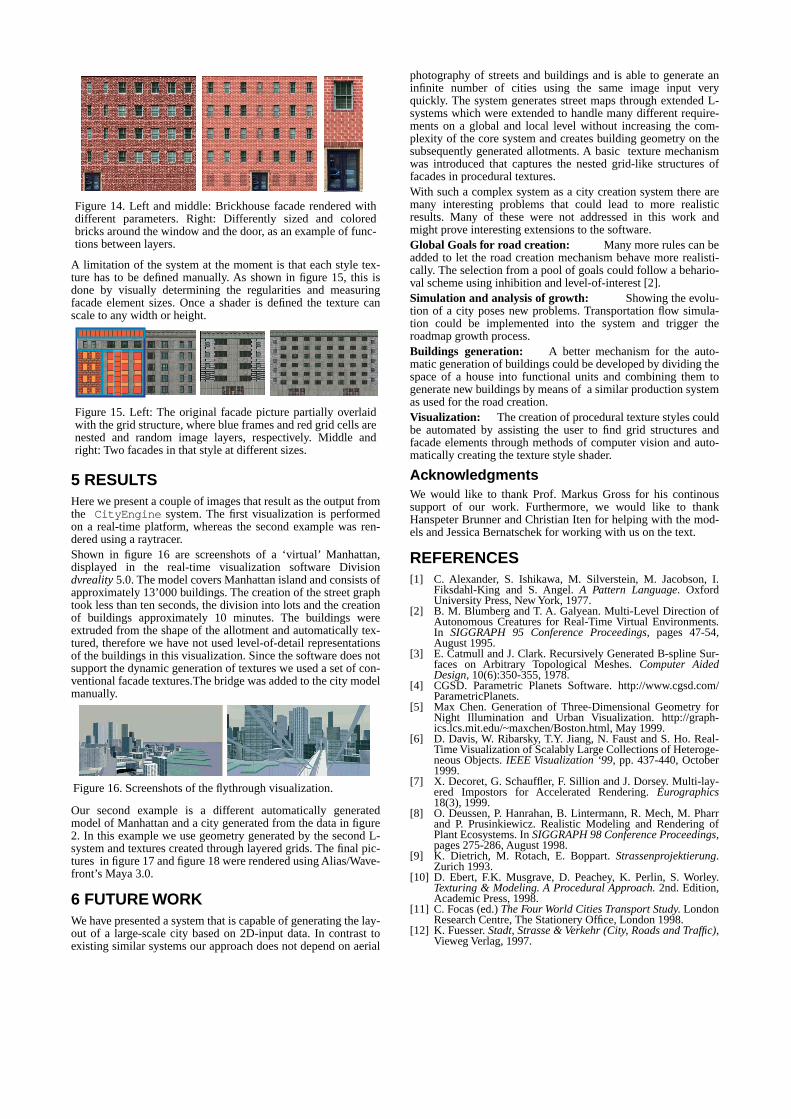
A limitation of the system at the moment is that each style tex-ture has to be defined manually. As shown in figure 15, this isdone by visually determining the regularities and measuringfacade element sizes. Once a shader is defined the texture canscale to any width or height.
5 RESULTSHere we present a couple of images that result as the output fromthe CityEngine system. The first visualization is performedon a real-time platform, whereas the second example was ren-dered using a raytracer.Shown in figure 16 are screenshots of a ‘virtual’ Manhattan,displayed in the real-time visualization software Divisiondvreality 5.0. The model covers Manhattan island and consists ofapproximately 13’000 buildings. The creation of the street graphtook less than ten seconds, the division into lots and the creationof buildings approximately 10 minutes. The buildings wereextruded from the shape of the allotment and automatically tex-tured, therefore we have not used level-of-detail representationsof the buildings in this visualization. Since the software does notsupport the dynamic generation of textures we used a set of con-ventional facade textures.The bridge was added to the city modelmanually.
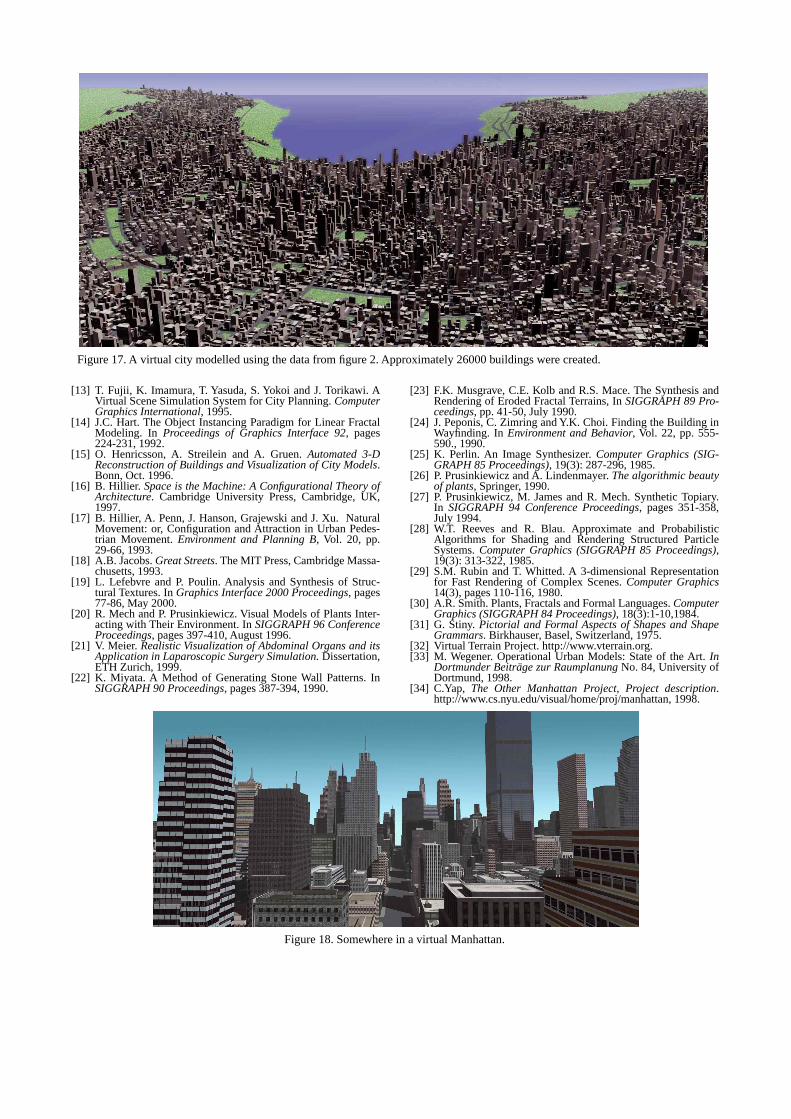
Our second example is a different automatically generatedmodel of Manhattan and a city generated from the data in figure2. In this example we use geometry generated by the second L-system and textures created through layered grids. The final pic-tures in figure 17 and figure 18 were rendered using Alias/Wave-front’s Maya 3.0.
6 FUTURE WORKWe have presented a system that is capable of generating the lay-out of a large-scale city based on 2D-input data. In contrast toexisting similar systems our approach does not depend on aerial
photography of streets and buildings and is able to generate aninfinite number of cities using the same image input veryquickly. The system generates street maps through extended L-systems which were extended to handle many different require-ments on a global and local level without increasing the com-plexity of the core system and creates building geometry on thesubsequently generated allotments. A basic texture mechanismwas introduced that captures the nested grid-like structures offacades in procedural textures.With such a complex system as a city creation system there aremany interesting problems that could lead to more realisticresults. Many of these were not addressed in this work andmight prove interesting extensions to the software.Global Goals for road creation: Many more rules can beadded to let the road creation mechanism behave more realisti-cally. The selection from a pool of goals could follow a behario-val scheme using inhibition and level-of-interest [2].Simulation and analysis of growth: Showing the evolu-tion of a city poses new problems. Transportation flow simula-tion could be implemented into the system and trigger theroadmap growth process.Buildings generation: A better mechanism for the auto-matic generation of buildings could be developed by dividing thespace of a house into functional units and combining them togenerate new buildings by means of a similar production systemas used for the road creation.Visualization: The creation of procedural texture styles couldbe automated by assisting the user to find grid structures andfacade elements through methods of computer vision and auto-matically creating the texture style shader.
AcknowledgmentsWe would like to thank Prof. Markus Gross for his continoussupport of our work. Furthermore, we would like to thankHanspeter Brunner and Christian Iten for helping with the mod-els and Jessica Bernatschek for working with us on the text.
REFERENCES[1] C. Alexander, S. Ishikawa, M. Silverstein, M. Jacobson, I.
Fiksdahl-King and S. Angel. A Pattern Language. OxfordUniversity Press, New York, 1977.
[2] B. M. Blumberg and T. A. Galyean. Multi-Level Direction ofAutonomous Creatures for Real-Time Virtual Environments.In SIGGRAPH 95 Conference Proceedings, pages 47-54,August 1995.
[3] E. Catmull and J. Clark. Recursively Generated B-spline Sur-faces on Arbitrary Topological Meshes. Computer AidedDesign, 10(6):350-355, 1978.
[4] CGSD. Parametric Planets Software. http://www.cgsd.com/ParametricPlanets.
[5] Max Chen. Generation of Three-Dimensional Geometry forNight Illumination and Urban Visualization. http://graph-ics.lcs.mit.edu/~maxchen/Boston.html, May 1999.
[6] D. Davis, W. Ribarsky, T.Y. Jiang, N. Faust and S. Ho. Real-Time Visualization of Scalably Large Collections of Heteroge-neous Objects. IEEE Visualization ‘99, pp. 437-440, October1999.
[7] X. Decoret, G. Schauffler, F. Sillion and J. Dorsey. Multi-lay-ered Impostors for Accelerated Rendering. Eurographics18(3), 1999.
[8] O. Deussen, P. Hanrahan, B. Lintermann, R. Mech, M. Pharrand P. Prusinkiewicz. Realistic Modeling and Rendering ofPlant Ecosystems. In SIGGRAPH 98 Conference Proceedings,pages 275-286, August 1998.
[9] K. Dietrich, M. Rotach, E. Boppart. Strassenprojektierung.Zurich 1993.
[10] D. Ebert, F.K. Musgrave, D. Peachey, K. Perlin, S. Worley.Texturing & Modeling. A Procedural Approach. 2nd. Edition,Academic Press, 1998.
[11] C. Focas (ed.) The Four World Cities Transport Study. LondonResearch Centre, The Stationery Office, London 1998.
[12] K. Fuesser. Stadt, Strasse & Verkehr (City, Roads and Traffic),Vieweg Verlag, 1997.
Figure 14. Left and middle: Brickhouse facade rendered withdifferent parameters. Right: Differently sized and coloredbricks around the window and the door, as an example of func-tions between layers.
Figure 15. Left: The original facade picture partially overlaidwith the grid structure, where blue frames and red grid cells arenested and random image layers, respectively. Middle andright: Two facades in that style at different sizes.
Figure 16. Screenshots of the flythrough visualization.
[13] T. Fujii, K. Imamura, T. Yasuda, S. Yokoi and J. Torikawi. AVirtual Scene Simulation System for City Planning. ComputerGraphics International, 1995.
[14] J.C. Hart. The Object Instancing Paradigm for Linear FractalModeling. In Proceedings of Graphics Interface 92, pages224-231, 1992.
[15] O. Henricsson, A. Streilein and A. Gruen. Automated 3-DReconstruction of Buildings and Visualization of City Models.Bonn, Oct. 1996.
[16] B. Hillier. Space is the Machine: A Configurational Theory ofArchitecture. Cambridge University Press, Cambridge, UK,1997.
[17] B. Hillier, A. Penn, J. Hanson, Grajewski and J. Xu. NaturalMovement: or, Configuration and Attraction in Urban Pedes-trian Movement. Environment and Planning B, Vol. 20, pp.29-66, 1993.
[18] A.B. Jacobs. Great Streets. The MIT Press, Cambridge Massa-chusetts, 1993.
[19] L. Lefebvre and P. Poulin. Analysis and Synthesis of Struc-tural Textures. In Graphics Interface 2000 Proceedings, pages77-86, May 2000.
[20] R. Mech and P. Prusinkiewicz. Visual Models of Plants Inter-acting with Their Environment. In SIGGRAPH 96 ConferenceProceedings, pages 397-410, August 1996.
[21] V. Meier. Realistic Visualization of Abdominal Organs and itsApplication in Laparoscopic Surgery Simulation. Dissertation,ETH Zurich, 1999.
[22] K. Miyata. A Method of Generating Stone Wall Patterns. InSIGGRAPH 90 Proceedings, pages 387-394, 1990.
[23] F.K. Musgrave, C.E. Kolb and R.S. Mace. The Synthesis andRendering of Eroded Fractal Terrains, In SIGGRAPH 89 Pro-ceedings, pp. 41-50, July 1990.
[24] J. Peponis, C. Zimring and Y.K. Choi. Finding the Building inWayfinding. In Environment and Behavior, Vol. 22, pp. 555-590., 1990.
[25] K. Perlin. An Image Synthesizer. Computer Graphics (SIG-GRAPH 85 Proceedings), 19(3): 287-296, 1985.
[26] P. Prusinkiewicz and A. Lindenmayer. The algorithmic beautyof plants, Springer, 1990.
[27] P. Prusinkiewicz, M. James and R. Mech. Synthetic Topiary.In SIGGRAPH 94 Conference Proceedings, pages 351-358,July 1994.
[28] W.T. Reeves and R. Blau. Approximate and ProbabilisticAlgorithms for Shading and Rendering Structured ParticleSystems. Computer Graphics (SIGGRAPH 85 Proceedings),19(3): 313-322, 1985.
[29] S.M. Rubin and T. Whitted. A 3-dimensional Representationfor Fast Rendering of Complex Scenes. Computer Graphics14(3), pages 110-116, 1980.
[30] A.R. Smith. Plants, Fractals and Formal Languages. ComputerGraphics (SIGGRAPH 84 Proceedings), 18(3):1-10,1984.
[31] G. Stiny. Pictorial and Formal Aspects of Shapes and ShapeGrammars. Birkhauser, Basel, Switzerland, 1975.
[32] Virtual Terrain Project. http://www.vterrain.org.[33] M. Wegener. Operational Urban Models: State of the Art. In
Dortmunder Beiträge zur Raumplanung No. 84, University ofDortmund, 1998.
[34] C.Yap, The Other Manhattan Project, Project description.http://www.cs.nyu.edu/visual/home/proj/manhattan, 1998.
Figure 18. Somewhere in a virtual Manhattan.
Figure 17. A virtual city modelled using the data from figure 2. Approximately 26000 buildings were created.