probe manufacturing, inc
TRANSCRIPT
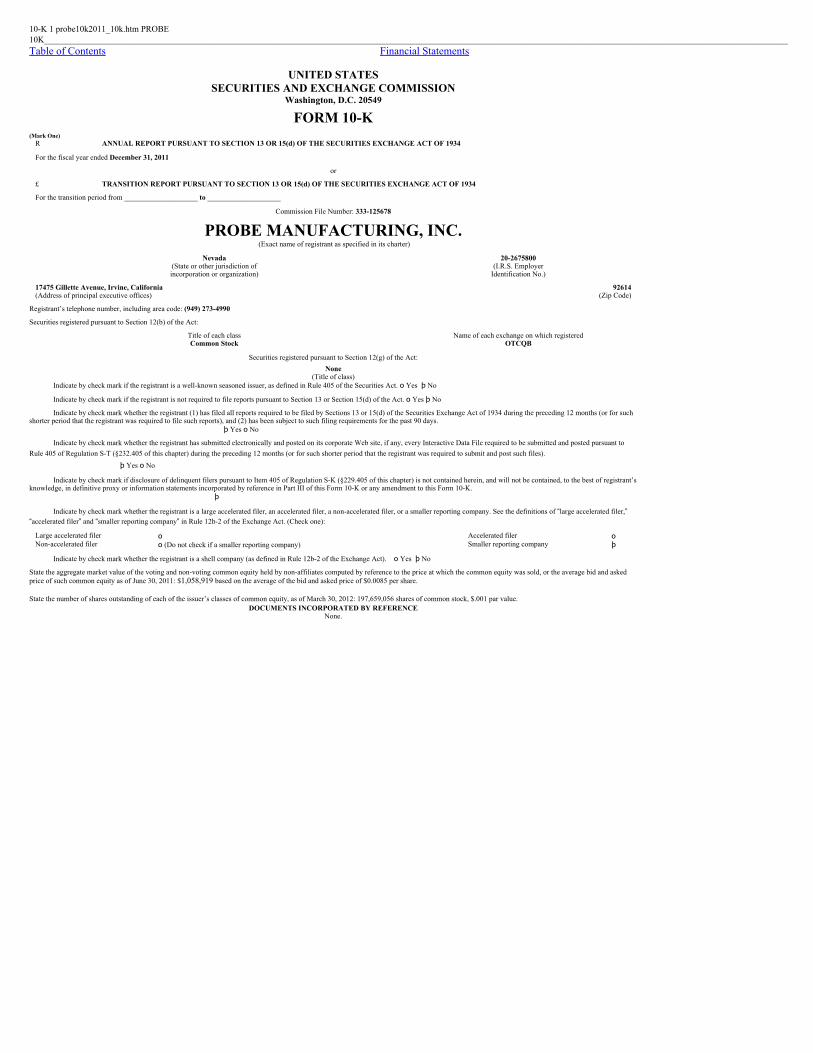
Table of Contents
10-K 1 probe10k2011_10k.htm PROBE10K____________________________________________________________________________________________________________________________________________________________________________
Financial Statements
UNITED STATESSECURITIES AND EXCHANGE COMMISSION
Washington, D.C. 20549
FORM 10-K (Mark One)
R ANNUAL REPORT PURSUANT TO SECTION 13 OR 15(d) OF THE SECURITIES EXCHANGE ACT OF 1934
For the fiscal year ended December 31, 2011
or
£ TRANSITION REPORT PURSUANT TO SECTION 13 OR 15(d) OF THE SECURITIES EXCHANGE ACT OF 1934
For the transition period from ____________________ to ____________________
Commission File Number: 333-125678
PROBE MANUFACTURING, INC. (Exact name of registrant as specified in its charter)
Nevada 20-2675800
(State or other jurisdiction ofincorporation or organization)
(I.R.S. EmployerIdentification No.)
17475 Gillette Avenue, Irvine, California 92614(Address of principal executive offices) (Zip Code)
Registrant’s telephone number, including area code: (949) 273-4990
Securities registered pursuant to Section 12(b) of the Act:
Title of each class Name of each exchange on which registeredCommon Stock OTCQB
Securities registered pursuant to Section 12(g) of the Act:
None(Title of class)
Indicate by check mark if the registrant is a well-known seasoned issuer, as defined in Rule 405 of the Securities Act. o Yes þ No
Indicate by check mark if the registrant is not required to file reports pursuant to Section 13 or Section 15(d) of the Act. o Yes þ No
Indicate by check mark whether the registrant (1) has filed all reports required to be filed by Sections 13 or 15(d) of the Securities Exchange Act of 1934 during the preceding 12 months (or for suchshorter period that the registrant was required to file such reports), and (2) has been subject to such filing requirements for the past 90 days. þ Yes o No
Indicate by check mark whether the registrant has submitted electronically and posted on its corporate Web site, if any, every Interactive Data File required to be submitted and posted pursuant toRule 405 of Regulation S-T (§232.405 of this chapter) during the preceding 12 months (or for such shorter period that the registrant was required to submit and post such files). þ Yes o No
Indicate by check mark if disclosure of delinquent filers pursuant to Item 405 of Regulation S-K (§229.405 of this chapter) is not contained herein, and will not be contained, to the best of registrant’sknowledge, in definitive proxy or information statements incorporated by reference in Part III of this Form 10-K or any amendment to this Form 10-K. þ
Indicate by check mark whether the registrant is a large accelerated filer, an accelerated filer, a non-accelerated filer, or a smaller reporting company. See the definitions of �large accelerated filer,��accelerated filer� and �smaller reporting company� in Rule 12b-2 of the Exchange Act. (Check one):
Large accelerated filer o Accelerated filer oNon-accelerated filer o (Do not check if a smaller reporting company) Smaller reporting company þ
Indicate by check mark whether the registrant is a shell company (as defined in Rule 12b-2 of the Exchange Act). o Yes þ No
State the aggregate market value of the voting and non-voting common equity held by non-affiliates computed by reference to the price at which the common equity was sold, or the average bid and askedprice of such common equity as of June 30, 2011: $1,058,919 based on the average of the bid and asked price of $0.0085 per share. State the number of shares outstanding of each of the issuer’s classes of common equity, as of March 30, 2012: 197,659,056 shares of common stock, $.001 par value.
DOCUMENTS INCORPORATED BY REFERENCENone.

Table of Contents Financial Statements
PROBE MANUFACTURING, INC.10-K
TABLE OF CONTENTS
Part I
PageItem 1. Business 4Item 1A. Risk Factors 9Item 1B. Unresolved Staff Comments 15Item 2. Properties 15Item 3. Legal Proceedings 15Item 4. [Removed and Reserved] 15
Part II
Item 5. Market for Registrant’s Common Equity, related Shareholder Matters and Issuer Purchases ofEquity Securities 16
Item 6. Selected Financial Data 18Item 7. Managements Discussion and Analysis of Financial Condition and Results of Operation 19Item 7A. Quantitative and Qualitative Disclosure about Market Risk 28Item 8. Financial Statements and Supplementary Data 29Item 9. Changes and Disagreements with Accountants on Accounting and Financial Disclosure 58Item 9A Controls and Procedures 58Item 9B Other Information 59
Part IIIItem 10 Directors, Executive Officers and Corporate Governance 59Item 11 Executive Compensation 59
Item 12 Security Ownership of Certain Beneficial Owners, management and Related StockholderMatters
59
Item 13 Certain Relationships and Related Transactions and Director Independence 59Item 14 Principal Accounting Fees and Services 59Item 15 Exhibits 59 Signatures 61

Table of Contents Financial Statements
PART I
Item 1. Business. Our Company Probe Manufacturing Industries, Inc. was incorporated on July 7, 1995. On April 21, 2005, the Company was re-domiciled from California to Nevada, and changed its name toProbe Manufacturing, Inc. (the “Company,” “Probe,” or “PMI”) We provide global design and manufacturing services to original electronic equipment manufacturers fromour 23000 sq-ft facility in Irvine, California and strategic locations worldwide. Our revenue is generated from sales of our services primarily to customers in the medicaldevice, aerospace, automotive, industrial and instrumentation product manufacturers. We provide our domestic customers with low cost, low risk, flexible and high qualitymanufacturing services. We utilize global partnerships to secure the best cost and materials available by providing our customers with onshore, scalable manufacturingsolutions. The services that we provide are commonly referred to as Electronics Manufacturing Services (EMS). Our EMS offerings include new product introduction,collaborative design, procurement and materials management, product manufacturing, product warranty repair, and end-of-life support. We offer our customerscomprehensive and integrated design and manufacturing services, from initial product design to production and direct order fulfillment. Our engineering services includeproduct design, printed circuit board layout, prototyping, and test development. Our supply chain management solutions include purchasing, management of materials, andorder fulfillment. Our manufacturing services include surface mount and through-hole assembly, cable assembly, mechanical assembly, and fully integrated box build systemsfor high complexity electronics. The majority of our revenue is driven from manufacturing a mix of complex printed circuit board assemblies (PCBA), and box build assemblies. Some examples of ourcustomer’s finished goods products includes medical devices such as, electronic control units that help vehicles run on natural gas or hydrogen, electronic control units forlaser welding equipment, control units for electric-hybrid drives, portable ultrasound and electro-stimulation therapy equipment, PCB’s for landing gear systems and flapcontrollers, fluid control units for airliners, and devices for defense industry. Our strategy is to build and pursue global opportunities leveraging core competencies and to expand our manufacturing foundry platform for innovative start-ups in return formanufacturing rights and equity. As innovation, cost, and time to market become hyper competitive, domestic OEM’s are now compelled to use EMS partners with easy onshore access, providing localprogram management during product conceptualization, development, and integration. Many of the mid-tier OEMs in industries such as military/aerospace, medical,industrial/instrumentation, and green-tech products tend to be too small for $1 billion-plus revenue EMS companies. Most of these OEMs value close proximity and the abilityto provide complex manufacturing and personal customer service, which often favors regional providers that truly value and foster their relationships. Furthermore, with the recent cost increases in labor, currency movements and freight concerns, the ability to also provide near-shore manufacturing is expected to generateincreased interest. The low to medium EMS market compared to high volume has proved to be a higher margin with higher gross profits and sustained growth momentum.Our target accounts are mid-tier, U.S. based OEMs with annual sales from $15 million to $500 million. We believe that the combination of: (i) our management expertise; (ii) low overhead and cost structure; (iii) sophisticated management system developed internally to overseeoperational systems; (iv) high technology onshore and managed offshore manufacturing; and (v) global relationships and domestic customer centric program managementteam, PMI is well positioned to take advantage of the projected increase in outsourced onshore manufacturing.
Plan of Operation
Management is taking the following steps to sustain profitability and growth: (i) To build and pursue global opportunities leveraging core competencies; (ii) organic growth,new sales and expansion of services along the supply chain line; (iii) manufacturing rights and equity through our manufacturing foundry platform; (iv) expansion ofcapabilities and competencies through mergers & acquisitions providing scale, cost synergies and revenue opportunities.

Table of Contents Financial Statements
Our future success is likely dependent on our ability to sustain profitable growth and attain additional capital to support growth. There can be no assurance that we will besuccessful in obtaining any such financing, or that it will be able to generate sufficient positive cash flow from operations. The successful outcome of these or any futureactivities cannot be determined at this time and there is no assurance that if achieved, we will have sufficient funds to execute its business plans. The financial statements donot include any adjustments relating to the recoverability and classification of asset carrying amounts or the amount and classification of liabilities that might result should webe unable to continue as a going concern. Our Products and Services Engineering. Our global engineering team supports technology customers and innovative start-ups with a broad range of electrical, mechanical and software engineeringservices. PMI has assembled a team of experts from around the globe to assist customers at any point in the design cycle. These services include design processes fromelectrical, software, mechanical, Industrial and PCB design. Utilization of PMI’s design services will enable rapid market entry for our customers. It provides flexibility bybecoming the extension of their engineering and allowing customers to focus on their business strategy.
Supply Chain Management. PMI’s supply chain solution provides maximum flexibility and responsiveness through a collaborative and strategic approach with our customers.PMI can assume supply chain responsibility from component sourcing through delivery of finished product. PMI’s supply chain focus is on building internal and externalsystems and relationships, which allow us to capitalize on our expertise to align with our customer’s objectives and integrate with their processes today and in the future.
Manufacturing. Flexibility, responsiveness, communication, global supply chain management and speed are key values in what we offer our customers. We establish clearcommunication about our customer needs and requirements enabling a seamless integration with their objectives and processes. PMI’s manufacturing capability supports highand low-mix assemblies for prototypes, to medium-volume quantities in California and high-volume production in Asia. Our manufacturing operations include printed circuitboard assembly and testing; cable and harness assembly; mechanical assembly; and complex system integration. Sales and Marketing Our marketing approach is to position PMI as a domestic US based electronics manufacturing company providing low cost, low risk, and flexible manufacturing solutions tocustomers by providing product development and manufacturing services through our factory in U.S. as well as factories worldwide. The Majority of our clients are in the Aerospace, Industrial, Instrumentation, Medical and Automotive Industries. However our product development division works withclients in many other areas such as telecommunication, commercial, consumer, entertainment and energy products. We utilize both direct sales force and sales representativeswith expertise in supply chain management and manufacturing services. We have also expanded our services along the supply chain line to cable and harness, sheet metal,PCB fabrication and plastics in order to support organic growth by cross selling and identifying new opportunities with prospect customers. In order to support our manufacturing foundry vision we’re targeting innovators and start ups through investment communities by offering investment opportunities in theirproducts and in return obtaining manufacturing rights and exclusivity. This strategy can support scale as the products can have very high potential in telecomm, consumer,energy and commercial markets. Once the relationships are established, programs are managed through our customer centric program management teams.We support our clients through early supplier involvement, which results in improved return on investment.Program Managers are responsible for managing the global supply chain, reducing material acquisition time and cost. They’re also responsible for the profitability of theprograms and ultimately the customer satisfaction index, including on-time delivery, quality, communication and technology. We sustain and grow our relationships by continuous delivery of high quality parts, on time and at the lowest possible cost.
Table of Contents Financial Statements
Competition The EMS industry is large, competitive and diverse, and is serviced by many companies, including several that have achieved significant market share; we compete withnumerous domestic and foreign EMS firms. We do not compete with first tier EMS companies such as Benchmark Electronics, Inc.; Celestica Inc; Flextronics InternationalLtd.; Foxconn; Jabil Circuit, Inc.; Plexus Corp.; Sanmina-SCI Corporation. CTS Electronics. We mostly compete with second and third tier EMS companies, whereby wecompete with different companies depending on the type of service and/or geographic area. Competitive Positioning Probe’s competitive advantage is in its ability to provide domestic clients with global electronic design, manufacturing and business services versus its domestic rivals offeringonly local manufacturing services. This advantage enables PMI to offer its customers the best of both worlds with low risk, low cost, flexible, and high quality manufacturingservices. Probe’s internally developed management systems provide for an efficient and robust operation and a much lower cost compared to its competitors. Probe’shorizontal growth of supply chain services and utilization of global suppliers has also created a turn-key, cost competitive solution for its customers. In addition, Probe’s newproduct introduction services that provide scalability and cost reductions are creating the foundation for the company’s manufacturing foundry for innovative start-ups. Strategy Our strategy is to pursue and build global opportunities by leveraging core competency and to create a manufacturing foundry for innovative start-ups in return formanufacturing rights and equity. We are also planning the expansion of our capabilities and competencies through mergers & acquisitions. The rational behind this strategy isto provide scale, cost synergies, revenue opportunities and a larger domestic footprint. Personnel We presently have approximately 38 employees, including production, program management, materials management, engineering, sales, quality, and administrative andmanagement personnel. We have never experienced work stoppages, and are not a party to any collective bargaining agreement. Regulatory Restrictions on Our Business Our operations, and the operations of businesses that we may acquire, are subject to certain foreign, federal, state and local regulatory requirements relating to environmental,waste management, and health and safety matters. We believe we operate in substantial compliance with all applicable requirements. However, material costs and liabilitiesmay arise from these requirements or from new, modified or more stringent requirements. Material cost may rise due to additional manufacturing cost of raw or made partswith the application of new regulations. Our liabilities may also increase due to additional regulations imposed by foreign, federal, state and local regulatory requirementsrelating to environmental, waste management, and health and safety matters. In addition, our past, current and future operations and those of businesses we acquire, may giverise to claims of exposure by employees or the public or to other claims or liabilities relating to environmental, waste management or health and safety concerns. Item 1a. Risk Factors. RISKS ABOUT OUR BUSINESS OUR INDEPENDENT ACCOUNTANTS HAVE ISSUED A GOING CONCERN OPINION AND IF WE CANNOT OBTAIN ADDITIONAL FINANCINGAND/OR REDUCE OUR OPERATING COSTS SUFFICIENTLY, WE MAY HAVE TO CURTAIL OPERATIONS AND MAY ULTIMATELY CEASE TOEXIST. The financial statements have been prepared on a going concern basis, which contemplates continuity of operations, realization of assets and liquidation of liabilities in thenormal course of business. The Company had a net profit of $90,940; total stockholder’s equity of $338,046; and a working capital surplus of $170,245; however, we still hadan accumulated deficit of $238,483 as of December 31, 2011 and used $378,117 in net cash from operations for the year ended December 31, 2011. Therefore, the ability ofthe Company to operate as a going concern is still dependent upon its ability (1) to obtain

Table of Contents Financial Statements
sufficient debt and/or equity capital and/or (2) to generate positive cash flow from operations. On February 18, 2011 we entered into an Accounts Receivable PurchasingAgreement (the “ARPA”) with DSCH Capital Partners, LLC d/b/a Far West Capital (“FWC”), an unaffiliated third party. Pursuant to the ARPA, FWC may purchase, in itssole discretion, eligible accounts receivable of our company on a revolving basis up to a maximum of $750,000. Under the terms of the ARPA, FWC may purchase eligiblereceivables from us with full recourse for the face amount of such eligible receivables less a discount of 1.0%. In addition, we are required to pay FWC a monthly cost offunds fee equal to the net funds employed by FWC at a rate equal to the Wall Street Journal Prime Lending Rate plus 4.75%, with a floor of 7.00%. FWC will retain 20% ofthe purchase price of the receivables as a reserve amount.
The ARPA also provides that FWC has the right to require us to repurchase any purchased accounts receivable: (a) if there is a dispute as to the validity of such receivable bythe account debtor, (b) if certain covenants, warranties or representations made by us with respect to such receivables are breached, (c) upon and during the continuance of anevent of default under the ARPA or upon the termination of the ARPA, or (d) if such receivable remains unpaid 90 days after the invoice date. The ARPA has an initial termof one year with automatic renewals for successive one-year periods. Notwithstanding that, FWC may terminate the ARPA at any time upon 90days prior written notice orwithout notice upon and during the continuance of an event of default. Additionally, provided there does not exist an event of default under the ARPA or the rider thereto (the “Rider”), FWC may make advances to or for the benefit of thecompany in an aggregate amount up to and not to exceed $250,000.00 from time to time during the term of the Rider and upon our request therefore, which advances shall besubject to all of the terms and conditions of the ARPA and shall be revolving consisting of advances against our eligible inventory as defined in the Rider as follows: (i) theadvances against eligible inventory, at FWC’s discretion, will be in amounts up to the sum 50% of all eligible inventory; provided, however, the advances against eligibleinventory shall at no time exceed 33% of the net outstanding purchased accounts under the ARPA plus the outstanding amount due, or net funds employed, from advancesmade on eligible inventory within conditions contained within the rider. The balance cap percentage shall be 25% after 120 days from date of the Rider. Eligible inventorywill be valued at the lower of cost or market value.
There can be no assurances that this financing will be sufficient to sustain profitable growth and attain additional capital to support growth. There can be no assurance that wewill be successful in obtaining any such additional financing, or that we will be able to generate sufficient positive cash flow from operations. The successful outcome ofthese or any future activities cannot be determined at this time and there is no assurance that if achieved, we will have sufficient funds to execute its business plans. Thefinancial statements do not include any adjustments relating to the recoverability and classification of asset carrying amounts or the amount and classification of liabilities thatmight result should we be unable to continue as a going concern. WE HAVE AN ACCUMULATED DEFICIT AND MAY INCUR ADDITIONAL LOSSES; THEREFORE, WE MAY NOT BE ABLE TO OBTAIN THEADDITIONAL FINANCING NEEDED FOR WORKING CAPITAL, CAPITAL EXPENDITURES AND TO MEET OUR DEBT SERVICE OBLIGATIONS. As of December 31, 2011, we had current liabilities of $1,260,952. Our debt could limit our ability to obtain additional financing for working capital, capital expenditures,debt service requirements, or other purposes in the future, as needed; to plan for, or react to, changes in technology and in our business and competition; and to react in theevent of an economic downturn. We may not be able to meet our debt service obligations. If we are unable to generate sufficient cash flow or obtain funds for required payments, or if we fail to comply withcovenants in our revolving lines of credit, we will be in default. WE FACE INTENSE COMPETITION, WHICH MAY REDUCE OUR SALES, OPERATING PROFITS, OR BOTH. The EMS industry is large, competitive and diverse, and is serviced by many companies, including several that have achieved significant market share, whereby we competewith numerous domestic and foreign EMS firms. We do not compete with first tier EMS companies such as Benchmark Electronics, Inc.; Celestica Inc; FlextronicsInternational Ltd.; Foxconn; Jabil Circuit, Inc.; Plexus Corp.; Sanmina-SCI Corporation. CTS Electronics. We mostly compete with second and third tier EMS companies. Wecompete with different companies depending on the type of service and/or geographic area.

Table of Contents Financial Statements
WE MAY BE ADVERSELY AFFECTED BY SHORTAGES OF REQUIRED ELECTRONIC COMPONENTS. IN ADDITION, WE DEPEND ON A LIMITEDNUMBER OF SUPPLIERS TO PROCURE OUR PARTS FOR PRODUCTION WHICH IF AVAILABILITY OF PRODUCTS BECOMES COMPROMISED ITCOULD ADD TO OUR COST OF GOODS SOLD AND AFFECT OUR REVENUE GROWTH. At various times, there have been shortages of some of the electronic components that we use, as a result of strong demand for those components or problems experienced bysuppliers. These unanticipated component shortages have resulted in curtailed production or delays in production, which prevented us from making scheduled shipments tocustomers in the past and may do so in the future. Our inability to make scheduled shipments could cause us to experience a reduction in our sales and an increase in our costsand could adversely affect our relationship with existing customers as well as prospective customers. Component shortages may also increase our cost of goods sold becausewe may be required to pay higher prices for components in short supply and redesign or reconfigure products to accommodate substitute components. As a result, componentshortages could adversely affect our operating results for a particular period due to the resulting revenue shortfall and increased manufacturing or component costs. Inaddition, we depend upon a number of major suppliers for our products. We do not have long-term agreements with our major suppliers, except for our purchase orders. Thereis an inherent risk that certain products will be unavailable for prompt delivery or, in some cases, discontinued. We will have only limited control over any third-partymanufacturer as to quality controls, timeliness of production and deliveries and various other factors. Lack of long-term agreement with our major suppliers could also impactmaterial availability and could delay shipments. Should the availability of products be compromised, it could also force us to develop alternative products, which could add tothe cost of goods sold and compromise delivery commitments. OUR PRINCIPAL SHAREHOLDERS, DIRECTORS AND EXECUTIVE OFFICERS , IN THE AGGREGATE, BENEFICIALLY OWN MORE THAN 50% OFOUR OUTSTANDING COMMON STOCK AND THESE SHAREHOLDERS, IF ACTING TOGETHER, WILL BE ABLE TO EXERT SUBSTANTIALINFLUENCE OVER ALL MATTERS REQUIRING APPROVAL OF OUR SHAREHOLDERS . Our principal shareholders, directors and executive officers in the aggregate, beneficially own more than 50% our outstanding common stock on a fully diluted basis. Theseshareholders, if acting together, will be able to exert substantial influence over all matters requiring approval of our shareholders, including amendments to our Articles ofIncorporation, fundamental corporate transactions such as mergers, acquisitions, the sale of the company, and other matters involving the direction of our business and affairsand specifically the ability to determine the members of our board of directors. (See “Principal Shareholders”) WE CURRENTLY SERVICE AND ATTEMPT TO OBTAIN THE MAJORITY OF OUR CUSTOMERS IN THE LIMITED GEOGRAPHIC OF SOUTHERNCALIFORNIA WHICH IS A SMALL ADDRESSABLE MARKET AND COULD BE SUBJECT TO ECONOMIC HARDSHIP OR SLOWDOWN, AS A RESULTOUR GROWTH COULD BE LIMITED AND ADVERSELY AFFECT OUR PROJECTED SALES AND OPERATING INCOME. We currently service, attempt to solicit new, and direct majority of our marketing efforts to customers in the Southern California region. This is a very small addressablemarket which ultimately limits the amount of growth we could experience. In addition, this region could experience an economic recession or other market contraction whichwould cause our current customers and any potential customers to also contract their businesses as well and cease outsourcing any current products that we currently serviceand would attempt to obtain. Both the size of the market and any potential economic hardship affecting this small regional market could adversely affect our project sales andoperating incomer. If we are forced to expand our marketing efforts outside this region we could also incur significant costs in an attempt to penetrate other regional ornational markets. WE DEPEND ON LOW TO MEDIUM VOLUME HIGH MIX TECHNOLOGY PRODUCTS THAT ARE BUILT DOMESTICALLY. THESE APPLICATIONSINCLUDE INDUSTRIAL INSTRUMENTATION, MEDICAL DEVICES, AEROSPACE-DEFENSE, ALTERNATIVE FUEL TECHNOLOGIES, SCIENTIFICCOMMUNICATION, SEMICONDUCTOR AND AUTOMOTIVE PRODUCTS, WHICH CONTINUALLY PRODUCE TECHNOLOGICALLY ADVANCEDPRODUCTS WITH SHORT LIFE CYCLES; OUR INABILITY TO CONTINUALLY MANUFACTURE SUCH PRODUCTS ON A COST-EFFECTIVE BASISCOULD HARM OUR BUSINESS.

Table of Contents Financial Statements
During the twelve months ended December 31, 2011, we derived approximately 6% of our revenue from customers in the medical device manufacturing, 29% industrialproducts, 1% from customers in the semiconductor industry, 4% from customers in alternative fuel and green technologies, 8% from customers in the instrumentationindustry, 8% from customers in the military industry, 9% from customers in the telecommunications industry, 1% from customers in the automotive industry, and 34% fromcustomers in aerospace/defense industries. Factors affecting these industries in general could seriously harm our customers and, as a result, us. These factors include:
· Rapid changes in technology, which result in short product life cycles, often reduce the volume and market share for our customers and ultimately us. It will lead tothe loss of previous design wins and frequent new product introductions and substantial development costs. This could result in loss of revenue and it could adverselyaffect our operating income.
· Seasonality of demand for our customers� products would force our customers to manage their inventories for seasonal variations and inventory management and
excess build ups. Customers could dramatically increase their request for production quantities, which could cause lead time problems with getting the components orwe may not be able to build enough products which could have loss of revenue for our customers. As a result we could lose these customers and it would adverselyaffect our projected sales. If the projected sales will not materialize, we will have loss of revenue and reduced margins. Any cancellation or delay in productionwould also have the same adverse effect on our sales projections and profitability.
· The inability of our customers to successfully market their products, and the failure of these products to gain widespread commercial acceptance; could affect their
long term business plans and sales. Our success depends upon the ability of our customers to successfully market their products and if they fail, it could result incancellations or rescheduling orders lower sales volume and operating income.
· Recessionary periods in our customers� markets will affect both our customers and our overall business output. It would require dramatic changes to the overall
business model, layoffs and major adjustments to the business overhead. If we fail to adjust to new recessionary environment, our business would be adverselyaffected and we may not be able to compete successfully against other companies in our industry and achieve profitability.
THE MAJORITY OF OUR SALES COME FROM A SMALL NUMBER OF CUSTOMERS WITH WHOM WE DO NOT HAVE LONG TERM CONTRACTS;IF WE LOSE ANY OF THESE CUSTOMERS, OUR SALES COULD DECLINE SIGNIFICANTLY. Sales to our five largest customers have represented a significant percentage of our net sales in recent periods. Our five largest customers accounted for approximately 58% ofnet sales during the twelve months ended December 31, 2011. Our principal customers have varied from year to year, and our principal customers may not continue to purchase services from us at current levels, if at all. Significantreductions in sales to any of these customers, or the loss of major customers, would seriously harm our business. If we are not able to timely replace expired, canceled orreduced contracts with new business, our revenues could be harmed.The part number, quantity, price, workmanship standards, and scheduled delivery dates of the products to be manufactured are determined by written purchase orders givenby our customers and accepted or confirmed by us in writing or via email. We agree to deliver the products manufactured pursuant to each purchase order in accordance withthe terms and conditions set forth in the purchase order. Probe manufactures hundreds of different types of assemblies on an ongoing basis and each product has a purchaseorder associated with it.We do not have any long term agreements with our customers, and our principal customers may not continue to purchase services from us. The duration of a purchase order isusually from 30 to 360 days. These purchase orders could be cancelled or rescheduled at any time. Significant reductions in sales to any of these customers would reduce ourprojected sales, adversely affect our profits, and seriously harm our business.IF WE LOSE KEY SENIOR MANAGEMENT PERSONNEL OUR BUSINESS COULD BE NEGATIVELY AFFECTED. FURTHER, WE WILL NEED TORECRUIT AND RETAIN ADDITIONAL SKILLED MANAGEMENT PERSONNEL AND IF WE ARE NOT ABLE TO DO SO, OUR BUSINESS AND OURABILITY TO CONTINUE TO GROW COULD BE HARMED.

Table of Contents Financial Statements
Our success depends to a large extent upon the continued services of our executive officers. We could be seriously harmed by the loss of any of our executive officers. In orderto manage our growth, we will need to recruit and retain additional skilled management personnel and if we are not able to do so, our business and our ability to continue togrow could be harmed. Although a number of companies in our industry have implemented workforce reductions, there remains substantial competition for highly skilledemployees. WE ARE SUBJECT TO ENVIRONMENTAL COMPLIANCE RISKS AND UNEXPECTED COSTS THAT WE MAY INCUR WITH RESPECT TOENVIRONMENTAL MATTERS MAY RESULT IN ADDITIONAL LOSS CONTINGENCIES, THE QUANTIFICATION OF WHICH CANNOT BEDETERMINED AT THIS TIME. We are subject to various federal, state, local and foreign environmental laws and regulations, including those governing the use, storage, discharge and disposal of hazardoussubstances in the ordinary course of our manufacturing process. If more stringent compliance or cleanup standards under environmental laws or regulations are imposed, orthe results of future testing and analyses at our current or former operating facilities indicate that we are responsible for the release of hazardous substances, we may be subjectto additional remediation liability. Further, additional environmental matters may arise in the future at sites where no problem is currently known or at sites that we mayacquire in the future. Currently unexpected costs that we may incur with respect to environmental matters may result in additional loss contingencies, the quantification ofwhich cannot be determined at this time. RISKS ABOUT OUR STOCK SHARES OF OUR COMMON STOCK ARE SUBJECT TO THE PENNY STOCK RESTRICTIONS WHICH CREATES A LACK OF LIQUIDITY AND MAKETRADING DIFFICULT OR IMPOSSIBLE. Until our shares of common stock are traded be in the over-the-counter markets which are commonly referred to as the OTCQB. As a result, an investor may find it difficult todispose of, or to obtain accurate quotations as to the price of our securities. The United States Securities and Exchange Commission, or the SEC, has adopted rules that regulate broker-dealer practices in connection with transactions in "penny stocks."Penny stocks (generally) are equity securities with a price of less than $5.00, other than securities registered on certain national securities exchanges or quoted on NASDAQ,provided that current price and volume information with respect to transactions in such securities is provided by the exchange or system. Prior to a transaction in a pennystock, a broker-dealer is required to:
· Deliver a standardized risk disclosure document prepared by the SEC;· Provide the customer with current bid and offer quotations for the penny stock;· Explain the compensation of the broker-dealer and its salesperson in the transaction;· Provide monthly account statements showing the market value of each penny stock held in the customer's account;· Make a special written determination that the penny stock is a suitable investment for the purchaser; and· Provide a written agreement to the transaction.
These requirements may have the effect of reducing the level of trading activity in the secondary market for our stock. Because our shares are subject to the penny stock rules,you may find it more difficult to sell your shares. The additional burdens imposed upon broker-dealers by such requirements may discourage broker-dealers fromrecommending transactions in our securities, which could severely limit the liquidity of our securities and consequently adversely affect the market price for our securities. OUR SECURITIES ARE THINLY TRADED WHICH DOES NOT PROVIDE LIQUIDITY FOR OUR INVESTORS. Our securities are quoted on the Over-the-Counter QB level. The OTCQB is an inter-dealer, over-the-counter market that provides significantly less liquidity than theNASDAQ Stock Market or national or regional exchanges. Securities traded on the OTCQB are usually thinly traded, highly volatile, have fewer market makers and are notfollowed by analysts. The
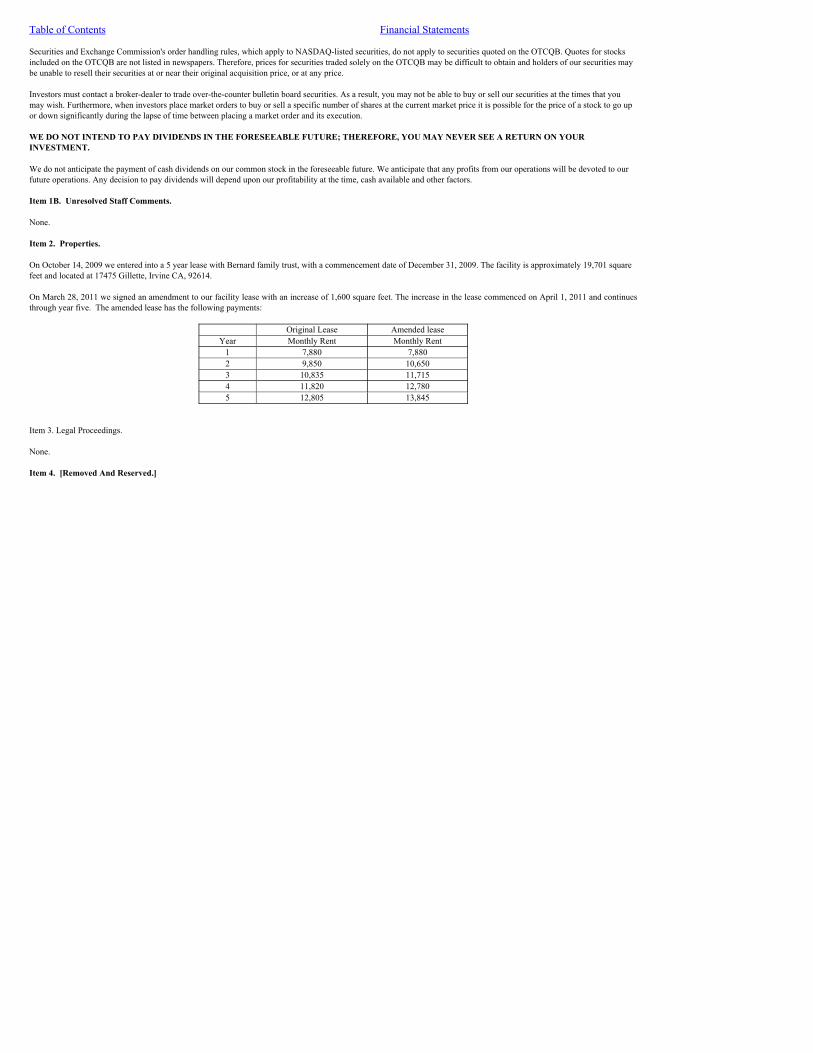
Table of Contents Financial Statements
Securities and Exchange Commission's order handling rules, which apply to NASDAQ-listed securities, do not apply to securities quoted on the OTCQB. Quotes for stocksincluded on the OTCQB are not listed in newspapers. Therefore, prices for securities traded solely on the OTCQB may be difficult to obtain and holders of our securities maybe unable to resell their securities at or near their original acquisition price, or at any price. Investors must contact a broker-dealer to trade over-the-counter bulletin board securities. As a result, you may not be able to buy or sell our securities at the times that youmay wish. Furthermore, when investors place market orders to buy or sell a specific number of shares at the current market price it is possible for the price of a stock to go upor down significantly during the lapse of time between placing a market order and its execution. WE DO NOT INTEND TO PAY DIVIDENDS IN THE FORESEEABLE FUTURE; THEREFORE, YOU MAY NEVER SEE A RETURN ON YOURINVESTMENT. We do not anticipate the payment of cash dividends on our common stock in the foreseeable future. We anticipate that any profits from our operations will be devoted to ourfuture operations. Any decision to pay dividends will depend upon our profitability at the time, cash available and other factors. Item 1B. Unresolved Staff Comments. None. Item 2. Properties.
On October 14, 2009 we entered into a 5 year lease with Bernard family trust, with a commencement date of December 31, 2009. The facility is approximately 19,701 squarefeet and located at 17475 Gillette, Irvine CA, 92614. On March 28, 2011 we signed an amendment to our facility lease with an increase of 1,600 square feet. The increase in the lease commenced on April 1, 2011 and continuesthrough year five. The amended lease has the following payments:
Original Lease Amended lease
Year Monthly Rent Monthly Rent1 7,880 7,8802 9,850 10,6503 10,835 11,7154 11,820 12,7805 12,805 13,845
Item 3. Legal Proceedings. None. Item 4. [Removed And Reserved.]
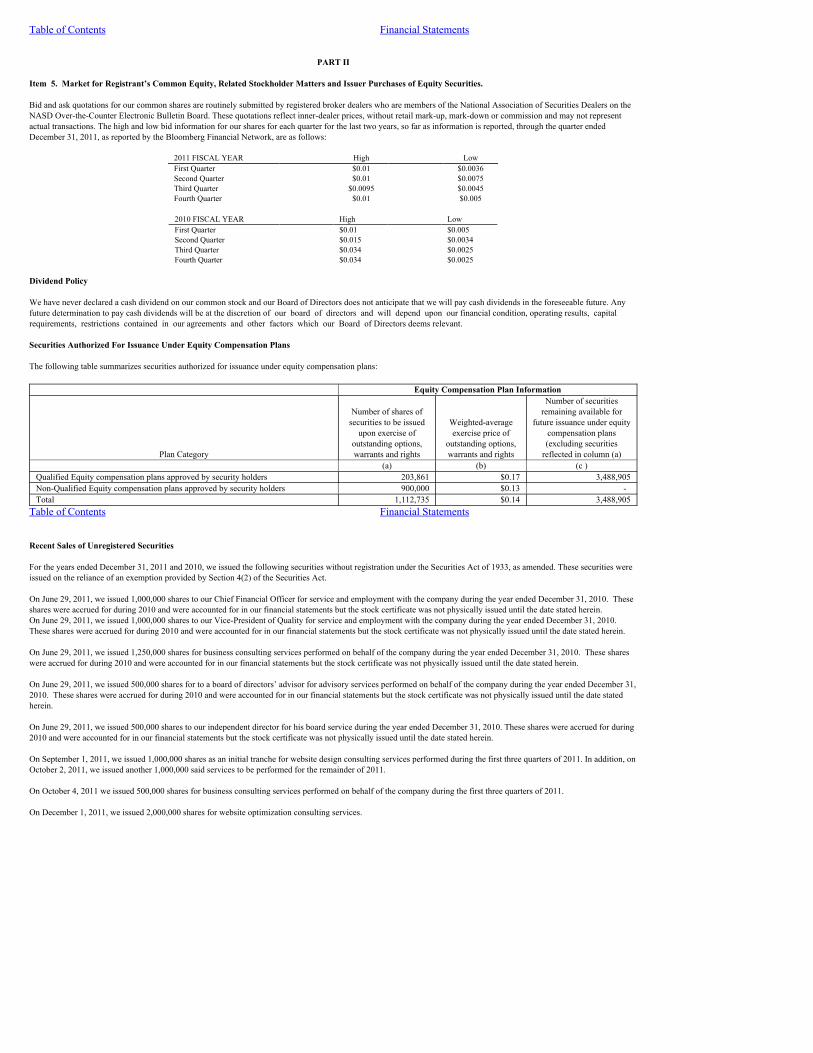
Table of Contents
Table of Contents
Financial Statements
PART II Item 5. Market for Registrant’s Common Equity, Related Stockholder Matters and Issuer Purchases of Equity Securities. Bid and ask quotations for our common shares are routinely submitted by registered broker dealers who are members of the National Association of Securities Dealers on theNASD Over-the-Counter Electronic Bulletin Board. These quotations reflect inner-dealer prices, without retail mark-up, mark-down or commission and may not representactual transactions. The high and low bid information for our shares for each quarter for the last two years, so far as information is reported, through the quarter endedDecember 31, 2011, as reported by the Bloomberg Financial Network, are as follows:
2011 FISCAL YEAR High LowFirst Quarter $0.01 $0.0036Second Quarter $0.01 $0.0075Third Quarter $0.0095 $0.0045Fourth Quarter $0.01 $0.005
2010 FISCAL YEAR High LowFirst Quarter $0.01 $0.005Second Quarter $0.015 $0.0034Third Quarter $0.034 $0.0025Fourth Quarter $0.034 $0.0025
Dividend Policy We have never declared a cash dividend on our common stock and our Board of Directors does not anticipate that we will pay cash dividends in the foreseeable future. Anyfuture determination to pay cash dividends will be at the discretion of our board of directors and will depend upon our financial condition, operating results, capital requirements, restrictions contained in our agreements and other factors which our Board of Directors deems relevant. Securities Authorized For Issuance Under Equity Compensation Plans The following table summarizes securities authorized for issuance under equity compensation plans:
Equity Compensation Plan Information
Plan Category
Number of shares ofsecurities to be issued
upon exercise ofoutstanding options,warrants and rights
Weighted-averageexercise price of
outstanding options,warrants and rights
Number of securitiesremaining available for
future issuance under equitycompensation plans(excluding securities
reflected in column (a) (a) (b) (c )Qualified Equity compensation plans approved by security holders 203,861 $0.17 3,488,905Non-Qualified Equity compensation plans approved by security holders 900,000 $0.13 - Total 1,112,735 $0.14 3,488,905
Financial Statements
Recent Sales of Unregistered Securities For the years ended December 31, 2011 and 2010, we issued the following securities without registration under the Securities Act of 1933, as amended. These securities wereissued on the reliance of an exemption provided by Section 4(2) of the Securities Act. On June 29, 2011, we issued 1,000,000 shares to our Chief Financial Officer for service and employment with the company during the year ended December 31, 2010. Theseshares were accrued for during 2010 and were accounted for in our financial statements but the stock certificate was not physically issued until the date stated herein.On June 29, 2011, we issued 1,000,000 shares to our Vice-President of Quality for service and employment with the company during the year ended December 31, 2010.These shares were accrued for during 2010 and were accounted for in our financial statements but the stock certificate was not physically issued until the date stated herein. On June 29, 2011, we issued 1,250,000 shares for business consulting services performed on behalf of the company during the year ended December 31, 2010. These shareswere accrued for during 2010 and were accounted for in our financial statements but the stock certificate was not physically issued until the date stated herein.
On June 29, 2011, we issued 500,000 shares for to a board of directors’ advisor for advisory services performed on behalf of the company during the year ended December 31,2010. These shares were accrued for during 2010 and were accounted for in our financial statements but the stock certificate was not physically issued until the date statedherein. On June 29, 2011, we issued 500,000 shares to our independent director for his board service during the year ended December 31, 2010. These shares were accrued for during2010 and were accounted for in our financial statements but the stock certificate was not physically issued until the date stated herein. On September 1, 2011, we issued 1,000,000 shares as an initial tranche for website design consulting services performed during the first three quarters of 2011. In addition, onOctober 2, 2011, we issued another 1,000,000 said services to be performed for the remainder of 2011. On October 4, 2011 we issued 500,000 shares for business consulting services performed on behalf of the company during the first three quarters of 2011. On December 1, 2011, we issued 2,000,000 shares for website optimization consulting services.
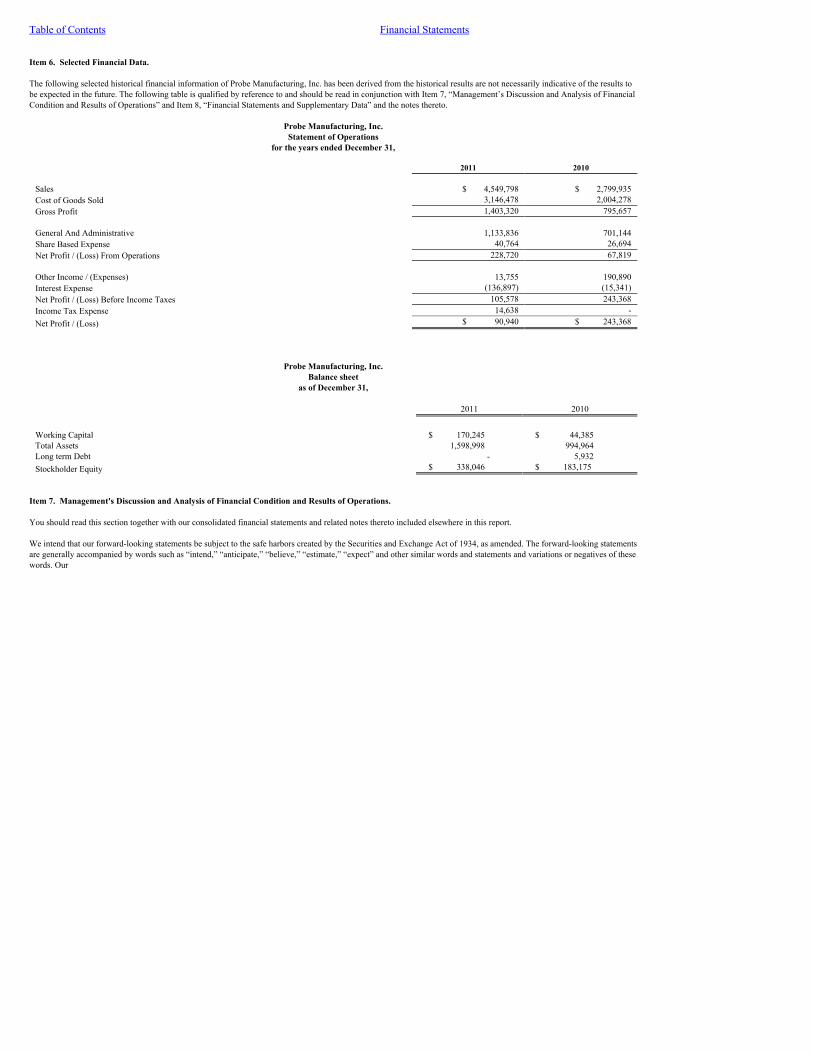
Table of Contents Financial Statements
Item 6. Selected Financial Data. The following selected historical financial information of Probe Manufacturing, Inc. has been derived from the historical results are not necessarily indicative of the results tobe expected in the future. The following table is qualified by reference to and should be read in conjunction with Item 7, “Management’s Discussion and Analysis of FinancialCondition and Results of Operations” and Item 8, “Financial Statements and Supplementary Data” and the notes thereto.
Probe Manufacturing, Inc.Statement of Operations
for the years ended December 31, 2011 2010
Sales $ 4,549,798 $ 2,799,935Cost of Goods Sold 3,146,478 2,004,278Gross Profit 1,403,320 795,657 General And Administrative 1,133,836 701,144Share Based Expense 40,764 26,694Net Profit / (Loss) From Operations 228,720 67,819 Other Income / (Expenses) 13,755 190,890Interest Expense (136,897) (15,341)Net Profit / (Loss) Before Income Taxes 105,578 243,368Income Tax Expense 14,638 -Net Profit / (Loss) $ 90,940 $ 243,368
Probe Manufacturing, Inc.Balance sheet
as of December 31, 2011 2010
Working Capital $ 170,245 $ 44,385Total Assets 1,598,998 994,964Long term Debt - 5,932Stockholder Equity $ 338,046 $ 183,175
Item 7. Management's Discussion and Analysis of Financial Condition and Results of Operations. You should read this section together with our consolidated financial statements and related notes thereto included elsewhere in this report. We intend that our forward-looking statements be subject to the safe harbors created by the Securities and Exchange Act of 1934, as amended. The forward-looking statementsare generally accompanied by words such as “intend,” “anticipate,” “believe,” “estimate,” “expect” and other similar words and statements and variations or negatives of thesewords. Our

Table of Contents Financial Statements
forward-looking statements are based on current expectations, forecasts and assumptions and are subject to risks, uncertainties and changes in condition, significance, valueand effect, including those discussed under the heading “Risk Factors” in this report filed with the United States Securities and Exchange Commission or the SEC. Such risks,uncertainties and changes in condition, significance, value and effect could cause our actual results to differ materially from our anticipated outcomes. Although we believethat the assumptions underlying the forward-looking statements are reasonable, any of the assumptions could prove inaccurate. Therefore, we can give no assurance that theresults implied by these forward-looking statements will be realized. The inclusion of forward-looking information should not be regarded as a representation by our companyor any other person that the future events, plans or expectations contemplated by Probe Manufacturing, Inc. will be achieved. We disclaim any intention or obligation toupdate or revise any forward-looking statements contained in the documents incorporated by reference herein, whether as a result of new information, future events orotherwise. Overview Probe Manufacturing Industries, Inc. was incorporated on July 7, 1995. On April 21, 2005, the Company was re-domiciled from California to Nevada, and changed its name toProbe Manufacturing, Inc. (the “Company,” “Probe,” or “PMI”) We provide global design and manufacturing services to original electronic equipment manufacturers fromour 23000 sq-ft facility in Irvine, California and strategic locations worldwide. Our revenue is generated from sales of our services primarily to customers in the medicaldevice, aerospace, automotive, industrial and instrumentation product manufacturers. We provide our domestic customers with low cost, low risk, flexible and high qualitymanufacturing services. We utilize global partnerships to secure the best cost and materials available by providing our customers with onshore, scalable manufacturingsolutions. The services that we provide are commonly referred to as Electronics Manufacturing Services (EMS). Our EMS offerings include new product introduction,collaborative design, procurement and materials management, product manufacturing, product warranty repair, and end-of-life support. We offer our customerscomprehensive and integrated design and manufacturing services, from initial product design to production and direct order fulfillment. Our engineering services includeproduct design, printed circuit board layout, prototyping, and test development. Our supply chain management solutions include purchasing, management of materials, andorder fulfillment. Our manufacturing services include surface mount and through-hole assembly, cable assembly, mechanical assembly, and fully integrated box build systemsfor high complexity electronics. The majority of our revenue is driven from manufacturing a mix of complex printed circuit board assemblies (PCBA), and box build assemblies. Some examples of ourcustomer’s finished goods products includes medical devices such as, electronic control units that help vehicles run on natural gas or hydrogen, electronic control units forlaser welding equipment, control units for electric-hybrid drives, portable ultrasound and electro-stimulation therapy equipment, PCB’s for landing gear systems and flapcontrollers, fluid control units for airliners, and devices for defense industry. Our strategy is to build and pursue global opportunities leveraging core competencies and to expand our manufacturing foundry platform for innovative start-ups in return formanufacturing rights and equity. As innovation, cost, and time to market become hyper competitive, domestic OEM’s are now compelled to use EMS partners with easy onshore access, providing localprogram management during product conceptualization, development, and integration. Many of the mid-tier OEMs in industries such as military/aerospace, medical,industrial/instrumentation, and green-tech products tend to be too small for $1 billion-plus revenue EMS companies. Most of these OEMs value close proximity and the abilityto provide complex manufacturing and personal customer service, which often favors regional providers that truly value and foster their relationships. Furthermore, with the recent cost increases in labor, currency movements and freight concerns, the ability to also provide near-shore manufacturing is expected to generateincreased interest. The low to medium EMS market compared to high volume has proved to be a higher margin with higher gross profits and sustained growth momentum.Our target accounts are mid-tier, U.S. based OEMs with annual sales from $15 million to $500 million. We believe that the combination of: (i) our management expertise; (ii) low overhead and cost structure; (iii) sophisticated management system developed internally to overseeoperational systems; (iv) high technology onshore and managed offshore manufacturing; and (v) global relationships and domestic customer centric program managementteam, PMI is well positioned to take advantage of the projected increase in outsourced onshore manufacturing.
Plan of Operation
Table of Contents Financial Statements
Management is taking the following steps to sustain profitability and growth: (i) To build and pursue global opportunities leveraging core competencies; (ii) organic growth,new sales and expansion of services along the supply chain line; (iii) manufacturing rights and equity through our manufacturing foundry platform; (iv) expansion ofcapabilities and competencies through mergers & acquisitions providing scale, cost synergies and revenue opportunities.
Our future success is likely dependent on our ability to sustain profitable growth and attain additional capital to support growth. There can be no assurance that we will besuccessful in obtaining any such financing, or that it will be able to generate sufficient positive cash flow from operations. The successful outcome of these or any futureactivities cannot be determined at this time and there is no assurance that if achieved, we will have sufficient funds to execute its business plans. The financial statements donot include any adjustments relating to the recoverability and classification of asset carrying amounts or the amount and classification of liabilities that might result should webe unable to continue as a going concern. Our Products and Services Engineering. Our global engineering team supports technology customers and innovative start-ups with a broad range of electrical, mechanical and software engineeringservices. PMI has assembled a team of experts from around the globe to assist customers at any point in the design cycle. These services include design processes fromelectrical, software, mechanical, Industrial and PCB design. Utilization of PMI’s design services will enable rapid market entry for our customers. It provides flexibility bybecoming the extension of their engineering and allowing customers to focus on their business strategy.
Supply Chain Management. PMI’s supply chain solution provides maximum flexibility and responsiveness through a collaborative and strategic approach with our customers.PMI can assume supply chain responsibility from component sourcing through delivery of finished product. PMI’s supply chain focus is on building internal and externalsystems and relationships, which allow us to capitalize on our expertise to align with our customer’s objectives and integrate with their processes today and in the future.
Manufacturing. Flexibility, responsiveness, communication, global supply chain management and speed are key values in what we offer our customers. We establish clearcommunication about our customer needs and requirements enabling a seamless integration with their objectives and processes. PMI’s manufacturing capability supports highand low-mix assemblies for prototypes, to medium-volume quantities in California and high-volume production in Asia. Our manufacturing operations include printed circuitboard assembly and testing; cable and harness assembly; mechanical assembly; and complex system integration. Plan of Operation
Management is taking the following steps to sustain profitability and growth: (i) to build and pursue global opportunities leveraging core competencies; (ii) organic growth,new sales and expansion of services along the supply chain line; (iii) manufacturing rights and equity through our manufacturing foundry platform; (iv) expansion ofcapabilities and competencies through mergers and acquisitions providing scale, cost synergies and revenue opportunities.
On February 18, 2011 we entered into an Accounts Receivable Purchasing Agreement (the “ARPA”) with DSCH Capital Partners, LLC d/b/a Far West Capital (“FWC”), anunaffiliated third party. Pursuant to the ARPA, FWC may purchase, in its sole discretion, eligible accounts receivable of our company on a revolving basis up to a maximumof $750,000. Under the terms of the ARPA, FWC may purchase eligible receivables from us with full recourse for the face amount of such eligible receivables less a discountof 1.0%. In addition, we are required to pay FWC a monthly cost of funds fee equal to the net funds employed by FWC at a rate equal to the Wall Street Journal PrimeLending Rate plus 4.75%, with a floor of 7.00%. FWC will retain 20% of the purchase price of the receivables as a reserve amount.
The ARPA also provides that FWC has the right to require us to repurchase any purchased accounts receivable: (a) if there is a dispute as to the validity of such receivable bythe account debtor, (b) if certain covenants, warranties or representations made by us with respect to such receivables are breached, (c) upon and during the continuance of anevent of default under the ARPA or upon the termination of the ARPA, or (d) if such receivable remains unpaid 90 days after the invoice date. The ARPA has an initial termof one year with automatic renewals for successive one-year periods. Notwithstanding that, FWC

Table of Contents Financial Statements
may terminate the ARPA at any time upon 90days prior written notice or without notice upon and during the continuance of an event of default. Additionally, provided there does not exist an event of default under the ARPA or the rider thereto (the “Rider”), FWC may make advances to or for the benefit of thecompany in an aggregate amount up to and not to exceed $250,000.00 from time to time during the term of the Rider and upon our request therefore, which advances shall besubject to all of the terms and conditions of the ARPA and shall be revolving consisting of advances against our eligible inventory as defined in the Rider as follows: (i) theadvances against eligible inventory, at FWC’s discretion, will be in amounts up to the sum 50% of all eligible inventory; provided, however, the advances against eligibleinventory shall at no time exceed 33% of the net outstanding purchased accounts under the ARPA plus the outstanding amount due, or net funds employed, from advancesmade on eligible inventory within conditions contained within the Rider. The balance cap percentage shall be 25% after 120 days from date of the Rider. Eligible inventorywill be valued at the lower of cost or market value. There can be no assurances that this financing will be sufficient to sustain profitable growth and attain additional capital to support growth. There can be no assurance that wewill be successful in obtaining any such additional financing, or that we will be able to generate sufficient positive cash flow from operations. The successful outcome ofthese or any future activities cannot be determined at this time and there is no assurance that if achieved, we will have sufficient funds to execute its business plans. Thefinancial statements do not include any adjustments relating to the recoverability and classification of asset carrying amounts or the amount and classification of liabilities thatmight result should we be unable to continue as a going concern. Summary of Results For the year ended December 31, 2011, we had a net profit of $90,940 compared to a net profit of $243,368, for the same period in 2010. The increased net profit in 2010 wasmainly due to a gain on debt settlement of $190,890.
For the year ended December 31, 2011, our revenue was $4,549,798 compared to $2,799,935 for the same period in 2010, due to increased orders within existing accounts andwe added 6 new customers in 2011.
For the year ended December 31, 2011, our cost of goods sold was 69% compared to 72% for the same period in 2010, mainly due to the decrease in direct labor as a percentof sales.
For the twelve months ended December 31, 2011, our gross margin was 31% compared to 28% for the same period in 2010.
For the twelve months ended December 31, 2011, our SG&A cost was 24% compared to 25% for the same period in 2010.
For the year ended December 31, 2011, we had a net profit of $90,940 and a working capital surplus of $170,245. Our total stockholder’s equity increased by $154,871,resulting in shareholder surplus of $338,046 as of December 31, 2011.
As of December 31, 2011, we had a working capital surplus of $170,245, compared to working capital surplus of $44,385 as of December 31, 2010, an increase of $125,860.
Key performance indicators for the year ended December 31, 2011 and 2010:
Key performance indicators: 2011 2010Inventory Turns 5.51 4.7Days Sales in Backlog 184 248Days Receivables Outstanding 45 33Days Payables Outstanding 51 52
Inventory turns Inventory turns are calculated as the ratio of cost of material compared to the average inventory for that period. For the year ended December 31, 2011, our inventory turnswere 5.1 compared to 4.7 for the same period in 2010.
Table of Contents Financial Statements
Days sales in backlog are calculated based on our back log divided by average daily sales during that period. For the year ended December 31, 2011, Days Sales in Backlogwas 184 days compared to 248 days for the same period in 2010. Days receivables outstanding is calculated as the ratio of average accounts receivable during that period compared to average daily sales for the same period, this hasworsened as a result of our customers stretching out payments and the economy in general. For the year ended December 31, 2011, days receivables outstanding was 45 dayscompared to 33 days for the same period in 2010. Days payable outstanding is calculated as the ratio of average accounts payable during that period compared to average daily sales for the same period. For the year endedDecember 31, 2011, day’s payable outstanding was 51 days compared to 52days for the same period in 2010. Critical Accounting Policies and basis of presentation The accompanying financial statements of the Company have been prepared in accordance with the instructions to Form 10-K for the fiscal year ending December 31, 2011. We follow United States Generally Accepted Accounting Principles, or GAAP. Certain of the principles involve selection among alternatives and choices of methods, whichare described in the footnotes to our financial statements. Cash and Cash Equivalents We maintain the majority of its cash accounts at a commercial bank. The total cash balance is insured by the Federal Deposit Insurance Corporation (“FDIC”) up to $250,000per commercial bank. For purposes of the statement of cash flows we consider all cash and highly liquid investments with initial maturities of one year or less to be cashequivalents. Estimates The preparation of financial statements in conformity with accounting principles generally accepted in the United States requires management to make estimates andassumptions that affect the reported amounts of assets and liabilities, and disclosure of contingent assets and liabilities at the date of the financial statements and the reportedamounts of revenue and expenses during the reporting period. Such estimates may be materially different from actual financial results. Significant estimates include therecoverability of long-lived assets, the collection of accounts receivable and valuation of inventory and reserves. Accounts Receivable We grant credit to its customers located within the United States of America; and do not require collateral. Our ability to collect receivables is affected by economicfluctuations in the geographic areas and industries served by us.Reserves for un-collectable amounts are provided, based on past experience and a specific analysis of the accounts. Although we expect to collect amounts due, actualcollections may differ from the estimated amounts. As of December 31, 2011, we had a reserve for potentially un-collectable accounts of $15,000. Five (5) customersaccounted for approximately 58% of accounts receivable at December 31, 2011 and no one customer accounted for more than 13% of the accounts receivable balance. Ourtrade accounts primarily represent unsecured receivables. Historically, our bad debt write-offs related to these trade accounts have been insignificant. Inventory Inventories are valued at the lower of weighted average cost or market value. Our industry experiences changes in technology, changes in market value and availability ofraw materials, as well as changing customer demand. We make provisions for estimated excess and obsolete inventories based on regular audits and cycle counts of our on-hand inventory levels and forecasted customer demands and at times additional provisions are made. Any inventory write offs are charged to the reserve account. As ofDecember 30, 2011, we had a reserve for potentially obsolete inventory of $160,000. Property and Equipment

Table of Contents Financial Statements
Property and equipment are stated at cost. Assets held under capital leases are recorded at lease inception at the lower of the present value of the minimum lease payments orthe fair market value of the related assets. We follow the practice of capitalizing property and equipment purchased over $5,000. The cost of ordinary maintenance andrepairs is charged to operations. Depreciation and amortization are computed on the straight-line method over the following estimated useful lives of the related assets: Furniture and fixtures 3 to 7 years Equipment 7 to 10 years Leasehold improvements 2 years (life of the lease) Long –Lived Assets Our management assesses the recoverability of its long-lived assets by determining whether the depreciation and amortization of long lived assets over their remaining livescan be recovered through projected undiscounted future cash flows. The amount of long-lived asset impairment if any, is measured based on fair value and is charged tooperations in the period in which long-lived assets impairment is determined by management. There can be no assurance however, that market conditions will not change ordemand for our services will continue, which could result in impairment of long-lived assets in the future. Revenue Recognition Revenue from product and services are recognized at the time goods are shipped or services are provided to the customer, with an appropriate provision for returns andallowances. Terms are generally FOB origination with the right of inspection and acceptance. We have not experienced a material amount of rejected or damaged product. Fair Value of Financial Instruments The carrying amount of accounts payable and accrued expenses are considered to be representative of their respective fair values because of the short-term nature of thesefinancial instruments. Other Comprehensive Income We have no material components of other comprehensive income (loss) and accordingly, net loss is equal to comprehensive loss in all periods. Net Profit/(Loss) per Common Share Basic profit / (loss) per share is computed on the basis of the weighted average number of common shares outstanding. At December 31, 2011, we had outstanding commonshares of 197,659,056 used in the calculation of basic earnings per share. Basic Weighted average common shares and equivalents at December 31, 2011 and 2010 were190,315,404 and 184,638,320, respectively. As of December 31, 2011, we had outstanding warrants to purchase 10,682,955 additional common shares and options topurchase 1,103,861 additional common shares. Fully diluted weighted average common shares and equivalents for the years ended 2011 and 2010 were 202,069,928 and203,639,511, respectively. Research and Development We have curtailed all research and development and focusing our business on its core business of electronics contract manufacturing. Research and Development Costs incurred in association with the alternative fuels technology development (which include salaries and equipment) were expensed as incurred.We expensed $0.00 in Research and Development Costs during the years ended December 31, 2011 and 2010. Segment Information
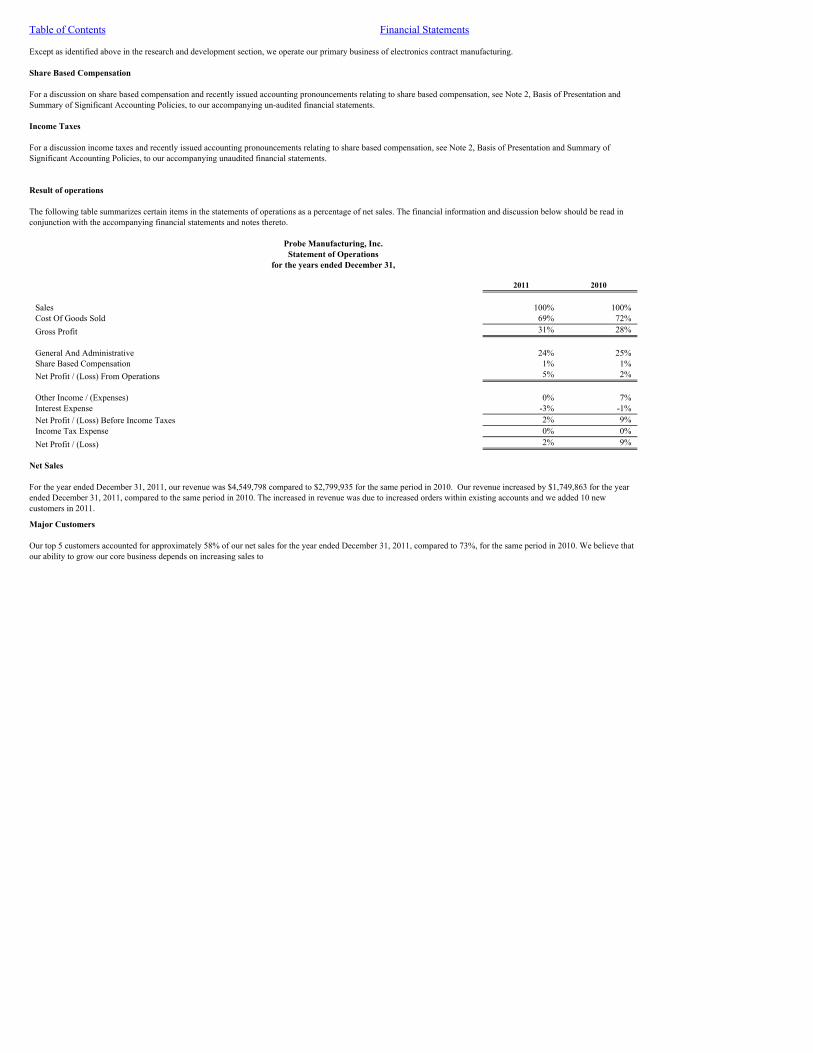
Table of Contents Financial Statements
Except as identified above in the research and development section, we operate our primary business of electronics contract manufacturing. Share Based Compensation For a discussion on share based compensation and recently issued accounting pronouncements relating to share based compensation, see Note 2, Basis of Presentation andSummary of Significant Accounting Policies, to our accompanying un-audited financial statements. Income Taxes For a discussion income taxes and recently issued accounting pronouncements relating to share based compensation, see Note 2, Basis of Presentation and Summary ofSignificant Accounting Policies, to our accompanying unaudited financial statements.
Result of operations The following table summarizes certain items in the statements of operations as a percentage of net sales. The financial information and discussion below should be read inconjunction with the accompanying financial statements and notes thereto.
Probe Manufacturing, Inc.Statement of Operations
for the years ended December 31, 2011 2010
Sales 100% 100%Cost Of Goods Sold 69% 72%Gross Profit 31% 28% General And Administrative 24% 25%Share Based Compensation 1% 1%Net Profit / (Loss) From Operations 5% 2% Other Income / (Expenses) 0% 7%Interest Expense -3% -1%Net Profit / (Loss) Before Income Taxes 2% 9%Income Tax Expense 0% 0%Net Profit / (Loss) 2% 9%
Net Sales For the year ended December 31, 2011, our revenue was $4,549,798 compared to $2,799,935 for the same period in 2010. Our revenue increased by $1,749,863 for the yearended December 31, 2011, compared to the same period in 2010. The increased in revenue was due to increased orders within existing accounts and we added 10 newcustomers in 2011.
Major Customers Our top 5 customers accounted for approximately 58% of our net sales for the year ended December 31, 2011, compared to 73%, for the same period in 2010. We believe thatour ability to grow our core business depends on increasing sales to

Table of Contents Financial Statements
existing customers, and on successfully attracting new customers. Customer contracts can be canceled and volume levels can be changed or delayed based on our customer’sperformance and the end users’ markets which we have no control over. The timely replacement of delayed, canceled or reduced orders with new business cannot be ensured.In addition, we cannot assume that any of our current customers will continue to utilize our services. Consequently, our results of operations may be materially adverselyaffected. Gross Profit For the year ended December 31, 2011, our gross profits increased to 31% from 28% for the same period in 2010. Our gross profits could vary from period to period and isaffected by a number of factors, including product mix, production efficiencies, component availability and costs, pricing, competition, customer requirements andunanticipated restructuring or inventory charges and potential scrap.
Selling, General and Administrative (SG&A) Expenses For the year ended December31, 2011, our SG&A expense was 24% compared to 25% for the same period in 2010. This decrease is primarily due to the increase in revenue. We have also made adjustments to decrease SG&A expense. Net Income/(Loss) from operations For the year ended December 31, 2011, our net income from operations was 5% compared to net income from operations of 2% for the same period in 2010. This wasprimarily due to an increase in revenue as well as the decrease in expenses. For the year ended December 31, 2011 interest expense was $136,897 compared to $15,341 for the same period in 2010, this was due to implementation of our asset basedline of credit with Farwest Capital referenced in Note 8. Liquidity and Capital Resources
PROBE MANUFACTURING, INC.Condensed Statements of Cash Flows
for the years ended December 31,
2011 2010Net Cash provided / (Used) In Operating Activities $ (378,117) $ 70,396Cash Flows Used In Investing Activities (25,310) (51,556)Cash Flows Provided / (used) By Financing Activities 421,776 (18,840)Net (Decrease) Increase in Cash and Cash Equivalents $ 18,349 $ -
Capital Requirements for long-term Obligations On February 18, 2011 we entered into an Accounts Receivable Purchasing Agreement (the “ARPA”) with DSCH Capital Partners, LLC d/b/a Far West Capital (“FWC”), anunaffiliated third party. Pursuant to the ARPA, FWC may purchase, in its sole discretion, eligible accounts receivable of our company on a revolving basis up to a maximumof $750,000. Under the terms of the ARPA, FWC may purchase eligible receivables from us with full recourse for the face amount of such eligible receivables less a discountof 1.0%. In addition, we are required to pay FWC a monthly cost of funds fee equal to the net funds employed by FWC at a rate equal to the Wall Street Journal PrimeLending Rate plus 4.75%, with a floor of 7.00%. FWC will retain 20% of the purchase price of the receivables as a reserve amount.
The ARPA also provides that FWC has the right to require us to repurchase any purchased accounts receivable: (a) if there is a dispute as to the validity of such receivable bythe account debtor, (b) if certain covenants, warranties or representations made by us with respect to such receivables are breached, (c) upon and during the continuance of anevent of default under

Table of Contents Financial Statements
the ARPA or upon the termination of the ARPA, or (d) if such receivable remains unpaid 90 days after the invoice date. The ARPA has an initial term of one year withautomatic renewals for successive one-year periods. Notwithstanding that, FWC may terminate the ARPA at any time upon 90days prior written notice or without notice uponand during the continuance of an event of default. Additionally, provided there does not exist an event of default under the ARPA or the rider thereto (the “Rider”), FWC may make advances to or for the benefit of thecompany in an aggregate amount up to and not to exceed $250,000.00 from time to time during the term of the Rider and upon our request therefore, which advances shall besubject to all of the terms and conditions of the ARPA and shall be revolving consisting of advances against our eligible inventory as defined in the Rider as follows: (i) theadvances against eligible inventory, at FWC’s discretion, will be in amounts up to the sum 50% of all eligible inventory; provided, however, the advances against eligibleinventory shall at no time exceed 33% of the net outstanding purchased accounts under the ARPA plus the outstanding amount due, or net funds employed, from advancesmade on eligible inventory within conditions contained within the Rider. The balance cap percentage shall be 25% after 120 days from date of the Rider. Eligible inventorywill be valued at the lower of cost or market value.
There can be no assurances that this financing will be sufficient to sustain profitable growth and attain additional capital to support growth. There can be no assurance that wewill be successful in obtaining any such additional financing, or that we will be able to generate sufficient positive cash flow from operations. The successful outcome ofthese or any future activities cannot be determined at this time and there is no assurance that if achieved, we will have sufficient funds to execute its business plans. Thefinancial statements do not include any adjustments relating to the recoverability and classification of asset carrying amounts or the amount and classification of liabilities thatmight result should we be unable to continue as a going concern. Off-balance Sheet Arrangement We currently have no off-balance sheet arrangements. Item 7a. Quantitative and Qualitative Disclosures about Market Risk. Not Applicable.

Table of Contents Financial Statements
Item 8. Financial Statements and Supplemental Data.
PROBE MANUFACTURING, INC.
10-KTABLE OF CONTENTS
FINANCIAL STATEMENTS
PageReport of independent registered public accounting firm 23Balance Sheet as of December 31, 2011 and 2010 24Statement of Operations for the years ended December 31, 2011 and 2010 25Statement of Stockholders Equity for the years ended December 31, 2011 and 2010 26Statement of Cash flows for the years ended December 31, 2011 and 2010 28Footnotes to the Financial Statements 29

Table of Contents Financial Statements
REPORT OF INDEPENDENT REGISTERED PUBLIC ACCOUNTING FIRM
April 2, 2012
Board of DirectorsProbe Manufacturing, Inc.17475 Gillette AvenueIrvine, CA 92614
We have audited the accompanying consolidated balance sheet of Probe Manufacturing, Inc. (the “Company”) as of December 31, 2011 and2010 and the related consolidated statements of operations, stockholders’ deficit, and cash flows for the years ended December 31, 2011 and 2010.These financial statements are the responsibility of the Company’s management. Our responsibility is to express an opinion on these financialstatements based on our audit.
We conducted our audit in accordance with the standards of the Public Company Accounting Oversight Board (United States). Those standardsrequire that we plan and perform the audit to obtain reasonable assurance about whether the financial statements are free of material misstatement. TheCompany is not required to have, nor were we engaged to perform an audit of its internal control over financial reporting. Our audit includedconsideration of internal control over financial reporting as a basis for designing audit procedures that are appropriate in the circumstances, but not forthe purpose of expressing an opinion on the effectiveness of the Company’s internal control over financial reporting. Accordingly, we express no suchopinion. An audit also includes examining, on a test basis, evidence supporting the amounts and disclosures in the financial statements, assessing theaccounting principles used and significant estimates made by management, as well as evaluating the overall financial statement presentation. Webelieve that our audit provide a reasonable basis for our opinion.
In our opinion, the consolidated financial statements referred to above present fairly, in all material respects, the financial position of theCompany as of December 31, 2011 and 2010, and the results of its operations and changes in stockholders’ deficit and its cash flows for the yearsended December 31, 2011 and 2010, in conformity with accounting principles generally accepted in the United States of America.
As discussed in Note 1 of the notes to the accompanying consolidated financial statements, the financial statements have been preparedassuming that the Company will continue as a going concern. As discussed in the footnotes, the Company has current assets of $1,460,906 and currentliabilities of $1,260,952. Sales have increased from $2,799,935 in 2010 to $4,549,798 for the comparable period in 2011. In addition, the Companyhas an accumulated deficit of ($238,483) and is dependent on at least maintaining current revenue levels. Those conditions raise substantial doubt aboutthe Company’s ability to continue as a going concern. The accompanying financial statements do not include any adjustments that might result fromthe outcome of this uncertainty.
/s/W. T. Uniack & Co. CPA’s P.C.Woodstock, Georgia

Table of Contents Financial Statements
Probe Manufacturing, Inc.
Balance Sheet as of December 31, December 31,
2011 2010Assets Current Assets: Cash $ 18,349 $ - Accounts receivable – net 719,320 403,109 Inventory 693,528 447,133 Total Current Assets 1,431,197 850,242 Property And Equipment – Net 127,092 113,665 Notes receivable 11,000 11,000 Other Assets 29,709 20,057Total Assets $ 1,598,998 $ 994,964 Liabilities And Stockholders' ( Deficit ) Current Liabilities: Bank overdraft $ - $ 47,502 Accounts payable - trade 495,487 383,989 Customer Deposits 23,139 13,737 Accrued Expenses 188,083 282,229 Notes Payable - Line of Credit 545,579 - Notes Payable - Related Party 70,000 Notes Payable - Current 8,664 8,400 Total Current Liabilities 1,260,952 805,857Long-Term Debt: Notes Payable - 14,332 Less Current portion of Long Term Debt - (8,400) Net Long-Term Debt - 5,932Total Liabilities 1,260,952 811,789 Stockholders' ( Deficit ) Shares to be issued - 21,250
Common stock, $.001 par value; 400,000,000 shares authorized; 197,659,056 and 184,638,320shares issued and outstanding respectively 197,659 184,638
Additional paid-in capital 379,503 306,709 Treasury Stock (633) - Accumulated deficit (238,483) (329,422) Total Stockholders' ( Deficit ) 338,046 183,175Total Liabilities And Stockholders' Deficit $ 1,598,998 $ 994,964
The accompanying footnotes are an integral part of these financial statements

Table of Contents Financial Statements
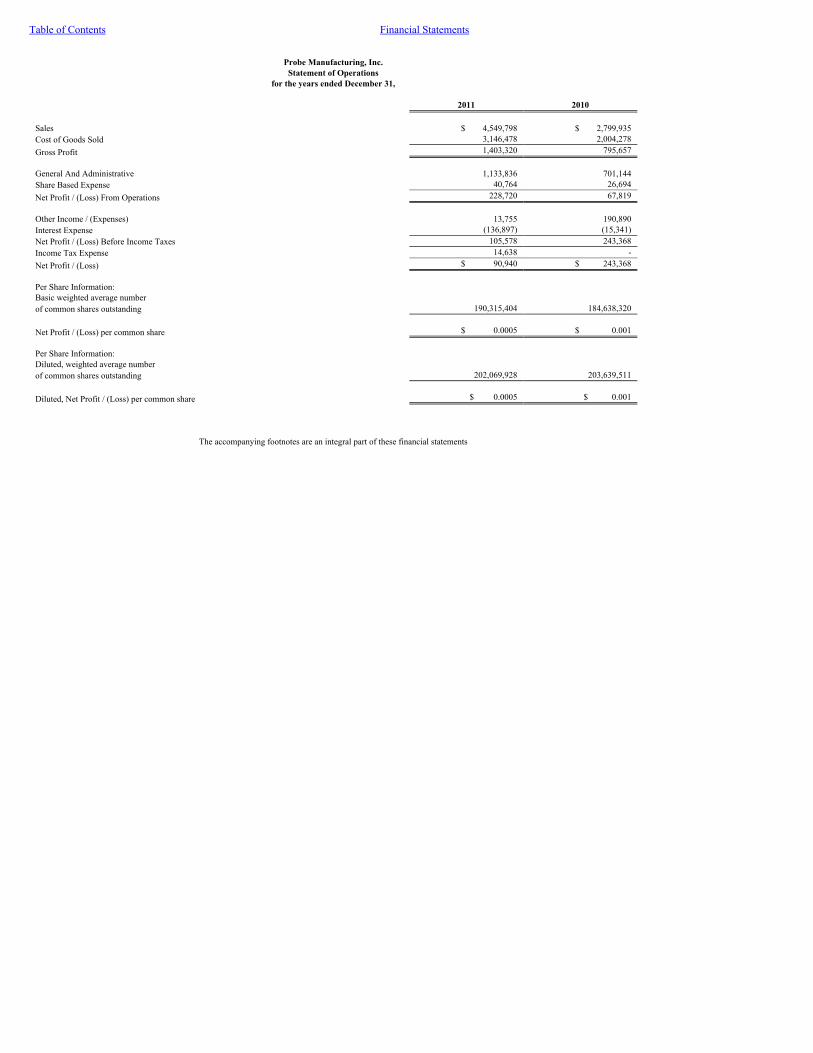
Table of Contents Financial Statements
Probe Manufacturing, Inc.
Statement of Operationsfor the years ended December 31,
2011 2010
Sales $ 4,549,798 $ 2,799,935Cost of Goods Sold 3,146,478 2,004,278Gross Profit 1,403,320 795,657 General And Administrative 1,133,836 701,144Share Based Expense 40,764 26,694Net Profit / (Loss) From Operations 228,720 67,819 Other Income / (Expenses) 13,755 190,890Interest Expense (136,897) (15,341)Net Profit / (Loss) Before Income Taxes 105,578 243,368Income Tax Expense 14,638 -Net Profit / (Loss) $ 90,940 $ 243,368 Per Share Information: Basic weighted average number of common shares outstanding 190,315,404 184,638,320 Net Profit / (Loss) per common share $ 0.0005 $ 0.001 Per Share Information: Diluted, weighted average number of common shares outstanding 202,069,928 203,639,511 Diluted, Net Profit / (Loss) per common share $ 0.0005 $ 0.001
The accompanying footnotes are an integral part of these financial statements
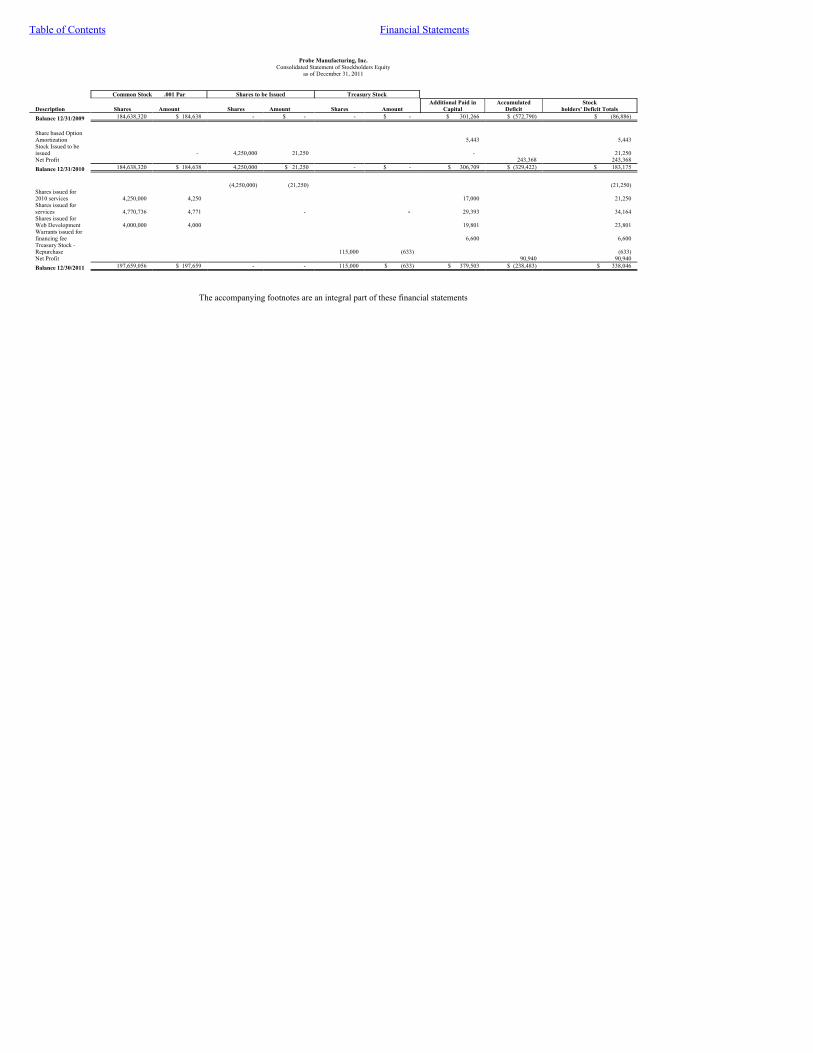
Table of Contents Financial Statements
Probe Manufacturing, Inc.
Consolidated Statement of Stockholders Equityas of December 31, 2011
Common Stock .001 Par Shares to be Issued Treasury Stock
Description Shares Amount Shares Amount Shares AmountAdditional Paid in
CapitalAccumulated
DeficitStock
holders' Deficit TotalsBalance 12/31/2009 184,638,320 $ 184,638 - $ - - $ - $ 301,266 $ (572,790) $ (86,886)
Share based OptionAmortization 5,443 5,443Stock Issued to beissued - 4,250,000 21,250 - 21,250Net Profit 243,368 243,368Balance 12/31/2010 184,638,320 $ 184,638 4,250,000 $ 21,250 - $ - $ 306,709 $ (329,422) $ 183,175
(4,250,000) (21,250) (21,250)Shares issued for2010 services 4,250,000 4,250 17,000 21,250Shares issued forservices 4,770,736 4,771 - - 29,393 34,164Shares issued forWeb Development 4,000,000 4,000 19,801 23,801Warrants issued forfinancing fee 6,600 6,600Treasury Stock -Repurchase 115,000 (633) (633)Net Profit 90,940 90,940Balance 12/30/2011 197,659,056 $ 197,659 - - 115,000 $ (633) $ 379,503 $ (238,483) $ 338,046
The accompanying footnotes are an integral part of these financial statements

Table of Contents Financial Statements
Probe Manufacturing, Inc.Statements of Cash Flows
for the years ended December 31, 2011 2010Cash Flows from Operating Activities: Net Income / ( Loss ) $ 90,940 $ 243,368 Adjustments to reconcile net loss to net cash used in operating activities: Depreciation and amortization 35,683 40,975 Share based expense 40,764 26,694 Gain on debt Settlement (190,960) Loss on sale of subsidiary Net profit of subsidiary Changes in assets and liabilities: (Increase) decrease in accounts receivable (316,211) (288,728) (Increase) decrease in inventory (246,395) (44,266) (Increase) decrease in other assets (9,652) 2,570 (Decrease) increase in accounts payable 111,498 196,041 (Decrease) increase in customer deposits 9,402 (11,697) Other (Decrease) increase in accrued expenses (94,146) 96,399Net Cash provided / (Used) In Operating Activities (378,117) 70,396 Cash Flows from Investing Activities Purchase of Property and equipment (25,310) (51,556)Cash Flows Used In Investing Activities (25,310) (51,556) Cash Flows from Financing Activities Bank Overdraft / (Repayment) (47,502) (13,172) Proceeds / (Payments) on Line of Credit 545,579 - Repurchase Treasury Stock (633) - Payments on capital lease settlement obligations - (70,000) Proceeds / (Payments) on notes payable (75,668) 64,332Cash Flows Provided / (used) By Financing Activities 421,776 (18,840) Net (Decrease) Increase in Cash and Cash Equivalents 18,349 - Cash and Cash Equivalents at Beginning of Period - - Cash and Cash Equivalents at End of Period $ 18,349 $ - Supplemental Information: Interest Paid $ 127,415 $ 12,841 Shares issued for web development $ 23,801
The accompanying footnotes are an integral part of these financial statements
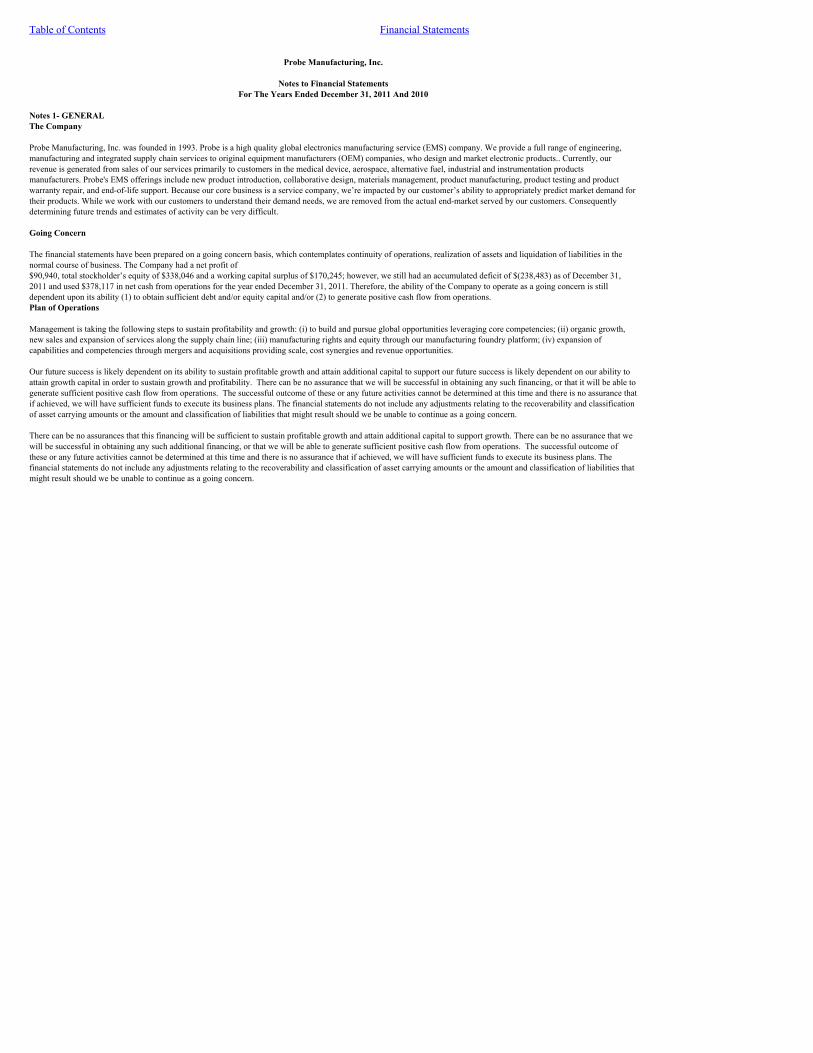
Table of Contents Financial Statements
Probe Manufacturing, Inc.
Notes to Financial Statements
For The Years Ended December 31, 2011 And 2010
Notes 1- GENERALThe Company Probe Manufacturing, Inc. was founded in 1993. Probe is a high quality global electronics manufacturing service (EMS) company. We provide a full range of engineering,manufacturing and integrated supply chain services to original equipment manufacturers (OEM) companies, who design and market electronic products.. Currently, ourrevenue is generated from sales of our services primarily to customers in the medical device, aerospace, alternative fuel, industrial and instrumentation productsmanufacturers. Probe's EMS offerings include new product introduction, collaborative design, materials management, product manufacturing, product testing and productwarranty repair, and end-of-life support. Because our core business is a service company, we’re impacted by our customer’s ability to appropriately predict market demand fortheir products. While we work with our customers to understand their demand needs, we are removed from the actual end-market served by our customers. Consequentlydetermining future trends and estimates of activity can be very difficult. Going Concern The financial statements have been prepared on a going concern basis, which contemplates continuity of operations, realization of assets and liquidation of liabilities in thenormal course of business. The Company had a net profit of$90,940, total stockholder’s equity of $338,046 and a working capital surplus of $170,245; however, we still had an accumulated deficit of $(238,483) as of December 31,2011 and used $378,117 in net cash from operations for the year ended December 31, 2011. Therefore, the ability of the Company to operate as a going concern is stilldependent upon its ability (1) to obtain sufficient debt and/or equity capital and/or (2) to generate positive cash flow from operations.Plan of Operations Management is taking the following steps to sustain profitability and growth: (i) to build and pursue global opportunities leveraging core competencies; (ii) organic growth,new sales and expansion of services along the supply chain line; (iii) manufacturing rights and equity through our manufacturing foundry platform; (iv) expansion ofcapabilities and competencies through mergers and acquisitions providing scale, cost synergies and revenue opportunities. Our future success is likely dependent on its ability to sustain profitable growth and attain additional capital to support our future success is likely dependent on our ability toattain growth capital in order to sustain growth and profitability. There can be no assurance that we will be successful in obtaining any such financing, or that it will be able togenerate sufficient positive cash flow from operations. The successful outcome of these or any future activities cannot be determined at this time and there is no assurance thatif achieved, we will have sufficient funds to execute its business plans. The financial statements do not include any adjustments relating to the recoverability and classificationof asset carrying amounts or the amount and classification of liabilities that might result should we be unable to continue as a going concern. There can be no assurances that this financing will be sufficient to sustain profitable growth and attain additional capital to support growth. There can be no assurance that wewill be successful in obtaining any such additional financing, or that we will be able to generate sufficient positive cash flow from operations. The successful outcome ofthese or any future activities cannot be determined at this time and there is no assurance that if achieved, we will have sufficient funds to execute its business plans. Thefinancial statements do not include any adjustments relating to the recoverability and classification of asset carrying amounts or the amount and classification of liabilities thatmight result should we be unable to continue as a going concern.

Table of Contents Financial Statements
Probe Manufacturing, Inc.
Notes to Financial Statements – (Continued) NOTE 2 – BASIS OF PRESENTATION AND SUMMARY OF SIGNIFICANT ACCOUNTING POLICIES: The accompanying financial statements of the Company have been prepared in accordance with the instructions to Form 10-K for the fiscal year ending December 31, 2011. We follow the Generally Accepted Accounting Principles of the United States, or GAAP. Certain of the principles involve selection among alternatives and choices ofmethods, which are described in the footnotes to our audited financial statements. Estimates The preparation of financial statements in conformity with accounting principles generally accepted in the United States requires management to make estimates andassumptions that affect the reported amounts of assets and liabilities, and disclosure of contingent assets and liabilities at the date of the financial statements and the reportedamounts of revenue and expenses during the reporting period. Such estimates may be materially different from actual financial results. Significant estimates include therecoverability of long-lived assets, the collection of accounts receivable and valuation of inventory and reserves. Cash and Cash Equivalents We maintain the majority of its cash accounts at a commercial bank. The total cash balance is insured by the Federal Deposit Insurance Corporation (“FDIC”) up to $250,000per commercial bank. For purposes of the statement of cash flows we consider all cash and highly liquid investments with initial maturities of one year or less to be cashequivalents. Accounts Receivable We grant credit to its customers located within the United States of America; and do not require collateral. Our ability to collect receivables is affected by economicfluctuations in the geographic areas and industries served by us. Reserves for un-collectable amounts are provided, based on past experience and a specific analysis of the accounts. Although we expect to collect amounts due, actualcollections may differ from the estimated amounts. As of December 31, 2011, we had a reserve for potentially un-collectable accounts of $15,000. Five (5) customersaccounted for approximately 58% of accounts receivable at December 31, 2011 and no one customer accounted for more than 13% of the accounts receivable balance. Ourtrade accounts primarily represent unsecured receivables. Historically, our bad debt write-offs related to these trade accounts have been insignificant. Inventory Inventories are valued at the lower of weighted average cost or market value. Our industry experiences changes in technology, changes in market value and availability of rawmaterials, as well as changing customer demand. We make provisions for estimated excess and obsolete inventories based on regular audits and cycle counts of our on-handinventory levels and forecasted customer demands and at times additional provisions are made. Any inventory write offs are charged to the reserve account. As of December30, 2011, we had a reserve for potentially obsolete inventory of $160,000. Property and Equipment Property and equipment are stated at cost. Assets held under capital leases are recorded at lease inception at the lower of the present value of the minimum lease payments orthe fair market value of the related assets. We follow the practice of capitalizing property and equipment purchased over $5,000. The cost of ordinary maintenance and repairsis charged to operations. Depreciation and amortization are computed on the straight-line method over the following estimated useful lives of the related assets:

Table of Contents Financial Statements
Probe Manufacturing, Inc.
Notes to Financial Statements – (Continued)
Furniture and fixtures 3 to 7 years Equipment 7 to 10 years Leasehold improvements 2 years (life of the lease) Long –Lived Assets Our management assesses the recoverability of its long-lived assets by determining whether the depreciation and amortization of long lived assets over their remaining livescan be recovered through projected undiscounted future cash flows. The amount of long-lived asset impairment if any, is measured based on fair value and is charged tooperations in the period in which long-lived assets impairment is determined by management. There can be no assurance however, that market conditions will not change ordemand for our services will continue, which could result in impairment of long-lived assets in the future. Revenue Recognition Revenue from product and services are recognized at the time goods are shipped or services are provided to the customer, with an appropriate provision for returns andallowances. Terms are generally FOB origination with the right of inspection and acceptance. We have not experienced a material amount of rejected or damaged product. The Company provides services for its customers that range from contract design to original product design to repair services. The Company recognizes service revenue whenthe services have been performed, and the related costs are expensed as incurred. Fair Value of Financial Instruments The carrying amount of accounts payable and accrued expenses are considered to be representative of their respective fair values because of the short-term nature of thesefinancial instruments. Other Comprehensive Income We have no material components of other comprehensive income (loss) and accordingly, net loss is equal to comprehensive loss in all periods. Net Profit / (Loss) per Common Share Basic profit /(loss) per share is computed on the basis of the weighted average number of common shares outstanding. At December 31, 2011, we had outstanding commonshares of 197,659,056 used in the calculation of basic earnings per share. Basic Weighted average common shares and equivalents at December 31, 2011 and 2010 were190,315,404 and 184,638,320 respectively. As of December 31, 2011, we had outstanding warrants to purchase 10,682,955 additional common shares and options to purchase1,103,861 additional common shares. Fully diluted weighted average common shares and equivalents for the years ended 2011 and 2010 were 202,069,928 and 203,639,511respectively. Research and Development Research and Development Costs incurred in association with the alternative fuels technology development (which include salaries and equipment) were expensed asincurred. We expensed $0 in R&D during the years ended December 31, 2011 and 2010.
Table of Contents Financial Statements
Probe Manufacturing, Inc.
Notes to Financial Statements – (Continued)
Segment Disclosure FASB Codification Topic 280, Segment Reporting, establishes standards for reporting financial and descriptive information about an enterprise’s reportable segments. Wehave determined that we have one reportable segment, with contract electronics manufacturing. As such, our operations have been aggregated into one reportable segment forall periods presented. Share Based Compensation The company has adopted the use of Statement of Financial Accounting Standards No. 123R, “Share-Based Payment” (SFAS No. 123R) (now contained in FASBCodification Topic 718, Compensation-Stock Compensation), which supersedes APB Opinion No. 25, “Accounting for Stock Issued to Employees”, and its relatedimplementation guidance and eliminates the alternative to use Opinion 25’s intrinsic value method of accounting that was provided in Statement 123 as originally issued. ThisStatement requires an entity to measure the cost of employee services received in exchange for an award of an equity instruments, which includes grants of stock options andstock warrants, based on the fair value of the award, measured at the grant date, (with limited exceptions). Under this standard, the fair value of each award is estimated on thegrant date, using an option-pricing model that meets certain requirements. We use the Black- Scholes option-pricing model to estimate the fair value of our equity awards,including stock options and warrants. The Black-Scholes model meets the requirements of SFAS No. 123R; however, the fair values generated may not reflect their actual fairvalues, as it does not consider certain factors, such as vesting requirements, employee attrition and transferability limitations. The Black-Scholes model valuation is affectedby our stock price and a number of assumptions, including expected volatility, expected life, risk-free interest rate and expected dividends. We estimate the expected volatilityand estimated life of our stock options at grant date based on historical volatility; however, due to the thinly traded nature of our stock, we have chosen to use an average ofthe annual volatility of like companies in our industry. For the “risk-free interest rate”, we use the Constant Maturity Treasury rate on 90 day government securities. The termis equal to the time until the option expires. The dividend yield is not applicable, as the company has not paid any dividends, nor do we anticipate paying them in theforeseeable future. The fair value of our restricted stock is based on the market value of our free trading common stock, on the grant date calculated using a 20 trading dayaverage. At the time of grant, the share based-compensation expense is recognized in our financial statements based on awards that are ultimately expected to vest usinghistorical employee attrition rates and the expense is reduced accordingly. It is also adjusted to account for the restricted and thinly traded nature of the shares. The expense isreviewed and adjusted in subsequent periods if actual attrition differs from those estimates. We re-evaluate the assumptions used to value our share-based awards on a quarterly basis and if changes warrant different assumptions, the share-based compensation expensecould vary significantly from the amount expensed in the past. We may be required to adjust any remaining share-based compensation expense, based on any additions,cancellations or adjustments to the share based awards. The expense is recognized over the period during which an employee is required to provide service in exchange for theaward—the requisite service period (usually the vesting period). No compensation cost is recognized for equity instruments for which employees do not render the requisiteservice. For the years ended December 31, 2011 and 2010 we had $40,764 and 26,694, respectively, in share based expense, due to the issuance of our options and warrants. As of December 31, 2011 we had $0 in non-vested expense to be recognized. Income Taxes The Company accounts for income taxes under SFAS No. 109 (now contained in FASB Codification Topic 740-10-25, Accounting for Uncertainty in Income Taxes), whichrequires the asset and liability approach to accounting for income taxes. Under this method, deferred tax assets and liabilities are measured based on differences betweenfinancial reporting and tax bases of assets and liabilities measured using enacted tax rates and laws that are expected to be in effect when differences are expected to reverse.As of December 31, 2011, we had a net operating loss carry forward of $(238,482) and a deferred tax asset of $81,084 using the statutory rate of 34%. The deferred tax assetmay be recognized in future periods, not to exceed 20 years. However, due to the uncertainty of future events we have booked valuation allowance of $81,084.

Table of Contents Financial Statements
Probe Manufacturing, Inc.
Notes to Financial Statements – (Continued)
December 31, 2011Deferred Tax Asset $ 81,084Valuation Allowance (81,084)Deferred Tax Asset (Net) $ -
NOTE 3 – INVENTORY Inventories by major classification were comprised of the following at:
December 31, 2011 December 31, 2010Raw Material $ 601,214 $ 513,345Work in Process 249,872 101,092Finished Goods 2,441 2,697Total 853,528 617,134Less Reserve for excess or obsolete inventory (160,000) (170,000)Total Inventory $ 693,528 $ 447,134
NOTE 4 – PROPERTY AND EQUIPMENT Property and equipment were comprised of the following at:
December 30, 2011 December 31, 2010Furniture and fixtures $ 33,558 $ 33,558Equipment 1,937,815 1,888,740Leasehold improvements 36,686 36,686Total 2,008,059 1,958,984Accumulated Depreciation (1,880,967) (1,845,319)Net Fixed Assets $ 127,092 $ 113,665
NOTE 5 – ACCRUED EXPENSES
December 31, 2011 December 30, 2010 Accrued Wages $ 89,704 $ 195,936 Accrued Interest 3,552 2,400 Accrued Professional Fees - 4,350 Accrued Other 3,345 7,960 State Income Tax Payable 14,638 - Accrued Rent 52,190 59,190 Accrued Vacation 24,653 12,393 Total Accrued Expenses $ 188,082 $ 282,229

Table of Contents Financial Statements
Probe Manufacturing, Inc.
Notes to Financial Statements – (Continued) NOTE 7 - CAPITAL LEASE SETTLEMENT OBLIGATIONS On July 9, 1997 and December 21, 1997, we entered into two lease agreements, with Crocker capital, which subsequently assigned the leases to The CIT Group. In September2004, we had outstanding balances of $457,604 and $556,293 on the two leases and were unable to make the monthly lease payments. As a result, we entered into a forbearance agreement with The CIT Group, with monthly payments of $7,500,which was amended on June 1, 2007. On April 9, 2010 we entered into an agreement with CIT to settle the balance in full for $70,000, as a result we realized a gain of $190,960. As of December 31, 2011 thebalance due to CIT was $0. NOTE 8 – NOTES PAYABLE Related Party – Notes payable Note Payable - On June 23, 2011 we entered short term $70,000 demand note to B&S Development Group, LLC. The term of this note is four month due on October 23, 2010with an interest rate of %15 percent per annum. This note required the payment of a 12% due diligent fee to be amortized over the life of the note. Total payments for interestand due diligent fees are $3,000 per month. Bijan Israel is one of our largest shareholders; beneficially owning 69,959,347 shares of common stock. On February 17, 2010 thebalance of this note was paid in full. As of December 31, 2011 the outstanding balance was zero. Notes payable Note Payable. This is a term note payable, unsecured, dated November 03, 2009 payable to Linwood Goddard at a 12.00% interest rate, with a 36 month amortization andmonthly payments of $334.14. As of December 31, 2011 the balance was $4,332. Note Payable. This is a term note payable, unsecured, dated December 24, 2009 payable to Linwood Goddard at a 12.00% interest rate, with a 36 month amortization andmonthly payments of $334.14. As of December 31, 2011 the balance was $4,332. NOTE 9 – COMMITMENTS AND CONTIGENCIES Operating Rental Leases On October 14, 2009 we entered into a 5 year lease with Bernard family trust, with a commencement date of December 31, 2009. The facility is approximately 19,701 squarefeet and located at 17475 Gillette, Irvine CA, 92614.
On March 28, 2011 we signed an amendment to our facility lease with an increase of 1,600 square feet. The increase in the lease commences on April 1, 2011 and continuesthrough year five. The amended lease has the following payments:
Original Lease Amended lease
Year Monthly Rent Monthly Rent1 7,880 7,8802 9,850 10,6503 10,835 11,7154 11,820 12,7805 12,805 13,845

Table of Contents Financial Statements
Probe Manufacturing, Inc.
Notes to Financial Statements – (Continued)
NOTE 10 – CAPITAL STOCK TRANSACTIONS On April 21, 2005, our Board of Directors and shareholders approved the following capital stock transactions: We re-domiciled in the state of Nevada, whereby increasing the number of authorized common shares to 200,000,000 and designating a par value of $.001 per share. On May 25, 2006, our Board of Directors and shareholders approved the following capital stock transactions: An amendment to the Articles of Incorporation of the Company authorizing a new series of Preferred stock, which shall be designated as Series C, and shall consist of 15,000shares. Stock Repurchase Program
On November 1, 2011, the Company adopted a plan to repurchase up to 5,000,000 shares of its issued and outstanding common stock in accordance with the guidelinesspecified in Rule 10b-18 and Rule 10b5-1 of the Securities Exchange Act of 1934, as amended.
The plan allows the Company to purchase its issued and outstanding common shares in the open market or in negotiated transactions, from time to time, depending on marketconditions and other factors as well as being subject to relevant rules under Untied States securities regulations. The plan does not obligate the Company to make anypurchases, at any specific time or in any particular situation. The plan may be suspended or discontinued at any time at the sole discretion of the Company. Share repurchaseswill be funded with the Company's available cash, after determining the working capital requirements of the Company. Accordingly, there is no guarantee as to the exactnumber of shares that will be repurchased under the plan.
The company's Board of Directors authorized the repurchase plan because it believes recent market conditions may have caused the Company's common stock to beundervalued. The timing and number of any shares repurchased will depend on the terms and conditions of the plan and no assurance can be given that any specific amount ofcommon stock will be repurchased.
As of December 31, 2011, we had repurchased 115,000 shares of our common stock.
Common Stock Transactions For the years ended December 31, 2011 and 2010, we issued the following securities without registration under the Securities Act of 1933, as amended. These securities wereissued on the reliance of an exemption provided by Section 4(2) of the Securities Act. On June 29, 2011, we issued 1,000,000 shares to our Chief Financial Officer for service and employment with the company during the year ended December 31, 2010. Theseshares were accrued for during 2010 and were accounted for in our financial statements but the stock certificate was not physically issued until the date stated herein. On June 29, 2011, we issued 1,000,000 shares to our Vice-President of Quality Control for service and employment with the company during the year ended December 31,2010. These shares were accrued for during 2010 and were accounted for in our financial statements but the stock certificate was not physically issued until the date statedherein.

Table of Contents Financial Statements
Probe Manufacturing, Inc.
Notes to Financial Statements – (Continued) On June 29, 2011, we issued 1,250,000 shares for business consulting services performed on behalf of the company during the year ended December 31, 2010. These shareswere accrued for during 2010 and were accounted for in our financial statements but the stock certificate was not physically issued until the date stated herein.
On June 29, 2011, we issued 500,000 shares for to a board of directors’ advisor for advisory services performed on behalf of the company during the year ended December 31,2011. On June 29, 2011, we issued 500,000 shares to our independent director for his board service during the year ended December 31, 2011. On September 1, 2011, we issued 1,000,000 shares as an initial tranche for website design consulting services performed during the first three quarters of 2011. In addition, onOctober 2, 2011, we issued another 1,000,000 said services to be performed for the remainder of 2011. On October 4, 2011 we issued 500,000 shares for business consulting services performed on behalf of the company during the first three quarters of 2011. On December 1, 2011, we issued 2,000,000 shares for website optimization consulting services. Common Stock Our Articles of Incorporation authorize us to issue 200,000,000 shares of common stock, par value $0.001 per share. As of December 31, 2011 and 2010 there were197,659,056 and 184,638,320 shares of common stock issued and outstanding, respectively. All outstanding shares of common stock are, and the common stock to be issuedwill be, fully paid and non-assessable. Each share of our common stock has identical rights and privileges in every respect. The holders of our common stock are entitled tovote upon all matters submitted to a vote of our shareholders and are entitled to one vote for each share of common stock held. There are no cumulative voting rights. The holders of our common stock are entitled to share equally in dividends and other distributions that our Board of Directors may declare from time to time out of fundslegally available for that purpose, if any, after the satisfaction of any prior rights and preferences of any outstanding preferred stock. If we liquidate, dissolve or wind up, theholders of common stock shares will be entitled to share ratably in the distribution of all of our assets remaining available for distribution after satisfaction of all our liabilitiesand our obligations to holders of our outstanding preferred stock. Preferred Stock Our Articles of Incorporation authorize us to issue 10,000,000 shares of preferred stock. We authorized 440 shares of Series A Convertible Preferred Stock and 20,000 sharesof Series B Convertible Preferred Stock. On May 25, 2006 the Articles of Incorporation were amended authorizing 15,000 shares Series C Convertible Preferred Stock. As of August 20, 2006 all preferred stock has been converted into Common stock and there are no outstanding preferred shares as of December 31, 2011. Our Board of Directors has the authority to issue additional shares of preferred stock in one or more series, and fix for each series, the designation of and number of shares tobe included in each such series. Our Board of Directors is also authorized to set the powers, privileges, preferences, and relative participating, optional or other rights, if any,of the shares of each such series and the qualifications, limitations or restrictions of the shares of each such series.

Table of Contents Financial Statements
Probe Manufacturing, Inc.
Notes to Financial Statements – (Continued) Unless our Board of Directors provides otherwise, the shares of all series of preferred stock will rank on parity with respect to the payment of dividends and to the distributionof assets upon liquidation. Any issuance by us of shares of our preferred stock may have the effect of delaying, deferring or preventing a change of our control or anunsolicited acquisition proposal. The issuance of preferred stock also could decrease the amount of earnings and assets available for distribution to the holders of commonstock or could adversely affect the rights and powers, including voting rights, of the holders of common stock. Warrants Series A - Common Stock Warrants We currently have 1,192,875 Series A Warrants issued and outstanding. Each warrant gives the holder the right to purchase 5 shares of common stock (5,964,375 total shares)at $0.33 per share. The Series A Warrants expired on November 15, 2011. Series B - Common Stock WarrantsWe currently have 1,192,875 Series B Warrants issued and outstanding. Each warrant gives the holder the right to purchase 5 shares of common stock (5,964,375 total shares)at $0.50 per share. The Series B Warrants will expire on May 15, 2012. Series C – Common Stock WarrantsWe currently have 600,000 Series C Warrants issued and outstanding. Each warrant gives the holder the right to purchase 1 shares of common stock (600,000 total shares) at$0.267 per share. The Series C Warrants expired on November 5, 2010. Series D – Common Stock warrants We currently have 1,718,580 Series D Warrants issued and outstanding. Each warrant gives the holder the right to purchase 1 share of common stock (1,718,580 total shares)at $0.133 per share. The Series D Warrants expire on November 5, 2012. For the year ended December 31, 2008 and 2009, we recognized share based compensation expense of $14,403 and $8,232, respectively from the issuance of options andWarrants. Series E – Common Stock warrants On April 8, 2011, we issued 3,000,000 series E Warrants. Each warrant gives the holder the right to purchase 1 share of common stock (3,000,000 total shares) at $0.05 pershare. The Series E Warrants expire on April 8, 2016, as a result we recognized $6,600 in share based expense.

Table of Contents Financial Statements
Probe Manufacturing, Inc.
Notes to Financial Statements – (Continued) A summary of warrant activity for the periods is as follows:
Warrants - CommonShare Equivalents
Weighted AverageExercise price
Warrantsexercisable -
Common ShareEquivalents
Weighted AverageExercise price
Outstanding December 31, 2008 14,247,330 0.38 14,247,330 0.38 Granted - - - - Exercised - - - Outstanding December 31, 2009 14,247,330 0.38 14,247,330 0.38 Granted - - - - Expired C - Warrants 600,000 0.27 600,000 0.27 Exercised - - - Outstanding December 31, 2010 13,647,330 0.38 13,647,330 0.38 Granted 3,000,000 0.05 3,000,000 0.05 Expired 5,964,375 0.33 5,964,375 0.33 Exercised - - - Outstanding December 31, 2011 10,682,955 0.31 10,682,955 0.31
Note: The weighted average exercise price has been adjusted retroactively due to price decreases in the warrant strike prices.
Warrants Outstanding Warrants Exercisable
Range of Warrant Exercise Price
Warrants -Common Share
EquivalentsWeighted Average
Exercise price
Weighted AverageRemaining
Contractual life inyears
Warrants -Common Share
EquivalentsWeighted Average
Exercise price$0.33 $0.33 Expired - $0.33$0.50 5,964,375 $0.50 0.46 5,964,375 $0.50$0.13 $0.13 Expired $0.13$0.13 1,718,580 $0.13 0.85 1,718,580 $0.13$0.05 3,000,000 $0.05 4.27 3,000,000 $0.05
Total 10,682,955 $0.31 10,682,955 $0.31

Table of Contents Financial Statements
Probe Manufacturing, Inc.
Notes to Financial Statements – (Continued) Stock Options On February 8, 2007 pursuant to our 2006 Qualified Incentive Option Plan which was adopted by our Board of Directors granted Company employees an incentive stockoption to purchase up to 652,766 shares of our common stock. These options were granted at $.173 cents, the fair market value of the Company at the time of the grant. Theseoptions expire on February 8, 2017. During the fiscal year 2009 we had a reduction in the outstanding stock options of 403,779 as a result of employee termination andforfeiture of the options. As of December 31, 2011, there were 203,861 outstanding options under this plan. On February 8, 2008, we granted stock options to its key employees, to purchase up to 750,000 shares of our common stock, which was approved by our Board of Directors.These options were granted at $.173 cents, the fair market value of the Company at the time of the grant. These options expire on February 8, 2017. As a result, we recognizedshare-based compensation expense in the amount of $5,313 for the year ended December 31, 2007, $2,657 for the year ended December 31, 2008; $2,656 for the year endedDecember 31, 2009; $2,656 for the year ended December 31, 2010 and $0 for the year ended December 31, 2011. As of December 31, 2011 the balance of the outstandingoptions under this plan is 600,000. On February 28, 2008 our granted stock options to a key employee, to purchase up to 300,000 shares of our common stock, which was approved by our Board of Directors.These options were granted at $.033 cents, the fair market value of the Company at the time of the grant. These options expire on February 8, 2017. As a result, we recognizedshare-based compensation expense in the amount of $5,574 for year ended December 31, 2008; $5,576 for the year ended December 31, 2009; $2,786 for the year endedDecember 31, 2010; and $0 for the year ended December 31, 2011.
NOTE 11 – RELATED PARTY TRANSACTIONS Note Payable - On June 23, 2010 we entered short term $70,000 demand note to B&S Development Group, LLC. The term of this note is four month due on October 23, 2010with an interest rate of 15.00% per annum. This note required the payment of a 12% due diligent fee to be amortized over the life of the note. Total payments for interest anddue diligent fees are $3,000 per month. Bijan Israel the managing member of B&S Development Group, LLC and is also a managing member of KB Development Group,LLC. KB Development Group is the largest shareholder of the company at 69,959,347 shares. As of December 31, 2010 the outstanding balance was $70,000. On February17, 2010 the balance of this note was paid in full.
Kambiz Mahdi, our Chief Executive Officer, owns Billet Electronics, which is an independent distributor of electronic components. From time to time we purchase parts fromBillet Electronics. In addition, from time to time we provide assembly and value added services to Billet Electronics. In addition Billet was a supplier of parts and haddealings with current and former customers of our company. Our board of directors has approved such transactions of our chief executive officer. On June 26, 2011 we issued 1,000,000 shares of common stock to John Bennett, our Chief Financial Officer, as additional compensation for 2010, these shares werepreviously accrued and to be issued.
On June 26, 2011 we issued 500,000 shares of common stock to Shervin Talich for Board of Director fees for April 2011 through March 2012.
NOTE 12 – SUBSEQUENT EVENTS – (Un-audited) None.

Table of Contents Financial Statements
Item 9. Changes in and Disagreements with Accountants on Accounting and Financial Disclosure. None. Item 9a. Controls and Procedures. (a) Evaluation of Disclosure Controls and Procedures We maintain disclosure controls and procedures that are designed to ensure that information required to be disclosed in our reports pursuant to the Securities Exchange Act, of1934, as amended, or the Exchange Act, is recorded, processed, summarized and reported within the time periods specified in the rules and forms, and that such information isaccumulated and communicated to us, including our chief executive officer and chief financial officer, as appropriate, to allow timely decisions regarding required disclosure.
As required by Rules 13a-15(b) of the Exchange Act, an evaluation as of December 31, 2011 was conducted under the supervision and with the participation of ourmanagement, including our chief executive officer and chief financial officer, of the effectiveness of our disclosure controls and procedures, as defined in Rules 13a-15(e) and15d-15(e) under the Exchange Act. Based upon that evaluation, our chief executive officer and chief financial officer concluded that our disclosure controls and procedureswere effective as of December 31, 2011.
(b) Report of Management on Internal Control over Financial Reporting
We are responsible for establishing and maintaining adequate internal control over financial reporting. Internal control over financial reporting is defined in Rule 13a-15(f) and15d-15(f) of the Exchange Act. Under the supervision and with the participation of our management including our of our chief executive officer and principal financial officer,we conducted an evaluation of the effectiveness of our internal control over financial reporting based on the framework in Internal Control-Integrated Framework issued bythe Committee of Sponsoring Organizations of the Treadway Commission, or COSO Based on our evaluation under the Internal Control-Integrated Framework, our chief executive officer and chief financial officer concluded that our internal control overfinancial reporting was effective as of December 31, 2011. (c) Changes in Internal Control over Financial Reporting
There have been no other changes in our internal control over financial reporting that occurred during the period covered by this Annual Report on Form 10-K for the yearended 2011, that have materially affected, or are reasonably likely to materially affect, our internal control over financial reporting. Item 9b. Other Information. None.
PART III
Item 10. Directors, Executive Officers and Corporate Governance
Director QualificationsWe believe that our Board of Directors should encompass a diverse range of talent, skill and expertise sufficient to provide sound and prudent guidance with respect to ouroperations and interests. Each director also is expected to: exhibit high standards of integrity, commitment and independence of thought and judgment; use his or her skills andexperiences to provide independent oversight to our business; participate in a constructive and collegial manner; be willing to devote sufficient time to carrying out their dutiesand responsibilities effectively; devote the time and effort necessary to learn our business; and represent the long-term interests of our Shareholders. Furthermore, we believeour Board of Directors should

Table of Contents Financial Statements
be comprised of persons with skills in areas such as: finance, electronic manufacturing, leadership of business organizations and legal matters.In addition to the targeted skill areas as noted above, we endeavor to select members of our Board of Directors which have a strong record of achievement in key knowledgeareas that are critical for directors to add value to our Board of Directors, including:
· Strategy � knowledge of our business model, the formulation of corporate strategies, knowledge of key competitors and markets;
· Relationships � understanding how to interact with investors, accountants, attorneys, management companies, and markets in which we operate; and
· Functional � understanding of finance matters, financial statements and auditing procedures, technical expertise, legal issues and marketing.
Our Directors Kambiz Mahdi, age 46, Kambiz Mahdi is co-founder, and served as President and Chief Executive Officer of Probe Manufacturing from 1996 until December of 2005 andagain from July 2009 until present. Prior to Probe Manufacturing, Mr. Mahdi was Technical Sales Manager at Future Electronics for six years. While at Future Electronics,Mr. Mahdi developed superior technical management leadership and skills servicing some of the top 1000 fortune technology customers and their applications. Mr. Mahdi alsostarted Billet Electronics a global supply chain provider of products, services and solutions in the technology sector in 2007. He has established the company as a leadingindependent distributor of electronic components and provider of value-added services to its market. Mr. Mahdi has a BS degree in Electrical Engineering from CaliforniaState University of Northridge. Mr. Mahdi has not served on any other boards of public companies in the past five years.
Our Board of Directors selected Mr. Mahdi to serve as a director because he is our Chief Executive Officer and has served in various executive roles with our company for14 years, with a focus on electrical manufacturing, sales and operations. Mr. Mahdi has profound insight into the development, marketing, finance, and operations aspects ofour company. He has expansive knowledge of the electronic manufacturing industry and relationships with chief executives and other senior management at companies in thesame or complimentary industries. Our Board of Directors believes that Mr. Mahdi brings a unique and valuable perspective to our Board of Directors.
John Bennett, age 51, John Bennett has been with Probe Manufacturing since February 2005, as the Chief Financial Officer. He has been in the Electronic manufacturingIndustry for 22 years. He has held positions as the Controller, Vice President of Finance and Chief Financial Officer, with experience in Contract Manufacturing of PrintedCircuit Board Assembly, Cable and Harness Assembly, Box Builds and Battery & Charger assembly. He holds a Bachelor of Science in Accounting from Mesa University anda Master of Science in Finance from the University of Colorado. Mr. Bennett has not served on any other boards of public companies in the past five years. Our Board of Directors selected Mr. Bennett to serve as a director because he is our Chief Financial Officer and has been with our company for more than six years, where hisprimary focus has been on the financial systems and operations and SEC reporting of the company. He has significant knowledge of, and relationships within, the electronicmanufacturing industry, due in part to the 22 years he has spent working in the industry. Our Board of Directors believes that his executive experience in the electronicmanufacturing coupled with his deep knowledge of our company’s strategies and operations will bring strong financial and operational expertise to our Board of Directors. Shervin Talieh, age 44, Shervin Talieh has over 17 years of hands-on experience building and growing organizations that provide solutions to clients in various sectors. Thisexperience has been developed across many functions, including corporate strategy, business development, marketing, branding, alliances, and operations; in small and largefirms, through startups, turnarounds, and stable environments alike. Mr. Talieh started his career by successfully building, growing and selling his consulting startup, IndexData. Most recently, Mr. Talieh is the founder and CEO of Drumbi, an Internet technology startup focused on data and voice synchronization. At Drumbi, he guides thecompany's strategy, fund-raising, and operations. Prior to Drumbi, Mr. Talieh served at Vice President, Business Development for Goldeneye Solutions, a SaaS

Table of Contents Financial Statements
technology company. This was preceded by his tenure at Accenture, where he was a Partner in the Los Angeles Office, and a member of the executive team responsible forover 700 professionals in the region. Mr. Talieh has not served on any other boards of public companies in the past five years. Our Board of Directors selected Mr. Talieh to serve as a director due to his strong relationships and understanding of the operations of technology companies. Mr. Talieh’svast experience in business operations enhances his ability to contribute insight on achieving business success in a diverse range of economic conditions and competitiveenvironments. Our Board of Directors believes that this experience will bring valuable knowledge and insight to our company.
Corporate Governance Director Attendance at Meetings of the Board of Directors Our Board of Directors held 3 meetings during the fiscal year ended December 31, 2011. Each of our incumbent directors attended at least 75.0% of the aggregate totalnumber of meetings of our Board of Directors held during the period for which he served as a director. Director Attendance at Annual Meetings of the Shareholders
Although we have no policy with regard to attendance by the members of our Board of Directors at our annual meetings, we invite and encourage the members of our Boardof Directors to attend our annual meetings to foster communication between Shareholders and our Board of Directors. Stockholder Communication with the Board of Directors Any stockholder who desires to contact members of our Board of Directors, or a specified committee of our Board of Directors, may do so by writing to: ProbeManufacturing, Inc., Board of Directors, 17475 Gillette Ave., Irvine, California 92614, Attention: Secretary. Communications received will be distributed by our Secretary tosuch member or members of our Board of Directors as deemed appropriate by our Secretary, depending on the facts and circumstances outlined in the communicationreceived. Director Independence We have a three-member Board of Directors. Due to the size of our company and the difficulty in finding directors that are competent or have experience in our industry, onlyone of our directors can be deemed an “independent director.”
While our stock is not listed on the New York Stock Exchange, our independent director would qualify as independent under the rules of the New York Stock Exchange. Board Leadership Structure; Independent Lead Director Kambiz Mahdi serves as both our Chairman of the Board of Directors and Chief Executive Officer. Our Board of Directors has determined that the most effective leadershipstructure for our company at the present time is for our Chief Executive Officer to also serve as our Chairman of the Board of Directors. Our Board believes that because ourChief Executive Officer is ultimately responsible for our day-to-day operations and for executing our business strategy, and because our performance is an integral part of thedeliberations of our Board of Directors, our Chief Executive Officer is the director best qualified to act as Chairman of the Board of Directors. Our Board of Directors retainsthe authority to modify this structure to best address our unique circumstances, and so advance the best interests of all shareholders, as and when appropriate. In addition,although we do not have a lead independent director, our Board of Directors believes that the current structure is appropriate, due to the current size of our operations. Our Board of Directors also believes, for the reasons set forth below, that its existing corporate governance practices achieve independent oversight and managementaccountability, which is the goal that many companies seek to achieve by separating the roles of Chairman of the Board of Directors and Chief Executive Officer. Ourgovernance practices provide for strong independent leadership, independent discussion among directors and for independent evaluation of, and communication with,members of senior management. These governance practices are reflected in our Code of Business Conduct and Ethics, or our Code of Ethics.
Table of Contents Financial Statements
Committees of our Board of Directors We have no standing committees of our Board of Directors at the current time, which is again due to the size of our operations. From time to time, our Board of Directors mayestablish committees it deems appropriate to address specific areas in more depth than may be possible at a full Board of Directors meeting. As our company grows, we planto establish an audit committee, compensation committee and nominating and corporate governance committee. The functions that these committees will perform arecurrently being performed by our three-member Board. Director Nomination Procedures and Diversity As outlined above, in selecting a qualified nominee, our Board of Directors considers such factors as it deems appropriate, which may include: the current composition of ourBoard of Directors; the range of talents of a nominee that would best complement those already represented on our Board of Directors; the extent to which a nominee woulddiversify our Board of Directors; a nominee’s standards of integrity, commitment and independence of thought and judgment; a nominee’s ability to represent the long-terminterests of our shareholders as a whole; a nominee’s relevant expertise and experience upon which to be able to offer advice and guidance to management; a nominee who isaccomplished in his or her respective field, with superior credentials and recognition; and the need for specialized expertise. While we do not have a formal diversity policy,we believe that the backgrounds and qualifications of our directors, considered as a group, should provide a significant composite mix of experience, knowledge and abilitiesthat will allow our Board of Directors to fulfill its responsibilities. Applying these criteria, our Board of Directors considers candidates for membership on our Board ofDirectors suggested by its members, as well as by our Shareholders. Members of our Board of Directors annually review our Board of Directors’ composition by evaluatingwhether our Board of Directors has the right mix of skills, experience and backgrounds. Our Board of Directors may also consider an assessment of its diversity, in itsbroadest sense, reflecting, but not limited to, age, geography, gender and ethnicity.
Our Board of Directors identifies nominees by first evaluating the current members of our Board of Directors willing to continue in service. Current members of our Board ofDirectors with skills and experience relevant to our business and who are willing to continue in service are considered for re-nomination. If any member of our Board ofDirectors does not wish to continue in service or if our Board of Directors decides not to nominate a member for re-election, our Board of Directors will review the desiredskills and experience of a new nominee in light of the criteria set forth above.
Our Board of Directors also considers nominees for our Board of Directors recommended by Shareholders. Notice of proposed stockholder nominations for our Board ofDirectors must be delivered in accordance with the requirements set forth in our bylaws and SEC Rule 14a-8 promulgated under the Securities Exchange Act of 1934, asamended, or the Exchange Act. Nominations must include the full name of the proposed nominee, a brief description of the proposed nominee’s business experience for atleast the previous five years and a representation that the nominating stockholder is a beneficial or record owner of our common stock. Any such submission must beaccompanied by the written consent of the proposed nominee to be named as a nominee and to serve as a director if elected. Nominations should be delivered to: ProbeManufacturing, Inc., Board of Directors, 17475 Gillette Ave., Irvine, California 92614, Attention: Chief Executive Officer. Our Board of Directors will recommend the slate of directors to be nominated for election at the annual meeting of shareholders. We have not and do not currently employ orpay a fee to any third party to identify or evaluate, or assist in identifying or evaluating, potential director nominees. Board of Directors Role in Risk Oversight Our Board of Directors oversees our shareholders’ interest in the long-term success of our business strategy and our overall financial strength.
Our Board of Directors is actively involved in overseeing risks associated with our business strategies and decisions. It does so, in part, through its approval of all acquisitionsand business-related investments and all assumptions of debt, as well as its oversight of our executive officers pursuant to annual reviews. Our Board of Directors is alsoresponsible for overseeing risks related to corporate governance and the selection of nominees to our Board of Directors. In addition, the Board reviews the potential risks related to our financial reporting. The Board meets with our Chief Financial Officer and with representatives of ourindependent registered public accounting firm on a quarterly basis to discuss and
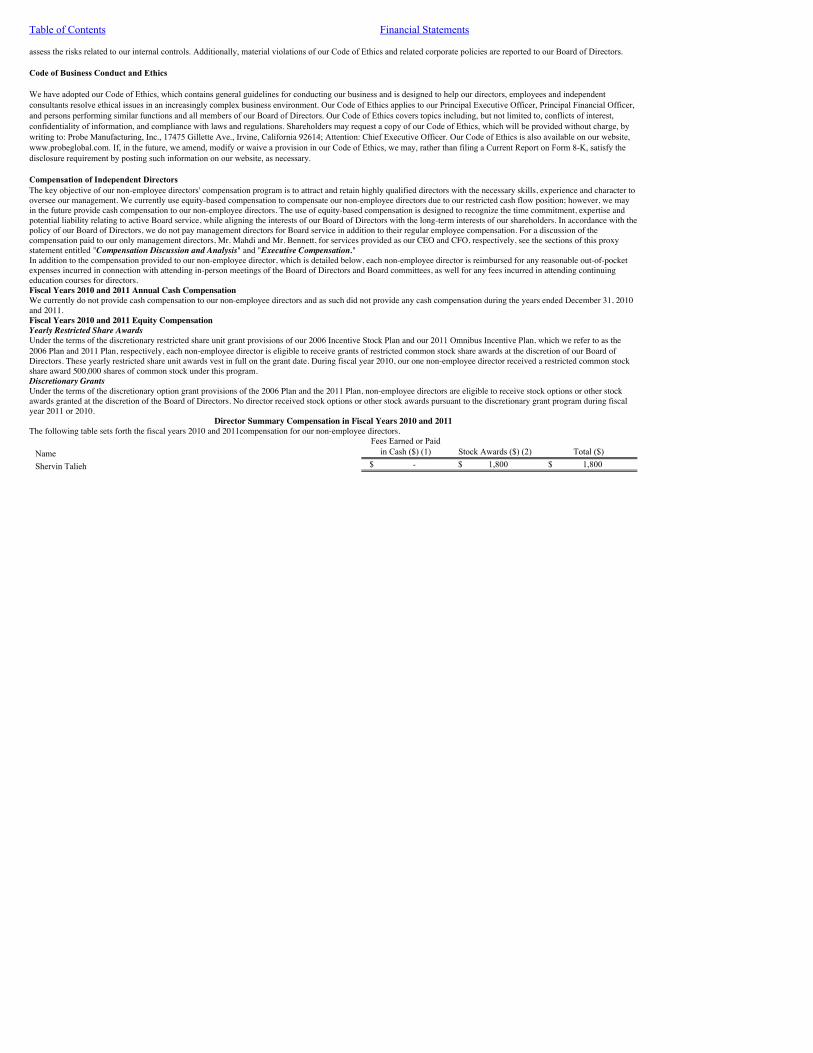
Table of Contents Financial Statements
assess the risks related to our internal controls. Additionally, material violations of our Code of Ethics and related corporate policies are reported to our Board of Directors. Code of Business Conduct and Ethics We have adopted our Code of Ethics, which contains general guidelines for conducting our business and is designed to help our directors, employees and independentconsultants resolve ethical issues in an increasingly complex business environment. Our Code of Ethics applies to our Principal Executive Officer, Principal Financial Officer,and persons performing similar functions and all members of our Board of Directors. Our Code of Ethics covers topics including, but not limited to, conflicts of interest,confidentiality of information, and compliance with laws and regulations. Shareholders may request a copy of our Code of Ethics, which will be provided without charge, bywriting to: Probe Manufacturing, Inc., 17475 Gillette Ave., Irvine, California 92614; Attention: Chief Executive Officer. Our Code of Ethics is also available on our website,www.probeglobal.com. If, in the future, we amend, modify or waive a provision in our Code of Ethics, we may, rather than filing a Current Report on Form 8-K, satisfy thedisclosure requirement by posting such information on our website, as necessary.
Compensation of Independent DirectorsThe key objective of our non-employee directors' compensation program is to attract and retain highly qualified directors with the necessary skills, experience and character tooversee our management. We currently use equity-based compensation to compensate our non-employee directors due to our restricted cash flow position; however, we mayin the future provide cash compensation to our non-employee directors. The use of equity-based compensation is designed to recognize the time commitment, expertise andpotential liability relating to active Board service, while aligning the interests of our Board of Directors with the long-term interests of our shareholders. In accordance with thepolicy of our Board of Directors, we do not pay management directors for Board service in addition to their regular employee compensation. For a discussion of thecompensation paid to our only management directors, Mr. Mahdi and Mr. Bennett, for services provided as our CEO and CFO, respectively, see the sections of this proxystatement entitled "Compensation Discussion and Analysis" and "Executive Compensation."In addition to the compensation provided to our non-employee director, which is detailed below, each non-employee director is reimbursed for any reasonable out-of-pocketexpenses incurred in connection with attending in-person meetings of the Board of Directors and Board committees, as well for any fees incurred in attending continuingeducation courses for directors.Fiscal Years 2010 and 2011 Annual Cash CompensationWe currently do not provide cash compensation to our non-employee directors and as such did not provide any cash compensation during the years ended December 31, 2010and 2011.Fiscal Years 2010 and 2011 Equity CompensationYearly Restricted Share AwardsUnder the terms of the discretionary restricted share unit grant provisions of our 2006 Incentive Stock Plan and our 2011 Omnibus Incentive Plan, which we refer to as the2006 Plan and 2011 Plan, respectively, each non-employee director is eligible to receive grants of restricted common stock share awards at the discretion of our Board ofDirectors. These yearly restricted share unit awards vest in full on the grant date. During fiscal year 2010, our one non-employee director received a restricted common stockshare award 500,000 shares of common stock under this program.Discretionary GrantsUnder the terms of the discretionary option grant provisions of the 2006 Plan and the 2011 Plan, non-employee directors are eligible to receive stock options or other stockawards granted at the discretion of the Board of Directors. No director received stock options or other stock awards pursuant to the discretionary grant program during fiscalyear 2011 or 2010.
Director Summary Compensation in Fiscal Years 2010 and 2011The following table sets forth the fiscal years 2010 and 2011compensation for our non-employee directors.
NameFees Earned or Paid
in Cash ($) (1) Stock Awards ($) (2) Total ($)
Shervin Talieh $ - $ 1,800 $ 1,800

Table of Contents Financial Statements
(1) This column represents the amount of cash compensation earned in fiscal years 2010 and 2011 for Board and committee service.(2) This column represents the grant date fair value of restricted share awards granted in fiscal years 2010 and 2011 in accordance with FASB ASC Topic 718. The grant
date fair value of restricted share unit awards is the closing price of our common stock shares on the date of grant.Change of Control and Termination ProvisionsWe currently do not having any stock options issued and outstanding to our non-employee directors. In the event of a dissolution or liquidation of the company or if we areacquired by merger or asset sale or in the event of other change of control events, no acceleration of the termination of any of the restrictions applicable to Restricted Shares,Restricted Stock Unit Awards, Options or Stock Appreciation Rights as defined in the 2011 Plan shall occur in the event of a change in control, unless otherwise provided byour Board of Directors or committee thereof, in such grant.
EXECUTIVE OFFICERS The names, ages and positions of our executive officers as of December 31, 2011 are as follows:
Name Age PositionKambiz Mahdi 46 Chief Executive Officer and ChairmanJohn Bennett 51 Chief Financial Officer and Member of Board of Directors
The biographies of Mr. Mahdi and John Bennett can be found on page 4 in this proxy statement under the heading entitled “Information about Director Nominees.”Compensation Discussion and AnalysisCompensation Philosophy and ObjectivesWe believe that the quality, skills and dedication of our executive officers are critical factors affecting the company's performance and shareholder value. Accordingly, the keyobjective of our compensation programs is to attract, retain and motivate superior executive talent while maintaining an appropriate cost structure. In addition, ourcompensation programs are designed to link a substantial component of our executives' compensation to the achievement of performance goals that directly correlate to theenhancement of shareholder value. Finally, our compensation programs are designed to have the right balance of short and long-term compensation elements to ensure anappropriate focus on operational objectives and the creation of long-term value.To accomplish these objectives, the Board of Directors has structured our compensation programs to include the following key features and compensation elements:
· base salaries, which generally are set below the median of our peer group companies and take into consideration the Company�s cash flow and revenues;
· equity-based compensation, which aligns our executives' interests with those of our shareholders and promotes executive retention; and
· in most cases, both our performance-based and service-based restricted share units will provide for vesting over four years, thereby promoting the enhancement oflong-term shareholder value and executive retention.
The Board also generally seeks to compensate its executives through determinable base cash salaries that are sensitive to the company’s cash resources but that also providefor motivational incentive and maintain continuity of management. In addition, executives are given equity awards to reward performance based on the company’s growthand economic achievements. The Board does not maintain fixed policies for allocating among current and long-term compensation or among cash and non-cash compensation.Instead, the Board maintains flexibility and adjusts different elements of compensation based upon its evaluation of the key compensation goals set forth above.
The Board seeks to maintain a balance among fixed and variable compensation, cash and equity, and annual and longer-term incentive compensation to mitigate the riskarising from any element of compensation. While compensation levels may differ among NEOs based on competitive factors, and the performance, job criticality, experienceand skill set of each specific NEO, there are no material differences in the compensation philosophies, objectives or policies for our NEOs. We do not maintain a policyregarding internal pay equity.Compensation Committee

Table of Contents Financial Statements
We currently do not have a standing compensation committee of our Board of Directors at the current time, which is again due to the size of our operations. As our companygrows, we plan to establish a compensation committee to address this specific area. The functions of a compensation committee are currently being performed by our three-member Board. Independent Consultants and Advisors The Board has the authority to retain and terminate any independent, third-party compensation consultants and to obtain advice and assistance from internal and external legal,accounting and other advisors. During our 2011 fiscal year, the Board engaged the EMCI/Hanover Group (“EMCI”), an independent third-party, as its independent adviser forcertain executive compensation matters. EMCI was retained by the Board to provide an independent review of the company's executive compensation programs, including ananalysis of both the competitive market and the design of the programs. More specifically, EMCI furnished the Board with letter reporting on the fairness of the employmentcontracts entered into with our chief executive officer and chief financial, which he reported as both fair and necessary to provide for continuity of management, motivationalincentive and economic reward, given the progress of the company for the last two fiscal years. The company paid EMCI $1,000.00 for its consulting services related to theabove mentioned advisory services.Role of Executive Officers in Compensation DecisionsSince our Board is composed of our chief executive officer and our chief financial officer, our executives are directly involved in all facets of our compensation structure andin the implementation of the long-term executive agreements entered into with our chief executive officer and our chief financial officer. However, in determining thefairness, which took into account the company’s revenue growth and the benefit to our shareholders in providing continuity of management at this critical stage in thecompany’s growth makes, the considerations and recommendations of the third independent Board member and the EMCI were heavily weighted. Fiscal Year 2010 and 2011 Executive CompensationSummary of Fiscal Year 2010 and 2011 Compensation DecisionsThe company achieved significant growth in revenue, as well as in adjusted and GAAP operating income, net income and earnings per share. We realized strong revenuegrowth across all of our market segments, maintaining a diversified and balanced business portfolio. As a result of the company's excellent performance in fiscal year 2010,we decided in 2011 to enter into long-term employment agreement with our CEO and CFO to ensure continuity of management. The agreements are discussed in this proxystatement under the heading entitled “Executive Employment Agreements.�Elements of CompensationWe may allocate compensation among the following components for our named executive officers:
· base salary;· annual incentive bonus awards;· performance-based and service-based stock incentive awards;· performance based deferred compensation; and· other benefits.
As discussed above, a key element of our compensation philosophy is that a significant portion of executive compensation is comprised of long-term elements that encourageour executives to stay with the company, which we believe provides for a stable working environment that ultimately benefits our shareholdersOther BenefitsExecutive officers are eligible to participate in all of the company's employee benefit plans, such as medical, dental, vision, group life, disability, and accidental death anddismemberment insurance, in each case on the same basis as other employees, subject to applicable law.Termination and Change of Control ArrangementsOur CEO and CFO are entitled to certain termination and change of control benefits under their employment agreements. These benefits are described and quantified under thesection entitled "Executive Compensation—Potential Payments Upon Termination or Change of Control."Compensation Risk AssessmentWith the assistance of EMCI, the Board reviewed our compensation policies and practices and determined that our compensation programs do not encourage excessive orinappropriate risk-taking. While, a majority of the Board is comprised of our executive officers, the Board believes that the design and mix of our compensation programsappropriately encourage our executive and senior officers to focus on the creation of long-term shareholder value. In its review, the Board noted the following features:

Table of Contents Financial Statements
· base salaries, which generally are set below the median of our peer group companies and take into consideration the Company�s cash flow and revenues;
· equity-based compensation, which aligns our executives' interests with those of our shareholders and promotes executive retention; and
· in most cases, both our performance-based and service-based restricted share units will provide for vesting over four years, thereby promoting the enhancement oflong-term shareholder value and executive retention.
Item 11. Executive Compensation.
The following table sets forth the fiscal year 2009, 2010 and 2011 compensation for:· Kambiz Mahdi, our Chief Executive Officer; and· John Bennett, our Chief Financial Officer; and
The executive officers included in the Summary Compensation Table are referred to in this proxy statement as our named executive officers. A detailed description of theplans and programs under which our named executive officers received the following compensation can be found in the section entitled "Compensation Discussion andAnalysis.”
Summary Compensation Table
Name andPrincipal Position Year
Salary ($)(3)
Bonus($)(4)
Stock Awards($)(5)
Option Awards
($)(6)
Non-EquityIncentive PlanCompensation
($)
Change in Pension Value andNonqualified Deferred
Compensation Earnings($)
All OtherCompensation ($)
Total ($)
Kambiz Mahdi (1) 2009 $ - $ - $ - $ - $ - $ - $ - $ -Chief ExecutiveOfficer
2010 $ 45,000 $ - $ - $ - $ - $ - $ - $ 45,000
2011 $114,222 - $ - $ - $ - $ - $ - $ - $114,222- John Bennett (2) 2009 $ 112,000 $ - $ - $ - $ - $ - $ - $ 112,000Chief FinancialOfficer
2010 $112,000 $ - $ 5,000 $ - $ - $ - $ - $ 117,000
2011 $ 112,000 $ - $ - $ - $ - $ - $ - $ 112,000
1) Information for fiscal year 2008 is not included for Mr. Mahdi, who was appointed as the chief executive officer during fiscal year. In 2009 Mr. Mahdi did not take or accrue anysalary. In 2010, Mr. Mahdi accrued $45,000 in salary and as of December 31, 2011 the outstanding balance owed is $21,500.
2) For the years 2009, 2010 and 2011, Mr. Bennett took a voluntary pay cut of 20% from $140,000 to $112,000.
3) For 2012, Mr. Mahdi’s salary will be $150,000, pursuant to his employment agreement. Mr. Bennett’s salary for 2012 will be at $140,000 and will receive 1,000,000 shares of
common stock per quarter, pursuant to his employment agreement.
4) There were no bonuses paid or accrued for any executives for fiscal years 2009, 2010 and 2011.
5) Mr. Bennett was granted 1,000,000 shares of restricted common stock valued at .005 ($5,000) as additional compensation. These shares were issued in 2011. Stock awards consistof service-based and performance-based restricted share unit awards. The
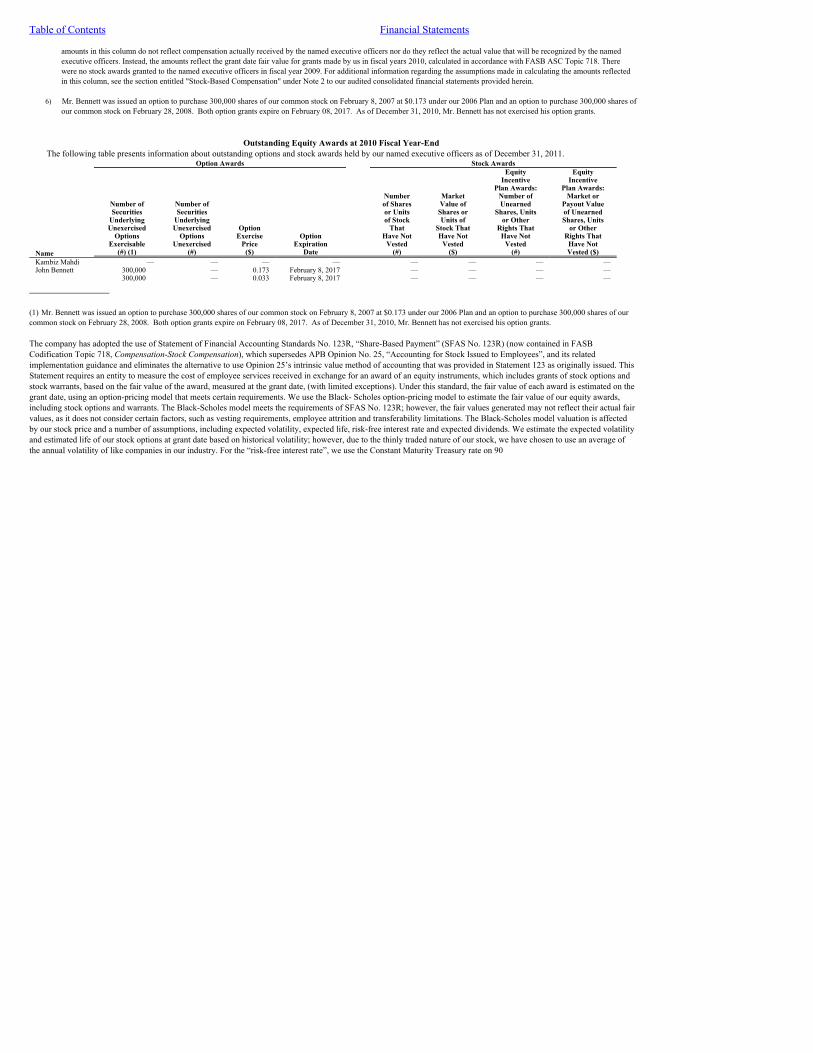
Table of Contents Financial Statements
amounts in this column do not reflect compensation actually received by the named executive officers nor do they reflect the actual value that will be recognized by the namedexecutive officers. Instead, the amounts reflect the grant date fair value for grants made by us in fiscal years 2010, calculated in accordance with FASB ASC Topic 718. Therewere no stock awards granted to the named executive officers in fiscal year 2009. For additional information regarding the assumptions made in calculating the amounts reflectedin this column, see the section entitled "Stock-Based Compensation" under Note 2 to our audited consolidated financial statements provided herein.
6) Mr. Bennett was issued an option to purchase 300,000 shares of our common stock on February 8, 2007 at $0.173 under our 2006 Plan and an option to purchase 300,000 shares of
our common stock on February 28, 2008. Both option grants expire on February 08, 2017. As of December 31, 2010, Mr. Bennett has not exercised his option grants.
Outstanding Equity Awards at 2010 Fiscal Year-End
The following table presents information about outstanding options and stock awards held by our named executive officers as of December 31, 2011. Option Awards Stock Awards Equity Equity Incentive Incentive Plan Awards: Plan Awards: Number Market Number of Market or Number of Number of of Shares Value of Unearned Payout Value Securities Securities or Units Shares or Shares, Units of Unearned Underlying Underlying of Stock Units of or Other Shares, Units Unexercised Unexercised Option That Stock That Rights That or Other Options Options Exercise Option Have Not Have Not Have Not Rights That Exercisable Unexercised Price Expiration Vested Vested Vested Have NotName (#) (1) (#) ($) Date (#) ($) (#) Vested ($)Kambiz Mahdi — — — — — — — —John Bennett 300,000 — 0.173 February 8, 2017 — — — — 300,000 — 0.033 February 8, 2017 — — — —
_______________ (1) Mr. Bennett was issued an option to purchase 300,000 shares of our common stock on February 8, 2007 at $0.173 under our 2006 Plan and an option to purchase 300,000 shares of ourcommon stock on February 28, 2008. Both option grants expire on February 08, 2017. As of December 31, 2010, Mr. Bennett has not exercised his option grants. The company has adopted the use of Statement of Financial Accounting Standards No. 123R, “Share-Based Payment” (SFAS No. 123R) (now contained in FASBCodification Topic 718, Compensation-Stock Compensation), which supersedes APB Opinion No. 25, “Accounting for Stock Issued to Employees”, and its relatedimplementation guidance and eliminates the alternative to use Opinion 25’s intrinsic value method of accounting that was provided in Statement 123 as originally issued. ThisStatement requires an entity to measure the cost of employee services received in exchange for an award of an equity instruments, which includes grants of stock options andstock warrants, based on the fair value of the award, measured at the grant date, (with limited exceptions). Under this standard, the fair value of each award is estimated on thegrant date, using an option-pricing model that meets certain requirements. We use the Black- Scholes option-pricing model to estimate the fair value of our equity awards,including stock options and warrants. The Black-Scholes model meets the requirements of SFAS No. 123R; however, the fair values generated may not reflect their actual fairvalues, as it does not consider certain factors, such as vesting requirements, employee attrition and transferability limitations. The Black-Scholes model valuation is affectedby our stock price and a number of assumptions, including expected volatility, expected life, risk-free interest rate and expected dividends. We estimate the expected volatilityand estimated life of our stock options at grant date based on historical volatility; however, due to the thinly traded nature of our stock, we have chosen to use an average ofthe annual volatility of like companies in our industry. For the “risk-free interest rate”, we use the Constant Maturity Treasury rate on 90

Table of Contents Financial Statements
day government securities. The term is equal to the time until the option expires. The dividend yield is not applicable, as the company has not paid any dividends, nor do weanticipate paying them in the foreseeable future. The fair value of our restricted stock is based on the market value of our free trading common stock, on the grant datecalculated using a 20 trading day average. At the time of grant, the share based-compensation expense is recognized in our financial statements based on awards that areultimately expected to vest using historical employee attrition rates and the expense is reduced accordingly. It is also adjusted to account for the restricted and thinly tradednature of the shares. The expense is reviewed and adjusted in subsequent periods if actual attrition differs from those estimates.
We re-evaluate the assumptions used to value our share-based awards on a quarterly basis and if changes warrant different assumptions, the share-based compensation expensecould vary significantly from the amount expensed in the past. We may be required to adjust any remaining share-based compensation expense, based on any additions,cancellations or adjustments to the share based awards. The expense is recognized over the period during which an employee is required to provide service in exchange for theaward, the requisite service period (usually the vesting period). No compensation cost is recognized for equity instruments for which employees do not render the requisiteservice. For the years ended December 31, 2010, 2009 and 2008 we had $5,000, $0 and $13,000, respectively, in share based expense to executives. For the year endedDecember 31, 2011, we had $0 in non-vested expense to be recognized. Executive Employment Agreements On September 1, 2011, the Board approved long-term executive employment agreements with our Chief Executive Officer, Kambiz Mahdi and Chief Financial Officer JohnBennett, for a period of five years from execution, unless terminated earlier pursuant to the terms of their respective agreements.
Mr. Mahdi will receive an annual compensation of $150,000 per year, subject to annual increases based on the greater of the consumer price index or 5.0% to take intoaccount annual cost of living increases and also subject to such increases as may from time to time be determined by the Board of the Directors of the Company. In addition,Mr. Mahdi will receive a severance benefit consisting of a single lump sum cash payment equal the salary that Mr. Mahdi would have been entitled to receive through theremainder or the Employment Period or two (2) years, whichever is greater.
Mr. Bennett will receive an annual compensation of $140,000 per year, subject to annual increases based on the greater of the consumer price index or 5.0% to take intoaccount annual cost of living increases and also subject to such increases as may from time to time be determined by the Board of the Directors of the Company. Additionally,Mr. Bennett will receive $40,000, payable in 8,000,000 shares of the company’s common stock at $.005 per share, as a retention bonus. The shares will be issued at the rate of1,000,000 shares per quarter, on the 15th day of each quarter, commencing on September 15, 2011 and continuing for the following seven quarters. Mr. Bennett will alsoreceive a severance benefit consisting of a single lump sum cash payment equal the salary that Mr. Bennett would have been entitled to receive through the remainder or theEmployment Period or two (2) years, whichever is greater.Potential Payments upon Termination or Change of ControlSeverance BenefitsMr. Mahdia will receive a severance benefit consisting of a single lump sum cash payment equal the salary that Mr. Mahdi would have been entitled to receive through theremainder or the Employment Period or two (2) years, whichever is greater.Mr. Bennett will receive a severance benefit consisting of a single lump sum cash payment equal the salary that Mr. Bennett would have been entitled to receive through theremainder or the Employment Period or two (2) years, whichever is greater.
Item 12. Security Ownership of Certain Beneficial Owners and Management and Related Stockholder Matters.
The following table shows, as of March 30, 2012, the number of shares of our common stock beneficially owned by (1) any person who is known by us to be the beneficialowner of more than 5.0% of the outstanding shares of our common stock; (2) our directors; (3) our named executive officers; and (4) all of our directors and executive officersas a group. The percentage of common stock beneficially owned is based on 197,659,056 shares of our common stock outstanding as of March 30, 2012. Beneficial ownershipis determined in accordance with the rules of the SEC and generally includes securities over which a person has voting or investment power and securities that a person has theright to acquire within 60 days.

Table of Contents Financial Statements
Name of Beneficial Owners (1)Number of Shares of Common
Stock Beneficially Owned Percentage Kambiz Mahdi(2) 69,959,347 35%John Bennett(3) 2,620,924 1.30%Shervin Talieh 500,000 *Bijan Israel(4) 69,959,347 35%All directors and officers as a group (3 persons) 73,080,271 71.30%
* Represents less than 1.0% of our outstanding common stock. (1) The address of each beneficial owner listed is c/o Probe Manufacturing, Inc., 17475 Gillette Ave., Irvine, California 92614. (2) The shares of common stock are held directly by the Kambiz and Bahareh Living Trust and indirectly by Kambiz Mahdi and Bahareh
Mahdi as Trustees. (3) On March 18, 2011, Mr. Bennett purchased 1,020,924 shares of Probe Manufacturing, Inc. (the "Company") from Barrett Evans, the
former CEO and chairman of the Company in a private transaction for $5,000, or $0.0048 per share. In addition, on June 26, 2011, Mr.Bennett was granted 1,000,000 shares of the Company's common stock as additional compensation for his employment with theCompany for the year ended December 31, 2010. In addition Mr. Bennett was issued an option to purchase 300,000 shares of ourcommon stock on February 8, 2007 at $0.173 under our 2006 Plan and an option to purchase 300,000 shares of our common stock onFebruary 28, 2008. Both option grants expire on February 08, 2017. As of December 31, 2011, Mr. Bennett has not exercised hisoption grants. Pursuant to Mr. Bennett's employment contract with the Company, he will be granted 8,000,000 shares of theCompany's common stock over the next eight quarters.
(4) The shares of common stock are held directly by the Bijan and Sima Israel Family Trust and indirectly by Bijan Israel and Sima Israel,
Trustees. None of the above shares have been pledged as security.
Item 13. Certain Relationships and Related Transactions, and Director Independence.
Director Independence We have a three-member Board of Directors. Due to the size of our company and the difficulty in finding directors that are competent or have experience in our industry, onlyone of our directors can be deemed an “independent director.” While our stock is not listed on the New York Stock Exchange, our independent director would qualify as independent under the rules of the New York Stock Exchange. Review of Related Person Transactions Our Code of Business Conduct and Ethics provides guidance for addressing actual or potential conflicts of interests, including those that may arise from transactions andrelationships between us and our executive officers or directors, such as:
· Business transaction between the company and any executive are prohibited, unless otherwise approved by the Board; · Activities that may interfere with an executive�s performance in carrying out company responsibilities; · Activities that call for the use of the company�s influence, resources or facilities; and · Activities that may discredit the name or reputation of the company.
We have various procedures in place to identify potential related person transactions, and the Board of Directors and a separate compliance committee work together inreviewing and considering whether any identified transactions or

Table of Contents Financial Statements
relationships are covered by the Code of Business Conduct and Ethics. A copy of the company's Code of Business Conduct and Ethics on the Corporate Governance is on ourwebsite at www.probeglobal.com.Transactions with Related PersonsFor the years ended December 31, 2010 and 2011, the company had the transactions which involved related persons:
· On June 23, 2010 we entered short term $70,000 demand note to B&S Development Group, LLC. The term of this note is four month due on October 23, 2010 withan interest rate of %15 percent per annum. This note required the payment of a 12% due diligent fee to be amortized over the life of the note. Total payments forinterest and due diligent fees are $3,000 per month. Bijan Israel, B&S Development Group, LLC’s managing partner, is one of our largest shareholders; beneficiallyowning of the company at 69,959,347 shares. On February 17, 2010 the balance of this note was paid in full. As of December 31, 2011 the outstanding balance waszero.
· Our chief executive officer was a supplier of parts and had dealings with current and former customers of our company; however, our board of directors has approvedsuch transactions of our chief executive officer.
Item 14. Principal Accounting Fees and Services.W.T. Uniack & Co, CPA’s, P.C. has served as our independent registered public accounting firm since November 10, 2008 and audited our financial statements for the periodfor the year ended December 31, 2010 and December 31, 2011.
The following table lists the fees for services billed by our independent registered public accounting firm in 2010 and 2011:
Services: 2011 2010Audit Fees (1) $ 24,000 $ 24,000Audit Related Fees (2) - - Tax Fees (3) 985 985Total $ 24,985 $ 24,985
(1) Audit fees billed in 2010 and 2011 consisted of fees related to the audit of our annual financial statements, reviewsof our quarterly financial statements, and statutory and regulatory audits, consents and other services related tofilings with the SEC.
(2) Audit-related fees related to financial accounting and reporting consultations, assurance and related services.
(3) Tax services consist of tax compliance and tax planning and advice.
The Board of Directors pre-approves all auditing services and permitted non-audit services (including the fees and terms thereof) to be performed for us by our independentregistered public accounting firm, subject to the de minimis exceptions for non-audit services described in Section 10A(i)(1)(b) of the Exchange Act and the rules andregulations of the SEC. All services rendered by W.T. Uniack & Co, CPA’s, P.C. for the year ended December 31, 2010 and 2011 were pre-approved in accordance with thepolicies and procedures described above. Auditor Independence The Board of Directors has considered whether the provision of the above noted services is compatible with maintaining our independent registered public accounting firm’sindependence and has concluded that the provision of such services has not adversely affected the independent registered public accounting firm’s independence. The information required by this Item is incorporated by reference to our definitive proxy statement to be filed with respect to our 2011 annual meeting of stockholders. Board of Directors Audit Report to Shareholders Since we do not have a standing Audit Committee our full Board of Directors oversees our financial reporting process. Our management has the primary responsibility for ourfinancial statements as well as our financial reporting process, principles and internal controls. The independent registered public accounting firm is responsible for performingan audit of our financial statements and expressing an opinion as to the conformity of such financial statements with accounting principles generally accepted in the UnitedStates of America. In this context, the Board of Directors has reviewed and discussed our audited financial statements as of December 31, 2010 and December 31, 2011 with management and theindependent registered public accounting firm. The Board of Directors has
Table of Contents Financial Statements
discussed with the independent registered public accounting firm the matters required to be discussed by the Statement on Auditing Standards No. 61, Professional Standards,as amended. In addition, the Board of Directors has received the written disclosures and the letter from the independent registered public accounting firm required byIndependence Standards Board Standard No. 1, Independence Discussions with Audit Committees, as currently in effect, and it has discussed their independence with us. Item 15. Exhibits, Financial Statement Schedules. (a)(1) Financial Statements:
The consolidated financial statements and the related notes are included in Item 8 herein.
(a)(2) Financial Statement Schedule:
All schedules have been omitted as the required information is inapplicable or the information is presented in the consolidated financial statements or related notes.
(a)(3) Exhibits:
The exhibits listed on the Exhibit Index (following the signatures section of this report) are included, or incorporated by reference, in this annual report.
(b) Exhibits:
See Item 15(a)(3) above.
(c) Financial Statement Schedule:
All schedules have been omitted as the required information is inapplicable or the information is presented in the consolidated financial statements or related notes. \
SIGNATURES Pursuant to the requirements of Section 13 or 15(d) of the Securities Exchange Act of 1934, the registrant has duly caused this report to be signed on its behalf by theundersigned, thereunto duly authorized, in the City of Irvine, State of California on the 5th day of April, 2011. PROBE MANUFACTURING, INC. ______________________________ REGISTRANT /s/ Kambiz Mahdi ___________________ By: Kambiz MahdiChief Executive Officer Date: April 6, 2012 /s/ John Bennett ___________________ By: John BennettChief Financial Officer

Table of Contents Financial Statements
Date: April 6, 2012 Pursuant to the requirements of the Securities Exchange Act of 1934, this report has been signed below by the following persons on behalf of the registrant and in thecapacities and on the date indicated. Signature Title /s/ Kambiz Mahdi Chief Executive Officer and Director _______________________ (principal executive officer)By: Kambiz Mahdi Date: April 6, 2012 /s/ John Bennett Chief Financial Officer and Director _______________________ (principal financial officer)By: John Bennett Date: April 6, 2012 /s/ Shervin Talieh Director _______________________By: Shervin Talieh
Date: April 6, 2012
Table of Contents Financial Statements
EXHIBIT INDEX
Pursuant to Item 601(a)(2) of Regulation S-K, this Exhibit Index immediately precedes the exhibits.
The following exhibits are included, or incorporated by reference; in this Annual Report on Form 10-K for the fiscal year ended December 31, 2011 (and are numbered
in accordance with Item 601 of Regulation S-K). EXHIBITNUMBER DESCRIPTION 3.1 Articles of Incorporation (included as exhibit 3.1 to the Form SB-2/A filed on June 10, 2005 and incorporated herein by reference). 3.2 Bylaws (included as exhibit 3.2 to the Form SB-2/A filed on June 10, 2005 and incorporated herein by reference). 4.1 Certificate of Designation for Series A Convertible Preferred Stock, dated May 20, 2004 (included as exhibit 4.1 to the Form SB-2/A filed on June 10, 2005 andincorporated herein by reference). 4.2 Certificate of Designation for Series B Convertible Preferred Stock dated December 31, 2004 (included as exhibit 4.2 to the Form SB-2/A filed on June 10, 2005 andincorporated herein by reference). 4.3 Sample Series A Warrant Purchase Agreement (included as exhibit 4.3 to the Form SB-2/A filed on September 26, 2005 and incorporated herein by reference). 4.4 Sample Series B Warrant Purchase Agreement (included as exhibit 4.4 to the Form SB-2/A filed on September 26, 2005 and incorporated herein by reference). 4.5 Sample Amended Series A Warrant Purchase Agreement (included as exhibit 4.5 to the Form SB-2/A filed on November 25, 2005 and incorporated herein by reference). 4.6 Sample Amended Series B Warrant Purchase Agreement (included as exhibit 4.6 to the Form SB-2/A filed on November 25, 2005 and incorporated herein by reference). 4.7. Certificate of Designation of Series C Convertible Preferred Stock dated May 25, 2006 (included as exhibit 4.1 to the Form 8-K filed on June 14, 2006 and incorporatedherein by reference). 4.8 Amended Certificate of Designation of Series C Convertible Preferred Stock dated May 25, 2006 (included as exhibit 4.1 to the Form 8-K filed on August 14, 2006 andincorporated herein by reference). 4.9 Sample Amended Series A Warrant Purchase Agreement (included as exhibit 10.1 to the Form 8-k filed on November 15, 2006 and incorporated herein by reference). 4.10 Sample Amended Series B Warrant Purchase Agreement (included as exhibit 10.2 to the Form 8-k filed on November 15, 2006 and incorporated herein by reference). 14.1 Code of Ethics (included as exhibit 14.1 to the Form 10-KSB on April 5, 2007 and incorporated herein by reference). 21.1* List of Subsidiaries 31.1* Certification of the Chief Executive Officer pursuant to Section 302 of the Sarbanes-Oxley Act of 2002. 31.2* Certification of the Chief Financial Officer pursuant to Section 302 of the Sarbanes-Oxley Act of 2002. 32.1** Certification of the Chief Executive Officer pursuant to 18 U.S.C. Section 1350, as adopted pursuant to Section 906 of the Sarbanes-Oxley Act of 2002.

Table of Contents Financial Statements
32.1** Certification of the Chief Executive Officer pursuant to 18 U.S.C. Section 1350, as adopted pursuant to Section 906 of the Sarbanes-Oxley Act of 2002. 101.INS** XBRL Instance Document 101.SCH** XBRL Taxonomy Extension Schema Document 101.CAL** XBRL Taxonomy Extension Calculation Linkbase Document 101.LAB** XBRL Taxonomy Extension Label Linkbase Document 101.PRE** XBRL Taxonomy Extension Presentation Linkbase Document 101.DEF** XBRL Taxonomy Extension Definition Linkbase Document_________________ * Filed herewith** Furnished herewith