probabilistic seismic response analysis of a 3-d...
TRANSCRIPT

Structural Safety 44 (2013) 11–27
Contents lists available at SciVerse ScienceDirect
Structural Safety
j o u r n a l h o m e p a g e : w w w . e l s e v i e r . c o m / l o c a t e / s t r u s a f e
Probabilistic seismic response analysis of a 3-D reinforced concrete
building
Marco Faggella
a , b , Andr ́e R. Barbosa
c , Joel P. Conte
a , * , Enrico Spacone
b , Jos ́e I. Restrepo
a
a Department of Structural Engineering, University of California at San Diego, 9500 Gilman Drive, La Jolla, CA 92093-0085, USA b University “G. D ’ Annunzio” of Chieti-Pescara, Viale Pindaro 42, Pescara 65127, Italy c School of Civil and Construction Engineering, Oregon State University, 220 Owen Hall, Corvallis, OR 97331-3271, USA
a r t i c l e i n f o
Article history:
Received 24 December 2011
Received in revised form 19 April 2013
Accepted 25 April 2013
Keywords:
Fiber section beam-column elements
Nonlinear finite-element analysis
Performance-Based Earthquake Engineering
Probabilistic analysis
Time-history analyses
a b s t r a c t
This paper presents the probabilistic seismic demand analysis with respect to seismic input uncertainty only
of a 3-D reinforced concrete building model subjected to three-component earthquake ground motion ex-
citation. Response history analyses are carried out on a nonlinear frame model. Probability distributions are
assumed for the ground motion Intensity Measure (IM) taken as the linear 5% damped elastic spectral accel-
eration at the fundamental period of the structure. Part of the framework of the so-called Performance Based
Earthquake Engineering (PBEE) methodology developed by the Pacific Earthquake Engineering Research
(PEER) Center is used in this study. This paper has two main objectives. The first objective is to perform a
probabilistic demand analysis of an existing building conditional on the ground motion IM. The second objec-
tive is to use the results obtained from this existing testbed, with real-world complexities, to demonstrate the
deficiency of the PEER PBEE methodology when using a scalar ground motion IM for 3-D structural models.
This last objective shows the need for improving the definition of the seismic IM in the PBEE methodology
for the general case of 3-D structures subjected to multi-directional input ground motions. To this effect, an
ensemble of natural ground motion records is used to represent the inherent randomness in ground motion
time-histories (i.e., record-to-record variability). The statistical correlation of different Engineering Demand
Parameters (EDPs) with a set of IMs, taken as the 5% damped spectral accelerations at different periods for
two horizontal ground motion components, is investigated in order to assess the dispersion in the EDPs due
to different ground motion records. Some statistical correlation coefficients are found to be high, indicating
that the dispersion of the EDPs is heavily influenced by the spectral content at periods different from the
fundamental period. This result points to the need for using vector-valued ground motion Intensity Measures
in the PBEE methodology currently proposed by PEER. c © 2013 Elsevier Ltd. All rights reserved.
1. Introduction
In the last decade, the Pacific Earthquake Engineering Research
(PEER) center has focused on the development of methodologies and
tools for Performance-Based Earthquake Engineering of building and
bridge structures [ 1 –5 ]. PBEE stands on the premise that performance
can be predicted and evaluated with quantifiable confidence in order
to make intelligent and informed decisions based on life-cycle con-
siderations. To achieve this objective, PEER has focused on methods
of performance assessment, with due consideration to the effects
of all pertinent uncertainties that enter the performance prediction
process, from earthquake occurrence modeling to the assessment of
earthquake consequences such as casualties, dollar losses and down-
time [ 6 , 7 ]. The methodology has been applied to existing facilities
(e.g., buildings, bridges, network of highway bridges, and campuses
* Corresponding author. Tel.: + 1 858 822 4545.
E-mail address: [email protected] (J.P. Conte).
0167-4730/ $ - see front matter c © 2013 Elsevier Ltd. All rights reserved.
http://dx.doi.org/10.1016/j.strusafe.2013.04.002
of buildings) within the PEER testbed program. Since the ground shak-
ing intensity and the mechanical characteristics of a building are both
highly uncertain, it is not possible to calculate deterministic values
of the seismic structural demands. Instead, it is necessary to predict
a statistical distribution of the demand parameters, considering the
variability in the input (ground shaking intensity and ground motion
characteristics), in the structural model itself and in its various param-
eters. Furthermore, traditional linear structural analysis provides for
the least accurate prediction of the seismic demand. Rigorous charac-
terization of the building behavior should be obtained using detailed
nonlinear models in order to perform a reliable probabilistic seismic
demand assessment.
The PBEE methodology developed by PEER integrates the follow-
ing four steps in a unified probabilistic framework: (1) seismic haz-
ard analysis, (2) probabilistic demand analysis, (3) fragility analy-
sis, and (4) loss analysis. This framework uses as interface variables
the ground motion Intensity Measure (IM) and the Damage Measure
(DM). Typically, the IM is the 5% damped elastic spectral acceleration
at the fundamental period of the structure T 1 , and DMs are discrete

12 Marco Faggella et al. / Structural Safety 44 (2013) 11–27
l
o
I
p
m
a
o
T
g
I
s
t
l
c
(
a
I
i
H
a
a
s
P
e
n
t
P
s
t
s
l
i
i
s
a
a
s
m
i
p
m
c
T
m
i
f
t
h
t
t
e
e
s
s
e
i
g
g
t
a
s
c
imit-states, such as yielding of longitudinal reinforcement, spalling
f concrete, buckling of longitudinal reinforcement, etc. Ideally, the
M should satisfy the attributes of efficiency and sufficiency [ 8 ]. This
aper deals only with two of the analytical steps of the PEER PBEE
ethodology, namely (1) probabilistic seismic hazard analysis (PSHA)
nd (2) probabilistic seismic demand analysis (PSDA).
In PBEE, the result of PSHA is the probabilistic characterization
f a scalar or vector-valued ground motion Intensity Measure (IM).
his characterization of the IM is used to quantify the likelihood of a
round motion (i.e., annual probability of exceedance) at a site. The
M is also used as a seismological variable to which the EDPs of the
tructure are correlated, with these EDPs obtained through nonlinear
ime history analyses of a structural model subjected to carefully se-
ected ground motions records. Two properties were defined to be of
rucial importance in the selection of the IM [ 8 ]: (1) efficiency and
2) sufficiency. An efficient IM is defined as one that results in a rel-
tively low variability of the EDP conditional on this IM. A sufficient
M is defined as one that renders the EDP conditionally statistically
ndependent of other ground motion characteristics given this IM.
istorically, the peak ground acceleration (PGA) was initially used
s the IM in PSHA [ 9 ]. In this paper, however, the selection of S a ( T 1 )
s the primary IM follows the work of Cornell and co-workers who
howed that S a ( T 1 ) was more “efficient” and more “sufficient” than
GA [ 8 , 10 ]. Nonetheless, recent studies based on 2-D structural mod-
ls, have demonstrated that S a ( T 1 ) may not be particularly “efficient”
or “sufficient” for some structures and ground motion types (e.g.,
all, long-period buildings [ 11 ], near-source ground motions [ 12 ]).
Among other researchers, Lee and Mosalam [ 13 ] used part of the
EER methodology to perform a probabilistic seismic demand analy-
is of a reinforced concrete building modeled in 2-D, and to investigate
he probabilistic structural demand sensitivity to uncertainties in the
tructural model parameters and in the ground motions. However,
imited information is available on the seismic response of 3-D build-
ng structures under multi-component earthquake ground motion
nput. In case of 3-D structural behavior, it is difficult, if not impos-
ible, to use a scalar IM that satisfies both requirements of efficiency
nd sufficiency.
An important issue when dealing with nonlinear time-history
nalyses is the use of a scalar versus vector-valued IM, and the sub-
equent adoption of a proper scaling criterion of the input ground
otions. Within PEER, a strategic decision was made to use histor-
cal ground motion records scaled within reasonable limits as op-
osed to synthetic or simulated ground motions. In the PEER PBEE
ethodology, the spectral ordinate S a ( T 1 ) of the ground acceleration
omponent in the direction of the fundamental mode with period
1 on the uniform hazard spectrum has been adopted as an opti-
al Intensity Measure for a suite of records. The structural response
s strongly correlated to this IM for some response parameters and
or some classes of structures [ 14 ]. In PBEE, the input motions are
ypically scaled to the value of S a ( T 1 ) corresponding to the specified
azard level. This scaling criterion has also been extended for use in
he analysis of 3-D structures, with the same scaling applied to all
hree seismic input components. There is concern regarding the ad-
quacy of such an assumption for 3-D analysis of structures. Thus,
ven though there has been significant research on ground motion
election and scaling [ 15 –18 ], the application of PBEE based on 3-D
tructural models and analyses for multi-component ground motion
xcitations, as described in this paper, deserves more attention.
The first objective of this paper is to show the need for improv-
ng the definition of the seismic IM in the PBEE methodology for the
eneral case of 3-D structures subjected to multi-directional input
round motion. The second objective of this paper is to use an existing
estbed structure to demonstrate the deficiency of PBEE when using
scalar ground motion IM in conjunction with a 3-D model of the
tructure. A nonlinear 3-D frame model of an existing reinforced con-
rete (R / C) structure built in 1984 in Bonefro, Italy, and damaged in
the 2002 Molise earthquake [ 19 ] is used as a case study for illustrating
the implications of using a scalar IM in the PEER PBEE methodology,
making use of the structural analysis software framework OpenSees
[ 20 , 21 ]. Probability distributions are assumed for the ground motion
IM = S a ( T 1 ). An ensemble of natural ground motion records selected
within the PEER testbed program for the campus of the University of
California at Berkeley is used to represent the inherent randomness
in ground motion time-histories (i.e., record-to-record variability) in
the Monte Carlo simulations. A probabilistic study is performed of
the structural response parameters, referred herein as Engineering
Demand Parameters (EDPs).
2. Analytical model of the Bonefro building
The building used in this study is an existing four-story rein-
forced concrete structure built in the early 1980s in Bonefro, Italy,
and shown in Fig. 1 . The building is an example of typical building
practices used in Italy for residential structures before modern seis-
mic codes were introduced, and has a structural layout and design
details that can be found in older buildings in several seismic re-
gions throughout the world. The ground level columns and masonry
infills suffered severe damage during the 2002 Molise earthquake
[ 19 ], while the upper stories remained substantially undamaged. The
structural system comprises three frames in the longitudinal direc-
tion (X-direction). Shallow and wide beams are used in the central
longitudinal frame. One-way slabs connect the longitudinal frames
( Fig. 1 (b)). In the short direction (Y-direction), there are four frames.
The building is plan symmetric in the Y-direction, while the staircase
and the ground level infills break the symmetry in the X-direction.
Further information on dimensions of the structural elements and
their reinforcement detailing can be found in [ 23 ].
A 3-D nonlinear model of the building structure was created in
OpenSees and is shown in Fig. 2 (a). The concrete frame behavior is
affected by other structural components, such as the infills, floor di-
aphragms, beam-column joints, staircase, etc. [ 22 , 23 ]. The effects of
such components on the structural response, which could potentially
be very important, are not studied in this paper, as the main objective
here is advancing current procedures for probabilistic seismic re-
sponse analysis of 3-D building structures. Furthermore, a simplified
building configuration reduces the significant computational effort
necessary to perform large ensembles of time-history analyses. For
these reasons, only the bare frame (beams and columns) is consid-
ered in the model used herein, with fixed supports at the building
base. Floor diaphragms rigid in their plane are used to model the
floor slab. Rheological effects, such as volumetric changes caused by
creep, shrinkage and temperature, have also been disregarded in this
model. Since it was found early in this study that nonlinear geom-
etry has a negligible effect on the EDPs considered here (defined as
peak response quantities), geometric nonlinearity was neglected in
the analyses. The study was carried out using a high-performance
computational environment that relies on parallel supercomputers
for parametric sensitivity analyses. This environment was developed
in a related study [ 24 ] and makes use of OpenSees Version 1.7.3 [ 25 ]
which is suited for parallel computations.
In the building model, beams and columns are modeled us-
ing force-based nonlinear frame elements [ 26 ]. Each element has
five Gauss–Lobatto integration points (i.e., monitored cross sections)
along the element length. This number was selected in order to match
the plastic hinge length of the columns with the tributary length of
the first integration point in order to circumvent localization issues
and loss of objectivity in the simulated response [ 27 ]. At each in-
tegration point, the section is discretized using a fiber model. The
uniaxial Kent and Park [ 28 ] concrete model is used for both the un-
confined and confined concrete, with no tensile strength. The steel
rebars are modeled using a bilinear inelastic law. The cross-sectional
response, based on the fiber discretization, is capable of capturing

Marco Faggella et al. / Structural Safety 44 (2013) 11–27 13
Fig. 1. Four-story R / C building in Bonefro, Italy: (a) damage observed after the Molise 2002 earthquake; and (b) plan view of the first floor.
Fig. 2. (a) Finite element (FE) model of Bonefro building; (b) floor and story EDPs; and (c) frame and section modeling.
the stiffness degradation and strength deterioration due to concrete
cracking, concrete crushing, and steel yielding, based on the uni-axial
material constitutive laws adopted (see sketches in Fig. 2 (c)). The fiber
cross-section automatically accounts for the interaction between ax-
ial force and biaxial bending. Cross-section and element shear and
torsional behaviors are assumed linear elastic, uncoupled, and ag-
gregated to the nonlinear inelastic fiber cross-section behavior. Thus,
the beam-column elements do not account for stiffness degradation
and strength deterioration in the shear and torsional behavior of the
beams and columns.
All material and structural properties are taken at their best de-
terministic estimates. The concrete cube strength f cm,cube is set to the
mean test value of 25.8 MPa. Similarly, the steel strength f y is set to
451 MPa. The mean values assumed for the concrete and steel Young’s
modulus are 28.9 and 210 GPa, respectively. Rayleigh damping was
assumed based on the initial stiffness matrix of the structure (after
application of the gravity loads) with a 3.0% damping ratio in the ini-
tial modes 1 and 6 with frequencies f 1 = 0.93 Hz and f 6 = 4 Hz. Since
the hysteretic energy dissipation is already explicitly accounted for
at the material level, the damping ratio used is lower than the 5.0%

14 Marco Faggella et al. / Structural Safety 44 (2013) 11–27
v
r
s
a
8
t
m
o
d
i
t
d
o
a
a
l
a
o
g
a
3
s
g
o
s
c
M
e
a
p
l
5
a
(
s
m
c
P
y
a
t
s
c
u
a
o
t
v
t
e
t
p
B
t
n
a
s
g
f
alue commonly suggested for linear analyses. The model is symmet-
ic in the Y-direction and has a small asymmetry in the X-direction, as
hown in Fig. 1 . The floor masses used in the dynamic analyses include
ll dead loads and 30% of the 2 kN / m
2 live load according to Eurocode
[ 29 ]. The floor masses are uniformly distributed in plan and along
he building height, with a typical floor seismic weight of approxi-
ately 1700 kN. It is worth noting that the masses of the infills and
f the stairs were also accounted for and included in the uniformly
istributed floor masses. The floor mass density at the heaviest floor
s 0.87 tons / m
2 . The distributed floor mass was discretized based on
ributary areas into lumped masses (of equal values in the X, Y, and Z-
irections) assigned to each beam-column joint. The rotatory inertia
f the floor diaphragms is automatically accounted for by the di-
phragm constraint applied to each floor. The dynamic time-history
nalyses are performed after the model is loaded with the gravity
oads during an initial nonlinear static analysis. The constant average
cceleration Newmark method was used to integrate the equations
f motion. The Newton–Raphson algorithm was used to find conver-
ence of the dynamic equilibrium at each time step. All time-history
nalyses performed in this study converged.
. PEER methodology and ground motion Intensity Measure
As mentioned above, the PEER PBEE methodology is a 4-stage
eismic assessment procedure for facilities located in a zone with a
iven seismicity [ 30 ]. The present study involves the first two stages
nly: (1) probabilistic seismic hazard analysis, and (2) probabilistic
tructural analysis.
The probabilistic seismic hazard analysis yields the seismic hazard
urve, which provides the mean annual rate (MAR) of the Intensity
easure S a ( T 1 ) exceeding any specified level at the site of interest. An
nsemble of actual earthquake ground motion records are selected
nd scaled so that their spectral ordinates at the initial fundamental
eriod T 1 of the building match the Intensity Measure at three hazard
evels corresponding to a probability of exceedance (PE) of 50% in
0 years, 10% in 50 years, and 2% in 50 years, respectively.
The probabilistic structural analysis stage consists of performing
n ensemble of nonlinear time-history analyses of the finite element
FE) model of the structure at each of the three hazard levels con-
idered. The uncertainty in the structural response is measured by
onitoring the scatter of a number of structural response parameters
alled EDPs at each of the three hazard levels.
The present study focuses only on the second stage of the PEER
BEE methodology, mainly on the probabilistic seismic demand anal-
sis (structural analysis). The probabilistic approach follows the prop-
gation of the seismic input uncertainty to a number of EDPs through
he analysis of a nonlinear model of the building structure. The re-
ults are given in terms of the likelihood of the various EDPs ex-
eeding specified demand levels. In this paper, we consider only the
ncertainty in the seismic input and focus on probabilistic demand
nalyses conditional on IM. The seismic input uncertainty consists
f the uncertainty in the IM (or in the seismic excitation ratio) and
he randomness in the ground motion time-history (record-to-record
ariability). At each hazard level, the record-to-record variability is
aken into account by performing Monte Carlo simulations with an
nsemble of 20 scaled tri-directional records.
The ground motions used in this study are those selected within
he PEER testbed program ( http: // peer.berkeley.edu / research /
eertestbeds / index.html ) for the site at the University of California,
erkeley [ 13 , 31 ], and are reported in Table 1 . Each record consists of
wo horizontal and one vertical component. Thus, these records were
ot selected for the specific site where the Bonefro building is actu-
lly located, as the Bonefro building is used here as a mere testbed
tructure outside of its seismic environment. The site for which the
round motions are selected is located in proximity of the Hayward
ault. The 20 ground motions were selected by Somerville [ 31 ] for the
PEER testbed program. Even though these records are from different
regions of the world, their seismological parameters are similar to
those of the Hayward fault. Furthermore, the ground motion selec-
tion is consistent with the magnitude–distance (M–R) deaggregation
of the seismic hazard at the site based on IM = S a ( T 1 ) and with the
type of faulting mechanism and local site conditions. Most applica-
tions of the PEER PBEE methodology have used a scaling criterion of
the input seismic records based on the single scalar IM = S a ( T 1 ).
The initial first six modal periods of the building in the bare frame
configuration are T 1 = 1.07 s, T 2 = 0.87 s, T 3 = 0.77 s, T 4 = 0.33 s, T 5 = 0.28 s, T 6 = 0.25 s. With the discretization of the masses adopted in
the present model, the most significant vertical mode of vibration is
mode 17, with a period of T z = T 17 = 0.05 s and a modal participating
mass ratio of 30%. These periods were computed based on the stiffness
of the structure after applying the gravity loads and before starting
the nonlinear time-history analyses. Periods T 1 , T 2 , and T 3 correspond
to the first sway mode in the transversal / short Y-direction, the first
sway mode in the longitudinal / long X-direction, and the first tor-
sional mode, respectively. Periods T 4 , T 5 , and T 6 correspond to the
second sway mode in the Y-direction, the second sway mode in the
X-direction, and the second torsional mode, respectively. The ground
motions are applied so that the component referred to as “longitudi-
nal” by Somerville [ 31 ] acts parallel to the building Y-direction. The
records were scaled so as to yield the same ordinate S aY ( T 1 ) in the Y
component and the same scaling factor was used for all three ground
motion components of a given record. The scaling factors for the
ground motions used ranged from 0.10 to 1.33 (with a mean of 0.39
and standard deviation of 0.33) for the 50% in 50 years hazard level
and from 0.26 to 3.75 (with a mean of 1.12 and standard deviation of
0.93) for the 10% in 50 years hazard level.
The probabilistic seismic hazard analysis for the Berkeley site pro-
vides uniform hazard spectra at the three hazard levels (50%, 10%,
and 2% annual probability of exceedance (PE) in 50 years, correspond-
ing to 72, 475 and 2475 years return period, respectively, assuming
the Poisson model for random earthquake occurrences). These uni-
form hazard spectra are provided for a discrete number of periods,
as shown in Fig. 3 , and the values of S a ( T 1 ) at intermediate period
values are obtained through log-linear interpolation. The ordinates
of the three uniform hazard spectra at period T 1 = 1.07 s in Fig. 3 ,
together with the corresponding values of the MAR of exceedance,
are plotted as the three white-filled points in Fig. 4 , which shows the
MAR of exceedance (or the annual PE) as a function of the IM S aY ( T 1 ).
In Fig. 4 , these three white-filled points are then converted into the
black points that represent the probability of exceedance in 50 years
assuming the Poisson random occurrence model. A lognormal com-
plementary cumulative distribution function (CCDF) represented by
the thick solid line is least-square fitted to the three black points. The
fitted lognormal CCDF, which provides the probability of exceedance
in 50 years versus S a ( T 1 , ξ = 5%), was transformed again assuming
the Poisson random occurrence model to the annual probability of
exceedance (dashed line) and the MAR of exceedance (thin solid line)
versus S a ( T 1 , ξ = 5%). The annual PE versus IM = S a ( T 1 , ξ = 5%) are
referred to in the literature as the seismic hazard curve for the site.
It is worth noting that the seismic hazard curves in terms of annual
probability of exceedance and MAR of exceedance coincide except
at low hazard levels (high probability of exceedance). Using the site
seismic hazard curve, the ground motion IM can be set to any hazard
level and the selected ground motions scaled accordingly.
Assuming that earthquake ground motions with IM exceeding the
threshold im (i.e., IM > im ) follow a Poisson random occurrence model
in time, the probability of one or more ground motions with IM > im
during an exposure time t is given by [ 32 ]
P = 1 − e −λ( im ) t (1)
where λ( im ) denotes the MAR of occurrence of ground motions with
IM > im . The thin solid line in Fig. 4 represents λ( im ) with im defined

Marco Faggella et al. / Structural Safety 44 (2013) 11–27 15
Table 1
Ground motion recordings for the site of the UC Berkeley Science Building [ 31 ].
Record Event Station Year �t N points
EZ erzi Erzincan Erzincan 1992 0.005 4156
KB kobj Kobe Kobe JMA 1995 0.02 2499
LP cor Loma Prieta Corralitos 1989 0.005 7989
LP gav Loma Prieta Gavilan College 1989 0.005 7991
LP gilb Loma Prieta Gilroy historic 1989 0.005 7991
LP lex1 Loma Prieta Lexington Dam 1989 0.02 2000
LP lgpc Loma Prieta Los Gatos Pres. Center 1989 0.005 4993
LP srtg Loma Prieta Saratoga Aloha Ave 1989 0.005 7991
TO ttr007 Tottori Kofu 2000 0.01 4000
TO ttrh02 Tottori Hino 2000 0.005 10000
CL clyd Coyote Lake Coyote Lake Dam 1979 0.005 5764
CL gil6 Coyote Lake Gilroy 1979 0.005 5419
LV fgnr Livermore Fagundes Ranch 1980 0.005 4000
LV mgnp Livermore Morgan Territory Park 1980 0.005 4800
MH andd Morgan Hill Coyote Lake Dam 1984 0.005 5665
MH clyd Morgan Hill Anderson Dam Down 1984 0.005 5991
MH hall Morgan Hill Halls Valley 1984 0.005 7996
PF cs05 Parkfield Temblor 1966 0.01 4392
PF cs08 Parkfield Array #5 1966 0.01 2612
PF temb Parkfield Array #8 1966 0.01 3033
Fig. 3. Uniform hazard spectra for the UC Berkeley Science Building site. Thin line:
linear interpolation between discrete values provided by USGS; thick line: log-linear
interpolation between discrete values.
Fig. 4. Lognormal approximation of seismic hazard exceeded in 50 years and corre-
sponding seismic hazard curves for annual probability of exceedance and mean annual
rate of exceedance.
as S a ( T 1 , ξ = 5%). The annual probability of exceedance (dashed line in
Fig. 4 ) and the probability of exceedance in 50 years (thick solid line
in Fig. 4 ) versus IM = S a ( T 1 , ξ = 5%) are related to λ( im ) through Eq.
(1) by setting t = 1 and t = 50, respectively.
It should be noted that the seismic hazard curve for the fundamen-
tal period of the building T 1 was obtained for the geometric mean of
the spectral accelerations in two horizontal components, S a,g.m. ( T 1 )
at three hazard levels (50%, 10%, and 2% in 50 years) that were used
in the determination of the seismic hazard curve. Then, the seismic
hazard curve for S a,g.m. ( T 1 ) was used to characterize the spectral accel-
eration in the Y-direction of the building at T 1 , S aY ( T 1 ), and to scale the
ensemble of three-component ground motion records at two hazard
levels, 50% and 10% in 50 years. The scaling factors that were applied
to the records in the Y-direction of the building were also applied
to the other two components of the record (horizontal component in
the X-direction and the vertical component). Therefore, the geometric
mean of the spectral accelerations of the two horizontal components
of the ensemble of ground motion records is not scaled exactly to
the seismic hazard curve S a,g.m. ( T 1 ). Thus, there is some inconsistency
between the Intensity Measure used to define the seismic hazard and
the one used in scaling the ground motions, which would need to
be prevented or accounted for if a full PBEE analysis (or at least an
unconditional probabilistic seismic demand analysis) was performed.
Baker and Cornell [ 15 ] discuss similar inconsistencies and how they
can be prevented or accounted for in a full PBEE analysis. However,
for the scope of this paper, this inconsistency does not play a role
in the main findings discussed later, which highlight the variation
of the correlation coefficients between key response parameters and
spectral accelerations in two orthogonal directions of the building
structure and at periods other than T 1 .
4. Propagation of uncertainty in ground motion records to 3-D
model EDPs conditional on IM = S aY ( T 1 )
In order to properly evaluate the probabilistic characteristics of the
EDPs of the 3-D building model, the dynamic analysis should be based
on rational assumptions regarding scaling of the three ground motion
components defining the seismic input. This section addresses this
particular issue which is still in need of a rational solution in the PEER
PBEE methodology. Only two hazard levels, mainly corresponding to
50% and 10% PE in 50 years, will be considered. At the lower hazard
level the structure is likely to remain mostly elastic, while at the
higher hazard level the structure is very likely to undergo significant
inelastic deformations and damage.

16 Marco Faggella et al. / Structural Safety 44 (2013) 11–27
4
o
i
a
t
p
a
r
c
s
2
o
r
t
f
f
u
s
l
i
F
=t
i
c
t
s
h
g
a
m
o
w
r
d
i
p
t
t
a
t
F
ξ
s
r
c
4
s
a
E
p
t
c
b
c
d
a
r
T
.1. Statistics of elastic spectra conditional on IM = S aY (T 1 )
In the probabilistic structural analysis step of the PBEE methodol-
gy, the uncertainties represented by the basic random variables or
nput parameters (characterizing in general the seismic input loading
nd the structure) are propagated through the nonlinear FE analysis to
he uncertainties characterizing the EDPs. The mapping between in-
ut parameters and EDPs is represented by the nonlinear time-history
nalysis procedure.
The pseudo-acceleration response spectra S aY ( T ) and displacement
esponse spectra S dY ( T ) shown in Fig. 5 (a) and (b), respectively, show
learly that the ordinates S aY ( T 1 ) and S dY ( T 1 ) are the same (corre-
ponding to a hazard level defined by a PE of 50% in 50 years) for all
0 ground motion components. However, there is a wide dispersion
f S aY ( T ) and S dY ( T ) at periods T away from the initial fundamental pe-
iod T 1 . A large scatter is observed for the pseudo-accelerations and
he spectral displacements at the higher mode periods ( T 4 , T 5 , T 6 ) and
or the spectral displacements at periods higher than T 1 such as the
undamental period of the building after it has been damaged and has
ndergone inelastic deformations. In other words, the ground motion
caling criterion used in this study introduces different seismic hazard
evels at different periods and in different directions of the seismic
nput. The circle symbols along the vertical line at T = T 4 = 0.33 s in
ig. 5 (a) represent the statistical distribution of a different IM = S aY ( T 4 0.33 s) obtained from the 20 ground motion components scaled at
he PE of 50% in 50 years for S aY ( T 1 ). T 4 is the second mode period
n the Y-direction of the building. As evidenced in the figure, the cir-
le symbols depart significantly from the corresponding ordinate of
he uniform hazard spectrum for 50% PE in 50 years. Therefore, if the
caling criterion based on S aY ( T 1 ) is used, while the main IM = S aY ( T 1 )
as a PE of 50% in 50 years, the spectral accelerations of the scaled
round motion components at periods of interest for the building
nalysis different from T 1 may have a wide range of hazard levels, as
easured by the PE in 50 years. The scatter of the spectral ordinates
f the scaled ground motion components at periods away from T 1 ill significantly influence the scatter of the EDPs in the probabilistic
esponse analysis conditional on IM = S aY ( T 1 ), as will be shown later.
Fig. 6 (a) and (b) shows the pseudo acceleration spectra S aX ( T ) and
isplacement spectra S dX ( T ) of the scaled ground motion components
n the X-direction of the building. Similarly, Fig. 7 (a) and (b) shows the
seudo acceleration spectra S aZ ( T ) and displacement spectra S dZ ( T ) in
he Z (vertical) direction. Since the same scaling factor is used for all
hree components of each tri-directional record, the spectra of the X
nd Z ground motion components do not intersect at the point on
he uniform hazard spectrum at T = T 1 . Again, it is observed from
igs. 6 and 7 that the ground motion scaling criterion, based on S a ( T 1 ,
= 5%), of the Y-direction ground motion components produces a
mall scatter in the hazard level of the spectral ordinates at other pe-
iods and of other ground motion components (i.e., X and Z-direction
omponents).
.2. Deterministic local and global response
To illustrate the deterministic response of the building to a single
eismic input, this section describes the results of two time-history
nalyses at two hazard levels for both global and local EDPs. Global
DPs relate to the response at the overall structural level, e.g., dis-
lacements and accelerations at floor levels. Local EDPs relate to
he response at the level of the structural components (beams or
olumns), e.g., interstory drift ratios, or sub-components (column or
eam section), e.g., section curvature. The following selected results
orrespond to an EDP specific “median ground motion”. The latter
enotes the ground motion record that produces the median EDP
mong the EDP values produced by the ensemble of 20 ground motion
ecords. For this purpose, the ground motion record TO ttrh02 (see
able 1 ) was scaled to S aY ( T 1 = 1.07 s) with a 50% and 10% probability
of exceedance in 50 years, respectively. This ground motion record
corresponds to the median ground motion at the 50% in 50 years
hazard level for the local EDP defined as the Max curvature in the
Y-direction at the base section of the column labeled 2008 in Fig. 2 (a).
A second-story column was selected because under static push-over
analysis in the Y-direction, the largest interstory drift occurs in the
second story. Furthermore, the two external frames are the stiffest
and strongest frames in the Y-direction and therefore, under the as-
sumption of rigid floor diaphragms, attract the highest lateral forces.
Finally, the middle column of the external frame was selected since
it is the stiffest and strongest column of the frame and therefore the
one subjected to the largest flexural and shear forces.
The global seismic response of the building is measured by the
floor horizontal displacements relative to the ground at the floor cen-
ters of mass in the X and Y-directions and by the corresponding in-
terstory drifts. These response quantities, as well as the maximum
floor absolute accelerations at the floor centers of mass in the X and
Y-directions, are used as global EDPs in this study.
The deterministic local and global EDPs defined above were
recorded for the building subjected to ground motion record
TO ttrh02 and are shown in Fig. 8 for the 50% PE in 50 years haz-
ard level and in Fig. 9 for the 10% PE in 50 years hazard level. It is
observed that the response of the building remains quasi-linear (near
incipient yield) at the 50% PE in 50 years hazard level, and is signifi-
cantly nonlinear at the 10% PE in 50 years hazard level, as shown by
the section moment-curvature response plots. Peak interstory drifts
of 1.6% and 4.3% are reached at the 50% and 10% PE in 50 years haz-
ard levels, respectively. It is worth noting that at 4.3% of interstory
drift, which is rather large for a nonductile concrete frame structure,
the main source of deterioration in the nonlinear FE model is related
to the post-crushing behavior of concrete. The irregular shape of the
hysteresis loops in the section moment-curvature responses reflects
the interaction between bi-axial flexure and variable axial force.
4.3. Response ensemble statistics conditional on S aY (T 1 ) at 50% PE and
10% PE in 50 years hazard levels
The time-history analyses were repeated for each record of the
ensemble of the earthquake ground motion records defined earlier to
obtain ensemble statistics of the building response at the 50% and 10%
PE in 50 years hazard levels. The maximum building response in the
X and Y-directions, in terms of peak floor displacements (PFD), peak
interstory drift ratios (PIDRs) and peak floor absolute accelerations
(PFAs), is shown in Fig. 10 for the 50% PE in 50 years hazard level,
and in Fig. 11 for the 10% PE in 50 years hazard level. Each sub-figure
in Figs. 10 and 11 displays 20 peak response profiles (in thin solid
lines) corresponding to the 20 tri-directional ground motion records
considered in this study and the ensemble average of the peak re-
sponse profiles or mean peak response profile (in thick solid line).
It should be noted that, since the columns have relatively low axial
load [ 23 ], their bending capacity and stiffness decrease from the first
to the second story; thus, even though the shear demand decreases
along the height of the building, the interstory drift demand is higher
at the second story. The scatter of the peak response parameters is
expressed graphically in Figs. 10 and 11 and quantified in the form of
coefficient-of-variations (c.o.v.) in Tables 2 and 3 for the 50% and 10%
PE in 50 years hazard levels, respectively.
At the 50% PE in 50 years hazard level, the columns do not undergo
any significant inelastic deformations, and the mean peak interstory
drift ratios remain below or near 1% in both the X and Y-directions.
The results given in Fig. 10 and in Table 2 show a significantly lower
dispersion of the peak response parameters in the Y-direction than
in the X-direction. This is due to the fact that for each ground mo-
tion excitation, the three ground motion components were scaled
uniformly based on S aY ( T 1 ) and the fundamental building mode is in

Marco Faggella et al. / Structural Safety 44 (2013) 11–27 17
Fig. 5. Elastic spectra (5% damped) of Y components of ground motions scaled to IM = S aY ( T 1 ) at 50% in 50 years hazard level. Note: the Y component used here is referred to as
“longitudinal” by Somerville [31].
Fig. 6. Elastic spectra (5% damped) of X components of ground motions scaled to IM = S aY ( T 1 ) at 50% PE in 50 years hazard level. Note: the X component used here is referred to as
“transversal” by Somerville [31].
Fig. 7. Elastic spectra (5% damped) of Z (vertical) components of ground motions scaled to IM = S aY ( T 1 ) at the 50% PE in 50 years hazard level.
Table 2
Coefficient-of-variations of peak response parameters (see Fig. 10 ) at 50% PE in 50 years hazard level.
Peak floor disp. X Peak floor disp. Y
Peak interstory
drift X
Peak interstory
drift Y
Peak floor abs.
accel. X Peak floor abs. accel. Y
Roof
4-th floor 0.47 0.21 0.47 0.35 0.26 0.25
3-rd floor 0.50 0.25 0.47 0.22 0.31 0.34
2-nd floor 0.52 0.27 0.54 0.25 0.52 0.45
1-st floor 0.50 0.33 0.50 0.33 0.57 0.50

18 Marco Faggella et al. / Structural Safety 44 (2013) 11–27
Fig. 8. Building global and local responses to ground motion TO ttrh02 (median GM for local response EDP = max curvature Y in the 2nd story column labeled 2008) scaled to 50%
PE in 50 years hazard level.
Table 3
Coefficient-of-variations of peak response parameters (see Fig. 11 ) at 10% PE in 50 years hazard level.
Peak floor disp. X Peak floor disp. Y
Peak interstory
drift X
Peak interstory
drift Y
Peak floor abs.
accel. X Peak floor abs. accel. Y
Roof
4-th floor 0.39 0.49 0.32 0.36 0.14 0.21
3-rd floor 0.41 0.55 0.43 0.26 0.30 0.31
2-nd floor 0.43 0.67 0.47 0.58 0.36 0.33
1-st floor 0.47 0.76 0.47 0.76 0.37 0.40
t
m
a
d
t
s
X
h
A
s
i
v
t
d
he Y-direction. Given the relatively high value of the initial funda-
ental period of the building ( T 1 = 1.07 s), the peak floor absolute
ccelerations (PFAs) have a heightwise decreasing profile due to the
eamplification with respect to the peak ground acceleration (PGA),
ypical of flexible structures.
At the 10% PE in 50 years hazard, the story maximum of the en-
emble average of peak interstory drift ratios is nearly 2.5% in both
and Y-direction. At this level of interstory drift level, the columns
ave undergone significant inelastic deformations, as shown in Fig. 9 .
s compared to the lower hazard level, in this case the EDP disper-
ion generally decreases except for the EDP peak interstory drift ratio
n the Y-direction at the lower floors (as shown in Table 3 ) where
ery high inelastic deformations are observed. The high dispersion of
he EDP peak interstory drift ratio in the Y-direction influences the
ispersion of the floor displacements too.
At the lower hazard level (50% PE in 50 years), the building re-
sponse remains mainly elastic for the majority of the 20 ground mo-
tions, which results in a dispersion of the displacement EDPs in the
Y-direction that is lower than that in the X-direction. This is due to
the scaling criterion that enforces no dispersion around S aY ( T 1 ) in the
Y-direction and does not limit the dispersion of the spectral ordinates
in the X-direction, namely S aX ( T 2 ). On the other hand, at the higher
hazard level (10% PE in 50 years), the response can be highly non-
linear, causing a significant shift in the modal periods. Thus, even in
the Y-direction there is a high scatter of the spectral ordinates at the
shifted fundamental period of vibration. This indicates that the scat-
ter in the input propagates to a larger scatter in the EDPs at the higher
hazard level, due to the large nonlinear demands on the structure at
higher seismic intensities.

Marco Faggella et al. / Structural Safety 44 (2013) 11–27 19
Fig. 9. Building global and local responses to ground motion TO ttrh02 (median GM for local response EDP = max curvature Y in the 2nd story column labeled 2008) scaled to 10%
PE in 50 years hazard level.
Figs. 12 and 13 show the empirical cumulative distribution func-
tion (CDF) plots of the maximum (over all stories) peak interstory drift
ratio (max PIDR) and the maximum (over all floors) PFA (max PFA)
at the 50% and 10% PE in 50 years hazard level, respectively. These
CDF plots provide the probability that a specified value of an EDP
(here max PIDR and max PFA) has not been exceeded within a sample
of 20 data points which represent the outcomes of the ensemble of
nonlinear time-history analyses performed at a given seismic hazard
level. The CDF plots in Figs. 12 (a) and 13 (a) provide four versions of
the max PIDR, namely: (1) max PIDR in the X-direction (label X); (2)
max PIDR in the Y-direction (label Y); (3) maximum peak rotational
IDR (label R) defined as the maximum (over all floors) peak interstory
rotation multiplied by half the diagonal of the rectangular floor; and
(4) maximum peak resultant IDR (label V) which equals the square-
root of the sum of squares of max PIDRs in X and Y-directions. All the
aforementioned IDRs, including the rotational IDR and the resultant
IDR, are illustrated in Fig. 2 (b). Similarly, Figs. 12 (b) and 13 (b) provide
the corresponding four versions of the max PFA with the rotational
max PFA defined as the maximum (over all floors) peak floor angular
acceleration multiplied by half the diagonal of the rectangular floor.
Also, the coefficients of variation of the maximum (over all stories /
floors) peak values of the above EDPs are reported in Table 4 .
At the 50% PE in 50 years hazard level, the median value of the
max PIDR in the X-direction is about 1.0%, while the median value
of the max PIDR ratio V is about 1.4%, as shown in Fig. 12 (a). The
maximum (over all stories / floors) values of the rotational PIDRs and
rotational PFAs (R) are much smaller than their counterparts due to
the translational responses in the X and Y-directions (X, Y, and V)
because the building has a relatively high torsional stiffness. Also, the
max PIDR in the Y-direction (max PIDR Y , where Y is the direction
in which the ground motions are scaled to the same IM = S aY ( T 1 )) is
not systematically smaller or larger than the maximum PIDR in the
X-direction (max PIDR X ). On the other hand, the max PFA in the X-
direction (max PFA X ) is higher than the max PFA in the Y-direction
(max PFA Y ) at both hazard levels. Finally, at the 10% PE in 50 years
seismic hazard level ( Fig. 13 ), the structure undergoes large inelastic
deformations, mainly at the lower stories (first and second), with
median max PIDRs in the X and Y-directions both in the 2–3% range
( Fig. 13 (a)). The results in Table 4 show that the max PIDRs and
maximum peak floor displacements exhibit higher dispersions in the
X than in the Y-direction at 50% PE in 50 years hazard level, while
the opposite happens at the 10% PE in 50 years hazard level. The
dispersion in the max PFA is less sensitive to the response direction,
and is lower at the 10% PE in 50 years hazard level.
5. Statistical correlation between IMs and EDPs for a given
primary IM
The objective of the correlation study presented in this section is
to test the hypothesis that the primary IM = S aY ( T 1 ) is sufficient for

20 Marco Faggella et al. / Structural Safety 44 (2013) 11–27
Fig. 10. Ensembles of peak response profiles in X and Y-directions for peak floor displacements, peak interstory drift ratios, and peak floor accelerations at 50% PE in 50 years
hazard level (mean peak response profile in thick solid line).

Marco Faggella et al. / Structural Safety 44 (2013) 11–27 21
Fig. 11. Ensembles of peak response profiles in X and Y-directions for peak floor displacements, peak interstory drift ratios, and peak floor accelerations at 10% in 50 years hazard
level (mean peak response profile in thick solid line).

22 Marco Faggella et al. / Structural Safety 44 (2013) 11–27
Fig. 12. Empirical CDF plots of the (a) max PIDR in the X and Y-directions (labels X and Y), max peak rotational IDR (label R), max peak resultant IDR (label V); and (b) max PFA in
the X and Y-directions (labels X and Y), max peak rotational FA (label R), max peak resultant FA (label V) – 50% PE in 50 years hazard level.
Fig. 13. Empirical CDF plots of the (a) max PIDR in the X and Y-directions (labels X and Y), max peak rotational IDR (label R), max peak resultant IDR (label V); and (b) max PFA in
the X and Y-directions (labels X and Y), max peak rotational FA (label R), max peak resultant FA (label V) – 10% PE in 50 years hazard level.
Table 4
Coefficient-of-variations of maximum (over all stories / floors) peak response parameters at 50% and 10% PE in 50 years hazard levels.
Hazard level Peak floor disp. X Peak floor disp. Y
Peak interstory
drift X
Peak interstory
drift Y
Peak floor abs.
accel. X Peak floor abs. accel. Y
50% PE in 50 years 0.47 0.21 0.49 0.28 0.41 0.37
10% PE in 50 years 0.39 0.49 0.38 0.58 0.36 0.39

Marco Faggella et al. / Structural Safety 44 (2013) 11–27 23
the 3-D nonlinear response analysis of the low-rise building consid-
ered herein. The primary IM is insufficient if an EDP conditional on
S aY ( T 1 ) is strongly correlated to a secondary IM (strong correlation
is assumed here to correspond to statistical correlation coefficients
larger than 0.7). In other words, if the statistical correlation coeffi-
cient between the secondary IMs and an EDP conditional on S aY ( T 1 ) is
large, then there is some information in the spectral representation
of the ground motion records that can be used to better predict the
EDPs. Therefore, it can be said that there is convincing evidence that
the primary IM = S aY ( T 1 ) is not sufficient.
The probabilistic response analyses presented above were per-
formed after scaling the 20 input ground motions to the IM = S ay ( T 1 )
at different hazard levels. All the Y-direction components of the elas-
tic response spectra of the 20 scaled ground motion records intersect
at the S aY ( T 1 ) (primary IM), while the spectral ordinates at different
periods, or at all periods for the other two components, can have a
significant scatter, as shown in Figs. 5 –7 . To investigate the effect of
this scatter (variability) on the EDPs conditional on S aY ( T 1 ), a new
set of IMs referred to as secondary IMs is introduced. The secondary
IMs are defined as the spectral ordinates of the input ground motion
at periods different from T 1 in the Y-direction and at all periods in
the X-direction. In this study, the secondary IMs are selected as: (1)
S aY (1.5 T 1 ) and S aY (2 T 1 ), which are the Y-direction spectral accelera-
tions at shifted (elongated) fundamental mode periods representative
of a structure experiencing inelastic response and stiffness degrada-
tion; (2) S aY ( T 4 ), which is the spectral acceleration of the initial second
mode in the Y-direction; (3) PGA Y = S aY (T = 0); and (4) S aX ( T 2 ), which
is the spectral acceleration of the initial first mode in the X-direction.
Figs. 14 and 15 show, on the left column, the probability of ex-
ceedance (or MAR of exceedance) curves obtained for the secondary
IMs described above following the same procedure used to derive the
curves in Fig. 4 . Thus, the hazard curves obtained are derived starting
from the three white-filled points on the three uniform hazard spec-
tra at the secondary IM periods. These curves are used to determine
the hazard level of the spectral acceleration at the secondary IM pe-
riod for each of the 20 scaled ground motion records and for each of
the secondary IMs considered.
In each of the scatter plots shown on the right columns of Figs.
14 and 15 , the values of the EDPs considered (max PFA Y , max PIDR X ,
and max PIDR Y ) are plotted against the corresponding values of the
secondary IMs. The top X -axis indicates the PE in 50 years of the sec-
ondary IM defined in the legend of the bottom X -axis. The two groups
of 20 black and white points correspond to the Monte Carlo simulation
results of the building response performed based on the previously
defined ensemble of 20 ground motion records scaled to the 50% PE
in 50 years and 10% PE in 50 years hazard level, respectively, defined
in terms of IM = S aY ( T 1 ). In each of the scatter plots, the statistical cor-
relation coefficient between the considered EDPs and secondary IMs
are also shown. For example, Fig. 14 (b) shows that the max PIDR Y has
a moderate degree of statistical linear correlation ( ρ50 = 0.57) with
the secondary IM = S aY (1.5 T 1 ) at the 50% PE in 50 years hazard level
and a high correlation ( ρ10 = 0.91) at the 10% PE in 50 years hazard
level. Fig. 14 (d) indicates that the max PIDR Y has a moderate correla-
tion ( ρ50 = 0.57) with S aY (2 T 1 ) at the 50% PE in 50 years hazard level
and a high correlation ( ρ10 = 0.87) at the 10% PE in 50 years hazard
level. The statistical linear correlation of max PFA Y with the secondary
IM = S aY ( T 4 ) is found to be high at both the 50% PE in 50 years ( ρ50
= 0.88) and 10% PE in 50 years ( ρ10 = 0.88) hazard levels, as shown by
the fairly linear distribution of points in Fig. 14 (f).
The results in Fig. 14 (b) and (d) clearly indicate that the max PIDR Y
(conditional on the primary IM = S aY ( T 1 )) is significantly correlated
with the spectral ordinate of the Y component of the ground motion
records at elongated fundamental periods ( T = 1.5 T 1 and T = 2 T 1 ),
representative of a structure that has undergone significant inelastic
deformations. The degree of correlation increases with the hazard
level of the primary IM (from 50% PE in 50 years to 10% PE in 50 years)
as the level of inelastic demand on the structure increases. However,
the correlation of the max PIDR Y with PGA Y represented in Fig. 15 (c) is
high ( ρ50 = 0.70) at the lower hazard level of S aY ( T 1 ), and it decreases
( ρ10 = 0.39) at the higher hazard level of S aY ( T 1 ) of 10% PE in 50 years,
indicating that PGA Y is not a good predictor when nonlinear structural
response is observed.
Figs. 14 (f) and 15 (b) show that the max PFA Y is highly correlated
with the secondary IM = S aY ( T 4 ) (at the second mode frequency in the
Y-direction) and with PGA Y , and that the degree of correlation ( ρ50
= ρ10 = 0.88) with S aY ( T 4 ) is not affected by the hazard level of S aY ( T 1 ),
while it decreases (from ρ50 = 0.90 to ρ10 = 0.79) with increasing
hazard level of S aY ( T 1 ).
Fig. 15 (e) shows the correlation of the max PIDR X (interstory drift
ratio in the X-direction of the building) with the secondary IM S aX ( T 2 ),
where T 2 is the building first mode period in the X-direction. It was
shown that by scaling uniformly the three components of the 20
ground motion records to match a specified value ( Fig. 5 ) of S aY ( T 1 ) in
the Y-direction, a relatively high variability results ( Fig. 6 ) for spectral
ordinate S aX ( T 2 ), used here as secondary IM. The max PIDR X maintains
a high degree of correlation with S aX ( T 2 ) both at the lower and at the
higher hazard level ( ρ50 = 0.77 and ρ10 = 0.72, respectively) of S aY ( T 1 )
considered in this study.
It is worth noting that in Figs. 14 (b), (d), (f) and 15 (b), (c), (e), the
hazard level of the secondary IM (as provided by the top X -axis) varies
significantly from ground motion record to ground motion record and
is very different from the hazard level of the primary IM = S aY ( T 1 ) with
respect to which the ground motion records are conditioned.
It can be observed from Tables 2 –4 that the c.o.v. of the floor
displacements and interstory drift ratios in the Y-direction increase
with increasing intensity of the ground motion, as expected and pre-
viously reported in the literature [ 16 ]. However, the c.o.v. of these
same EDPs in the X-direction decrease with increasing hazard level.
In the X-direction, due to inelastic behavior of the structure and corre-
sponding period elongation, the first mode period in the X-direction
( T 2 ) shifts towards the first mode period in the Y-direction ( T 1 ), with
a reduction in the dispersion of the response spectra (as shown in
Fig. 6 ). Thus, in the X-direction, even though the c.o.v. of the floor
displacements and interstory drift ratios would tend to increase due
to the nonlinearity of the response, these c.o.v. are smaller for the 10%
PE in 50 years than the 50% PE in 50 years hazard level.
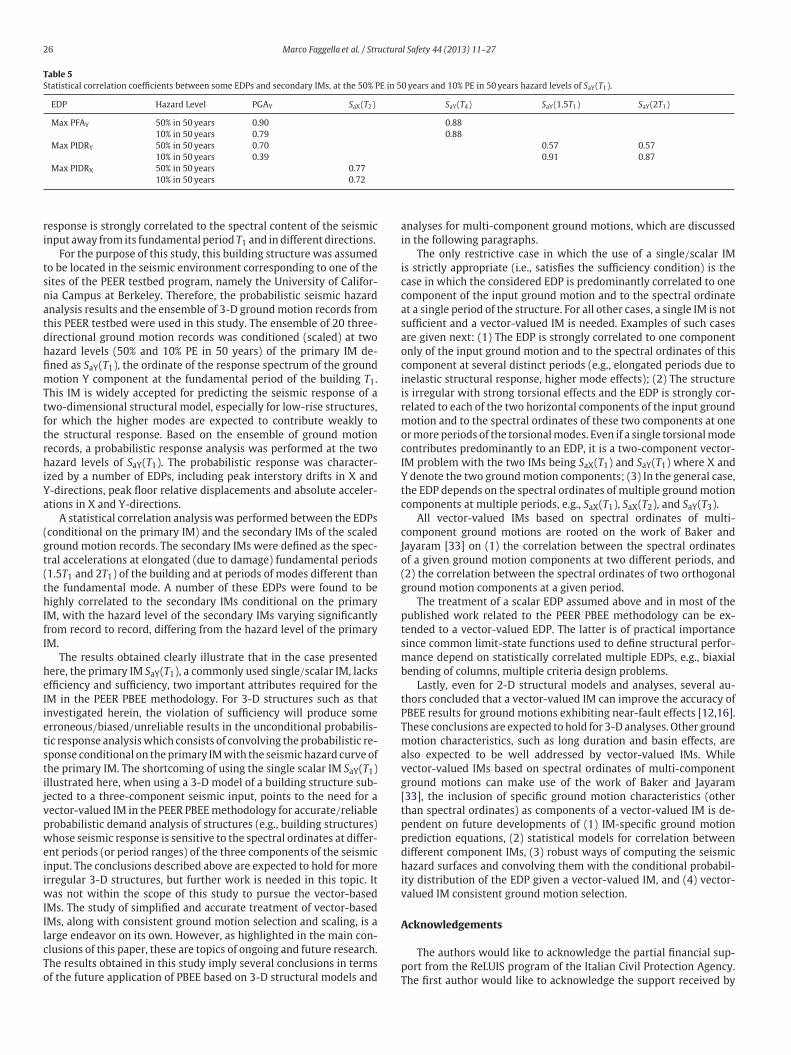
Table 5 summarizes the relevant statistical correlation coefficients
obtained between the EDPs and the secondary IMs at the two hazard
levels of S aY ( T 1 ) considered. In general, it can be concluded that a
moderate to high correlation exists between these EDPs and the sec-
ondary IMs. This is due to the nature of the scaling criterion based on
the single scalar IM = S aY ( T 1 ). This illustrates the inadequacy of using
a single scalar IM (here S aY ( T 1 )) to propagate the seismic input uncer-
tainty to the uncertainty of the EDPs in the case of a structure, such
as the low-rise building considered here, whose seismic response is
strongly correlated to the spectral acceleration at periods significantly
different from the initial fundamental period T 1 . In this case, the pri-
mary IM = S aY ( T 1 ) lacks efficiency and sufficiency as defined by Luco
and Cornell [ 8 ].
In summary, the significant degree of statistical correlation ob-
served between some EDPs conditional on S aY ( T 1 ) and various sec-
ondary IMs (see Figs. 14 and 15 , and Table 5 ) is convincing evidence
that the primary IM = S aY ( T 1 ) is not sufficient.
6. Summary and conclusions
In this paper, part of the PEER probabilistic PBEE methodology was
applied to an existing Italian four-story reinforced concrete build-
ing. This building was used as a testbed for evaluating the potential
inadequacy / limitations of using a single / scalar IM in the PEER PBEE
methodology when applied to a 3-D nonlinear model of a structure
(subjected to three-directional earthquake ground motions) whose

24 Marco Faggella et al. / Structural Safety 44 (2013) 11–27
Fig. 14. In left column, Figures (a), (c) and (e), probability of exceedance curves of the secondary IMs S aY (1.5 T 1 ), S aY (2 T 1 ) and S aY ( T 4 ), respectively. In right column, Figures (b), (d)
and (f), scatter plots and statistical correlation coefficients of the EDPs (max PIDR Y and max peak FA Y ) and the secondary IMs S aY (1.5T1), S aY (2T1) and S aY (T4), respectively.

Marco Faggella et al. / Structural Safety 44 (2013) 11–27 25
Fig. 15. In left column, Figures (a) and (d), probability of exceedance curves of the secondary IMs PGA Y and S aX ( T 2 ), respectively. In right column, Figures (b), (c) and (e) scatter
plots and statistical correlation coefficients of the EDPs (max PFA Y , max PIDR Y and max PIDR X ) and the secondary IMs PGA Y and S aX (T 2 ), respectively.
26 Marco Faggella et al. / Structural Safety 44 (2013) 11–27
Table 5
Statistical correlation coefficients between some EDPs and secondary IMs, at the 50% PE in 50 years and 10% PE in 50 years hazard levels of S aY ( T 1 ).
EDP Hazard Level PGA Y S aX ( T 2 ) S aY ( T 4 ) S aY (1.5 T 1 ) S aY (2 T 1 )
Max PFA Y 50% in 50 years 0.90 0.88
10% in 50 years 0.79 0.88
Max PIDR Y 50% in 50 years 0.70 0.57 0.57
10% in 50 years 0.39 0.91 0.87
Max PIDR X 50% in 50 years 0.77
10% in 50 years 0.72
r
i
t
s
n
a
t
d
h
fi
m
T
t
f
t
r
h
i
Y
a
(
g
t
(
t
h
I
f
I
h
e
I
i
e
t
s
t
i
j
v
p
w
e
i
i
w
I
I
l
c
T
o
esponse is strongly correlated to the spectral content of the seismic
nput away from its fundamental period T 1 and in different directions.
For the purpose of this study, this building structure was assumed
o be located in the seismic environment corresponding to one of the
ites of the PEER testbed program, namely the University of Califor-
ia Campus at Berkeley. Therefore, the probabilistic seismic hazard
nalysis results and the ensemble of 3-D ground motion records from
his PEER testbed were used in this study. The ensemble of 20 three-
irectional ground motion records was conditioned (scaled) at two
azard levels (50% and 10% PE in 50 years) of the primary IM de-
ned as S aY ( T 1 ), the ordinate of the response spectrum of the ground
otion Y component at the fundamental period of the building T 1 .
his IM is widely accepted for predicting the seismic response of a
wo-dimensional structural model, especially for low-rise structures,
or which the higher modes are expected to contribute weakly to
he structural response. Based on the ensemble of ground motion
ecords, a probabilistic response analysis was performed at the two
azard levels of S aY ( T 1 ). The probabilistic response was character-
zed by a number of EDPs, including peak interstory drifts in X and
-directions, peak floor relative displacements and absolute acceler-
tions in X and Y-directions.
A statistical correlation analysis was performed between the EDPs
conditional on the primary IM) and the secondary IMs of the scaled
round motion records. The secondary IMs were defined as the spec-
ral accelerations at elongated (due to damage) fundamental periods
1.5 T 1 and 2 T 1 ) of the building and at periods of modes different than
he fundamental mode. A number of these EDPs were found to be
ighly correlated to the secondary IMs conditional on the primary
M, with the hazard level of the secondary IMs varying significantly
rom record to record, differing from the hazard level of the primary
M.
The results obtained clearly illustrate that in the case presented
ere, the primary IM S aY ( T 1 ), a commonly used single / scalar IM, lacks
fficiency and sufficiency, two important attributes required for the
M in the PEER PBEE methodology. For 3-D structures such as that
nvestigated herein, the violation of sufficiency will produce some
rroneous / biased / unreliable results in the unconditional probabilis-
ic response analysis which consists of convolving the probabilistic re-
ponse conditional on the primary IM with the seismic hazard curve of
he primary IM. The shortcoming of using the single scalar IM S aY ( T 1 )
llustrated here, when using a 3-D model of a building structure sub-
ected to a three-component seismic input, points to the need for a
ector-valued IM in the PEER PBEE methodology for accurate / reliable
robabilistic demand analysis of structures (e.g., building structures)
hose seismic response is sensitive to the spectral ordinates at differ-
nt periods (or period ranges) of the three components of the seismic
nput. The conclusions described above are expected to hold for more
rregular 3-D structures, but further work is needed in this topic. It
as not within the scope of this study to pursue the vector-based
Ms. The study of simplified and accurate treatment of vector-based
Ms, along with consistent ground motion selection and scaling, is a
arge endeavor on its own. However, as highlighted in the main con-
lusions of this paper, these are topics of ongoing and future research.
he results obtained in this study imply several conclusions in terms
f the future application of PBEE based on 3-D structural models and
analyses for multi-component ground motions, which are discussed
in the following paragraphs.
The only restrictive case in which the use of a single / scalar IM
is strictly appropriate (i.e., satisfies the sufficiency condition) is the
case in which the considered EDP is predominantly correlated to one
component of the input ground motion and to the spectral ordinate
at a single period of the structure. For all other cases, a single IM is not
sufficient and a vector-valued IM is needed. Examples of such cases
are given next: (1) The EDP is strongly correlated to one component
only of the input ground motion and to the spectral ordinates of this
component at several distinct periods (e.g., elongated periods due to
inelastic structural response, higher mode effects); (2) The structure
is irregular with strong torsional effects and the EDP is strongly cor-
related to each of the two horizontal components of the input ground
motion and to the spectral ordinates of these two components at one
or more periods of the torsional modes. Even if a single torsional mode
contributes predominantly to an EDP, it is a two-component vector-
IM problem with the two IMs being S aX ( T 1 ) and S aY ( T 1 ) where X and
Y denote the two ground motion components; (3) In the general case,
the EDP depends on the spectral ordinates of multiple ground motion
components at multiple periods, e.g., S aX ( T 1 ), S aX ( T 2 ), and S aY ( T 3 ).
All vector-valued IMs based on spectral ordinates of multi-
component ground motions are rooted on the work of Baker and
Jayaram [ 33 ] on (1) the correlation between the spectral ordinates
of a given ground motion components at two different periods, and
(2) the correlation between the spectral ordinates of two orthogonal
ground motion components at a given period.
The treatment of a scalar EDP assumed above and in most of the
published work related to the PEER PBEE methodology can be ex-
tended to a vector-valued EDP. The latter is of practical importance
since common limit-state functions used to define structural perfor-
mance depend on statistically correlated multiple EDPs, e.g., biaxial
bending of columns, multiple criteria design problems.
Lastly, even for 2-D structural models and analyses, several au-
thors concluded that a vector-valued IM can improve the accuracy of
PBEE results for ground motions exhibiting near-fault effects [ 12 , 16 ].
These conclusions are expected to hold for 3-D analyses. Other ground
motion characteristics, such as long duration and basin effects, are
also expected to be well addressed by vector-valued IMs. While
vector-valued IMs based on spectral ordinates of multi-component
ground motions can make use of the work of Baker and Jayaram
[ 33 ], the inclusion of specific ground motion characteristics (other
than spectral ordinates) as components of a vector-valued IM is de-
pendent on future developments of (1) IM-specific ground motion
prediction equations, (2) statistical models for correlation between
different component IMs, (3) robust ways of computing the seismic
hazard surfaces and convolving them with the conditional probabil-
ity distribution of the EDP given a vector-valued IM, and (4) vector-
valued IM consistent ground motion selection.
Acknowledgements
The authors would like to acknowledge the partial financial sup-
port from the ReLUIS program of the Italian Civil Protection Agency.
The first author would like to acknowledge the support received by

Marco Faggella et al. / Structural Safety 44 (2013) 11–27 27
The Rotary Foundation and by the Regione Basilicata, Italy. The sec-
ond author would also like to acknowledge the support provided by
Oregon State University, by the Department of Civil Engineering of
the Universidade Nova de Lisboa, and by the Portuguese Foundation
for Science and Technology (BD / 17266 / 2004).
References
[1] Cornell CA, Krawinkler H. Progress and challenges in seismic performance as-
sessment. PEER News, April 2000:1–3. [2] Krawinkler H. A general approach to seismic performance assessment.Proc., in-
ternational conference on advances and new challenges in earthquake researchICANCEER, Hong Kong; 2002, Vol. 3, pp. 173–80.
[3] Deierlein GG, Krawinkler H, Cornell CA. A framework for performance-based
earthquake engineering. In: Proc., 2003 Pacific conference on earthquake engi-neering. Christchurch, New Zealand. 2003, 8 p.
[4] Krawinkler H, Miranda E. Performance-based earthquake engineering. In: YBozorgnia, VV Bertero (Eds.), Earthquake engineering, from engineering seis-
mology to performance-based engineering. Boca Raton, FL: CRC Press; 2004. [5] Moehle JP, Deierlein GG. A framework for performance-based earthquake en-
gineering. In: Proc., 13th world conference on earthquake engineering, paper#679. Vancouver, CA. 2004.
[6] Porter KA, Beck JL, Shaikhutdinov RV. Sensitivity of building loss estimates to
major uncertain variables. Earthquake Spectra 2002;18(4):719–43. [7] Conte JP, Zhang Y. Performance-based earthquake engineering: application to
an actual bridge-foundation-ground system. In: Proc., 12th Italian national con-ference on earthquake engineering. Pisa, Italy, June 10–14. 2007.
[8] Luco N, Cornell CA. Structure-specific scalar intensity measures for near-sourceand ordinary earthquake ground motions. Earthquake Spectra 2007;23(2):357–
92.
[9] Cornell CA. Engineering seismic risk analysis. Bull Seismol Soc Am1968;58:1583–606.
[10] Shome N, Cornell CA, Bazzurro P, Carballo JE. Earthquakes, records, and nonlin-ear responses. Earthquake Spectra 1998;14:469–500.
[11] Shome N, Cornell CA. Probabilistic seismic demand analysis of nonlinear struc-tures.Reliability of marine structures program report no. RMS-35. California:
Dept. of Civil and Environmental Engineering, Stanford University; 1999.
[12] Luco N. Probabilistic seismic demand analysis, SMRF connection fractures, andnear-source effects. [Ph.D. thesis]. California: Dept. of Civil and Environmental
Engineering, Stanford University; 2002. [13] Lee T-H, Mosalam KM. Seismic demand sensitivity of reinforced con-
crete shear-wall building using FOSM method. Earthquake Eng Struct Dyn2006;34(14):1719–36.
[14] Luco N, Manuel L, Baldava S, Bazzurro P. Correlation of damage of steel moment-
resisting frames to a vector-valued set of ground motion parameters. In: Proc.,9th international conference on structural safety and reliability. Rome, Italy,
June. 2005. [15] Baker JW, Cornell CA. Which spectral acceleration are you using? Earthquake
Spectra 2006;22(2):293–312. [16] Baker JW, Cornell CA. Vector-valued intensity measures incorporating spectral
shape for prediction of structural response. J Earthquake Eng 2008;12(4):534–
54.
[17] Cordova PP, Deierlein GG, Mehanny SSF, Cornell CA. Development of a two-
parameter seismic intensity measure and probabilistic assessment proce-dure.Proceedings of the 2nd U.S.-Japan workshop on performance-based seis-
mic design methodology for reinforced concrete building structures, PEER report2000 / 10. Berkeley: Pacific Earthquake Engineering Research Center, University
of California; 2000.
[18] Baker JW, Lin T, Shahi SK, Jayaram N. New ground motion selection proceduresand selected motions for the PEER transportation research program. PEER Tech-
nical Report 2011 / 03; 2011. 106p. [19] Decanini LD, De Sortis A, Goretti A, Liberatore L, Mollaioli F, Bazzurro P. Per-
formance of reinforced concrete buildings during the 2002 Molise, Italy, earth-quake. Earthquake Spectra 2004;20: S221–S255.
[20] McKenna F. Object-oriented finite element analysis: frameworks for analysis,algorithms and parallel computing. [Ph.D. dissertation]. Berkeley: University of
California; 1997.
[21] Mazzoni S, McKenna F, Scott MH, Fenves GL, et al. Open system for earthquakeengineering simulation – user command-language manual (version 2.0). Berke-
ley: Pacific Earthquake Engineering Research Center, University of California;2009.
[22] Spacone E, Camata G, Faggella M. Nonlinear models and nonlinear proceduresfor seismic analysis of reinforced concrete frame structures In: M Papadrakakis,
DC Charmpis, ND Lagaros, Y Tsompanakis (Eds.), Keynote lecture. ECCOMAS
thematic conference on computational methods in structural dynamics andearthquake engineering. Greece, Rethymno, Crete. 2007, June.
[23] Faggella M. Nonlinear modelling, seismic response analysis and probabilisticdemand sensitivity of a three-dimensional R / C building. [Ph.D. dissertation].
University “G.D ’ Annunzio” Chieti-Pescara; 2008. [24] Faggella M, Barbosa AR, Conte JP, Spacone E, Restrepo J. Seismic assessment
of R / C building structure through nonlinear probabilistic analysis with high-
performance computing. In: MERCEA08 seismic engineering international con-ference. Reggio Calabria, Italy. July 2008.
[25] McKenna F, Fenves GL. Using the OpenSees interpreter on parallel computers.
NEESit 2007, TN-2007–16. [26] Spacone E, Filippou FC, Taucer F. Fiber beam-column model for nonlinear
analysis of R / C frames: I. Formulation. Int J Earthquake Eng Struct Dyn1996;25(7):711–25.
[27] Coleman J, Spacone E. Localization issues in nonlinear force-based frame ele-ments. ASCE J Struct Eng 2001;127(11):1257–65.
[28] Kent DC, Park R. Flexural members with confined concrete. ASCE J Struct Div
1971;97(ST7):1964–90. [29] European Committee for Standardization (CEN). Design of structures for earth-
quake resistance. Brussels: Eurocode 8; 2004. [30] Porter KA. An overview of PEER’s performance-based earthquake engineering
methodology.Proc., ninth international conference on applications of statisticsand probability in civil engineering (ICASP9) San Francisco, CA, USA, July 6–9;
2003, Vol. 2, pp. 973–80. [31] Somerville PG. Ground motion time histories for the UC lab building. Pasadena,
CA: URS Corporation; 2001.
[32] Benjamin JR, Cornell AC. Probability, statistics and decision for civil engineers.New York, NY: McGraw-Hill; 1970.
[33] Baker JW, Jayaram N. Correlation of spectral acceleration values from NGAground motion models. Earthquake Spectra 2008;24(1):299–317.