probabilistic seismic hazard in terms of intensities for ... · pdf fileprobabilistic seismic...
TRANSCRIPT

Nat. Hazards Earth Syst. Sci., 8, 1431–1439, 2008www.nat-hazards-earth-syst-sci.net/8/1431/2008/© Author(s) 2008. This work is distributed underthe Creative Commons Attribution 3.0 License.
Natural Hazardsand Earth
System Sciences
Probabilistic seismic hazard in terms of intensities for Bulgaria andRomania – updated hazard maps
G. Leydecker* , H. Busche* , K.-P. Bonjer2, T. Schmitt1, D. Kaiser1, S. Simeonova3, D. Solakov3, and L. Ardeleanu4
1Federal Institute for Geosciences and Natural Resources, Hannover, Germany2Geophysical Institute University of Karlsruhe, Germany3Bulgarian Academy of Sciences, Geophys. Instit., Seismolog. Depart., Sofia, Bulgaria4National Institute for Earth Physics, Bucharest, Romania* formerly at: Federal Institute for Geosciences and Natural Resources, Hannover, Germany
Received: 18 July 2008 – Revised: 20 October 2008 – Accepted: 20 October 2008 – Published: 16 December 2008
Abstract. Since 2007 Bulgaria and Romania are members ofthe European Union. All member states have to introduce theEuropean earthquake building code EUROCODE 8 (EC 8) inthe coming years. Therefore, new seismic hazard maps haveto be calculated according to the recommendations in EC 8.Here the authors present a novel approach to compute suchhazard maps. We prefer to use the macroseismic intensity ashazard parameter because of two reasons:
– The irregular azimuthal attenuation pattern of theVrancea intermediate depth earthquakes can be advan-tageously taken into account by using detailed macro-seismic maps.
– The intensity is directly related to the degree of damageand is the original information in the historical earth-quake catalogues.
The main base of our probabilistic analysis is the earthquakecatalogue for SE-Europe (Shebalin et al., 1998) in combi-nation with national and regional catalogues. Fore- and af-tershocks were removed. Seismic source zones inside anarea of about 200 km around Romania and Bulgaria weredefined based on seismicity, neotectonics and geological de-velopment. For each seismic source the intensity-frequencyrelation was calculated and a maximum possible earthquakeas well as a seismogenic depth was estimated. An appropri-ate attenuation law was assumed. To cope with the irregularisoseismals of the Vrancea intermediate depth earthquakes, afactor� was included in the macroseismic attenuation law.
Using detailed macroseismic maps of three strong inter-mediate depth earthquakes,� was calculated for each obser-vation. Strong local variations of� are avoided by averaging
Correspondence to:G. Leydecker([email protected])
within grid cells of 0.5 degree in longitude and 0.25 degreein latitude.
The contributions of all seismic sources, the crustal normaldepth source zones and the Vrancea intermediate depth zone,were summed up and the annual probability of exceedancewas calculated. The contribution of the Vrancea interme-diate depth zone to each grid point was computed with thecorresponding representative� of this point; a seismogenicdepth of 120 km has been assumed.
Each final seismic hazard map is a combination of twomaps, the one for normal depth source zones and the one forthe Vrancea intermediate depth zone. This is illustrated for arecurrence period of 475 years. Additional hazard maps werecalculated for different recurrence periods.
1 Introduction
Romania and Bulgaria are situated in the Carpathian-BalkanRegion as a part of the Alpine-Himalayan seismic belt. Theyare characterized by high seismicity, and are exposed to ahigh seismic risk. Over the centuries, the two countries expe-rienced strong earthquakes. Because both countries are nowmembers of the European Union, they are committed to in-troduce the EUROCODE 8 (EC8). For the application ofthis building code seismic hazard maps with a single hazardparameter such as macroseismic intensity, peak ground ac-celeration or spectral acceleration, each is possible, have tobe calculated. Based on these results, hazard zones with ded-icated referenced peak ground accelerations have to be deter-mined in a further process. In this paper we present a specialway to compute such hazard maps. We prefer to use hereinstead of magnitude the macroseismic intensity to calculatehazard maps, because this parameter is the original parameter
Published by Copernicus Publications on behalf of the European Geosciences Union.

1432 G. Leydecker et al.: Seismic hazard maps for Bulgaria and Romania
1
M2
Fig. 1. Earthquake epicenter map (I0 = epicentral intensity) with theseismic source zones. Codes of source zones and their parametersare listed in Table 1.
in historical earthquake catalogues. A great advantage of us-ing intensities is that the very irregular pattern of the atten-uation field of the Vrancea intermediate depth earthquakescan be estimated from detailed macroseismic observations.The seismic hazard is computed with EQRISK (McGuire,1976), based on the probabilistic approach developed by Cor-nell (1968).
During the last decades, several papers have been pub-lished about the seismic hazard in Bulgaria and in Roma-nia. An overview about these approaches is already givenin Ardeleanu et al. (2005) for Romania and in Simeonovaet al. (2006) for Bulgaria. The presented earthquake hazardmaps are an update respectively improvement of the maps inArdeleanu et al. (2007).
1.0.1 Earthquake catalogue and seismic source zones
The main base of our probabilistic analysis is the earthquakecatalogue for SE-Europe (Shebalin et al., 1998) in combi-nation with the Romanian catalogues (for references see On-cescu et al., 1999) and some further national and regional cat-alogues (Christoskov et al., 1979; Grigorova et al., 1979; So-lakov and Simeonova, 1993; Papazachos et al., 2000, 2005).From these different catalogues Ardeleanu et al. (2005) andSimeonova et al. (2006) compiled a homogeneous earth-quake catalogue.
As a Poisson model for the seismicity is assumed, onlyindependent events should be included in the analyses. Thefore- and aftershocks were removed by using a space-timewindow. In the case of more than one earthquake within 10days and 50 km distance only the strongest event is used forthe statistics; the others are considered as statistically depen-dent and rejected from the catalogue. The resulting earth-quake catalogue of the considered area consists of nearly2750 events with epicentral intensitiesIepic≥4.
The completeness of the catalogue was examined usingStepp’s (1971) test. Stepp’s (1971) analysis provides amethod for the analytical determination of time intervals inwhich a particular intensity class (or magnitude) is likely tobe reported completely. The test results imply that it is possi-ble to create homogeneous data samples by determining in-tervals over which earthquakes in different intensity classesare completely reported.
The spatial pattern of seismicity in an area of about 200 kmaround the territory of Romania and Bulgaria is shown inFig. 1. The figure shows the earthquakes withIepic≥4 re-ported in the time 342 BC–1990 AD, together with the seis-mic source zones. Each zone is characterized and definedby its own specific seismicity, and geological and tectonicdevelopment. From our seismotectonic analysis of the con-sidered area this seems more appropriate than to use specificlinear fault structures. It is assumed that an earthquake canoccur within a source zone at every point with equal proba-bility. The boundaries of these zones were chosen to reflectthe seismicity adequately regarding tectonic units and litho-spheric structure. The seismic sources are mostly the sameas in Simeonova et al. (2006), and in Ardeleanu et al. (2007),with small differences in Bulgaria (Report GPh.I., 2007) andfor Vrancea intermediate depth seismic zone (see below). Allearthquakes outside the designed sources are assigned to the“background seismicity”.
From the analysis of the depth distribution it was recog-nized that the earthquakes in all zones occurred in the Earth’scrust (h<60 km), with the exception of the events in theVrancea (Romania) intermediate depth zone. The seismo-genic depth of each zone is defined as the depth of maximumseismic energy release and is given in Table 1.
The seismicity within the Vrancea (Romania) region con-sists of two depths domains: normal depth (less than 60 km)and intermediate depth (60–180 km) earthquakes. Due to ex-treme irregularities of the isoseismals of intermediate depthearthquakes their effects on seismic hazard have to be treatedseparately. The size of the Vrancea intermediate depth seis-mic zone is confined to an area of 20×60 km2 (Bonjer et al.,2005, 2008). For each seismic source the intensity-frequencyrelation was calculated and a maximum possible earthquakewas fixed. We assume a truncated exponential distributionas a seismicity model for each seismic source zone, definedby the parametersa and b of the intensity-frequency rela-tion and by the maximum possible earthquake with intensityImax. The parametersa andb of each seismic source zone
Nat. Hazards Earth Syst. Sci., 8, 1431–1439, 2008 www.nat-hazards-earth-syst-sci.net/8/1431/2008/

G. Leydecker et al.: Seismic hazard maps for Bulgaria and Romania 1433
Table 1. Parameters of intensity-frequency relations and input parameters for seismic hazard calculation.
Region code start time a b depth Imax Imaxyeara) interval value value km observed possible
Anatolian Faultb) AF 1860 131 3.5535 −0.2944 15 10.0 10.5Banat Nc) BA 1843 148 4.1065 −0.4325 10 8.5 8.5Birladd) BD 1896 95 3.7394 −0.5923 25 6.5 7.0Crisana Marmamures CM 1781 210 4.9340−0.5908 10 8.0 8.5Dinnaridi 1 D1 1860 131 4.5376 −0.4827 10 9.0 9.0Dinnaridi 2e) D2 1860 131 4.8515 −0.4209 15 9.5 9.5Banat Sc) DA 1864 127 3.6362 −0.4325 12 8.0 8.5Fagaras Campulung FC 1517 474 3.0427−0.2679 20 8.5 9.0Greece 1 G1 1860 131 4.9603−0.4472 20 10.0 10.5Greece 2 G2 1860 131 3.7025−0.3500 15 10.0 10.5Greece 3 G3 1860 131 2.2467−0.2635 15 8.5 9.0Gorna Orjahovitzaf) GO 1860 131 3.7210 −0.4320 10 9.5 9.5Hungary Central H2 1753 238 4.2196−0.4430 10 8.5 9.0Hungary + Serbiag) HS 1738 253 3.9957 −0.4609 8 8.5 9.0Kresnah) KR 1860 131 3.4021 −0.3536 15 10.0 10.5Marica 1k) M1 1860 131 2.8648 −0.3366 10 7.0 7.5Marica 2k) M2 1860 131 3.5383 −0.3366 10 9.5 10.0NE Bulgaria 1i) N1 1860 131 2.5390 −0.3228 20 8.5 9.0NE Bulgaria 2i) N2 1860 131 2.8401 −0.3228 15 7.5 8.0Predobroudjad) PD 1832 159 4.1374 −0.5923 20 7.5 7.5Serbia E S1 1886 105 4.6382−0.4761 10 9.0 9.5Serbia W S3 1894 97 6.0814 −0.8025 10 7.5 8.0Sofia SF 1800 191 4.5656 −0.5003 10 9.0 9.5Shablaj) SH 1860 131 3.7496 −0.4638 20 10.0 10.5Southern Bulgaria 2k) SL 1860 131 3.9272 −0.5380 10 7.5 8.0Southern Bulgaria 1k) SU 1860 131 4.1825 −0.5380 10 8.0 8.5South-West Bulgarial) SW 1860 131 4.1573 −0.4686 15 10.0 10.0Turkey T1 1860 131 3.5312 −0.3164 15 10.0 10.5Vrancea, normal depth VN 1802 189 3.0232−0.3846 30 8.0 8.5Vrancea, intermediate Vi 1701 290 4.2821−0.4150 120 9.0 9.5Background BG 1817 174 3.9493−0.4530 10 8.5 8.5
a) End year for all regions is 1990; usually, only events with intensities of 5.5 or more are considered.b) The regression curve in the cumulative intensity-frequency relation for region AF is calculated without the single event with intensity 10.0MSK for statistical reasons; the next lower class IX contains 9 events.c) For the two regions BA and DA, the events are added and a common intensity-frequency statistic is done, resulting in a common b-value.The a-value is computed using the cumulative number of events with intensity class 7.0 MSK and more for region BA; and with intensityclass 6.0 MSK and more for region DA.d) For the two regions BD and PD, the events are added and a common intensity-frequency statistic is done, resulting in a common b-value.The a-value for each region is computed, using the cumulative number of events with intensity class 5.0 and greater.e) The regression curve in the cumulative intensity-frequency relation for region D2 is calculated without the single event with intensity 10.0MSK, for statistical reasons; the next lower class IX contains 17 events.f) The regression curve in the cumulative intensity-frequency relation for region GO is calculated without the single event with intensity10.0 MSK, for statistical reasons; the next strongest event has intensity 8.0 MSK.g) Only events with intensities class 7.0 or more are considered.h) The regression curve in the cumulative intensity-frequency relation for region KR is calculated without the two events with intensity10.0 MSK, for statistical reasons; the next strongest event has intensity 8.0 MSK.i) For the two regions N1 and N2, the events are added and a common intensity-frequency statistic is done, resulting in a common b-value.However, the a-value for each region is computed separately, using the cumulative number of events with intensity class 6.0 and greater.j) The regression curve in the cumulative intensity-frequency relation for region SH is calculated without the single event with intensity10.0 MSK, for statistical reasons; then the strongest event has an intensity of 8.0 MSK. The statistic was done for a bigger area (thin lines inFig. 1) because of suspected mislocated events; the used size of the source region SH is shown by thick lines.k) For the regions M1 and M2 as well as for the regions SL and SU, the events are added and a common intensity-frequency statistic is done,resulting in a common b-value for each pair. The a-value for each region is computed, using the cumulative number of events with intensityclass 6.0 and greater.l) The regression curve in the cumulative intensity-frequency relation for region SW is calculated without the single event with intensity10.0 MSK, for statistical reasons; the next strongest event has intensity 8.0 MSK.
www.nat-hazards-earth-syst-sci.net/8/1431/2008/ Nat. Hazards Earth Syst. Sci., 8, 1431–1439, 2008

1434 G. Leydecker et al.: Seismic hazard maps for Bulgaria and Romania
Fig. 2. Macroseismic map (in MSK intensity) of the 1940 Vranceaearthquake (10 November 1940) with epicentral intensityIepic=IXMSK, moment magnitudeMw=7.7 and focal depthh=150 km. Theintensity values are from Demetrescu (1941) and are reduced ac-cording to Radu et al. (1990).
are calculated by the least square method using the followingequation:
logN(I) = a + bIepic (1)
whereN(I) is the cumulative number of earthquakes with in-tensityI≥Iepic. Half intensity values were used, in contrastto the earlier papers (Ardeleanu et al., 2005, 2007; Sime-onova et al., 2006) where the half intensities were roundedup to the next full number.
The beginning of the time period is chosen according toan assumed completeness of the catalogue for events greaterthan the lowest intensity values used in the statistics (Ta-ble 1).
Some of the seismic zones (as for example the seismicsources N1 and N2 in Northern Bulgaria, see Table 1) dis-play low and dispersed seismicity. Since it is not possible todetermine a reliable intensity-frequency relation for each ofthese sources separately, they are treated in a special way (seei) in Table 1) to calculate the intensity-frequency statistics.
All model parameters for PSHA are summarized in Ta-ble 1.
2 Attenuation models
2.1 Shallow earthquakes
We implemented into the program EQRISK the intensity at-tenuation function of Sponheuer (1960) which is based on
Fig. 3. Macroseismic map (in MSK intensity) of the 1977 Vranceaearthquake (4 March 1977) with epicentral intensityIepic=VIIIMSK, moment magnitudeMw=7.5 and focal depthh=94 km. In-tensity values are from Radu and Utale (1989) for the Romanianterritory. The Bulgaria data are a refined version of Grigerova etal. (1978). The yellow star represents the rupture initiation (epicen-ter), the white star the rupture termination (stopping) according toMuller et al. (1978).
Kovesligethy (1907). The attenuation is given by the follow-ing equation:
Isite = Iepic − 3log(r/h) − 1.3a(r − h) (2)
Iepic is the epicentral intensity,Isite the intensity at a siteat hypocentral distancer (km); h is the focal depth (km),and a the absorption coefficient. Here we considereda=0.002 km−1.
For a hazard curve at a site EQRISK cuts all source regionsinto finite ring segments with their assigned statistical param-eters. Then the site intensities caused by earthquakes of eachsegment are calculated assuming a standard deviation of halfan intensity for the attenuation function. The sum of the con-tributions of all regions finally leads to the annual probabilityof exceedance at each grid point of the hazard map. Thesecalculations are done for all points between 39◦ N to 49◦ Nand 19.5◦ E to 30.0◦ E every 0.1◦ in latitude and 0.2◦ in lon-gitude. Figure 5 shows the seismic hazard for Romania andBulgaria due to the shallow earthquakes for a recurrence pe-riod of 475 years.
2.1.1 Vrancea intermediate depth earthquakes
The macroseismic field of intermediate depth earthquakes ofthe Vrancea zone Vi (Romania) is very irregular as shownin Figs. 2 and 3 for the destroying earthquakes of 1940 and
Nat. Hazards Earth Syst. Sci., 8, 1431–1439, 2008 www.nat-hazards-earth-syst-sci.net/8/1431/2008/

G. Leydecker et al.: Seismic hazard maps for Bulgaria and Romania 1435
19˚
19˚
20˚
20˚
21˚
21˚
22˚
22˚
23˚
23˚
24˚
24˚
25˚
25˚
26˚
26˚
27˚
27˚
28˚
28˚
29˚
29˚
30˚
30˚
39˚ 39˚
40˚ 40˚
41˚ 41˚
42˚ 42˚
43˚ 43˚
44˚ 44˚
45˚ 45˚
46˚ 46˚
47˚ 47˚
48˚ 48˚
49˚ 49˚
19˚
19˚
20˚
20˚
21˚
21˚
22˚
22˚
23˚
23˚
24˚
24˚
25˚
25˚
26˚
26˚
27˚
27˚
28˚
28˚
29˚
29˚
30˚
30˚
39˚
40˚
41˚
42˚
43˚
44˚
45˚
46˚
47˚
48˚
49˚
19˚
19˚
20˚
20˚
21˚
21˚
22˚
22˚
23˚
23˚
24˚
24˚
25˚
25˚
26˚
26˚
27˚
27˚
28˚
28˚
29˚
29˚
30˚
30˚
39˚
40˚
41˚
42˚
43˚
44˚
45˚
46˚
47˚
48˚
49˚
9.8.
4.
7.6.10.
11.10.
11.
4.6.8.9.9.10.
10.11.
14.
10.
10.
9.10.
4.2.
5.8.5.9.6.8.
11.14.
10.
10.
10.
10.
10.
8.
3.6.3.5.6.6.6.4.6.6.5.7.9.10.10.11.16.
14.12.
10.
15.
12.
11.
12.
10.
3.4.6.5.6.6.5.6.7.7.6.6.4.8.5.9.12.12.17.
17.16.
15.
14.
13.
14.
13.
12.
14.
3.4.6.6.6.6.6.5.2.4.6.4.9.6.11.8.21.
18.
24.20.
23.
20.
21.
16.
19.
14.
6.11.5.6.7.8.9.8.5.8.6.12.13.9.17.18.24.26.
18.28.
18.
23.
18.
20.
17.
16.
1.6.8.7.8.7.8.6.9.8.7.8.10.17.17.16.24.17.43.
41.38.
34.
32.
22.
23.
20.
4.4.8.6.8.10.6.7.9.10.14.12.27.20.28.41.56.58.
54.61.
50.
30.
33.
24.
23.
20.
10.4.8.8.8.9.8.11.11.9.13.18.14.24.26.28.77.70.83.
122.88.
40.
32.
26.
28.
16.
17.
11.4.8.4.8.12.9.10.9.8.13.12.11.28.34.31.147.236.250.
126.76.
34.
33.
26.
18.
20.
12.
16.
8.6.5.9.6.11.12.8.12.17.24.40.47.71.138.250.250.
225.67.
43.
28.
22.
19.
16.
11.
13.
5.9.8.10.8.10.11.18.16.30.38.41.77.182.168.
84.36.
28.
21.
19.
13.
22.
10.
19.
13.8.5.10.6.8.8.14.12.14.14.18.27.30.33.47.21.
34.17.
17.
13.
8.
16.
8.12.10.12.13.14.18.23.19.25.25.
33.18.
13.
10.
17.
21.
15.
5.9.12.13.12.18.13.15.29.43.
24.
19.
12.
16.
12.
13.
12.18.
12.
12.
4.4.4.4.4.4.4.4.4.4.4.4.4.4.4.4.4.4.6.
7.
8.
4.
4.
4.
4.
4.
4.
4.4.4.4.4.4.4.4.4.4.4.4.4.4.4.4.4.6.
6.
6.
4.
4.
4.
4.
4.4.4.4.4.6.6.4.4.4.4.4.4.4.4.
6.
6.
4.
4.
4.4.4.4.4.
4.4.4.4.
4.4.
6.
4.
4.4.
4.
7.
4.4.
4.4.
18.
10.
4.4.4.
10.
4.4.
16.
12.
4.4.4.
16.
6.8.
14.
6.8.
4.4.5.6.
4.4.6.8.9.6.
4.4.6.9.
16.
18.
15.
4.4.4.6.9.8.5.7.6.7.
15.
14.
4.4.4.4.6.6.4.5.4.6.
24.
24.
14.
14.
4.4.4.4.4.4.4.4.4.4.4.6.8.8.8.10.10.
24.16.
16.16.
14.
10.
10.
8.
10.
4.4.4.4.4.4.4.4.4.4.4.4.4.4.4.4.4.4.4.4.4.4.4.4.4.4.4.4.
4.4.
4.
4.
4.
4.
4.
4.
4.
4.
4.
4.
4.4.4.4.4.4.4.4.4.4.4.4.4.4.4.4.4.4.4.4.4.4.4.4.4.4.4.4.
4.4.
4.
4.
4.
4.
4.
4.
4.
4.
4.
4.
4.4.4.4.4.4.4.4.4.4.4.4.4.4.4.4.4.4.4.4.4.4.4.4.4.4.6.6.
4.4.
6.
4.
4.
4.
4.
4.
4.
4.
4.
4.
4.4.4.4.4.4.4.
4.
4.
4.
4.4.4.4.4.4.4.
4.
4.
4.
4.4.4.4.4.4.4.
4.
4.
4.
4.4.4.4.4.4.4.
4.
4.
4.
4.4.4.4.4.4.4.
4.
4.
4.
4.4.4.4.4.4.4.
8.
6.
4.
4.4.4.4.4.4.4.
8.
6.
4.
4.4.4.4.4.4.4.
8.
6.
4.
4.4.4.4.4.4.4.
8.
6.
4.
4.4.4.4.4.4.4.
10.
7.
4.
4.4.4.4.4.4.4.
10.
7.
4.
4.4.4.4.4.4.4.
10.
7.
4.
4.4.4.4.4.4.4.
10.
7.
4.
4.4.4.4.4.4.4.
14.
10.
6.
4.4.4.4.4.4.4.
14.
10.
6.
4.4.4.4.4.4.4.
12.
8.
4.
4.4.4.4.4.4.4.
10.
7.
4.
4.4.4.4.4.4.4.
8.
6.
4.
4.4.4.4.4.4.4.4.4.4.4.4.4.4.4.4.4.4.4.4.4.4.6.6.8.14.18.8.
8.8.
8.
8.
8.
8.
6.
8.
6.
6.
4.
4.
Fig. 4. The distribution of�. The � pattern mimics the trendsof the general strong decay of the seismic intensity pattern of thebig intermediate depth Vrancea earthquakes in NW-SE direction.The green typed� values are based on macroseismic observations.Because no detailed digital macroseismic data outside Bulgaria andRomania were available, the� values there were fixed by us (rednumbers). Therefore the seismic hazard values outside Bulgaria andRomania in Fig. 6–10 may be erroneous.
1977. These figures demonstrate as well as the macroseismicfield of the strong earthquake in 1986 (Radu et al., 1987) thatthe attenuation in the North-West and South-East directionsis substantially higher than in the North-East and South-Westdirections. To account for the apparent azimuthal depen-dency of the Vrancea intermediate depth earthquake atten-uation, different approaches were made and several attenu-ation relationships were developed (e.g. Marza and Pantea,1995; Lungu et al., 1997; Moldovan et al., 2000; Radulian etal., 2006). These investigations do not consider the influenceof the local site responses, but rather average those out. Wetherefore took a different approach.
As the attenuation relation (Eq. 2) does not consider az-imuthal differences in attenuation, a new empirical approachis chosen to take the directionality of attenuation and localsite effects into account. We introduced a factor� (Arde-leanu et al., 2005) into Eq. (2). This new attenuation modelfor Vrancea intermediate depth earthquakes is given by therelation:
Isite = Iepic − 3log(r/h) − 1.3α ∗ �(r − h) (3)
20˚
20˚
21˚
21˚
22˚
22˚
23˚
23˚
24˚
24˚
25˚
25˚
26˚
26˚
27˚
27˚
28˚
28˚
29˚
29˚
30˚
30˚
41˚ 41˚
42˚ 42˚
43˚ 43˚
44˚ 44˚
45˚ 45˚
46˚ 46˚
47˚ 47˚
48˚ 48˚
49˚ 49˚
5.5
6.5
6.5
6.5
6.5
7.5
7.5
7.5
7.57.5
7.5
8.5
5.5 6.5 7.5 8.5 9.5 10.5
20˚
20˚
21˚
21˚
22˚
22˚
23˚
23˚
24˚
24˚
25˚
25˚
26˚
26˚
27˚
27˚
28˚
28˚
29˚
29˚
30˚
30˚
41˚ 41˚
42˚ 42˚
43˚ 43˚
44˚ 44˚
45˚ 45˚
46˚ 46˚
47˚ 47˚
48˚ 48˚
49˚ 49˚
20˚
20˚
21˚
21˚
22˚
22˚
23˚
23˚
24˚
24˚
25˚
25˚
26˚
26˚
27˚
27˚
28˚
28˚
29˚
29˚
30˚
30˚
41˚ 41˚
42˚ 42˚
43˚ 43˚
44˚ 44˚
45˚ 45˚
46˚ 46˚
47˚ 47˚
48˚ 48˚
49˚ 49˚
475 aNZ
Bucharest
Iasi
Cluj Napoca
Timisoara
Craiova
Focsani
Constanta
SuceavaBaia Mare
Brasov Sibiu
Plovdiv
Sofia
Ruse
Pleven Varna
Burgas
Fig. 5. Seismic hazard from source zones of normal depth for arecurrence period of 475 years; colours represent the intensities inMSK-1964 scale.
20˚
20˚
21˚
21˚
22˚
22˚
23˚
23˚
24˚
24˚
25˚
25˚
26˚
26˚
27˚
27˚
28˚
28˚
29˚
29˚
30˚
30˚
41˚ 41˚
42˚ 42˚
43˚ 43˚
44˚ 44˚
45˚ 45˚
46˚ 46˚
47˚ 47˚
48˚ 48˚
49˚ 49˚
5.5
5.5
5.55.5
5.5
5.5
5.5
5.5
5.5
5.5
5.5
6.5
6.5
6.5
6.5
6.5
6.5
6.5
6.5
6.5
6.56.5
6.5
7.5
7.5
8.5
5.5 6.5 7.5 8.5 9.5 10.5
20˚
20˚
21˚
21˚
22˚
22˚
23˚
23˚
24˚
24˚
25˚
25˚
26˚
26˚
27˚
27˚
28˚
28˚
29˚
29˚
30˚
30˚
41˚ 41˚
42˚ 42˚
43˚ 43˚
44˚ 44˚
45˚ 45˚
46˚ 46˚
47˚ 47˚
48˚ 48˚
49˚ 49˚
20˚
20˚
21˚
21˚
22˚
22˚
23˚
23˚
24˚
24˚
25˚
25˚
26˚
26˚
27˚
27˚
28˚
28˚
29˚
29˚
30˚
30˚
41˚ 41˚
42˚ 42˚
43˚ 43˚
44˚ 44˚
45˚ 45˚
46˚ 46˚
47˚ 47˚
48˚ 48˚
49˚ 49˚
475 a120km VI
Bucharest
Iasi
Cluj Napoca
Timisoara
Craiova
Focsani
Constanta
SuceavaBaia Mare
Brasov Sibiu
Plovdiv
Sofia
Ruse
Pleven Varna
Burgas
Fig. 6. Seismic hazard from Vrancea earthquakes of intermediatedepth for a recurrence period of 475 years; colours represent inten-sities in MSK-1964 scale. The hazard values outside Romania andBulgaria may be erroneous (see remarks to Fig. 4).
www.nat-hazards-earth-syst-sci.net/8/1431/2008/ Nat. Hazards Earth Syst. Sci., 8, 1431–1439, 2008

1436 G. Leydecker et al.: Seismic hazard maps for Bulgaria and Romania
20˚
20˚
21˚
21˚
22˚
22˚
23˚
23˚
24˚
24˚
25˚
25˚
26˚
26˚
27˚
27˚
28˚
28˚
29˚
29˚
30˚
30˚
41˚ 41˚
42˚ 42˚
43˚ 43˚
44˚ 44˚
45˚ 45˚
46˚ 46˚
47˚ 47˚
48˚ 48˚
49˚ 49˚
5.5
6.5
6.5
6.5
6.5
6.5
6.5
7.5
7.5
7.5
7.5
7.5
7.5
7.5
7.5
7.5
8.5
8.5
5.5 6.5 7.5 8.5 9.5 10.5
20˚
20˚
21˚
21˚
22˚
22˚
23˚
23˚
24˚
24˚
25˚
25˚
26˚
26˚
27˚
27˚
28˚
28˚
29˚
29˚
30˚
30˚
41˚ 41˚
42˚ 42˚
43˚ 43˚
44˚ 44˚
45˚ 45˚
46˚ 46˚
47˚ 47˚
48˚ 48˚
49˚ 49˚
20˚
20˚
21˚
21˚
22˚
22˚
23˚
23˚
24˚
24˚
25˚
25˚
26˚
26˚
27˚
27˚
28˚
28˚
29˚
29˚
30˚
30˚
41˚ 41˚
42˚ 42˚
43˚ 43˚
44˚ 44˚
45˚ 45˚
46˚ 46˚
47˚ 47˚
48˚ 48˚
49˚ 49˚
475 a120km All
Bucharest
Iasi
Cluj Napoca
Timisoara
Craiova
Focsani
Constanta
SuceavaBaia Mare
Brasov Sibiu
Plovdiv
Sofia
Ruse
Pleven Varna
Burgas
Fig. 7. Seismic hazard from all source zones (zones of crustal eventsand Vrancea events of intermediate depth) for a recurrence periodof 475 years; colours represent intensities in MSK-1964 scale. Thehazard values outside Romania and Bulgaria may be erroneous (seeremarks to Fig. 4).
For the determination of� the following digitized macro-seismic data were used:
– Vrancea 10 November 1940 (Iepic = IX MSK, momentmagnitudeMw=7.7,h=150 km, Fig. 2): The macroseis-mic map of Demetrescu (1941) with the intensity distri-bution in Romania and Bulgaria was digitized and geo-referenced by the Institute for Photogrammetry and Re-mote Sensing (IPRS) of Karlsruhe University. The dataof the Republic of Moldova and Ukraine were takenfrom the map of Sagalova (for details see Bonjer etal., 2008). According to Radu et al. (1990), Radu andSandi (1992) as well as Atanasiu and Krautner (1941)reduced intensity values of the original data of Deme-trescu and Sagalova were used to meet the MSK-scaleand thus enabling comparison with the 1977 and 1986Vrancea earthquake intensities.
– Vrancea 4 March 1977 (Iepic=VIII MSK, Mw=7.5,h=94 km, Fig. 3), and 30 August 1986 (Iepic=VIIIMSK, Mw=7.2, h=130 km). Because no listings ofthe intensities of the Romanian territory were available,the macroseismic maps of Radu and Utale (1989) andRadu et al. (1987) with a scale of 1:1 000 000 weredigitized and geo-referenced as well by the IPRS ofKarlsruhe University. For the 1977 intensities of the
20˚
20˚
21˚
21˚
22˚
22˚
23˚
23˚
24˚
24˚
25˚
25˚
26˚
26˚
27˚
27˚
28˚
28˚
29˚
29˚
30˚
30˚
41˚ 41˚
42˚ 42˚
43˚ 43˚
44˚ 44˚
45˚ 45˚
46˚ 46˚
47˚ 47˚
48˚ 48˚
49˚ 49˚
5.5
5.5
5.5
5.5
5.5
6.5
6.5
6.5
6.5
6.5
6.5
6.57.5
7.5
7.5
5.5 6.5 7.5 8.5 9.5 10.5
20˚
20˚
21˚
21˚
22˚
22˚
23˚
23˚
24˚
24˚
25˚
25˚
26˚
26˚
27˚
27˚
28˚
28˚
29˚
29˚
30˚
30˚
41˚ 41˚
42˚ 42˚
43˚ 43˚
44˚ 44˚
45˚ 45˚
46˚ 46˚
47˚ 47˚
48˚ 48˚
49˚ 49˚
20˚
20˚
21˚
21˚
22˚
22˚
23˚
23˚
24˚
24˚
25˚
25˚
26˚
26˚
27˚
27˚
28˚
28˚
29˚
29˚
30˚
30˚
41˚ 41˚
42˚ 42˚
43˚ 43˚
44˚ 44˚
45˚ 45˚
46˚ 46˚
47˚ 47˚
48˚ 48˚
49˚ 49˚
95 a120km All
Bucharest
Iasi
Cluj Napoca
Timisoara
Craiova
Focsani
Constanta
SuceavaBaia Mare
Brasov Sibiu
Plovdiv
Sofia
Ruse
Pleven Varna
Burgas
Fig. 8. Seismic hazard from all source zones (zones of crustal eventsand Vrancea events of intermediate depth) for a recurrence periodof 95 years; colours represent intensities in MSK-1964 scale. Thehazard values outside Romania and Bulgaria may be erroneous (seeremarks to Fig. 4).
Bulgarian territory an upgraded version (Glavcheva,1983) of the Grigerova et al. (1978) intensities wasused. R. Glavcheva (personal communication) also pro-vided the listing of the Bulgarian intensity data for theVrancea 1986 event.
In Ardeleanu et al. (2005) the macroseismic data of the 30May 1990 event were used instead of those of the 1940 event,as we do here. The reason for this exchange is that in the1990 event two shocks with comparable strength occurredwithin 14 h. So, the macroseismic effects of both events maybe superimposed and therefore inseparable.
� was calculated for each observation point fixingα=0.001 km−1. Strong local variations of� were avoided bycalculating mean values inside grid cells of 0.5 degree in lon-gitude and 0.25 degree in latitude, separately for each event.From these mean grid values the median is taken. Intensitiesfor rectangles without observations were 2-D-interpolated,respectively extrapolated. Figure 4 shows the resulting�
field. The contribution of the Vrancea intermediate depthsource zone to each grid point was computed with the corre-sponding representative� of this point.
Using the assigned� value for each point of computation,the seismic hazard of the Vrancea intermediate depth zone(Vi) is calculated in the same way as for the crustal zones.
Nat. Hazards Earth Syst. Sci., 8, 1431–1439, 2008 www.nat-hazards-earth-syst-sci.net/8/1431/2008/
G. Leydecker et al.: Seismic hazard maps for Bulgaria and Romania 1437
20˚
20˚
21˚
21˚
22˚
22˚
23˚
23˚
24˚
24˚
25˚
25˚
26˚
26˚
27˚
27˚
28˚
28˚
29˚
29˚
30˚
30˚
41˚ 41˚
42˚ 42˚
43˚ 43˚
44˚ 44˚
45˚ 45˚
46˚ 46˚
47˚ 47˚
48˚ 48˚
49˚ 49˚
5.5
6.5
6.5
7.5
7.5
7.57.5
7.5
7.5
7.5
8.5
8.5
8.5
8.5
8.58.
5
8.5
9.5
9.5
9.5
5.5 6.5 7.5 8.5 9.5 10.5
20˚
20˚
21˚
21˚
22˚
22˚
23˚
23˚
24˚
24˚
25˚
25˚
26˚
26˚
27˚
27˚
28˚
28˚
29˚
29˚
30˚
30˚
41˚ 41˚
42˚ 42˚
43˚ 43˚
44˚ 44˚
45˚ 45˚
46˚ 46˚
47˚ 47˚
48˚ 48˚
49˚ 49˚
20˚
20˚
21˚
21˚
22˚
22˚
23˚
23˚
24˚
24˚
25˚
25˚
26˚
26˚
27˚
27˚
28˚
28˚
29˚
29˚
30˚
30˚
41˚ 41˚
42˚ 42˚
43˚ 43˚
44˚ 44˚
45˚ 45˚
46˚ 46˚
47˚ 47˚
48˚ 48˚
49˚ 49˚
2,475 a120km All
Bucharest
Iasi
Cluj Napoca
Timisoara
Craiova
Focsani
Constanta
SuceavaBaia Mare
Brasov Sibiu
Plovdiv
Sofia
Ruse
Pleven Varna
Burgas
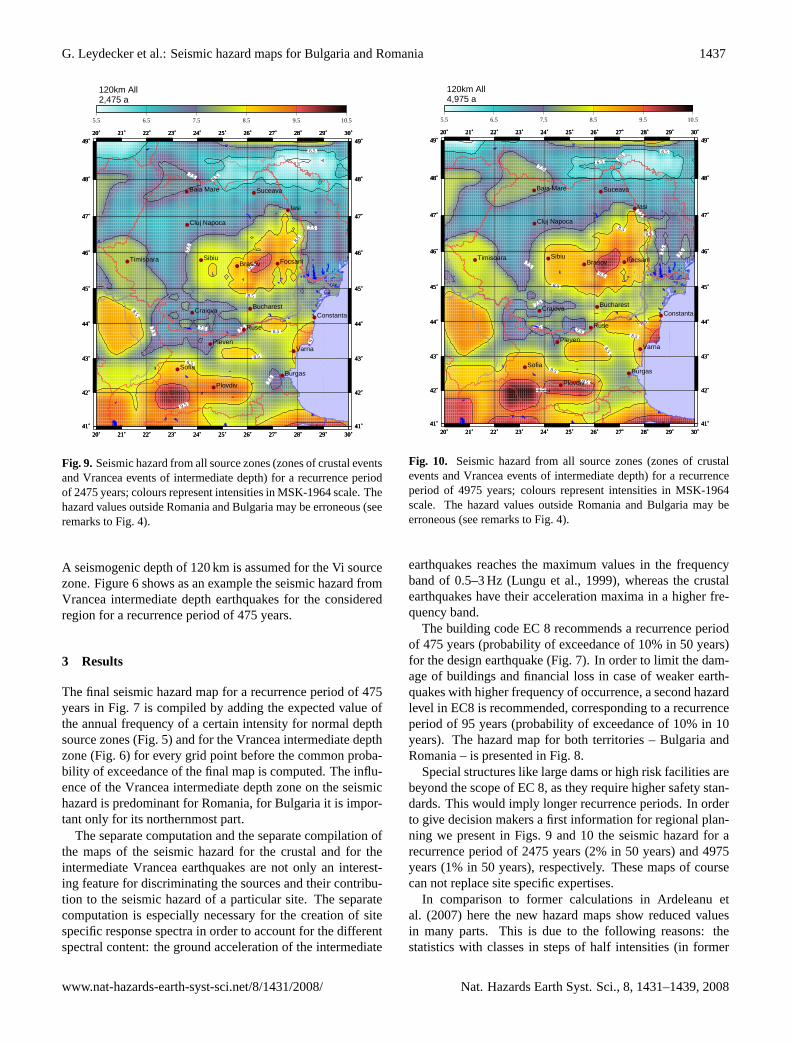
Fig. 9. Seismic hazard from all source zones (zones of crustal eventsand Vrancea events of intermediate depth) for a recurrence periodof 2475 years; colours represent intensities in MSK-1964 scale. Thehazard values outside Romania and Bulgaria may be erroneous (seeremarks to Fig. 4).
A seismogenic depth of 120 km is assumed for the Vi sourcezone. Figure 6 shows as an example the seismic hazard fromVrancea intermediate depth earthquakes for the consideredregion for a recurrence period of 475 years.
3 Results
The final seismic hazard map for a recurrence period of 475years in Fig. 7 is compiled by adding the expected value ofthe annual frequency of a certain intensity for normal depthsource zones (Fig. 5) and for the Vrancea intermediate depthzone (Fig. 6) for every grid point before the common proba-bility of exceedance of the final map is computed. The influ-ence of the Vrancea intermediate depth zone on the seismichazard is predominant for Romania, for Bulgaria it is impor-tant only for its northernmost part.
The separate computation and the separate compilation ofthe maps of the seismic hazard for the crustal and for theintermediate Vrancea earthquakes are not only an interest-ing feature for discriminating the sources and their contribu-tion to the seismic hazard of a particular site. The separatecomputation is especially necessary for the creation of sitespecific response spectra in order to account for the differentspectral content: the ground acceleration of the intermediate
20˚
20˚
21˚
21˚
22˚
22˚
23˚
23˚
24˚
24˚
25˚
25˚
26˚
26˚
27˚
27˚
28˚
28˚
29˚
29˚
30˚
30˚
41˚ 41˚
42˚ 42˚
43˚ 43˚
44˚ 44˚
45˚ 45˚
46˚ 46˚
47˚ 47˚
48˚ 48˚
49˚ 49˚
6.5
6.56.5
7.5
7.5
7.5
7.57.
5
7.5
7.5 7.5
8.5
8.5
8.5
8.5
8.5
8.5
8.5
9.5
9.5
9.5
9.5
5.5 6.5 7.5 8.5 9.5 10.5
20˚
20˚
21˚
21˚
22˚
22˚
23˚
23˚
24˚
24˚
25˚
25˚
26˚
26˚
27˚
27˚
28˚
28˚
29˚
29˚
30˚
30˚
41˚ 41˚
42˚ 42˚
43˚ 43˚
44˚ 44˚
45˚ 45˚
46˚ 46˚
47˚ 47˚
48˚ 48˚
49˚ 49˚
20˚
20˚
21˚
21˚
22˚
22˚
23˚
23˚
24˚
24˚
25˚
25˚
26˚
26˚
27˚
27˚
28˚
28˚
29˚
29˚
30˚
30˚
41˚ 41˚
42˚ 42˚
43˚ 43˚
44˚ 44˚
45˚ 45˚
46˚ 46˚
47˚ 47˚
48˚ 48˚
49˚ 49˚
4,975 a120km All
Bucharest
Iasi
Cluj Napoca
Timisoara
Craiova
Focsani
Constanta
SuceavaBaia Mare
Brasov Sibiu
Plovdiv
Sofia
Ruse
Pleven Varna
Burgas
Fig. 10. Seismic hazard from all source zones (zones of crustalevents and Vrancea events of intermediate depth) for a recurrenceperiod of 4975 years; colours represent intensities in MSK-1964scale. The hazard values outside Romania and Bulgaria may beerroneous (see remarks to Fig. 4).
earthquakes reaches the maximum values in the frequencyband of 0.5–3 Hz (Lungu et al., 1999), whereas the crustalearthquakes have their acceleration maxima in a higher fre-quency band.
The building code EC 8 recommends a recurrence periodof 475 years (probability of exceedance of 10% in 50 years)for the design earthquake (Fig. 7). In order to limit the dam-age of buildings and financial loss in case of weaker earth-quakes with higher frequency of occurrence, a second hazardlevel in EC8 is recommended, corresponding to a recurrenceperiod of 95 years (probability of exceedance of 10% in 10years). The hazard map for both territories – Bulgaria andRomania – is presented in Fig. 8.
Special structures like large dams or high risk facilities arebeyond the scope of EC 8, as they require higher safety stan-dards. This would imply longer recurrence periods. In orderto give decision makers a first information for regional plan-ning we present in Figs. 9 and 10 the seismic hazard for arecurrence period of 2475 years (2% in 50 years) and 4975years (1% in 50 years), respectively. These maps of coursecan not replace site specific expertises.
In comparison to former calculations in Ardeleanu etal. (2007) here the new hazard maps show reduced valuesin many parts. This is due to the following reasons: thestatistics with classes in steps of half intensities (in former
www.nat-hazards-earth-syst-sci.net/8/1431/2008/ Nat. Hazards Earth Syst. Sci., 8, 1431–1439, 2008

1438 G. Leydecker et al.: Seismic hazard maps for Bulgaria and Romania
calculations half intensities have been counted to the nexthigher full intensity), enlarging the� field to the Bulgar-ian territory because of new available digitized macroseismicdata from Vrancea intermediate depth earthquakes (in formercalculations the� values for Bulgaria were assumed conser-vatively), and the downsizing of the Vrancea intermediatedepth seismic source zone based on precise hypocenter lo-calization. This in all results in more realistic seismic hazardmaps.
Acknowledgements.The macroseismic map of Demetrescu (1941)was made available by Traian Moldoveanu, GEOTEC ConsultantBucharest. We thank W. Weisbrich, Institute of Photogrammetryand Remote Sensing, Karlsruhe University for digitizing and geo-referencing this map as well as the maps of Radu and co-workersof the 1977 and 1986 Vrancea earthquakes. The digital file of the1977 and 1986 Vrancea macroseismic data for Bulgaria was madeavailable by I. Aleksandrova and B. Babachkova of the BulgarianAcademy of Sciences. One of the authors (K.-P. B.) enjoyed thediscussion with R. Glavcheva, Bulgarian Academy of Sciences,and thanks for the generous sharing of her profound knowledgeof the macroseismic scales used in Bulgaria and Romania for thedetermination of the intensities of the Vrancea 10 November 1940earthquake. We are very grateful to Dieter Mayer-Rosa, Zurich,and Anton Zaicenco, Chisinau, for their constructive comments andimportant suggestions, which helped to improve the manuscript.
Edited by: M. ContadakisReviewed by: D. Mayer-Rosa and A. Zaicenco
References
Ardeleanu, L., Leydecker, G., Bonjer, K.-P., Busche, H., Kaiser, D.,and Schmitt, T.: Probabilistic seismic hazard map for Romaniaas a basis for a new building code, Nat. Hazards Earth Syst. Sci.,5, 679–684, 2005,http://www.nat-hazards-earth-syst-sci.net/5/679/2005/.
Ardeleanu, L., Leydecker, G., Bonjer, K.-P., Schmitt, T., Busche,H., Kaiser, D., Simeonova, S., and Solakov, D.: Probabilis-tic seismic hazard maps in terms of intensities for Romaniaand Bulgaria – Proceedings of International Symposium onStrong Vrancea Earthquakes and Risk Mitigation, 4–6 Oct 2007,Bucharest/Romania, published by Matrix Rom, Bucharest, 128–131, ISBN 978-973-755-247-1, 2007.
Atanasiu, I. and Krautner, T.: Das Erdbeben vom 10. Novem-ber 1940 in Rumanien (The earthquake from Nov. 10, 1940 inRomania), Veroffentlichungen der Reichsanstalt fur Erdbeben-forschung in Jena, Berlin, Heft 40, 7–30, 1941.
Bonjer, K.-P., Ionescu, C., Sokolov, V., Radulian, M., Grecu, B.,Popa, M., and Popescu, E.: Source parameters and ground mo-tion pattern of the October 27, 2004 intermediate depth Vranceaearthquake, EGU General Assembly 2005, Vienna, Geophys.Res. Abstr., 7, EGU05-A-07538, 2005.
Bonjer, K.-P., Ionesccu, C., Sokolov, V., Radulian, M., Grecu,B., Popa, M., and Popescu, E.: Ground motion patterns ofintermediate-depth Vrancea earthquakes: the October 27, 2004event, in: Harmonization of Seismic Hazard in Vrancea Zone,Springer, NATO Science for Peace and Security Series-C: Envi-
ronmental Security, edited by: Zaicenco, A., Craifaleanu, I., andPaskaleva, I., 47–62, 2008.
Christoskov, L., Grigorova, E., Sokerova, D., and Rijikova, S.: Newcatalogue of the earthquakes in Bulgaria for the period V centuryBC to XIX century (1899), Archives of the Geophysical. Inst.,Bulgarian Acad. Sci., (unpublished), 1979.
Cornell, C.: Engineering Seismic Risk Analysis, BSSA, 5, 1583–1606, 1968.
Demetrescu, G.: Determination provisoire de l’epicentre du trem-blement de terre de Roumanie du 10 Novembre 1940, Observa-toire de Bucuresti, Station sismique, 10 pp., 1941.
Glavcheva, R.: Impacts on PR Bulgaria, 178–187, in: Vranceaearthquake in 1977, Its after-effects in the People’s Republic ofBulgaria, edited by: Brankov, G., Earthquake Engineering Na-tional Committee, Bulg. Acad. Sci., Sofia, 428 pp., 1983.
Grigorova, E., Glavtcheva, R., and Sokerova, D.: The earthquakeon March 4, 1977 – Some results of seismic observations in Bul-garia, in: Proceedings of the Symposium on the Analysis of Seis-micity and on Seismic Risk, Liblice, October 1977, 109–113,1978.
Grigorova, E., Sokerova, D., Christoskov, L., and Rijikov, S.: Cat-alogue of the earthquakes in Bulgaria for the period 1900–1977,Archives of the Geophysical. Inst., Bulg. Acad. Sci. (unpub-lished), 1979.
Kiroff, K.: Earthquakes in Bulgaria, Report on felt earthquakes dur-ing years 1931–1940, Centr. Met. Inst., Sofia, 32–41, 112 pp.,1941 (in Bulgarian).
Kovesligethy von, R.: Seismischer Starkegrad und Intensitat derBeben (degree of seismic strength and intensity of earthquakes),Gerlands Beitrage zur Geophysik, Band VIII, Leipzig, 1907.
Lungu, D., Zaicenco, A., Cornea, T., and van Gelder, P.: Seismichazard: recurrence and attenuation of subcrustal (60–170 km)earthquakes, Structural Safety and Reliability, 7, 1525–1532,1997.
Lungu, D., Cornea, T., and Nedelcu, C.: Hazard assessment anddependent response for Vrancea earthquakes, in: Vrancea earth-quakes: tectonics, hazard and risk mitigation, edited by: Wen-zel, F., Lungu, D., and Novak, O., Kluwer Academic Publishers,Dordrecht, Netherlands, 251–267, 1999.
Marza, V. I. and Pantea, A. I.: Probabilistic estimation of seismicintensity attenuation for Vrancea (Romania) subcrustal sources,in: Proc. XXIV Gen. Ass. of the E.S.C., 19–24 September 1994,Athens, Greece, v. III, 1752–1761, 1995.
McGuire, R.: FORTRAN Computer Program for Seismic Risk Cal-culations, U.S. Geol. Survey. Open-File Rep. 76–67, p. 90, 1976.
Moldovan, I.-A., Enescu, B .D., and Ionescu, C.: Predicting PeakGround Horizontal Acceleration for Vrancea large Earthquakesusing Attenuation relations for moderate shocks, Rom. Journ.Phys., 45, 9–10, 785–800, 2000.
Muller, G., Bonjer, K.-P., Stockl, H., and Enescu, D.: The Roma-nian earthquake of March 4, 1977, I. Rupture process inferredfrom fault-plane solution and multiple event analysis, J. Geo-phys., 44, 203–208, 1978.
Oncescu, M.-C., Marza, V. I., Rizescu, M., and Popa, M.: The Ro-manian earthquake catalogue between 984–1997, in: Vranceaearthquakes: tectonics, hazard and risk mitigation, edited by:Wenzel, F., Lungu, D., and Novak, O., Kluwer Academic Pub-lishers, Dordrecht, 43–47, 1999.
Papazachos, B., Cominakis, P., Karakaisis, G., Karakostas, B., Pa-
Nat. Hazards Earth Syst. Sci., 8, 1431–1439, 2008 www.nat-hazards-earth-syst-sci.net/8/1431/2008/

G. Leydecker et al.: Seismic hazard maps for Bulgaria and Romania 1439
paioannou, C., Papazachos, C., and Skordilis, E.: A catalogue ofearthquakes in Greece and surrounding area for the period 550BC–1999, Publ. Geophys. Lab. Univ. of Thessaloniki (computerfile), 2000.
Papazachos, B., Cominakis, P., Skordilis, E., Karakaisis, G., andPapazachos, C.: A catalogue of earthquakes in the Mediterraneanand surrounding area for the period 1901–2004, Publ. Geophys.Lab. Univ. of Thessaloniki (computer file), 2005.
Radu, C., Polonic, G., and Apopei, I.: Macroseismic map of March4, 1977 Vrancea Earthquake (in Romanian), Report CSEN,Bucharest, 1977.
Radu, C., Utale, A., and Winter, V.: The August 30, 1986 Vranceaearthquake, Seismic intensity distribution, National Institute forEarth Physics report, II, A-3. 1987.
Radu, C. and Utale, A.: A new version of the March 4,1977 Vrancea earthquake (in Romanian), Report CEPS, theme30.86.3/1989, II, A4, 31–32, Bucharest, 1989.
Radu, C., Radulescu, D., and Sandi, H.: Some data and consider-ations on recent strong earthquakes of Romania, Cahier Tech-nique, 3, AFPS, Paris, 19–31, 1990.
Radu, C. and Sandi, H: Recent Strong Earthquakes in Romaniaand their Impact on Earthquake Resistant Design Regulations,Manuscript, 22 pp., 1992.
Radulian, M., Panza, G. F., Popa M., and Grecu, B.: Seismic waveattenuation for Vrancea events revisited, J. Earthquake Eng., 10,411–427, 2006.
Report GPh. I.: New seismic zoning of Bulgaria, Part I, Bulgar-ian Academy of Sciences, Geophysical Institute, Sofia, 205 pp.,2007 (in Bulgarian).
Simeonova, S. D., Solakov, D. E., Leydecker, G., Busche, H.,Schmitt, T., and Kaiser, D.: Probabilistic seismic hazard map forBulgaria as a basis for a new building code, Nat. Hazards EarthSyst. Sci., 6, 881–887, 2006,http://www.nat-hazards-earth-syst-sci.net/6/881/2006/.
Shebalin, N. V., Leydecker, G., Mokrushina, N., Tatevossian, R.,Erteleva, O., and Vassilev, V.: Earthquake Catalogue for Centraland Southeastern Europe, European Commission, Report No.ETNU CT93-0087 (for catalogue download:http://www.bgr.de/quakecat), Brussels, 1998.
Solakov, D. and Simeonova, S.: Bulgaria Catalogue of Earthquakes1981–1990, Sofia Press, p. 40, 1993.
Sponheuer, W.: Methoden zur Herdtiefenbestimmung in derMakroseismik, (Methods for depths estimation in macroseismic),Freiberger Forschungs-Hefte C 88, Akademie Verlag Berlin, 117pp., 1960.
Stepp, J.: An investigation of earthquake risk in the Puget Soundarea by use of the type I distribution of large extremes, Ph.D.thesis, Pennsylvania Univ., 131 pp., 1971.
www.nat-hazards-earth-syst-sci.net/8/1431/2008/ Nat. Hazards Earth Syst. Sci., 8, 1431–1439, 2008