private real estate: in search of the appropriate benchmark - partners group · partners group...
TRANSCRIPT

1
Claude Angéloz
Co-Head Private Real Estate
Pieter Nelissen
Private Real Estate Research & Strategy
Partners Group Research Flash October 2014
Private real estate: in search of the appropriate benchmark
Partners Group Research Flash October 2014
Private real estate: in search of the appropriate benchmark
2
EXECUTIVE SUMMARY
Regardless of the asset class, the ability to generate superior investment performance is the
measurement that separates good investors from great investors. In most asset classes,
performance is easily compared and contrasted against a commonly agreed upon investment
universe or an appropriate index of investment opportunities. But in private real estate,
investors face the dilemma of attempting to evaluate performance without the benefit of a
commonly agreed upon benchmark.
Despite greater availability of private real estate benchmarks, absolute return comparisons
continue to provide investors with the most pragmatic solution to benchmark the performance
of their real estate portfolios. The absolute return benchmarking approach evaluates the return
of a property over a certain period of time relative to a fixed target number and is a
methodology with the significant advantage of simplicity.
In this Research Flash, we intend to raise investor awareness of alternative performance
measurement methods and indices. We review the challenges investors face in performance
measurement, compare the historical performance of public vs. private real estate indices and
evaluate some of the key merits as well as the shortcomings of a number of the private real
estate indices currently available to investors. Our goal is to help investors better understand
the characteristics of the indices currently available to them and make more informed
performance measurement decisions going forward.
Provided in the appendix of this Research Flash are the composition characteristics and
statistics of each of the following indices:
Asian Association for Investors in Non-Listed Real Estate Vehicles (ANREV)
Cambridge Associates Real Estate Index
CoStar Commercial Repeat Sale Indices (CCRSI)
European Association for Investors in Non-Listed Real Estate Vehicles (INREV)
Global Real Estate Fund Index (GREFI)
Green Street Commercial Property Price Index
Investment Property Databank (IPD)
NCREIF Closed-End Value-Add (NFI-CEVA)
NCREIF Open End Diversified Core Equity (NFI-ODCE)
NCREIF Property Index (NPI)
Partners Group Thomson Reuters Private Real Estate Index (PGTR)
While the data provided highlights the continued attractiveness of private real estate as an
asset class, it is our belief that the creation of truly robust, comprehensive and relevant indices
will attract even more investors to private real estate over the long run.
Partners Group Research Flash October 2014
Private real estate: in search of the appropriate benchmark
3
EVALUATING PERFORMANCE: FINDING AN APPROPRIATE “INDEX”
Private real estate lacks a comprehensive benchmark that can mirror the increasingly wider
range of investment strategies, the global property opportunity set and the level of granularity
necessary to accommodate today’s diverse array of property sectors and market dynamics.
Unfortunately, real estate suffers from several unique challenges in establishing a globally
comprehensive benchmark.
By definition, an index should be “passive.” Yet properties are often undergoing continuous
operational improvements with a high degree of active management and associated costs over
extended time periods. Secondly, an index needs to be informationally efficient, but real estate
is renowned as an asset class where local expertise is necessary to possess all the relevant
information. Finally, no real estate universe possesses daily liquidity, where trades occur on a
daily basis, making it impossible to replicate a passive index in a portfolio context. These three
characteristics of real estate pose the initial challenges to investors in finding a true “index” for
comparative purposes.
Despite these challenges, more real estate indices are available to investors than ever before
— with differing constituent sets, fund strategies, property type inclusion parameters and
regional characteristics. While these indices can provide benchmarking suitable for one specific
portion of a real estate portfolio, globally comprehensive real estate return comparisons still
remain elusive. Recognizing the need for a more globally inclusive data set, Partners Group
established the Partners Group Thomson Reuters Private Real Estate Index (PGTR Index) in
2010, with an initial sample of 250 value-added and opportunistic funds with vintage years
dating back as early as 1981. The PGTR Index sample grew to over 300 funds provided by
over 60 firms with total commitments of nearly USD 200 billion. In mid-2014, the index was
discontinued when Thomson Reuters entered into a joint venture with Cambridge Associates
and created an index based on a more robust data set of over 700 funds.
While it may be fairly intuitive to use a benchmark related to the asset class in which you are
investing, a lack of data availability has led many real estate investors to choose non-real
estate related performance measurement tools. Both the Consumer Price Index and
government bond yields (e.g. US Treasury) plus an appropriate hurdle rate (to reflect the
specific risks associated with the real estate asset class) are regularly used to provide an
estimated relative return assumption for real estate portfolios. Given the lack of a
comprehensive global index, investors typically employ three divergent approaches to evaluate
real estate investment performance:
Peer comparison
Absolute return
Relative return
Partners Group Research Flash October 2014
Private real estate: in search of the appropriate benchmark
4
Peer comparison
A “peer universe” is designed to reflect the performance of all managers that are effectively
competitors or invest and manage real estate in the same style or specialization as the subject
manager. Peer comparisons allow investors to distinguish a specific track record from a peer
set and determine superior skill over extended or specific time periods. The NCREIF fund index
series (comprised of predominantly core properties, performance reported on a leveraged basis,
gross of fees, but inclusive of property level management fees) is a prime example of a “peer
universe” that covers a relatively narrow segment of private property markets, focusing
exclusively on US properties held by a small number of US tax-exempt fiduciaries. As such, the
index series is missing some key components of the evaluation function such as the property
level data that exists outside of the US. For example, a global property investor looking to
benchmark the performance of a Chinese retail property may struggle to find an accurate
comparable property within the NCREIF (or other data providers’) fund universes.
Absolute return
The absolute return benchmarking approach evaluates the return of a property over a certain
period of time relative to a fixed target number. This methodology has the significant
advantage of simplicity. It can provide a relative value comparison when analyzing
investments on a cross-border basis or across different durations. There is one significant
drawback to an absolute return benchmark versus a relative benchmark, which is a potential
misalignment of interests between the investor and the manager. For example, if a core
investment strategy is falling short of an absolute return target, the manager may be
incentivized to take on additional risk during periods of low yield, such as pursuing higher
risk/higher return core-plus or value-added investment opportunities. Conversely, an
opportunistic manager may not be incentivized to pursue higher yielding strategies during
periods of outsized performance in order to preserve realized performance levels.
Relative return
A relative return is the return that an asset achieves over a period of time compared to a
benchmark. The relative return is the difference between the absolute return achieved by the
asset and the return achieved by its comparative benchmark. A relative return allows the
evaluation of a manager over and above what an investor could achieve by investing directly
into an index or the respective benchmark. However, defining the appropriate benchmark for
relative return comparisons that meets investors’ minimum data requirements, such as
adequate regional coverage, strategy composition, leverage, fund level or property level data,
etc., is often the difficulty with this assessment. Accordingly, if the manager is going to be
evaluated relative to a benchmark, the manager should have the ability to control that relative
performance as much as possible. This suggests that the manager should be free to decide
whether, how and when portfolio composition should deviate from the composition of the
agreed upon benchmark. For example, opportunistic managers pursuing more niche property
types should not be constrained to only those property types that are held within the
respective benchmark they are being evaluated against.
Partners Group Research Flash October 2014
Private real estate: in search of the appropriate benchmark
5
EVALUATING BENCHMARKS: PUBLIC VS. PRIVATE
Public real estate indices
While the bulk of the institutional real estate investment universe remains overwhelmingly
private, the listed sector has grown significantly over the last decade. As the sector gets larger,
there is an increasing need to evaluate portfolio investment performance to support decision-
making. However, the structural features of the different listed property companies across the
world can be as diverse as the markets in which they operate.
Although a host of index providers track listed property companies, the majority of investors
looking to track the performance of public global real estate securities will turn to one of two
major indices: the S&P Developed Property Index or the FTSE EPRA/NAREIT Developed Real
Estate Index. Only subtle differences exist between the two — eligibility criteria and
geographic coverage. The S&P’s criteria allow for a broader range of small- and mid-cap
companies which enable it to cover roughly 70% more companies than the FTSE, which also
increases the index’s constituent base in regions such as Asia. Thus, this extended company
coverage plays an important role in the index’s performance, since small- and mid-cap stocks
in both indices have generally outperformed their larger peers over the last 3-, 5- and 10-year
time horizons.
Recent studies have substantiated that listed REIT returns have generally exceeded those of
core private real estate funds, as shown in Exhibit 1. Returns for both private and public real
estate funds are typically inclusive of leverage, magnifying the volatility of returns —
intensifying the impact of negative returns in real estate downturns and improving returns in
up markets. However, core private real estate funds typically operate with significantly less
leverage than listed REITs (NCREIF Fund Index Open End Diversified Core Equity universe
restricts leverage to a maximum of 40% for inclusion). Over the longer term, however, higher
leverage has generally benefited listed REITs.
In addition to higher leverage, reviewing the constituent and sector breakdown of public REITs
reveals additional characteristics that may have contributed to recent outperformance. Using
the FTSE EPRA/NAREIT Developed Real Estate Index as an example, over 20% of the index is
classified as “real estate holding and development”, allowing REITs to invest not only in core
properties such as apartment, office and retail, but also in real estate services and speculative
development strategies. Simply put, a public REIT should not necessarily be comparable with
core real estate investments.
Partners Group Research Flash October 2014
Private real estate: in search of the appropriate benchmark
6
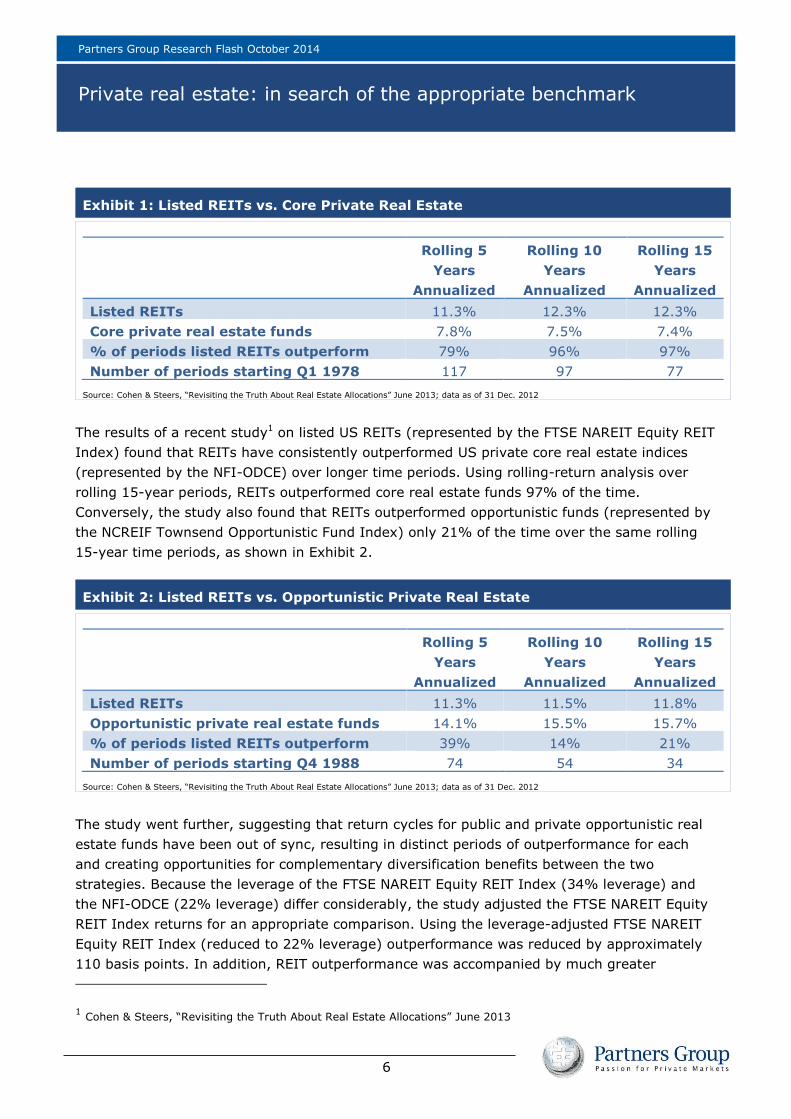
Exhibit 1: Listed REITs vs. Core Private Real Estate
Rolling 5
Years
Annualized
Rolling 10
Years
Annualized
Rolling 15
Years
Annualized
Listed REITs 11.3% 12.3% 12.3%
Core private real estate funds 7.8% 7.5% 7.4%
% of periods listed REITs outperform 79% 96% 97%
Number of periods starting Q1 1978 117 97 77
Source: Cohen & Steers, “Revisiting the Truth About Real Estate Allocations” June 2013; data as of 31 Dec. 2012
The results of a recent study1 on listed US REITs (represented by the FTSE NAREIT Equity REIT
Index) found that REITs have consistently outperformed US private core real estate indices
(represented by the NFI-ODCE) over longer time periods. Using rolling-return analysis over
rolling 15-year periods, REITs outperformed core real estate funds 97% of the time.
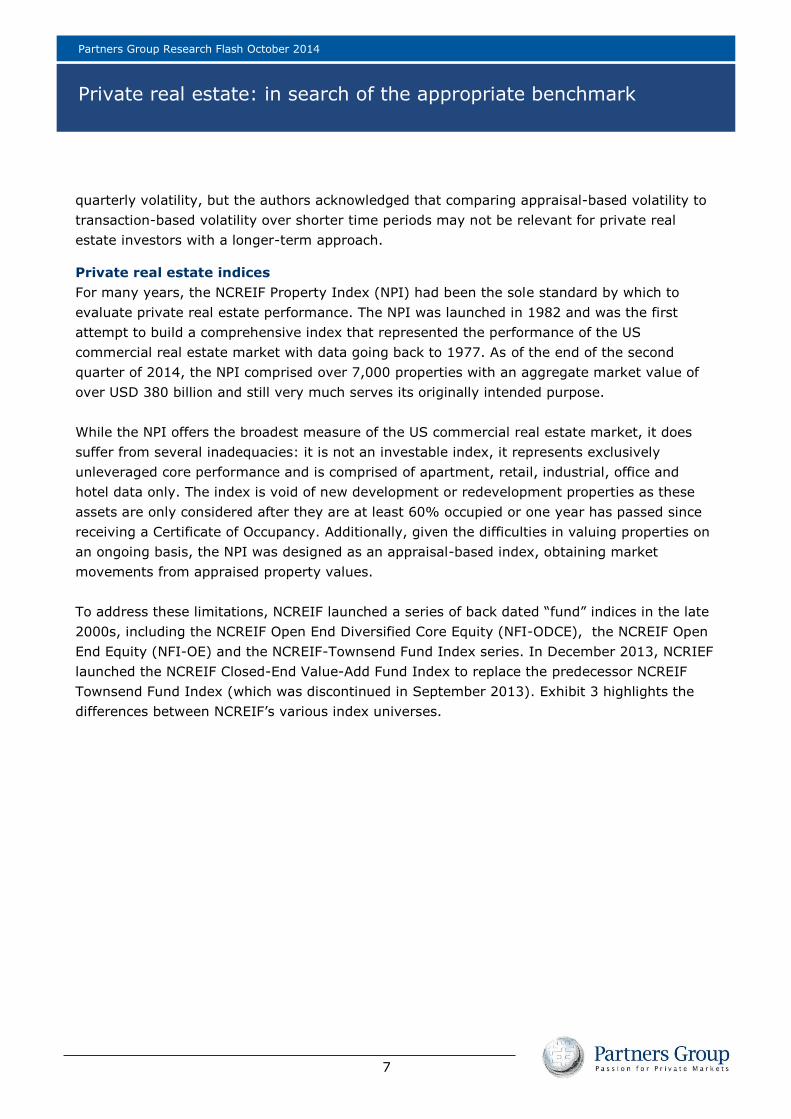
Conversely, the study also found that REITs outperformed opportunistic funds (represented by
the NCREIF Townsend Opportunistic Fund Index) only 21% of the time over the same rolling
15-year time periods, as shown in Exhibit 2.
Exhibit 2: Listed REITs vs. Opportunistic Private Real Estate
Rolling 5
Years
Annualized
Rolling 10
Years
Annualized
Rolling 15
Years
Annualized
Listed REITs 11.3% 11.5% 11.8%
Opportunistic private real estate funds 14.1% 15.5% 15.7%
% of periods listed REITs outperform 39% 14% 21%
Number of periods starting Q4 1988 74 54 34
Source: Cohen & Steers, “Revisiting the Truth About Real Estate Allocations” June 2013; data as of 31 Dec. 2012
The study went further, suggesting that return cycles for public and private opportunistic real
estate funds have been out of sync, resulting in distinct periods of outperformance for each
and creating opportunities for complementary diversification benefits between the two
strategies. Because the leverage of the FTSE NAREIT Equity REIT Index (34% leverage) and
the NFI-ODCE (22% leverage) differ considerably, the study adjusted the FTSE NAREIT Equity
REIT Index returns for an appropriate comparison. Using the leverage-adjusted FTSE NAREIT
Equity REIT Index (reduced to 22% leverage) outperformance was reduced by approximately
110 basis points. In addition, REIT outperformance was accompanied by much greater
1 Cohen & Steers, “Revisiting the Truth About Real Estate Allocations” June 2013
Partners Group Research Flash October 2014
Private real estate: in search of the appropriate benchmark
7
quarterly volatility, but the authors acknowledged that comparing appraisal-based volatility to
transaction-based volatility over shorter time periods may not be relevant for private real
estate investors with a longer-term approach.
Private real estate indices
For many years, the NCREIF Property Index (NPI) had been the sole standard by which to
evaluate private real estate performance. The NPI was launched in 1982 and was the first
attempt to build a comprehensive index that represented the performance of the US
commercial real estate market with data going back to 1977. As of the end of the second
quarter of 2014, the NPI comprised over 7,000 properties with an aggregate market value of
over USD 380 billion and still very much serves its originally intended purpose.
While the NPI offers the broadest measure of the US commercial real estate market, it does
suffer from several inadequacies: it is not an investable index, it represents exclusively
unleveraged core performance and is comprised of apartment, retail, industrial, office and
hotel data only. The index is void of new development or redevelopment properties as these
assets are only considered after they are at least 60% occupied or one year has passed since
receiving a Certificate of Occupancy. Additionally, given the difficulties in valuing properties on
an ongoing basis, the NPI was designed as an appraisal-based index, obtaining market
movements from appraised property values.
To address these limitations, NCREIF launched a series of back dated “fund” indices in the late
2000s, including the NCREIF Open End Diversified Core Equity (NFI-ODCE), the NCREIF Open
End Equity (NFI-OE) and the NCREIF-Townsend Fund Index series. In December 2013, NCRIEF
launched the NCREIF Closed-End Value-Add Fund Index to replace the predecessor NCREIF
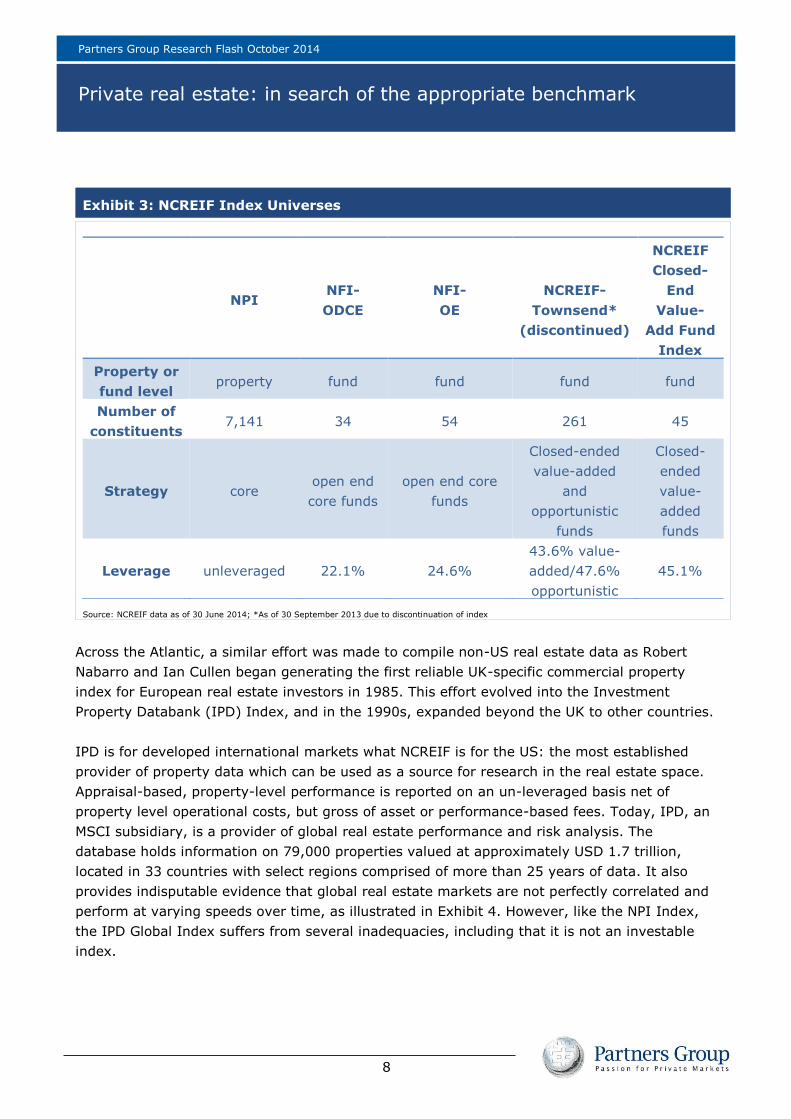
Townsend Fund Index (which was discontinued in September 2013). Exhibit 3 highlights the
differences between NCREIF’s various index universes.
Partners Group Research Flash October 2014
Private real estate: in search of the appropriate benchmark
8
Exhibit 3: NCREIF Index Universes
NPI NFI-
ODCE
NFI-
OE
NCREIF-
Townsend*
(discontinued)
NCREIF
Closed-
End
Value-
Add Fund
Index
Property or
fund level property fund fund fund fund
Number of
constituents 7,141 34 54 261 45
Strategy core open end
core funds
open end core
funds
Closed-ended
value-added
and
opportunistic
funds
Closed-
ended
value-
added
funds
Leverage unleveraged 22.1% 24.6%
43.6% value-
added/47.6%
opportunistic
45.1%
Source: NCREIF data as of 30 June 2014; *As of 30 September 2013 due to discontinuation of index
Across the Atlantic, a similar effort was made to compile non-US real estate data as Robert
Nabarro and Ian Cullen began generating the first reliable UK-specific commercial property
index for European real estate investors in 1985. This effort evolved into the Investment
Property Databank (IPD) Index, and in the 1990s, expanded beyond the UK to other countries.
IPD is for developed international markets what NCREIF is for the US: the most established
provider of property data which can be used as a source for research in the real estate space.
Appraisal-based, property-level performance is reported on an un-leveraged basis net of
property level operational costs, but gross of asset or performance-based fees. Today, IPD, an
MSCI subsidiary, is a provider of global real estate performance and risk analysis. The
database holds information on 79,000 properties valued at approximately USD 1.7 trillion,
located in 33 countries with select regions comprised of more than 25 years of data. It also
provides indisputable evidence that global real estate markets are not perfectly correlated and
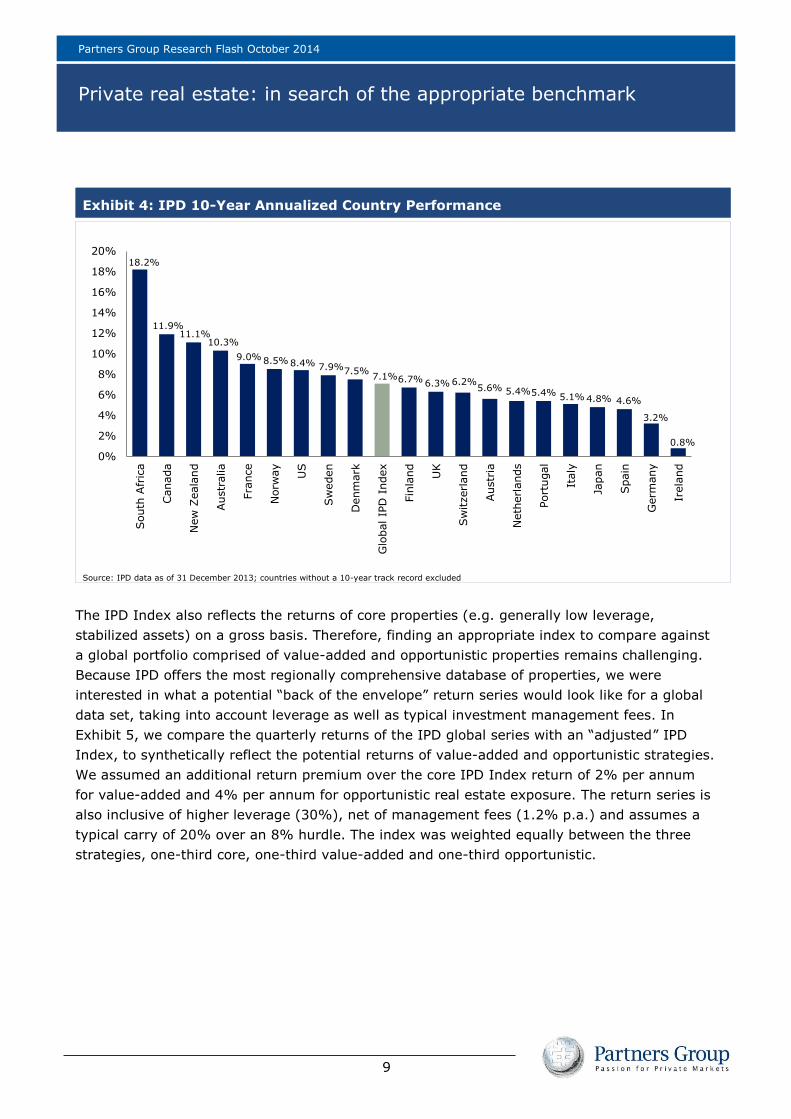
perform at varying speeds over time, as illustrated in Exhibit 4. However, like the NPI Index,
the IPD Global Index suffers from several inadequacies, including that it is not an investable
index.
Partners Group Research Flash October 2014
Private real estate: in search of the appropriate benchmark
9
Exhibit 4: IPD 10-Year Annualized Country Performance
Source: IPD data as of 31 December 2013; countries without a 10-year track record excluded
The IPD Index also reflects the returns of core properties (e.g. generally low leverage,
stabilized assets) on a gross basis. Therefore, finding an appropriate index to compare against
a global portfolio comprised of value-added and opportunistic properties remains challenging.
Because IPD offers the most regionally comprehensive database of properties, we were
interested in what a potential “back of the envelope” return series would look like for a global
data set, taking into account leverage as well as typical investment management fees. In
Exhibit 5, we compare the quarterly returns of the IPD global series with an “adjusted” IPD
Index, to synthetically reflect the potential returns of value-added and opportunistic strategies.
We assumed an additional return premium over the core IPD Index return of 2% per annum
for value-added and 4% per annum for opportunistic real estate exposure. The return series is
also inclusive of higher leverage (30%), net of management fees (1.2% p.a.) and assumes a
typical carry of 20% over an 8% hurdle. The index was weighted equally between the three
strategies, one-third core, one-third value-added and one-third opportunistic.
18.2%
11.9% 11.1%
10.3%
9.0% 8.5% 8.4% 7.9% 7.5% 7.1% 6.7% 6.3% 6.2%
5.6% 5.4% 5.4% 5.1% 4.8% 4.6%
3.2%
0.8%
0%
2%
4%
6%
8%
10%
12%
14%
16%
18%
20%
South
Afr
ica
Canada
New
Zeala
nd
Austr
alia
Fra
nce
Norw
ay
US
Sw
eden
Denm
ark
Glo
bal IP
D I
ndex
Fin
land
UK
Sw
itzerland
Austr
ia
Neth
erlands
Port
ugal
Italy
Japan
Spain
Germ
any
Irela
nd
Partners Group Research Flash October 2014
Private real estate: in search of the appropriate benchmark
10
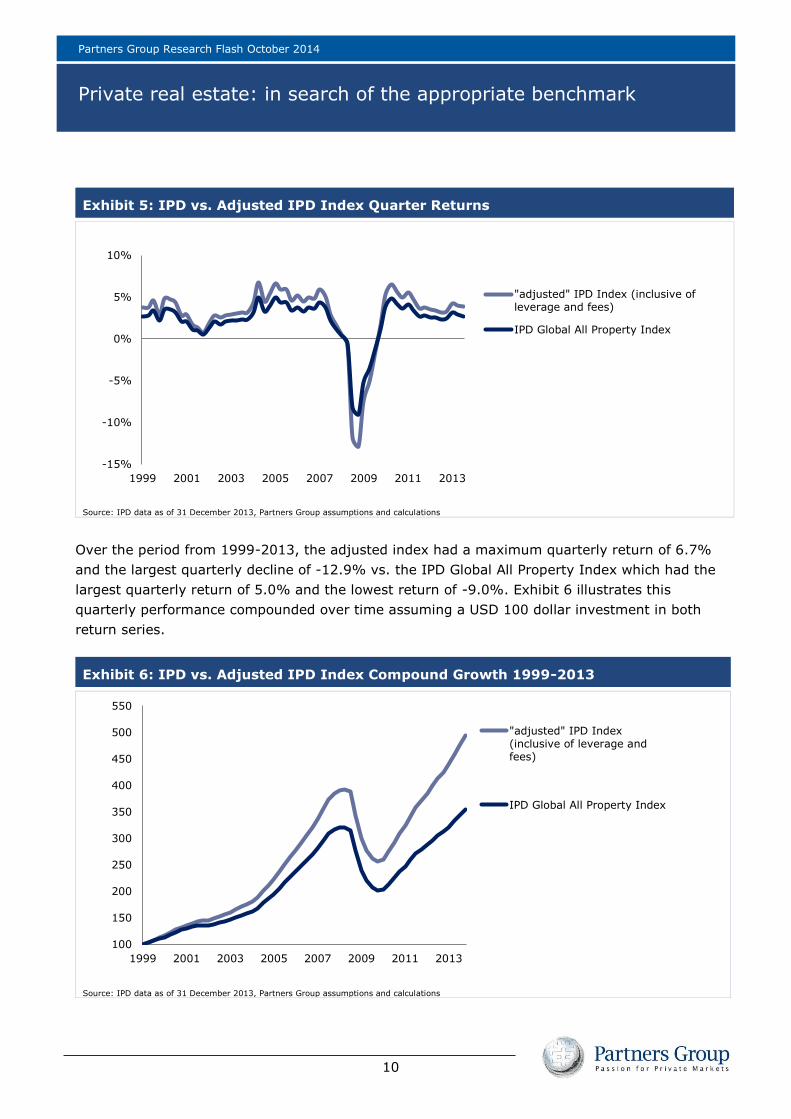
Exhibit 5: IPD vs. Adjusted IPD Index Quarter Returns
Source: IPD data as of 31 December 2013, Partners Group assumptions and calculations
Over the period from 1999-2013, the adjusted index had a maximum quarterly return of 6.7%
and the largest quarterly decline of -12.9% vs. the IPD Global All Property Index which had the
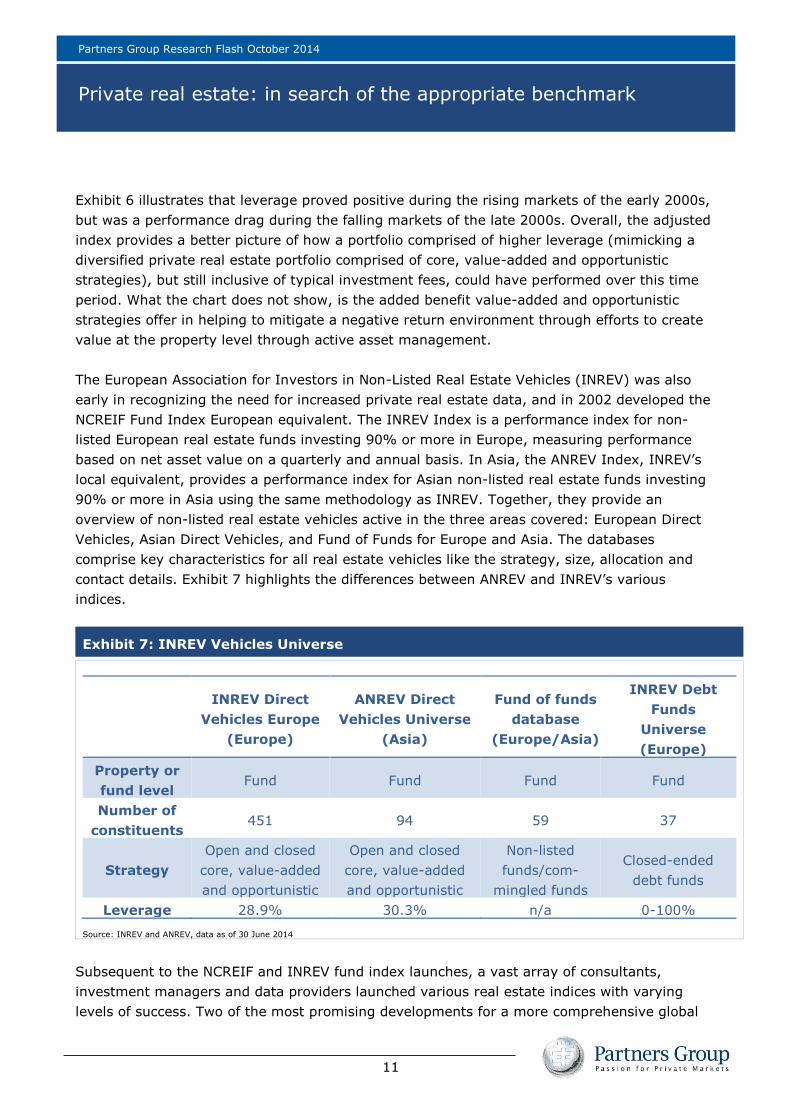
largest quarterly return of 5.0% and the lowest return of -9.0%. Exhibit 6 illustrates this
quarterly performance compounded over time assuming a USD 100 dollar investment in both
return series.
Exhibit 6: IPD vs. Adjusted IPD Index Compound Growth 1999-2013
Source: IPD data as of 31 December 2013, Partners Group assumptions and calculations
-15%
-10%
-5%
0%
5%
10%
1999 2001 2003 2005 2007 2009 2011 2013
"adjusted" IPD Index (inclusive ofleverage and fees)
IPD Global All Property Index
100
150
200
250
300
350
400
450
500
550
1999 2001 2003 2005 2007 2009 2011 2013
"adjusted" IPD Index(inclusive of leverage andfees)
IPD Global All Property Index
Partners Group Research Flash October 2014
Private real estate: in search of the appropriate benchmark
11
Exhibit 6 illustrates that leverage proved positive during the rising markets of the early 2000s,
but was a performance drag during the falling markets of the late 2000s. Overall, the adjusted
index provides a better picture of how a portfolio comprised of higher leverage (mimicking a
diversified private real estate portfolio comprised of core, value-added and opportunistic
strategies), but still inclusive of typical investment fees, could have performed over this time
period. What the chart does not show, is the added benefit value-added and opportunistic
strategies offer in helping to mitigate a negative return environment through efforts to create
value at the property level through active asset management.
The European Association for Investors in Non-Listed Real Estate Vehicles (INREV) was also
early in recognizing the need for increased private real estate data, and in 2002 developed the
NCREIF Fund Index European equivalent. The INREV Index is a performance index for non-
listed European real estate funds investing 90% or more in Europe, measuring performance
based on net asset value on a quarterly and annual basis. In Asia, the ANREV Index, INREV’s
local equivalent, provides a performance index for Asian non-listed real estate funds investing
90% or more in Asia using the same methodology as INREV. Together, they provide an
overview of non-listed real estate vehicles active in the three areas covered: European Direct
Vehicles, Asian Direct Vehicles, and Fund of Funds for Europe and Asia. The databases
comprise key characteristics for all real estate vehicles like the strategy, size, allocation and
contact details. Exhibit 7 highlights the differences between ANREV and INREV’s various
indices.
Exhibit 7: INREV Vehicles Universe
INREV Direct
Vehicles Europe
(Europe)
ANREV Direct
Vehicles Universe
(Asia)
Fund of funds
database
(Europe/Asia)
INREV Debt
Funds
Universe
(Europe)
Property or
fund level Fund Fund Fund Fund
Number of
constituents 451 94 59 37
Strategy
Open and closed
core, value-added
and opportunistic
Open and closed
core, value-added
and opportunistic
Non-listed
funds/com-
mingled funds
Closed-ended
debt funds
Leverage 28.9% 30.3% n/a 0-100%
Source: INREV and ANREV, data as of 30 June 2014
Subsequent to the NCREIF and INREV fund index launches, a vast array of consultants,
investment managers and data providers launched various real estate indices with varying
levels of success. Two of the most promising developments for a more comprehensive global
Partners Group Research Flash October 2014
Private real estate: in search of the appropriate benchmark
12
data set include the Cambridge Associates Real Estate Index, and the Global Real Estate Fund
Index announced in a collaborative effort between NCREIF, INREV and ANREV.
In November 2013, Cambridge Associates announced it would make its global private real
estate investment performance benchmarks available publicly on a quarterly basis. The
performance data is derived from quarterly and annual audited financial statements and cash
flow information provided directly by fund managers. The benchmark is currently comprised of
information from more than 700 institutional-quality funds from around the world formed
between 1986 and 2013, focusing primarily on the value-added and opportunistic real estate
categories.
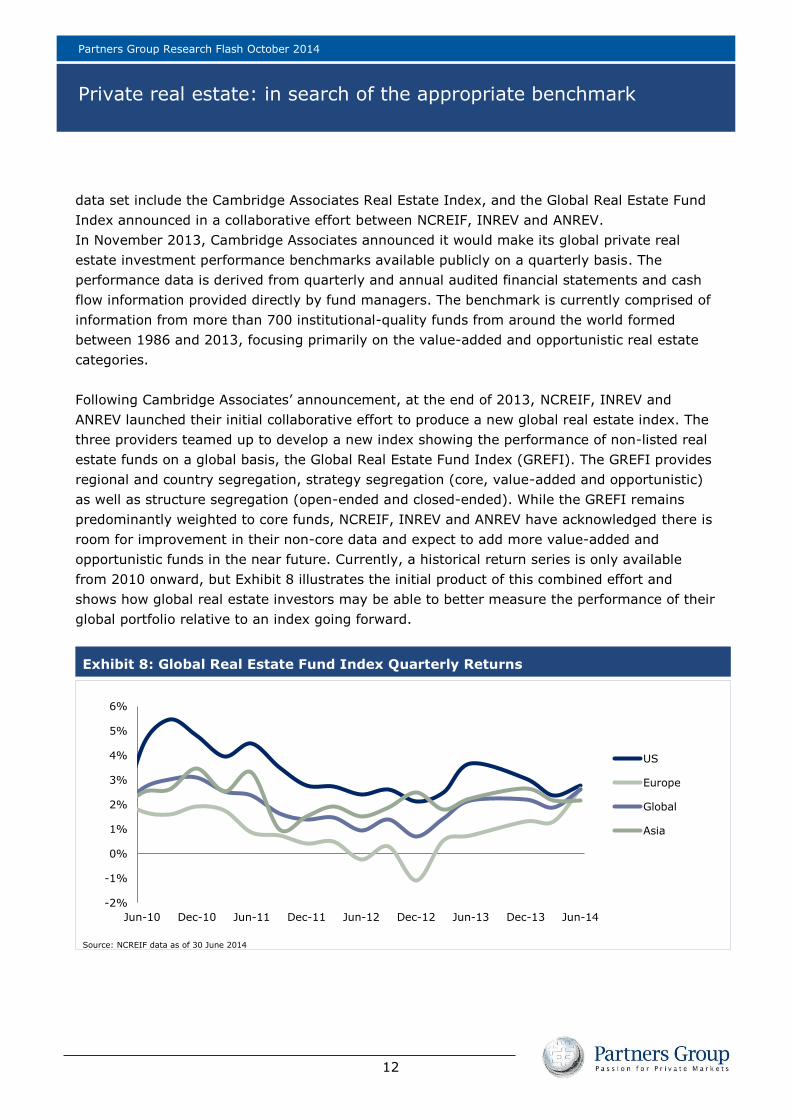
Following Cambridge Associates’ announcement, at the end of 2013, NCREIF, INREV and
ANREV launched their initial collaborative effort to produce a new global real estate index. The
three providers teamed up to develop a new index showing the performance of non-listed real
estate funds on a global basis, the Global Real Estate Fund Index (GREFI). The GREFI provides
regional and country segregation, strategy segregation (core, value-added and opportunistic)
as well as structure segregation (open-ended and closed-ended). While the GREFI remains
predominantly weighted to core funds, NCREIF, INREV and ANREV have acknowledged there is
room for improvement in their non-core data and expect to add more value-added and
opportunistic funds in the near future. Currently, a historical return series is only available
from 2010 onward, but Exhibit 8 illustrates the initial product of this combined effort and
shows how global real estate investors may be able to better measure the performance of their
global portfolio relative to an index going forward.
Exhibit 8: Global Real Estate Fund Index Quarterly Returns
Source: NCREIF data as of 30 June 2014
-2%
-1%
0%
1%
2%
3%
4%
5%
6%
Jun-10 Dec-10 Jun-11 Dec-11 Jun-12 Dec-12 Jun-13 Dec-13 Jun-14
US
Europe
Global
Asia
Partners Group Research Flash October 2014
Private real estate: in search of the appropriate benchmark
13
Transaction-based real estate indices
In addition to the lack of an index providing comprehensive regional coverage, private real
estate indices suffer from the key issue that valuations are lagged and based on appraised
values (rather than transactions) and data is derived from a small sample that typically
consists exclusively of large core properties. The greatest challenge index providers have faced
in creating a transaction-based index is controlling for differences between the properties that
transact from one period to the next. There are generally two accepted methodologies to
producing transaction-based indices, hedonic2 modeling and repeat-sales regression. The first
commercial real estate transaction-based index effort used the hedonic approach, based on the
properties sold from the NCREIF Index database. The index was produced by combining the
NCREIF Appraisal-Based Index with regression time-dummy coefficients reflecting the
differences between appraisals and transaction prices. The transaction-based index was
initially launched by MIT’s Center for Real Estate (MIT/CRE) in 2006, and published quarterly
until 2011, when NCREIF took over production and publication and referred to the index as the
NCREIF Transaction-Based Index.
In 2006, Real Capital Analytics (RCA) sought to produce a transaction-based index and
sponsored the development of a repeat-sales regression index, which was also undertaken by
MIT/CRE. The methodology attempted to use repeat sales to capture properties that have sold
more than once, excluding any significant change in the building characteristics between sales
and therefore purely reflecting real estate market conditions. MIT/CRE launched a version of
the repeat-sales regression index at the end of 2006, and in 2011 a second generation of this
index was taken over by Moody’s Investors Service and Real Capital Analytics, called the
Moody’s/RCA Commercial Property Price Index (CPPI). The index measures the price changes
in US and UK commercial real estate based on completed sales of the same commercial
property over time and provides a broad measure of commercial property price trends.
While the Moody’s/RCA CPPI was the first commercial real estate repeat-sale index, it suffered
from initial limitations in its data coverage, in that it covered only ten years of historical
transaction data and focused exclusively on high-value transactions (USD 5 million and over
initially, which was subsequently extended to USD 2.5 million and over in 2005). RCA’s largest
competitor, CoStar, shortly followed suit using a similar methodology to produce the CoStar
Commercial Repeat Sales Index which consists of transactions going back over 20 years and
includes commercial real estate transactions across the price spectrum.
Separately from the RCA, Moody’s and CoStar efforts, Green Street developed a commercial
property price index that is a time series of unleveraged US commercial property values that
captures the prices at which commercial real estate transactions are currently being negotiated
2 Hedonic regression equations treat certain building attributes (number of units, building quality, distance from city
center, etc.) separately, and estimates prices for each of them. This information can be used to construct a price index.
Partners Group Research Flash October 2014
Private real estate: in search of the appropriate benchmark
14
and contracted. A key difference between Green Street’s index and the repeat-sales indices
previously mentioned is that Green Street looks at current negotiations and contracts. In
addition, the aforementioned repeat sales indices give equal weight to all properties, while
Green Street's methodology gives greater weight to expensive properties and lesser weight to
cheaper properties. The Green Street Commercial Property Price Index captures changes in the
aggregate value of the commercial property sectors more quickly (relative to other indices that
are based on closed transactions from market prices from several months earlier) and allows
the index to be released within days of month-end. The weighting by asset value within each
property sector provides a more sensitive gauge of changes in aggregate values than equally-
weighted counterparts.
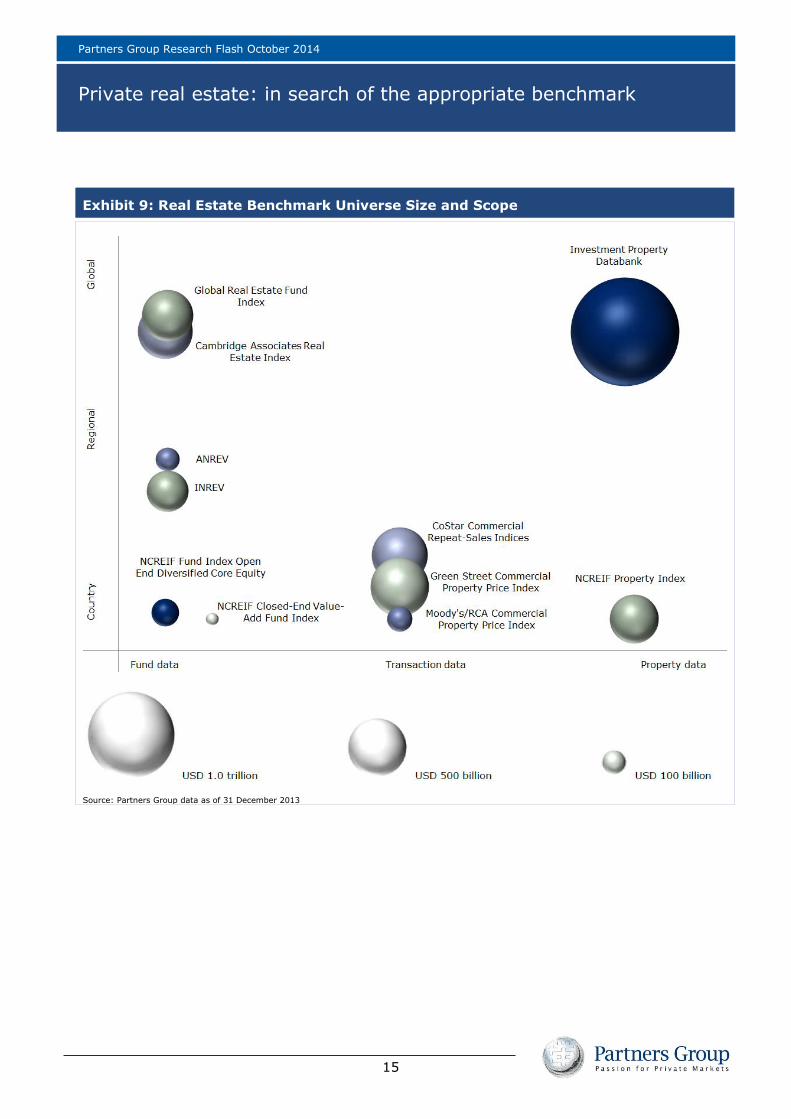
Universe size and scale
To get a better sense of the size, strengths and weakness of each index, Exhibit 9 provides an
illustrative example of the respective size of each universe. The smallest index (NCREIF
Closed-End Value-Add Fund Index) totals USD 23 billion and the largest (IPD All Property
Global Index) just over USD 1.9 trillion. They are plotted based on the comprehensiveness of
the regions covered (i.e. country-specific, regionally-specific or global) as well as the type of
investment data (funds, transactions or property level data).
Partners Group Research Flash October 2014
Private real estate: in search of the appropriate benchmark
15
Exhibit 9: Real Estate Benchmark Universe Size and Scope
Source: Partners Group data as of 31 December 2013
Partners Group Research Flash October 2014
Private real estate: in search of the appropriate benchmark
16
In the Appendix, we detail the universe, available sub-indices, time period of coverage, as well
as important issues in interpretation and comparison for each of the following indices:
Asian Association for Investors in Non-Listed Real Estate Vehicles (ANREV)
Cambridge Associates Real Estate Index
CoStar Commercial Repeat Sale Indices (CCRSI)
European Association for Investors in Non-Listed Real Estate Vehicles (INREV)
Global Real Estate Fund Index (GREFI)
Green Street Commercial Property Price Index
Investment Property Databank (IPD)
NCREIF Closed-End Value-Add (NFI-CEVA)
NCREIF Open End Diversified Core Equity (NFI-ODCE)
NCREIF Property Index (NPI)
Partners Group Thomson Reuters Private Real Estate Index (PGTR)
CONCLUSION
It is our belief that absolute return comparisons provide investors with the best solution to
benchmark the performance of their global real estate portfolios, due to their simplicity and
global applicability. However, despite greater availability of real estate benchmarks, there is
regrettably no definitive answer to the performance measurement dilemma facing today’s
private real estate portfolios. Irrespective of this, the data provided in this Research Flash
highlights the continued attractiveness of the private real estate asset class.
We have highlighted some promising new efforts in benchmark construction, which have been
driven by greater demand for a widely accepted benchmark in real estate; one that parallels
the type of transparency and granularity that is available for investors in public markets. It is
our belief that robust, comprehensive and relevant indices will lead to a better understanding
of real estate's performance attributes and attract more investors to the asset class over the
long run.
The continued effort to compile real estate data will ultimately provide the necessary depth
and breadth of market coverage to facilitate the creation of a benchmark solution for broader
aspects of private real estate investment. It is in real estate managers’ own interests to
continue to provide data to index providers that both demonstrate the compelling return
characteristics of private real estate and also facilitate the creation of a truly global and
representative benchmark.
Partners Group Research Flash October 2014
Private real estate: in search of the appropriate benchmark
17
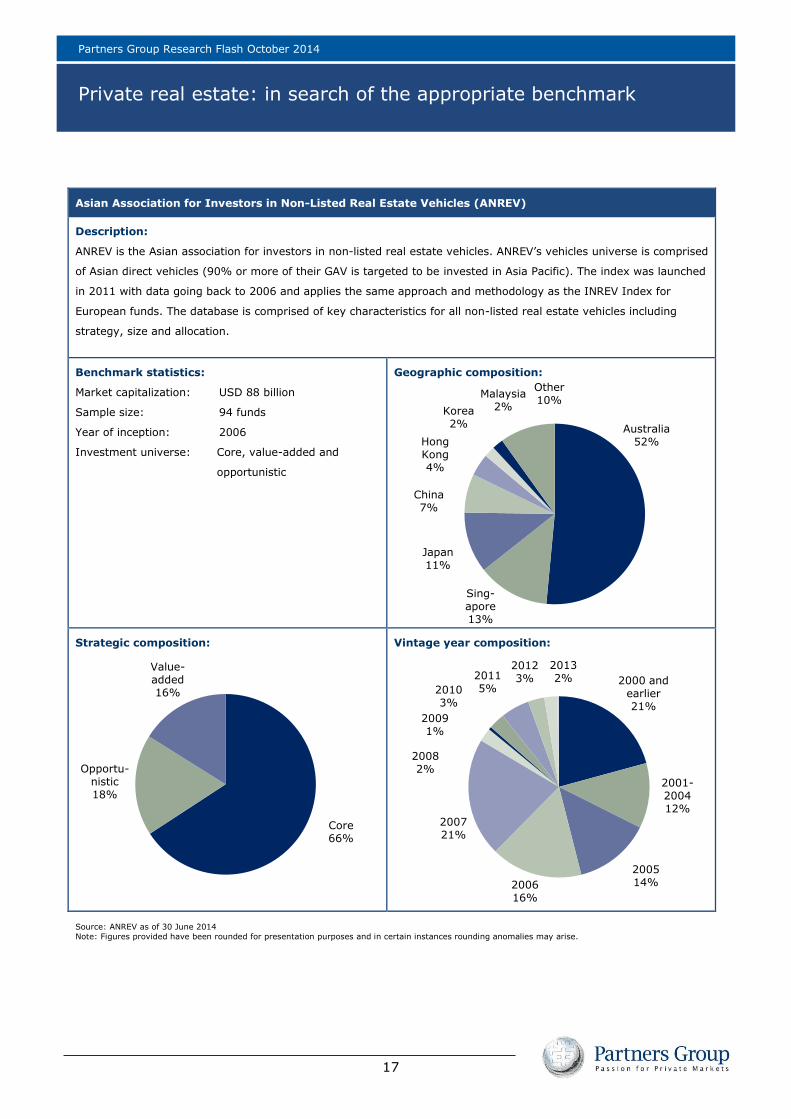
Asian Association for Investors in Non-Listed Real Estate Vehicles (ANREV)
Description:
ANREV is the Asian association for investors in non-listed real estate vehicles. ANREV’s vehicles universe is comprised
of Asian direct vehicles (90% or more of their GAV is targeted to be invested in Asia Pacific). The index was launched
in 2011 with data going back to 2006 and applies the same approach and methodology as the INREV Index for
European funds. The database is comprised of key characteristics for all non-listed real estate vehicles including
strategy, size and allocation.
Benchmark statistics:
Market capitalization: USD 88 billion
Sample size: 94 funds
Year of inception: 2006
Investment universe: Core, value-added and
opportunistic
Geographic composition:
Strategic composition:
Vintage year composition:
Source: ANREV as of 30 June 2014
Note: Figures provided have been rounded for presentation purposes and in certain instances rounding anomalies may arise.
Australia 52%
Sing-apore 13%
Japan 11%
China 7%
Hong Kong 4%
Korea 2%
Malaysia 2%
Other 10%
Core 66%
Opportu-nistic 18%
Value-added 16%
2000 and earlier 21%
2001-2004 12%
2005 14% 2006
16%
2007 21%
2008 2%
2009 1%
2010 3%
2011 5%
2012 3%
2013 2%
Partners Group Research Flash October 2014
Private real estate: in search of the appropriate benchmark
18
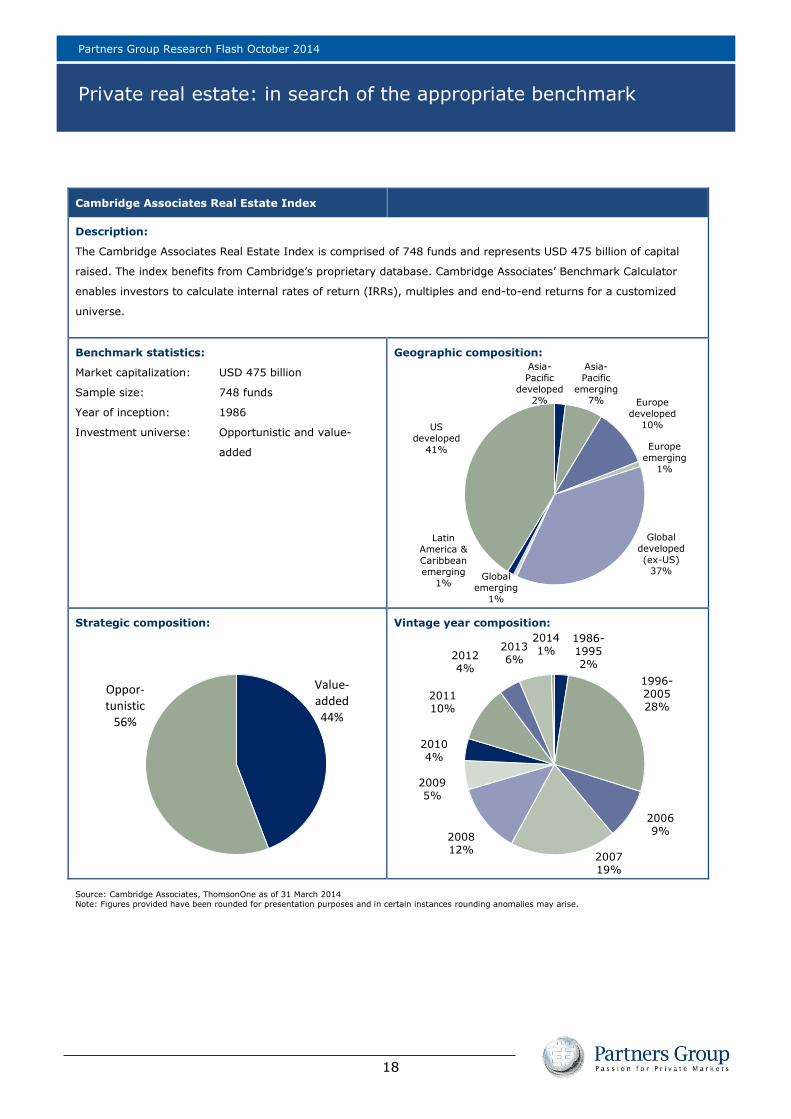
Cambridge Associates Real Estate Index
Description:
The Cambridge Associates Real Estate Index is comprised of 748 funds and represents USD 475 billion of capital
raised. The index benefits from Cambridge’s proprietary database. Cambridge Associates’ Benchmark Calculator
enables investors to calculate internal rates of return (IRRs), multiples and end-to-end returns for a customized
universe.
Benchmark statistics:
Market capitalization: USD 475 billion
Sample size: 748 funds
Year of inception: 1986
Investment universe: Opportunistic and value-
added
Geographic composition:
Strategic composition:
Vintage year composition:
Source: Cambridge Associates, ThomsonOne as of 31 March 2014
Note: Figures provided have been rounded for presentation purposes and in certain instances rounding anomalies may arise.
Asia-
Pacific
developed 2%
Asia-
Pacific
emerging 7% Europe
developed
10%
Europe
emerging
1%
Global
developed
(ex-US) 37%
Global
emerging
1%
Latin
America &
Caribbean emerging
1%
US
developed
41%
Value- added 44%
Oppor-tunistic
56%
1986-1995 2%
1996-2005 28%
2006 9%
2007 19%
2008 12%
2009 5%
2010 4%
2011 10%
2012 4%
2013 6%
2014 1%
Partners Group Research Flash October 2014
Private real estate: in search of the appropriate benchmark
19
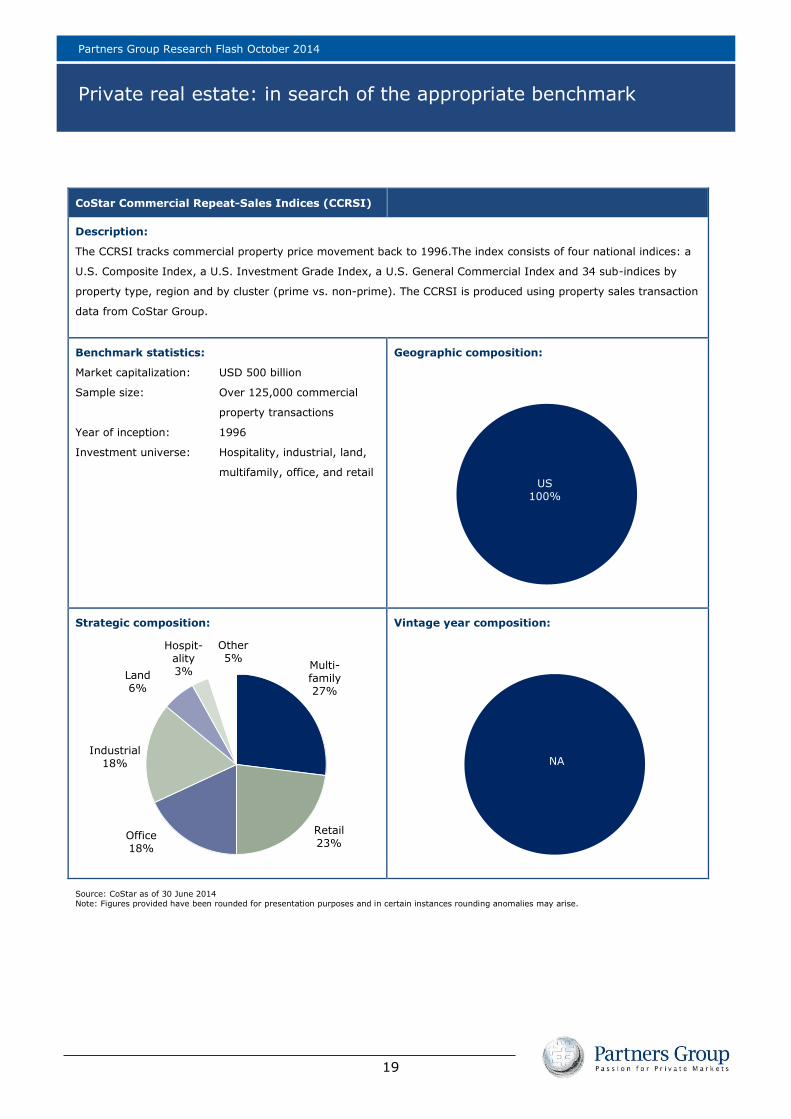
CoStar Commercial Repeat-Sales Indices (CCRSI)
Description:
The CCRSI tracks commercial property price movement back to 1996.The index consists of four national indices: a
U.S. Composite Index, a U.S. Investment Grade Index, a U.S. General Commercial Index and 34 sub-indices by
property type, region and by cluster (prime vs. non-prime). The CCRSI is produced using property sales transaction
data from CoStar Group.
Benchmark statistics:
Market capitalization: USD 500 billion
Sample size: Over 125,000 commercial
property transactions
Year of inception: 1996
Investment universe: Hospitality, industrial, land,
multifamily, office, and retail
Geographic composition:
Strategic composition:
Vintage year composition:
Source: CoStar as of 30 June 2014
Note: Figures provided have been rounded for presentation purposes and in certain instances rounding anomalies may arise.
US 100%
Multi-family 27%
Retail 23%
Office 18%
Industrial 18%
Land 6%
Hospit-ality 3%
Other 5%
NA
Partners Group Research Flash October 2014
Private real estate: in search of the appropriate benchmark
20
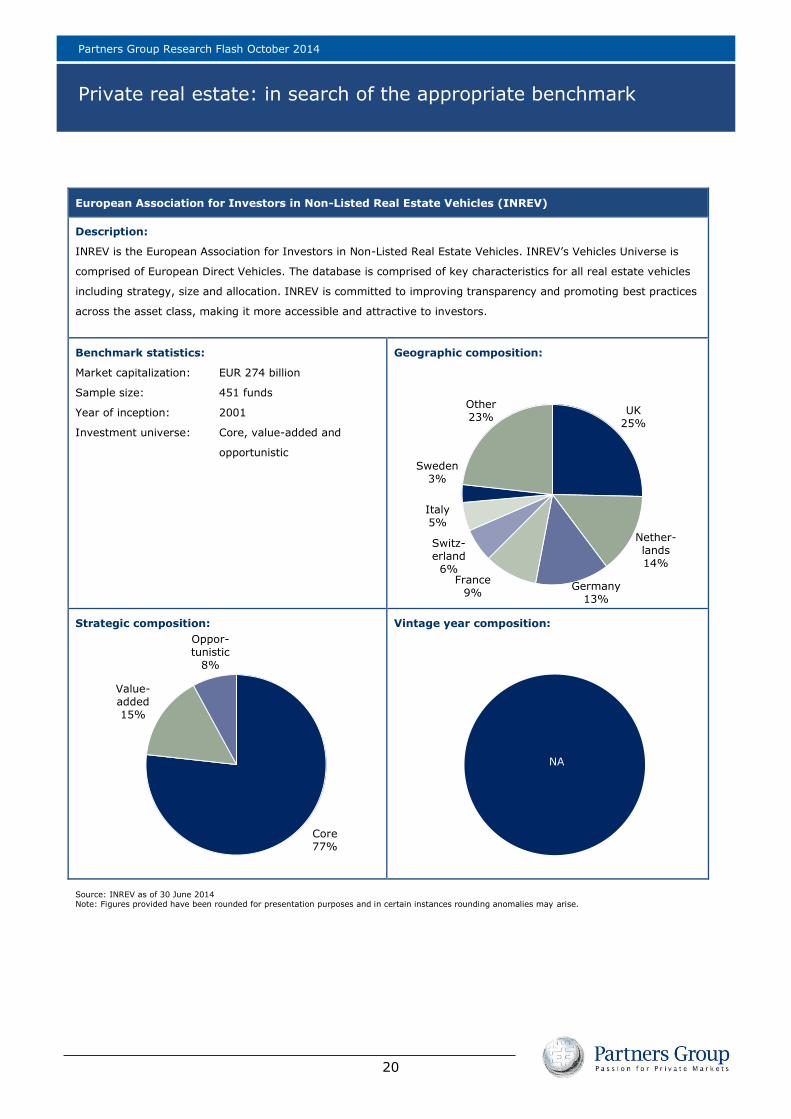
European Association for Investors in Non-Listed Real Estate Vehicles (INREV)
Description:
INREV is the European Association for Investors in Non-Listed Real Estate Vehicles. INREV’s Vehicles Universe is
comprised of European Direct Vehicles. The database is comprised of key characteristics for all real estate vehicles
including strategy, size and allocation. INREV is committed to improving transparency and promoting best practices
across the asset class, making it more accessible and attractive to investors.
Benchmark statistics:
Market capitalization: EUR 274 billion
Sample size: 451 funds
Year of inception: 2001
Investment universe: Core, value-added and
opportunistic
Geographic composition:
Strategic composition:
Vintage year composition:
Source: INREV as of 30 June 2014 Note: Figures provided have been rounded for presentation purposes and in certain instances rounding anomalies may arise.
UK 25%
Nether-lands 14%
Germany 13%
France 9%
Switz-erland
6%
Italy 5%
Sweden 3%
Other 23%
Core 77%
Value-added 15%
Oppor-tunistic
8%
NA
Partners Group Research Flash October 2014
Private real estate: in search of the appropriate benchmark
21
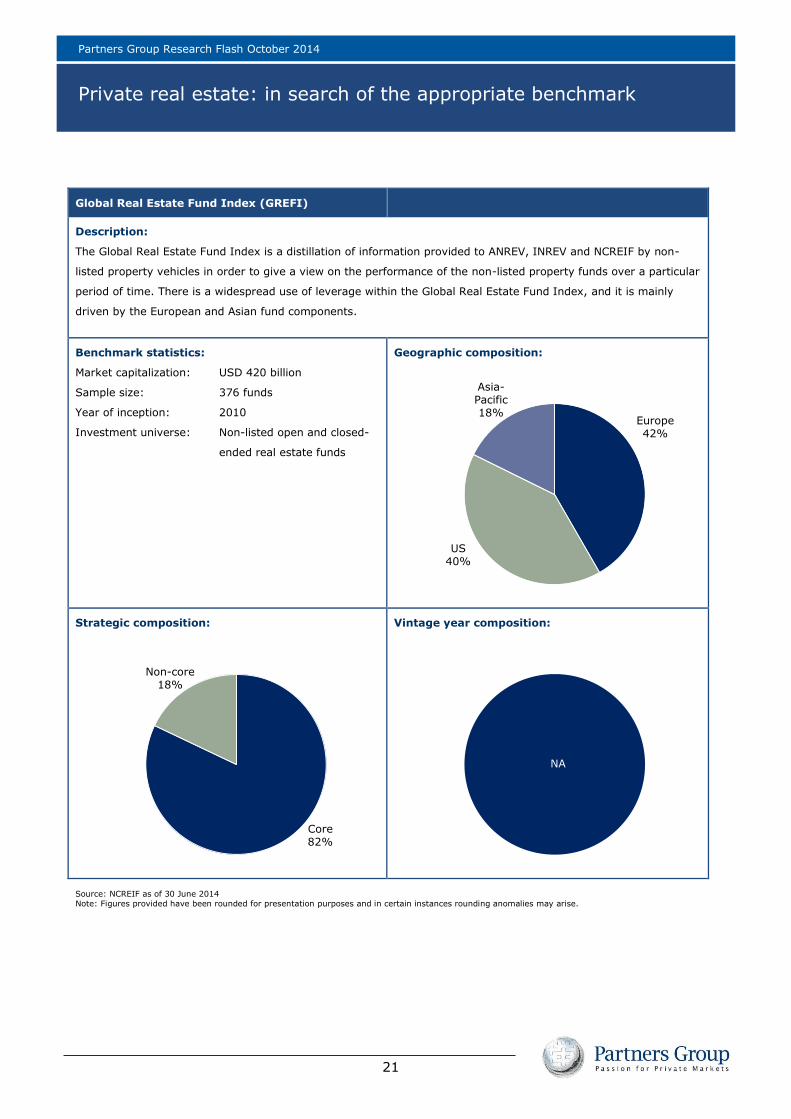
Global Real Estate Fund Index (GREFI)
Description:
The Global Real Estate Fund Index is a distillation of information provided to ANREV, INREV and NCREIF by non-
listed property vehicles in order to give a view on the performance of the non-listed property funds over a particular
period of time. There is a widespread use of leverage within the Global Real Estate Fund Index, and it is mainly
driven by the European and Asian fund components.
Benchmark statistics:
Market capitalization: USD 420 billion
Sample size: 376 funds
Year of inception: 2010
Investment universe: Non-listed open and closed-
ended real estate funds
Geographic composition:
Strategic composition:
Vintage year composition:
Source: NCREIF as of 30 June 2014
Note: Figures provided have been rounded for presentation purposes and in certain instances rounding anomalies may arise.
Europe 42%
US 40%
Asia-Pacific 18%
Core 82%
Non-core 18%
NA
Partners Group Research Flash October 2014
Private real estate: in search of the appropriate benchmark
22
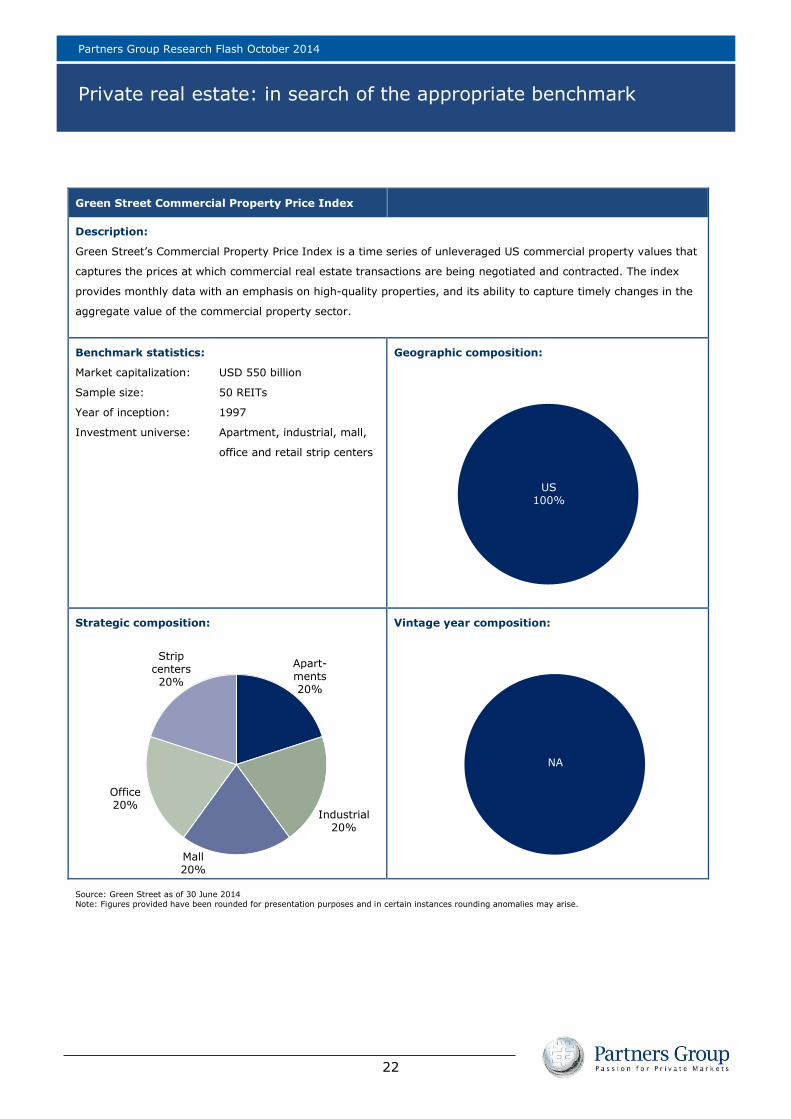
Green Street Commercial Property Price Index
Description:
Green Street’s Commercial Property Price Index is a time series of unleveraged US commercial property values that
captures the prices at which commercial real estate transactions are being negotiated and contracted. The index
provides monthly data with an emphasis on high-quality properties, and its ability to capture timely changes in the
aggregate value of the commercial property sector.
Benchmark statistics:
Market capitalization: USD 550 billion
Sample size: 50 REITs
Year of inception: 1997
Investment universe: Apartment, industrial, mall,
office and retail strip centers
Geographic composition:
Strategic composition:
Vintage year composition:
Source: Green Street as of 30 June 2014
Note: Figures provided have been rounded for presentation purposes and in certain instances rounding anomalies may arise.
US 100%
Apart-ments 20%
Industrial 20%
Mall 20%
Office 20%
Strip centers 20%
NA
Partners Group Research Flash October 2014
Private real estate: in search of the appropriate benchmark
23
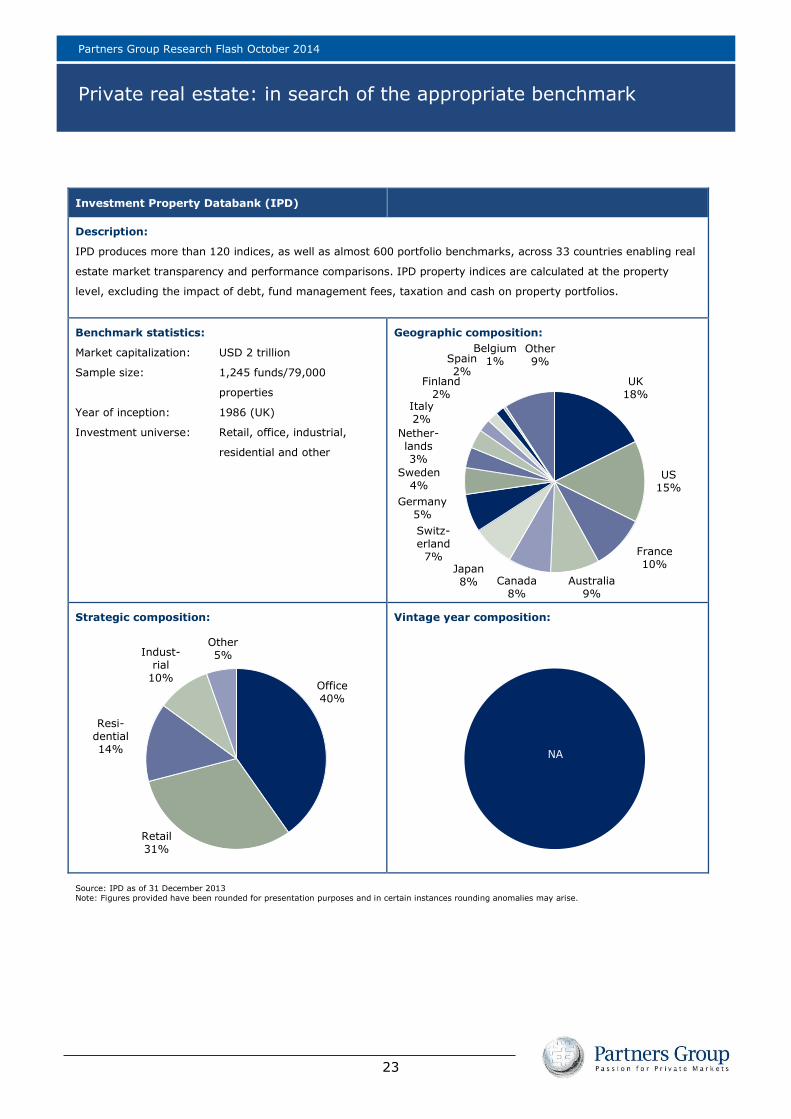
Investment Property Databank (IPD)
Description:
IPD produces more than 120 indices, as well as almost 600 portfolio benchmarks, across 33 countries enabling real
estate market transparency and performance comparisons. IPD property indices are calculated at the property
level, excluding the impact of debt, fund management fees, taxation and cash on property portfolios.
Benchmark statistics:
Market capitalization: USD 2 trillion
Sample size: 1,245 funds/79,000
properties
Year of inception: 1986 (UK)
Investment universe: Retail, office, industrial,
residential and other
Geographic composition:
Strategic composition:
Vintage year composition:
Source: IPD as of 31 December 2013
Note: Figures provided have been rounded for presentation purposes and in certain instances rounding anomalies may arise.
UK 18%
US 15%
France 10%
Australia 9%
Canada 8%
Japan 8%
Switz-erland
7%
Germany 5%
Sweden 4%
Nether-lands 3%
Italy 2%
Finland 2%
Spain 2%
Belgium 1%
Other 9%
Office 40%
Retail 31%
Resi-dential 14%
Indust-rial
10%
Other 5%
NA
Partners Group Research Flash October 2014
Private real estate: in search of the appropriate benchmark
24
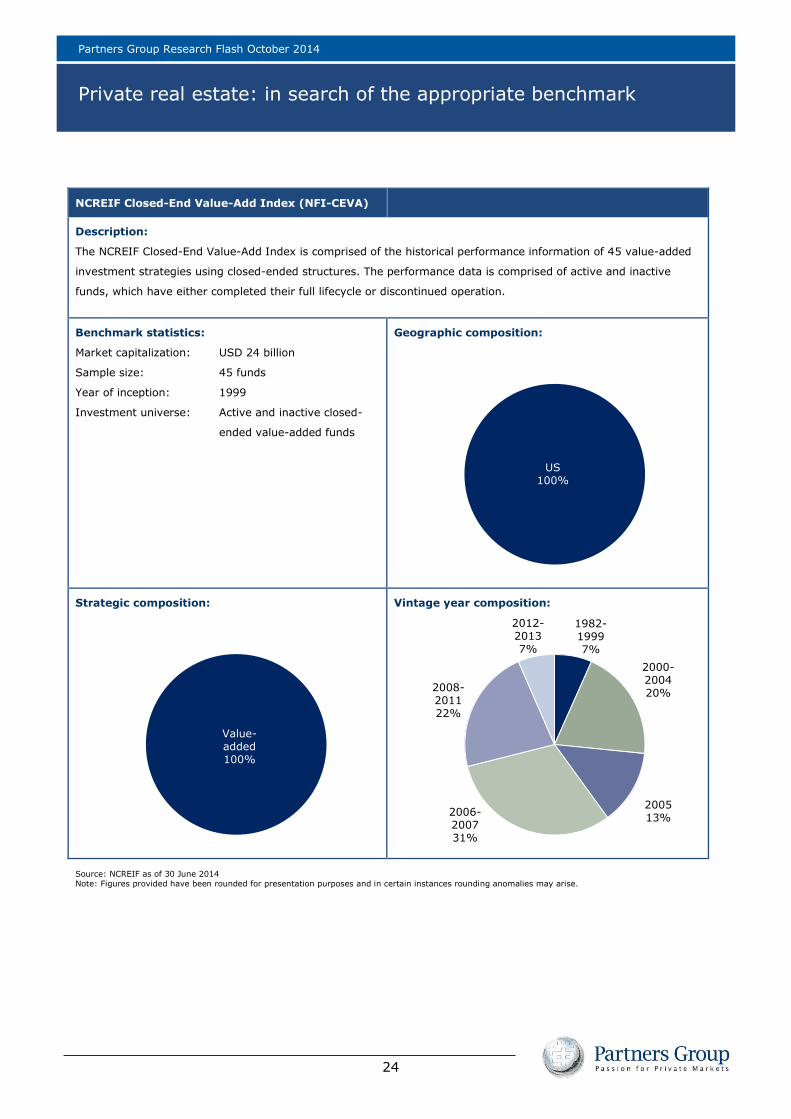
NCREIF Closed-End Value-Add Index (NFI-CEVA)
Description:
The NCREIF Closed-End Value-Add Index is comprised of the historical performance information of 45 value-added
investment strategies using closed-ended structures. The performance data is comprised of active and inactive
funds, which have either completed their full lifecycle or discontinued operation.
Benchmark statistics:
Market capitalization: USD 24 billion
Sample size: 45 funds
Year of inception: 1999
Investment universe: Active and inactive closed-
ended value-added funds
Geographic composition:
Strategic composition:
Vintage year composition:
Source: NCREIF as of 30 June 2014
Note: Figures provided have been rounded for presentation purposes and in certain instances rounding anomalies may arise.
US 100%
Value- added 100%
1982-1999 7%
2000-2004 20%
2005 13%
2006-2007 31%
2008-2011 22%
2012-2013 7%
Partners Group Research Flash October 2014
Private real estate: in search of the appropriate benchmark
25
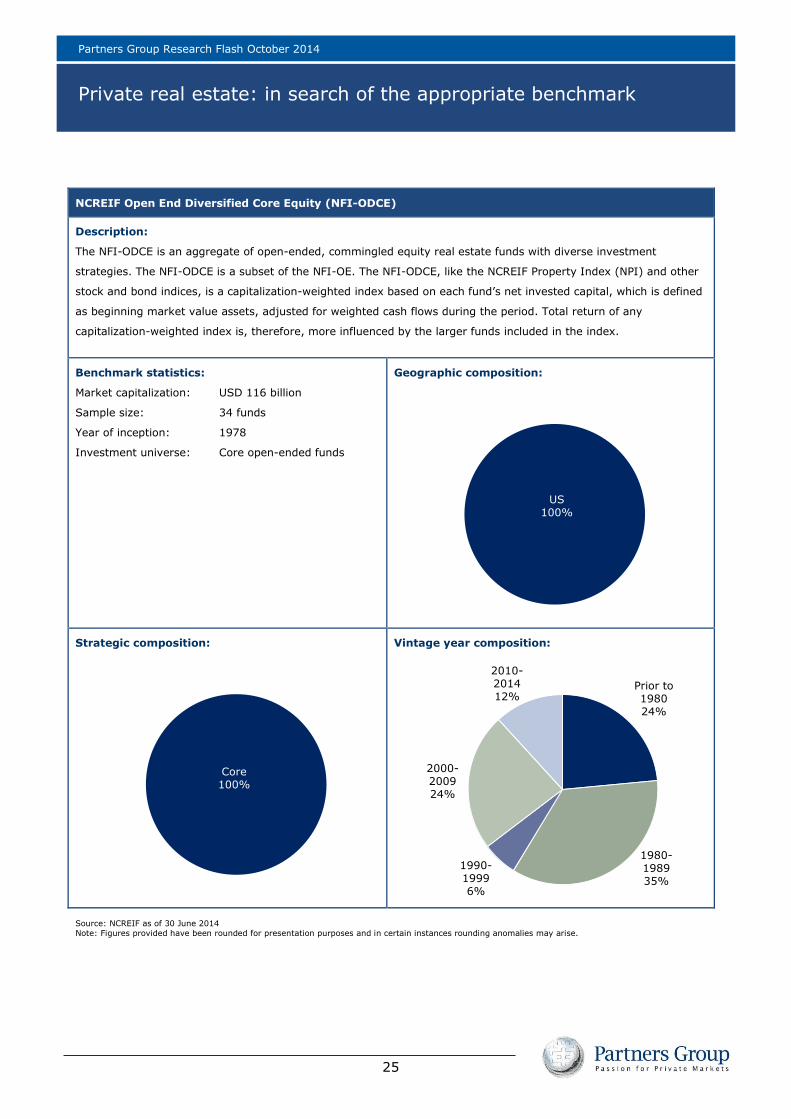
NCREIF Open End Diversified Core Equity (NFI-ODCE)
Description:
The NFI-ODCE is an aggregate of open-ended, commingled equity real estate funds with diverse investment
strategies. The NFI-ODCE is a subset of the NFI-OE. The NFI-ODCE, like the NCREIF Property Index (NPI) and other
stock and bond indices, is a capitalization-weighted index based on each fund’s net invested capital, which is defined
as beginning market value assets, adjusted for weighted cash flows during the period. Total return of any
capitalization-weighted index is, therefore, more influenced by the larger funds included in the index.
Benchmark statistics:
Market capitalization: USD 116 billion
Sample size: 34 funds
Year of inception: 1978
Investment universe: Core open-ended funds
Geographic composition:
Strategic composition:
Vintage year composition:
Source: NCREIF as of 30 June 2014
Note: Figures provided have been rounded for presentation purposes and in certain instances rounding anomalies may arise.
US 100%
Core 100%
Prior to 1980 24%
1980-1989 35%
1990-1999 6%
2000-2009 24%
2010-2014 12%
Partners Group Research Flash October 2014
Private real estate: in search of the appropriate benchmark
26
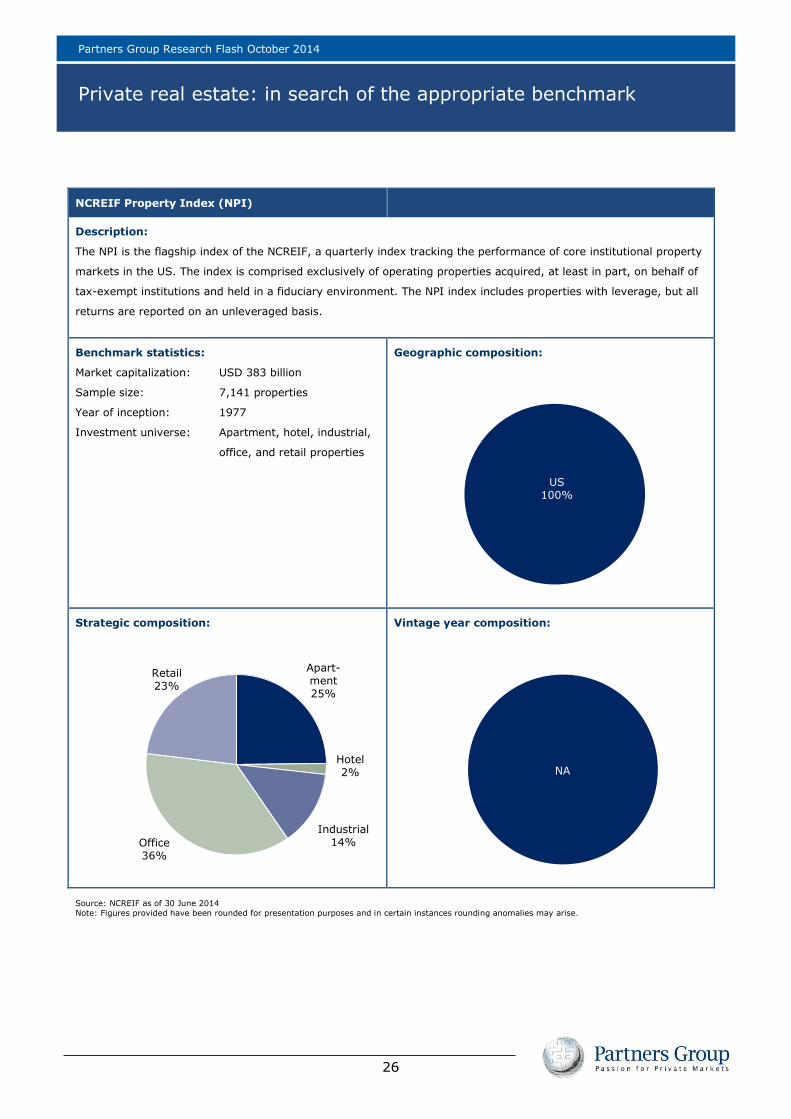
NCREIF Property Index (NPI)
Description:
The NPI is the flagship index of the NCREIF, a quarterly index tracking the performance of core institutional property
markets in the US. The index is comprised exclusively of operating properties acquired, at least in part, on behalf of
tax-exempt institutions and held in a fiduciary environment. The NPI index includes properties with leverage, but all
returns are reported on an unleveraged basis.
Benchmark statistics:
Market capitalization: USD 383 billion
Sample size: 7,141 properties
Year of inception: 1977
Investment universe: Apartment, hotel, industrial,
office, and retail properties
Geographic composition:
Strategic composition:
Vintage year composition:
Source: NCREIF as of 30 June 2014
Note: Figures provided have been rounded for presentation purposes and in certain instances rounding anomalies may arise.
US 100%
Apart-ment 25%
Hotel 2%
Industrial 14% Office
36%
Retail 23%
NA
Partners Group Research Flash October 2014
Private real estate: in search of the appropriate benchmark
27
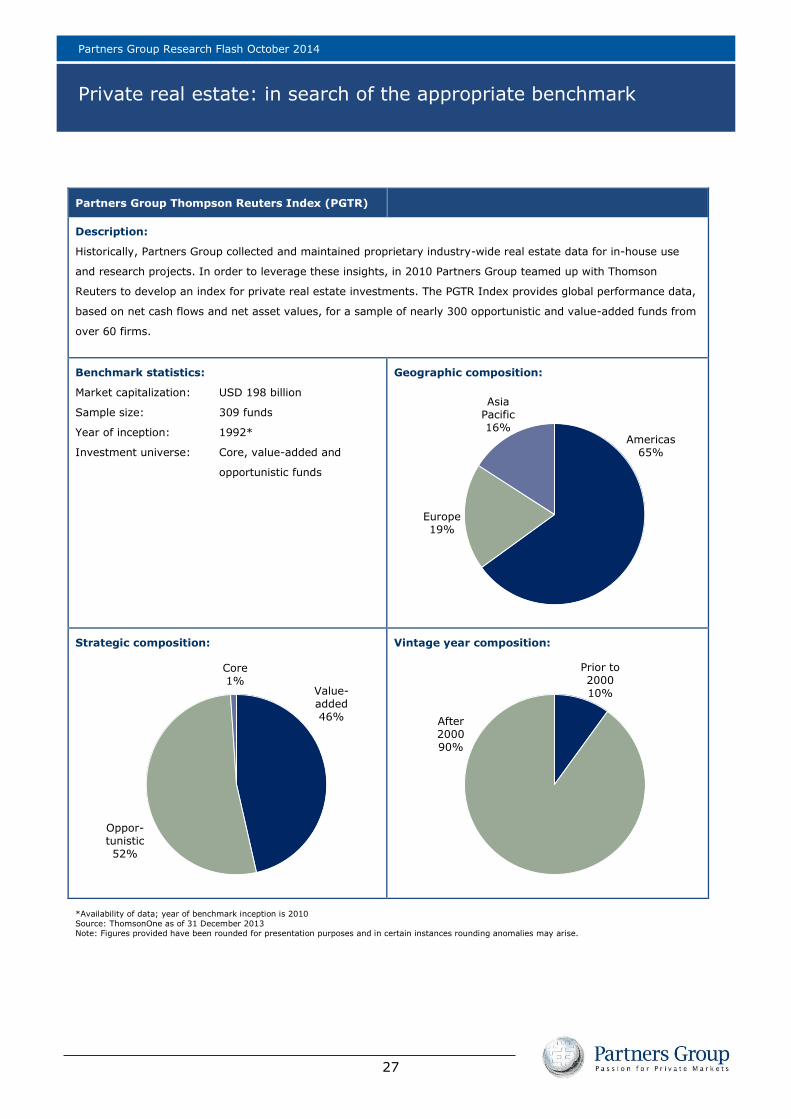
Partners Group Thompson Reuters Index (PGTR)
Description:
Historically, Partners Group collected and maintained proprietary industry-wide real estate data for in-house use
and research projects. In order to leverage these insights, in 2010 Partners Group teamed up with Thomson
Reuters to develop an index for private real estate investments. The PGTR Index provides global performance data,
based on net cash flows and net asset values, for a sample of nearly 300 opportunistic and value-added funds from
over 60 firms.
Benchmark statistics:
Market capitalization: USD 198 billion
Sample size: 309 funds
Year of inception: 1992*
Investment universe: Core, value-added and
opportunistic funds
Geographic composition:
Strategic composition:
Vintage year composition:
*Availability of data; year of benchmark inception is 2010
Source: ThomsonOne as of 31 December 2013
Note: Figures provided have been rounded for presentation purposes and in certain instances rounding anomalies may arise.
Americas 65%
Europe 19%
Asia Pacific 16%
Value- added 46%
Oppor-tunistic 52%
Core 1%
Prior to 2000 10%
After 2000 90%
Partners Group Research Flash October 2014
Private real estate: in search of the appropriate benchmark
28
Client contact:
Kathrin Schulthess
Investment Solutions
Phone: +41 41 784 65 81
Email: [email protected]
Media relations contact:
Jenny Blinch
Public Relations
Phone: +41 41 784 65 26
Email: [email protected]
www.partnersgroup.com
ZUG | HOUSTON | SAN FRANCISCO | NEW YORK | SAO PAULO | LONDON | GUERNSEY | PARIS | LUXEMBOURG
MILAN | MUNICH | DUBAI | MUMBAI | SINGAPORE | SHANGHAI | SEOUL | TOKYO | SYDNEY
Partners Group Research Flash October 2014
Disclaimer
29
This material has been prepared solely for purposes of illustration and discussion. Under no circumstances should the information contained herein be used or considered as an offer to sell, or solicitation of an offer to buy any security. Any security offering is subject to certain investor eligibility criteria as detailed in the applicable offering documents. The information contained herein is confidential and may not be reproduced or circulated in whole or in part. The information is in summary form for convenience of presentation, it is not complete and it should not be relied upon as such.
All information, including performance information, has been prepared in good faith; however Partners Group makes no representation or warranty express or implied, as to the accuracy or completeness of the information, and nothing herein shall be relied upon as a promise or representation as to past or future performance. This material may include information that is based, in part or in full, on hypothetical assumptions, models and/or other analysis of Partners Group (which may not necessarily be described herein), no representation or warranty is made as to the
reasonableness of any such assumptions, models or analysis. Any charts which represent the composition of a portfolio of private markets investments serve as guidance only and are not intended to be an assurance of the actual allocation of private markets investments. The information set forth herein was gathered from various sources which Partners Group believes, but does not guarantee, to be reliable. Unless stated otherwise, any opinions expressed herein are current as of the date hereof and are subject to change at any time. All sources which have not been otherwise credited have derived from Partners Group.