benchmark with partners
TRANSCRIPT
7/30/2019 Benchmark with Partners
http://slidepdf.com/reader/full/benchmark-with-partners 1/23
Continuous Improvement & Benchmarking
Compare with Partners
Benchmark
Press Page Down to advance.
Press Esc or the browser Back button
to return.

7/30/2019 Benchmark with Partners
http://slidepdf.com/reader/full/benchmark-with-partners 2/23
2 Continuous Improvement & BenchmarkingModule: Benchmark with partners
Learning objectives
ConfirmTrainDefineAnalyseMeasure
Root CausesBest practiceGap analysis
Have the skills to: Confirm the BM study
Train the participants
Define the service for study Analyse the service
Measure the service
Discover the Root Causes
Develop Best Practice Compare against Best Practice
Identify the BP Gaps

7/30/2019 Benchmark with Partners
http://slidepdf.com/reader/full/benchmark-with-partners 3/23
3 Continuous Improvement & BenchmarkingModule: Benchmark with partners
Confirm the BM study arrangements
Use the first meeting to do this
Confirm with all participants:
Objectives
Services to be BM (in general terms)
Study schedule and meeting places
Participants’ names and contact details
Resources required Communication protocols
7/30/2019 Benchmark with Partners
http://slidepdf.com/reader/full/benchmark-with-partners 4/23
4 Continuous Improvement & BenchmarkingModule: Benchmark with partners
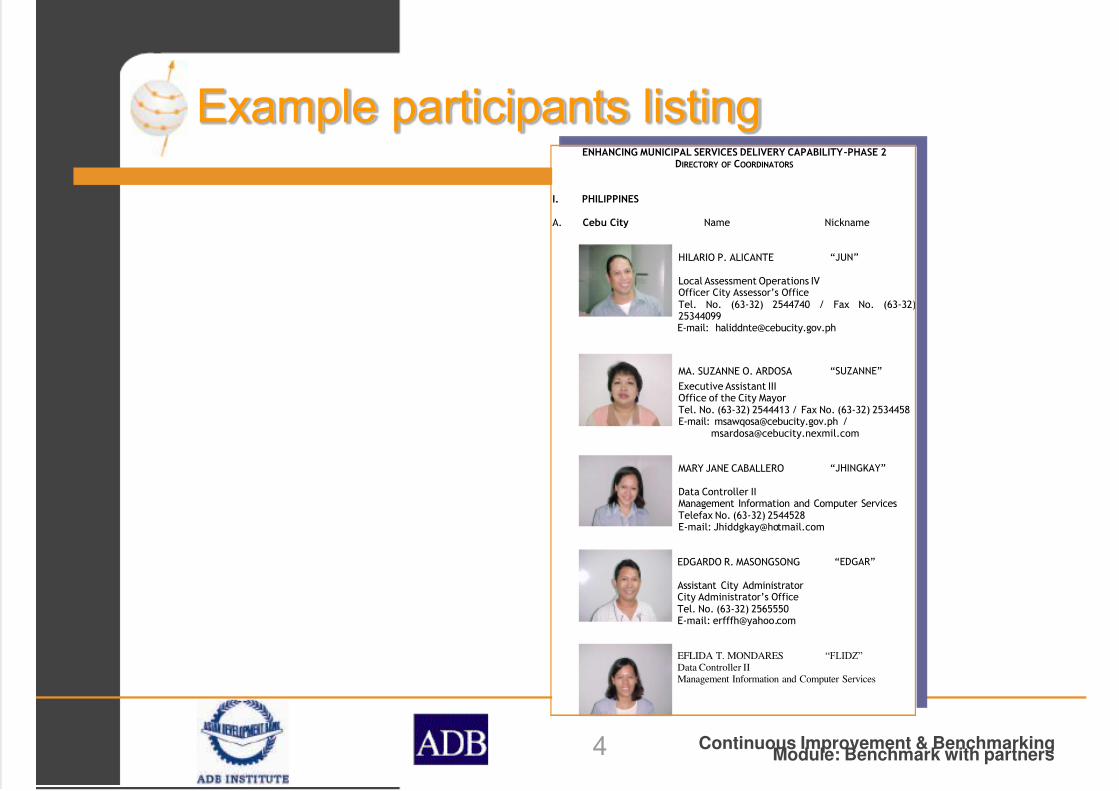
Example participants listingENHANCING MUNICIPAL SERVICES DELIVERY CAPABILITY–PHASE 2
DIRECTORY OF COORDINATORS
I. PHILIPPINES
A. Cebu City Name Nickname
HILARIO P. ALICANTE “JUN”
Local Assessment Operations IVOfficer City Assessor’s Office
Tel. No. (63-32) 2544740 / Fax No. (63-32)25344099E-mail: [email protected]
MA. SUZANNE O. ARDOSA “SUZANNE”
Executive Assistant IIIOffice of the City MayorTel. No. (63-32) 2544413 / Fax No. (63-32) 2534458E-mail: [email protected] /
MARY JANE CABALLERO “JHINGKAY”
Data Controller IIManagement Information and Computer ServicesTelefax No. (63-32) 2544528E-mail: [email protected]
EDGARDO R. MASONGSONG “EDGAR”
Assistant City AdministratorCity Administrator’s Office
Tel. No. (63-32) 2565550E-mail: [email protected]
EFLIDA T. MONDARES “FLIDZ”
Data Controller II
Management Information and Computer Services
7/30/2019 Benchmark with Partners
http://slidepdf.com/reader/full/benchmark-with-partners 5/23
5 Continuous Improvement & BenchmarkingModule: Benchmark with partners
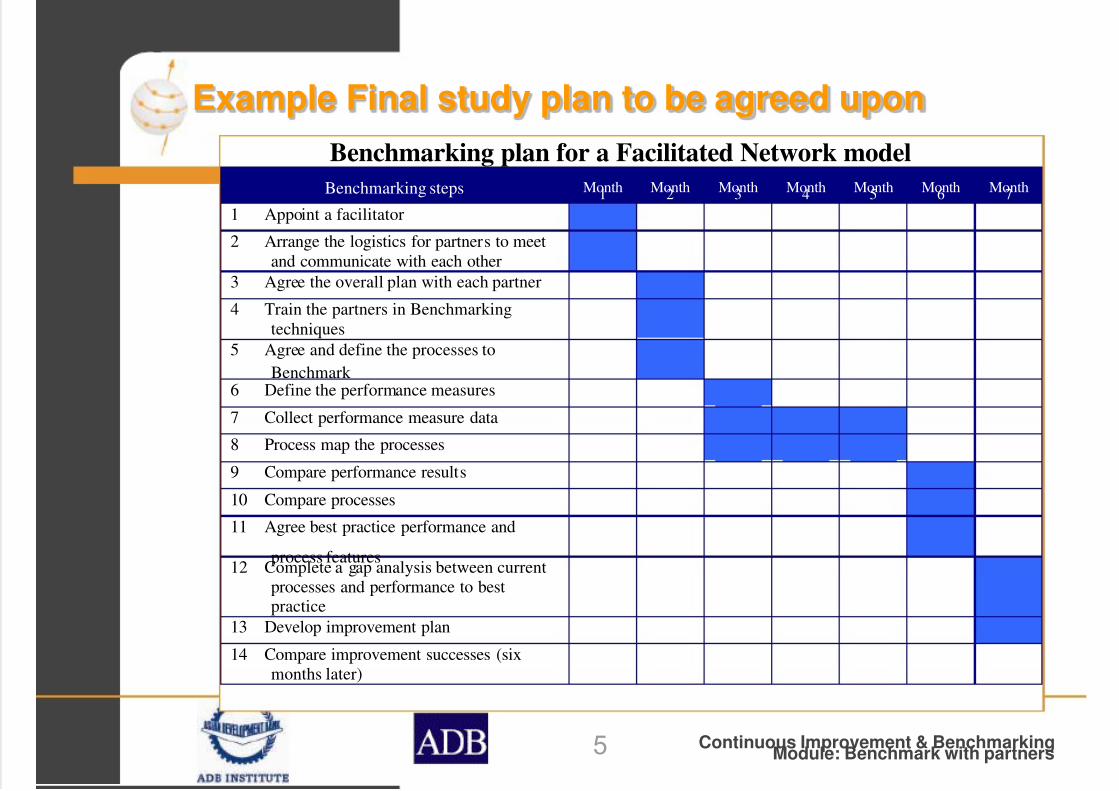
Example Final study plan to be agreed upon
Benchmarking plan for a Facilitated Network model
Benchmarking steps Month1
Month2
Month3
Month4
Month5
Month6
Month7
1 Appoint a facilitator
2 Arrange the logistics for partners to meet
and communicate with each other
3 Agree the overall plan with each partner
4 Train the partners in Benchmarking
techniques
5 Agree and define the processes to
Benchmark 6 Define the performance measures
7 Collect performance measure data
8 Process map the processes
9 Compare performance results
10 Compare processes
11 Agree best practice performance and
process features12 Complete a gap analysis between current
processes and performance to bestpractice
13 Develop improvement plan
14 Compare improvement successes (six
months later)
7/30/2019 Benchmark with Partners
http://slidepdf.com/reader/full/benchmark-with-partners 6/23
6 Continuous Improvement & BenchmarkingModule: Benchmark with partners
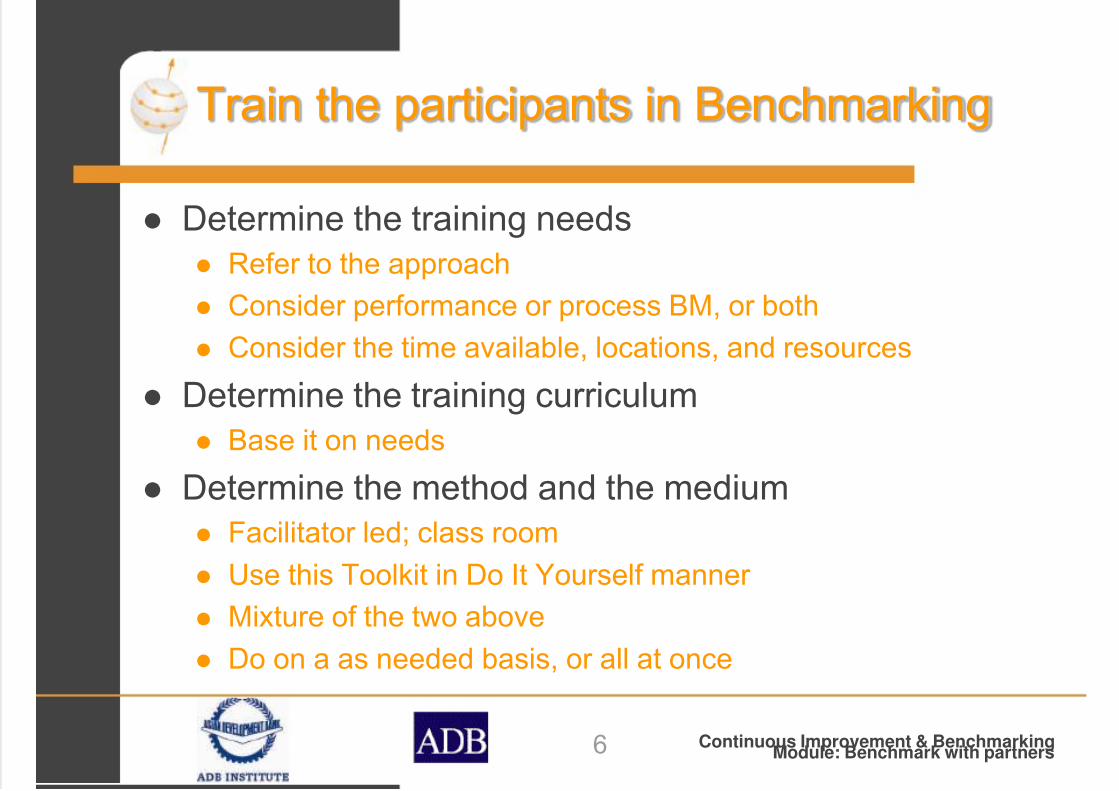
Train the participants in Benchmarking
Determine the training needs
Refer to the approach
Consider performance or process BM, or both
Consider the time available, locations, and resources
Determine the training curriculum
Base it on needs
Determine the method and the medium
Facilitator led; class room
Use this Toolkit in Do It Yourself manner
Mixture of the two above
Do on a as needed basis, or all at once
7/30/2019 Benchmark with Partners
http://slidepdf.com/reader/full/benchmark-with-partners 7/23
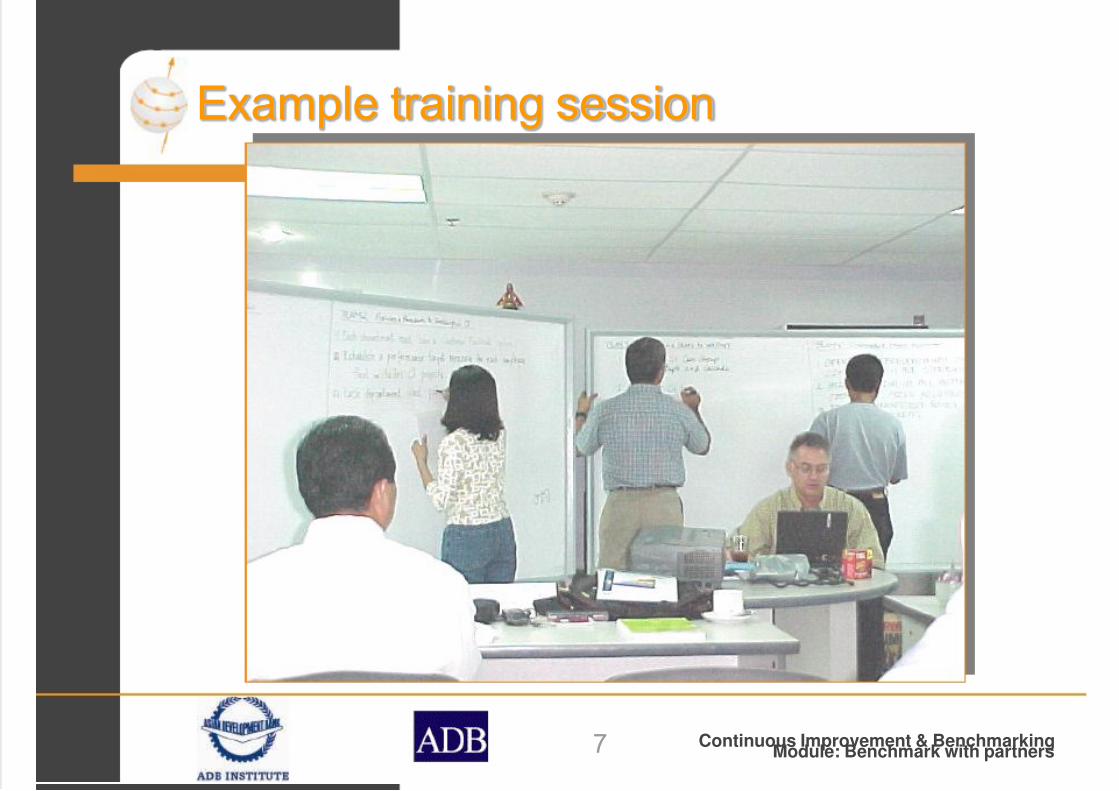
7 Continuous Improvement & BenchmarkingModule: Benchmark with partners
Example training session
7/30/2019 Benchmark with Partners
http://slidepdf.com/reader/full/benchmark-with-partners 8/23
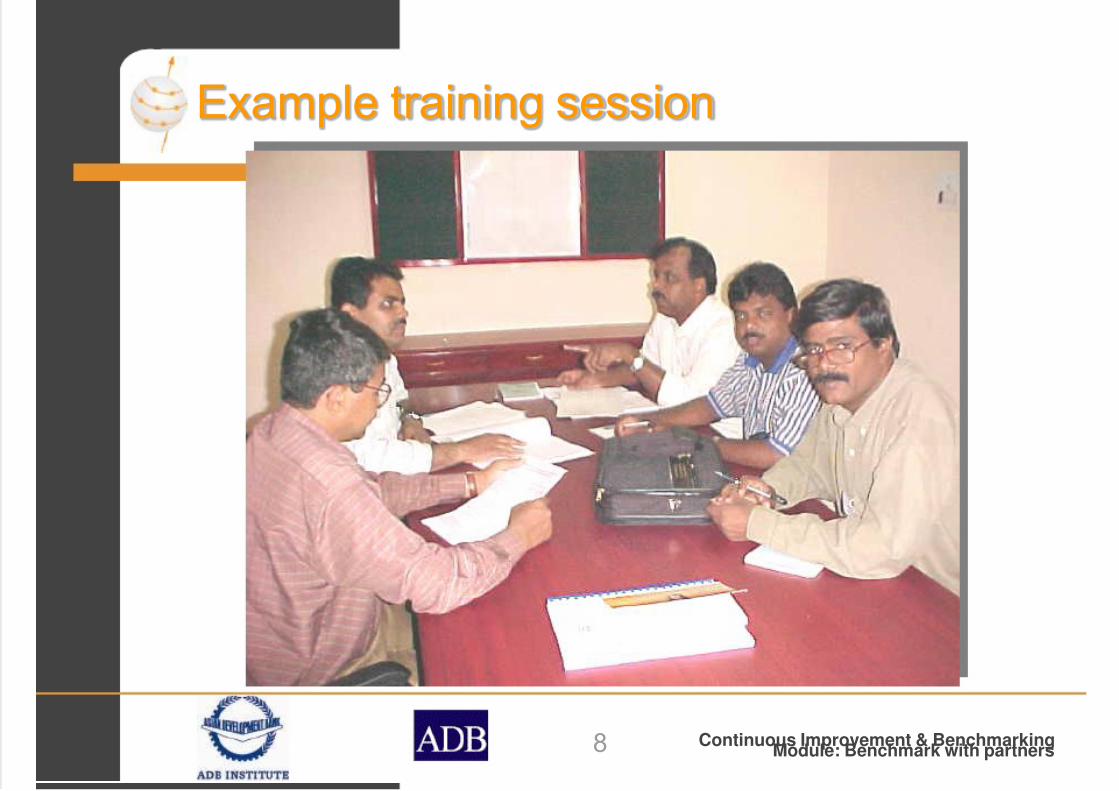
8 Continuous Improvement & BenchmarkingModule: Benchmark with partners
Example training session
7/30/2019 Benchmark with Partners
http://slidepdf.com/reader/full/benchmark-with-partners 9/23
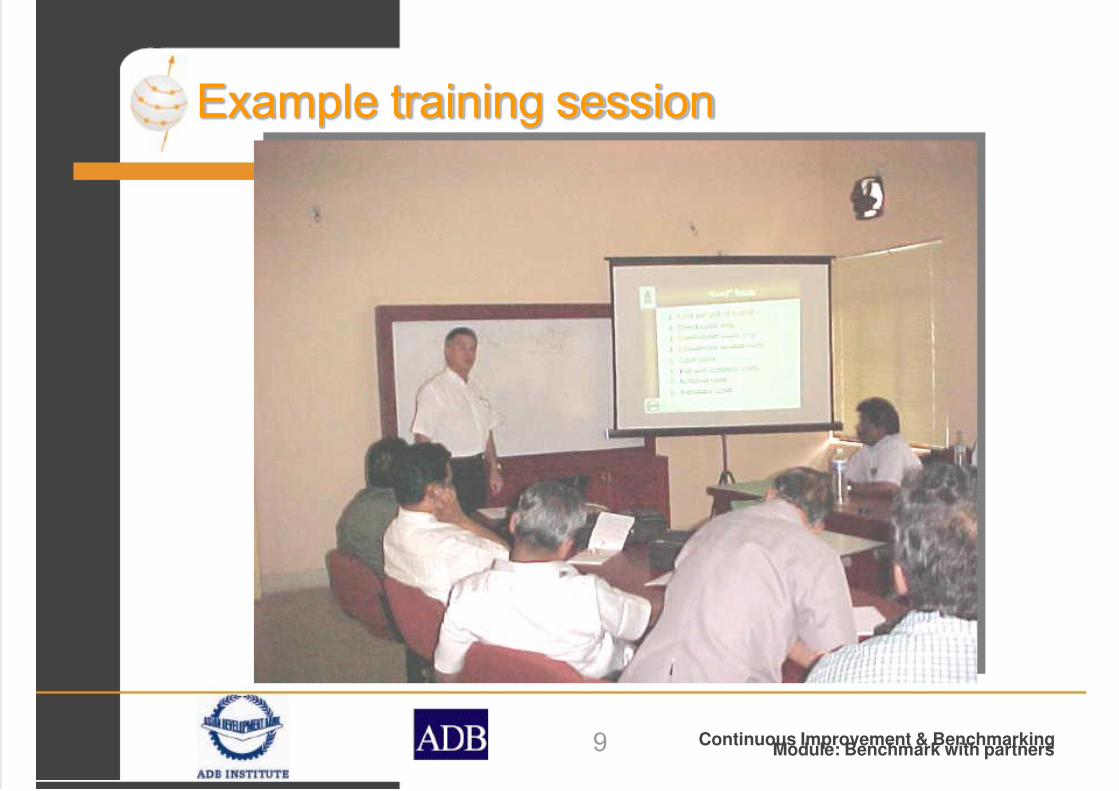
9 Continuous Improvement & BenchmarkingModule: Benchmark with partners
Example training session
7/30/2019 Benchmark with Partners
http://slidepdf.com/reader/full/benchmark-with-partners 10/23
10 Continuous Improvement & BenchmarkingModule: Benchmark with partners
Define the service for study
Use the Toolkit “Define the service to improve”
Use a joint meeting to do this
Use full collaboration of all participants
Complete the forms within the Toolkit
Issue the definition to all participants

7/30/2019 Benchmark with Partners
http://slidepdf.com/reader/full/benchmark-with-partners 11/23
11 Continuous Improvement & BenchmarkingModule: Benchmark with partners
Example service definition for Benchmarking
Parking
ManagementLocal Laws
Animal
Management
School
Crossing
Supervision
Customer
Service
Parking Patrol &
EnforcementCar Park
Management
Pro-active patrolPermits/ Registration
Complaint investigation
Enforcement
Education
Manage the
Service
Pound Management
Fire
Prevention
Handling Requests for
ServiceProcessing Infringements
Task allocation
Maintaining Information
Systems
Inspections & Notices
Clearing Land
Enforcement
Traffic & Local Laws
7/30/2019 Benchmark with Partners
http://slidepdf.com/reader/full/benchmark-with-partners 12/23
12 Continuous Improvement & BenchmarkingModule: Benchmark with partners
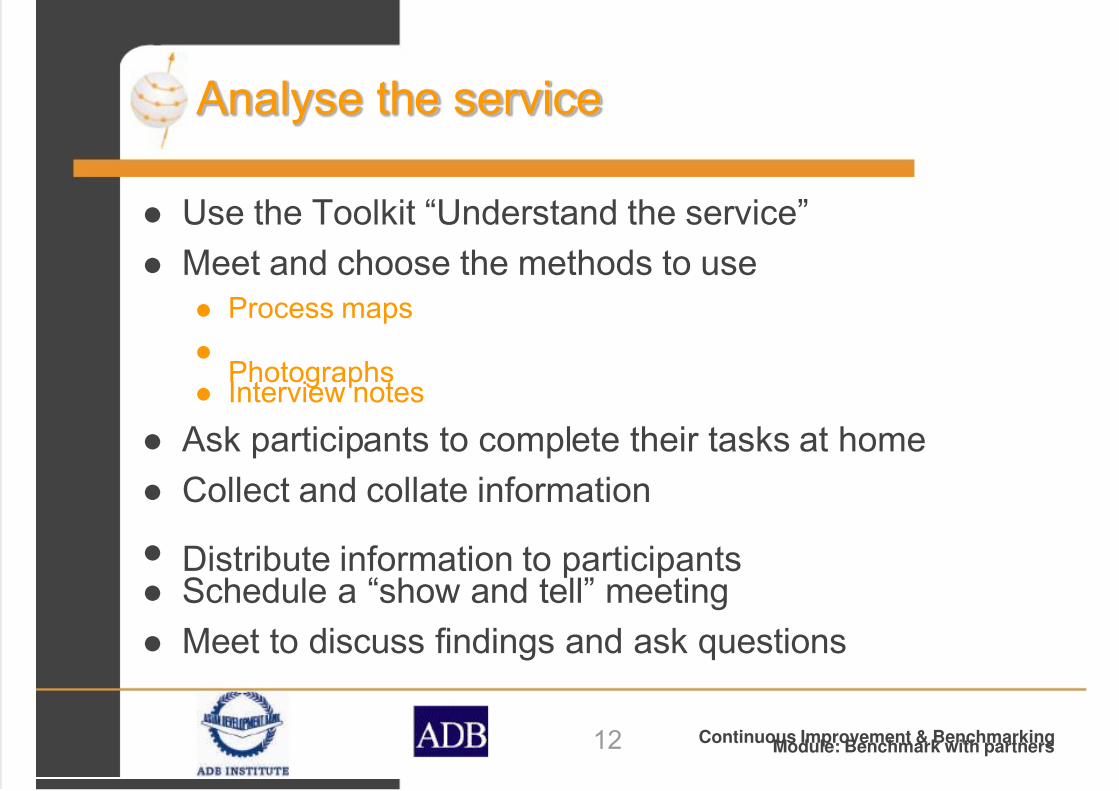
Analyse the service
Use the Toolkit “Understand the service”
Meet and choose the methods to use
Process maps
Photographs Interview notes
Ask participants to complete their tasks at home
Collect and collate information
Distribute information to participants Schedule a “show and tell” meeting
Meet to discuss findings and ask questions
7/30/2019 Benchmark with Partners
http://slidepdf.com/reader/full/benchmark-with-partners 13/23
13 Continuous Improvement & BenchmarkingModule: Benchmark with partners
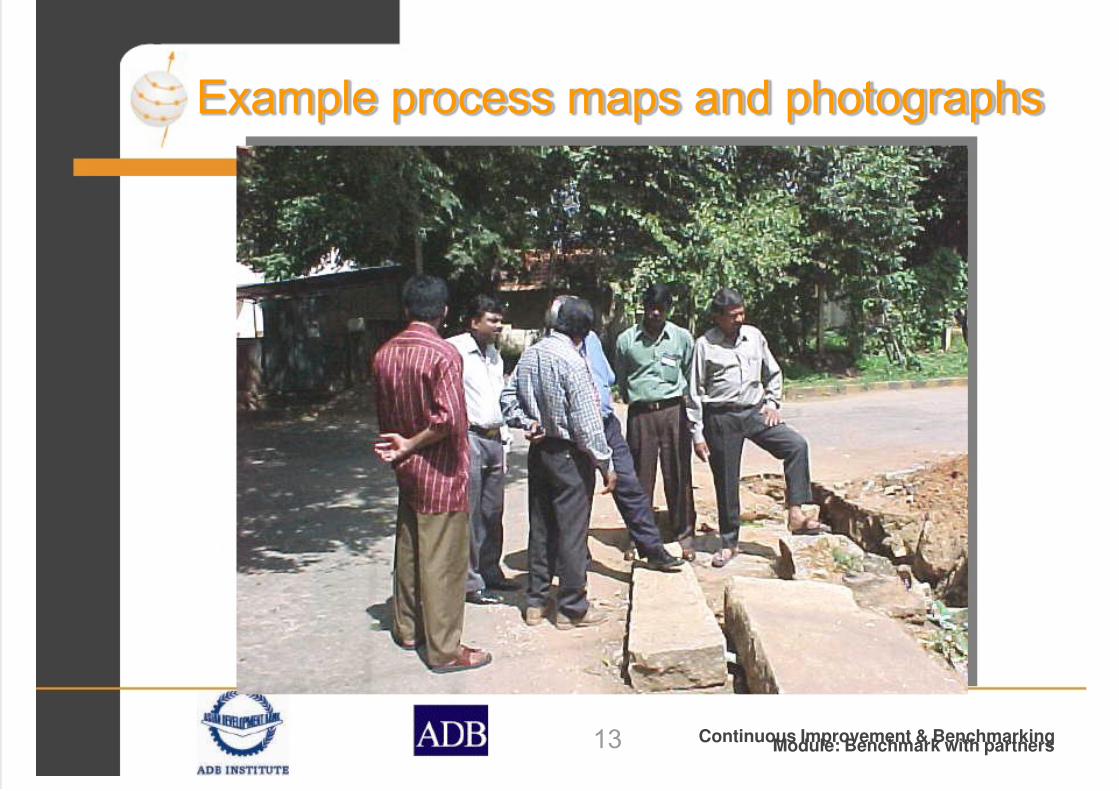
Example process maps and photographs
7/30/2019 Benchmark with Partners
http://slidepdf.com/reader/full/benchmark-with-partners 14/23
14 Continuous Improvement & BenchmarkingModule: Benchmark with partners
Measure the service
Use the Toolkit “Measure the service”
Meet to agree performance measure definitions
Ask participants to collect performance data at
home Collect and collate performance information
Distribute performance information toparticipants
Schedule a “show and tell” meeting
Meet to discuss findings and ask questions
7/30/2019 Benchmark with Partners
http://slidepdf.com/reader/full/benchmark-with-partners 15/23
15 Continuous Improvement & BenchmarkingModule: Benchmark with partners
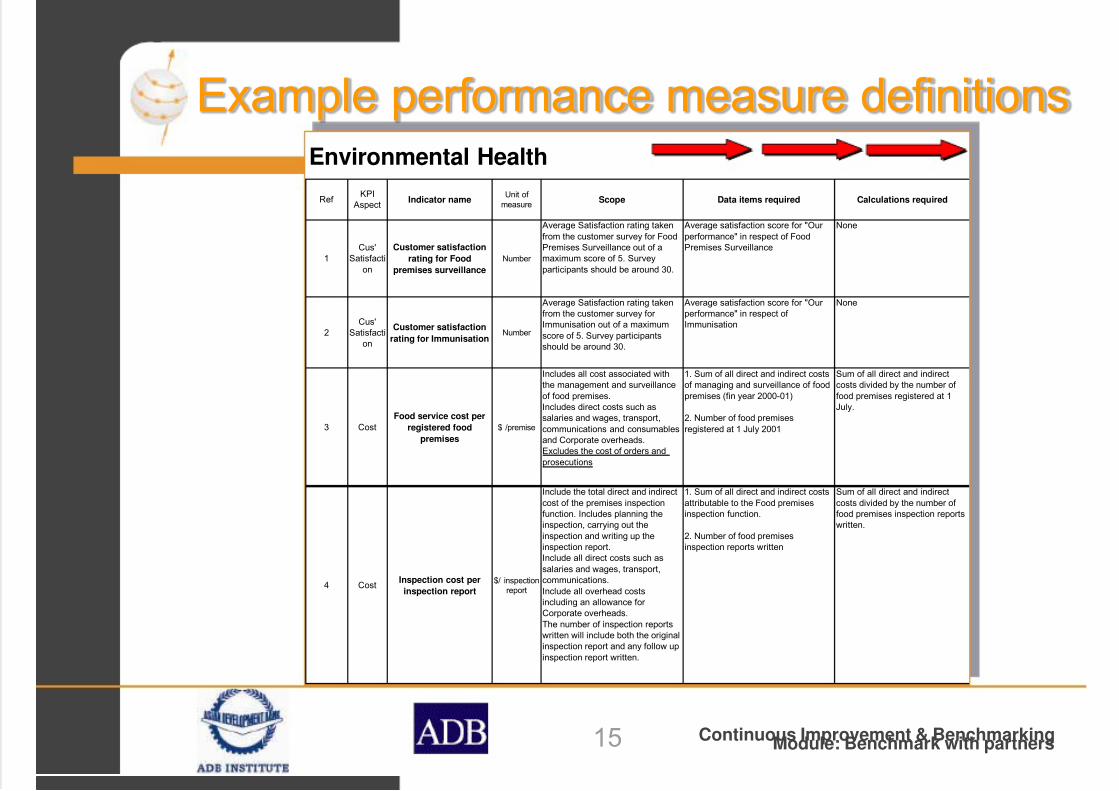
Example performance measure definitionsEnvironmental Health
Ref KPI
AspectIndicator name
Unit of measure
Scope Data items required Calculations required
1Cus'
Satisfacti
on
Customer satisfaction
rating for Food
premises surveillance
Number
Average Satisfaction rating taken
from the customer survey for FoodPremises Surveillance out of amaximum score of 5. Survey
participants should be around 30.
Average satisfaction score for "Our
performance" in respect of FoodPremises Surveillance
None
2Cus'
Satisfaction
Customer satisfaction
rating for ImmunisationNumber
Average Satisfaction rating takenfrom the customer survey for Immunisation out of a maximum
score of 5. Survey participantsshould be around 30.
Average satisfaction score for "Our performance" in respect of Immunisation
None
3 Cost
Food service cost per
registered food
premises
$ /premise
Includes all cost associated withthe management and surveillance
of food premises.Includes direct costs such assalaries and wages, transport,
communications and consumablesand Corporate overheads.Excludes the cost of orders and
prosecutions
1. Sum of all direct and indirect costsof managing and surveillance of food
premises (fin year 2000-01)
2. Number of food premises
registered at 1 July 2001
Sum of all direct and indirectcosts divided by the number of
food premises registered at 1July.
4 CostInspection cost per
inspection report
$/ inspectionreport
Include the total direct and indirect
cost of the premises inspectionfunction. Includes planning theinspection, carrying out the
inspection and writing up theinspection report.Include all direct costs such as
salaries and wages, transport,communications.
Include all overhead costsincluding an allowance for Corporate overheads.
The number of inspection reportswritten will include both the originalinspection report and any follow up
inspection report written.
1. Sum of all direct and indirect costs
attributable to the Food premisesinspection function.
2. Number of food premisesinspection reports written
Sum of all direct and indirect
costs divided by the number of food premises inspection reportswritten.
7/30/2019 Benchmark with Partners
http://slidepdf.com/reader/full/benchmark-with-partners 16/23
16 Continuous Improvement & BenchmarkingModule: Benchmark with partners
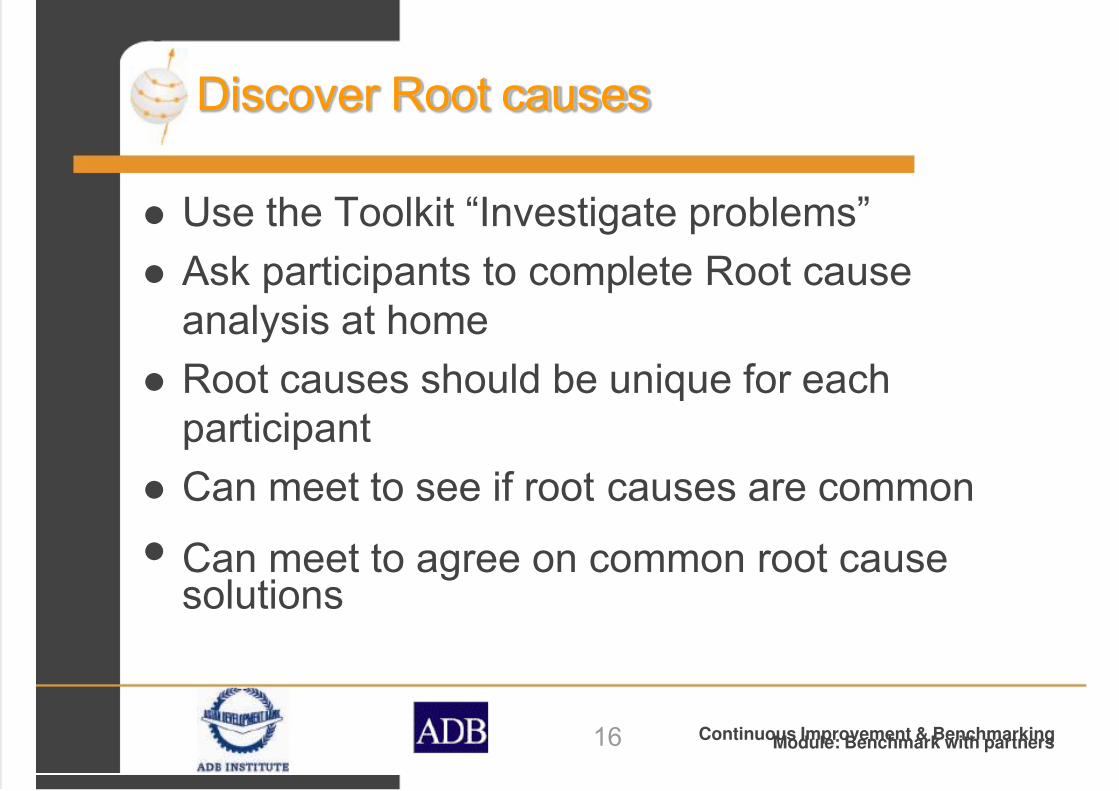
Discover Root causes
Use the Toolkit “Investigate problems”
Ask participants to complete Root cause
analysis at home
Root causes should be unique for each
participant
Can meet to see if root causes are common
Can meet to agree on common root causesolutions
7/30/2019 Benchmark with Partners
http://slidepdf.com/reader/full/benchmark-with-partners 17/23
17 Continuous Improvement & BenchmarkingModule: Benchmark with partners
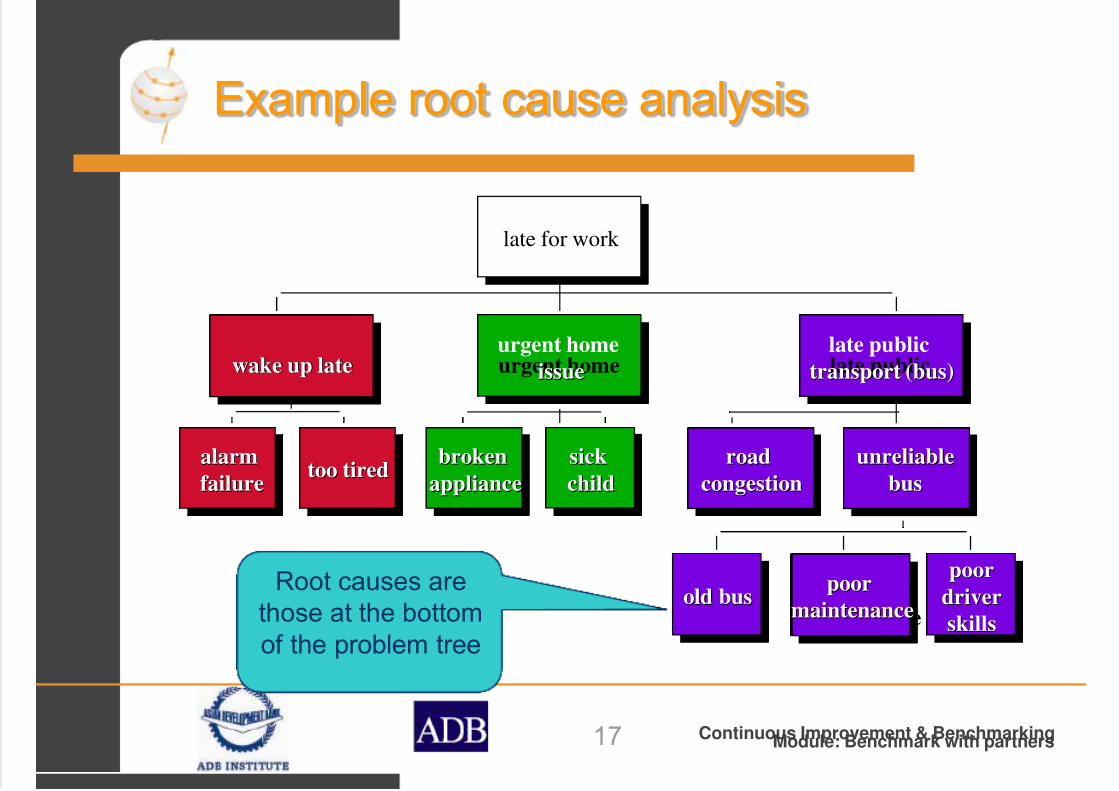
Example root cause analysis
late for work late for work
urgent homeissue
urgent homeurgent home
issueissue late publictransport (bus)
late publiclate public
transport (bus)transport (bus)
alarm
failure
alarmalarm
failurefailure too tiredtoo tiredtoo tired
wake up latewake up latewake up late
old busold busold bus
broken
appliance
brokenbroken
applianceappliance
poor
driver
skills
poorpoor
driverdriver
skillsskills
poor
maintenance
poorpoor
maintenancemaintenance
sick
child
sicksick
childchildroad
congestion
roadroad
congestioncongestionunreliable
bus
unreliableunreliable
busbus
Root causes are
those at the bottom
of the problem tree
7/30/2019 Benchmark with Partners
http://slidepdf.com/reader/full/benchmark-with-partners 18/23
18 Continuous Improvement & BenchmarkingModule: Benchmark with partners
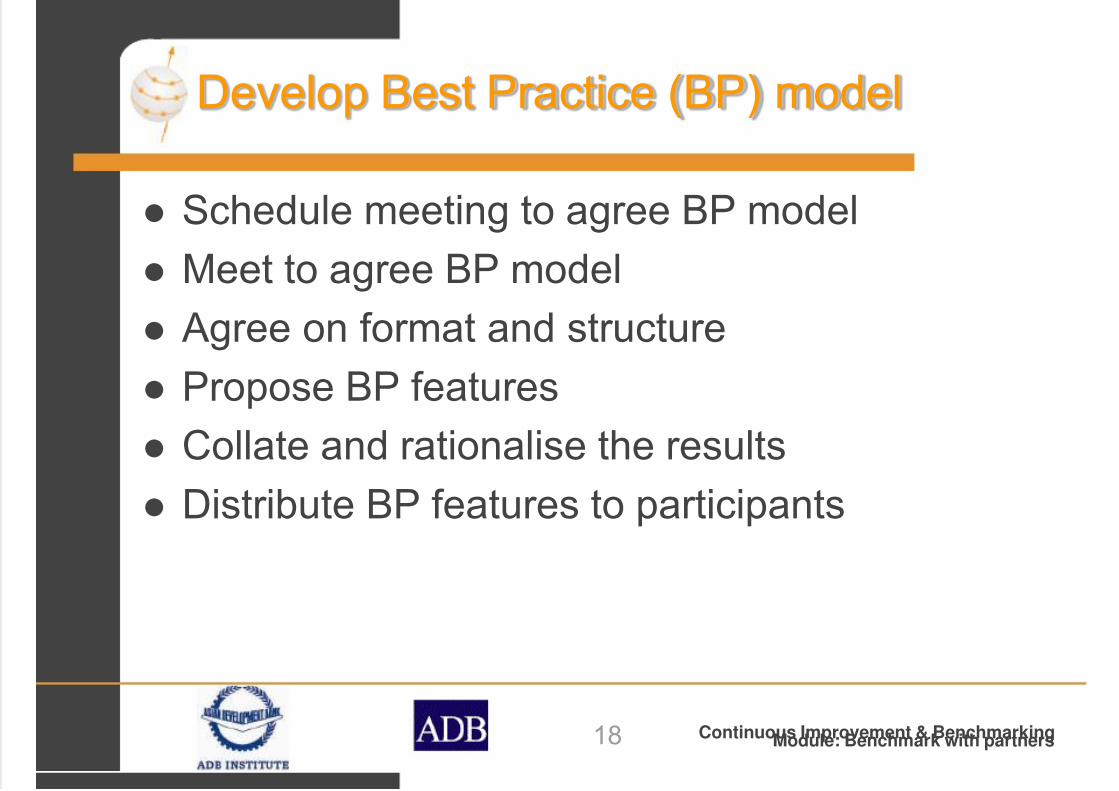
Develop Best Practice (BP) model
Schedule meeting to agree BP model
Meet to agree BP model
Agree on format and structure
Propose BP features
Collate and rationalise the results
Distribute BP features to participants
7/30/2019 Benchmark with Partners
http://slidepdf.com/reader/full/benchmark-with-partners 19/23
19 Continuous Improvement & BenchmarkingModule: Benchmark with partners
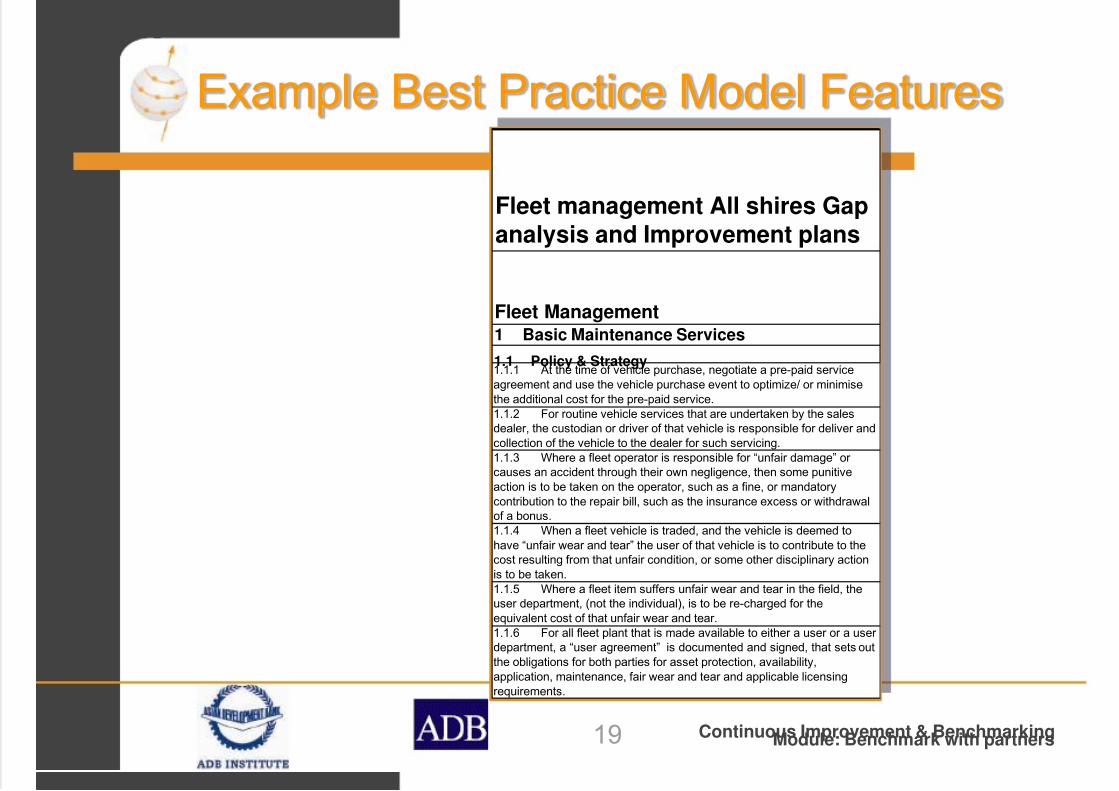
Example Best Practice Model Features
Fleet management All shires Gap
analysis and Improvement plans
Fleet Management1 Basic Maintenance Services
1.1 Policy & Strategy1.1.1 At the time of vehicle purchase, negotiate a pre-paid service
agreement and use the vehicle purchase event to optimize/ or minimise
the additional cost for the pre-paid service.
1.1.2 For routine vehicle services that are undertaken by the sales
dealer, the custodian or driver of that vehicle is responsible for deliver and
collection of the vehicle to the dealer for such servicing.
1.1.3 Where a fleet operator is responsible for “unfair damage” or
causes an accident through their own negligence, then some punitive
action is to be taken on the operator, such as a fine, or mandatory
contribution to the repair bill, such as the insurance excess or withdrawal
of a bonus.
1.1.4 When a fleet vehicle is traded, and the vehicle is deemed to
have “unfair wear and tear” the user of that vehicle is to contribute to the
cost resulting from that unfair condition, or some other disciplinary action
is to be taken.
1.1.5 Where a fleet item suffers unfair wear and tear in the field, the
user department, (not the individual), is to be re-charged for the
equivalent cost of that unfair wear and tear.
1.1.6 For all fleet plant that is made available to either a user or a user
department, a “user agreement” is documented and signed, that sets out
the obligations for both parties for asset protection, availability,
application, maintenance, fair wear and tear and applicable licensing
requirements.

7/30/2019 Benchmark with Partners
http://slidepdf.com/reader/full/benchmark-with-partners 20/23
20 Continuous Improvement & BenchmarkingModule: Benchmark with partners
Compare against BP model
Use Toolkit BP Gap Analysis worksheet
Score importance and compliance
7/30/2019 Benchmark with Partners
http://slidepdf.com/reader/full/benchmark-with-partners 21/23
21 Continuous Improvement & BenchmarkingModule: Benchmark with partners
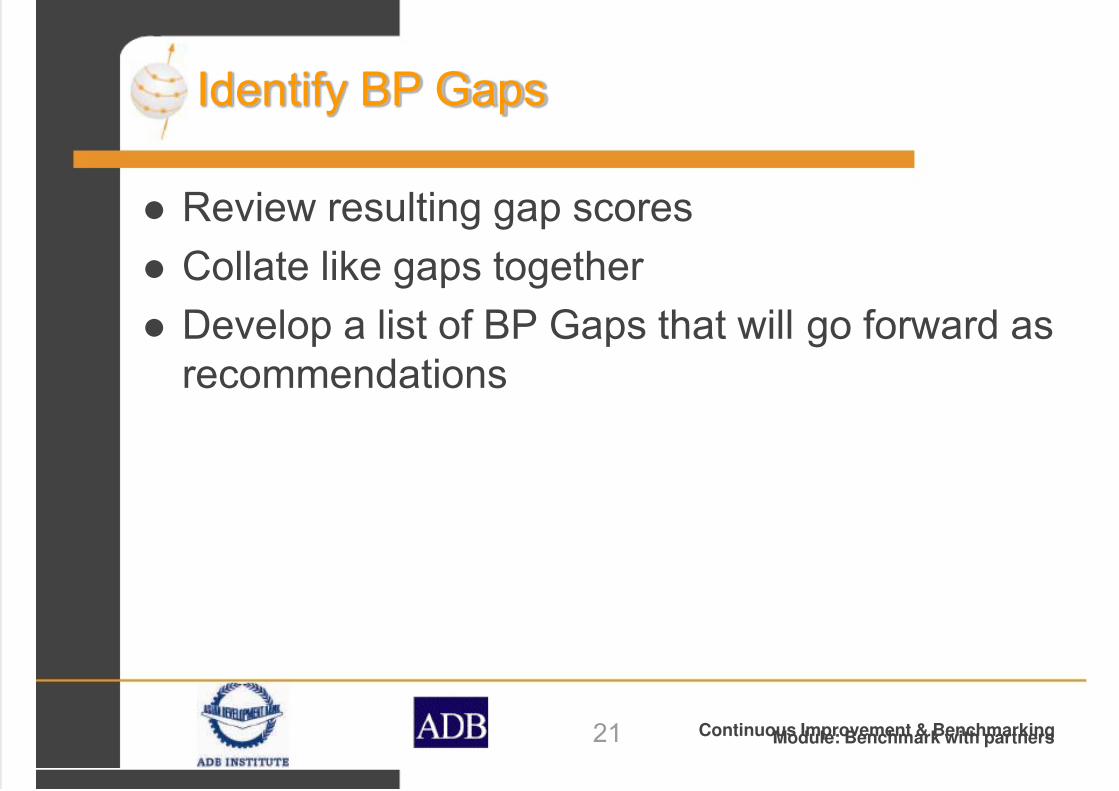
Identify BP Gaps
Review resulting gap scores
Collate like gaps together
Develop a list of BP Gaps that will go forward as
recommendations

7/30/2019 Benchmark with Partners
http://slidepdf.com/reader/full/benchmark-with-partners 22/23
22 Continuous Improvement & BenchmarkingModule: Benchmark with partners
Example of a BP Gap Analysis
Environmental health All shires
Gap analysis and Improvement
plans
Importance1 = Not important at all2 = Slightly important
3 = Somewhat important4 = Quite Important
5 = Of CriticalImportance
How we rate1 = Poor 2 = Fair
3 = Good4 = Very Good
5 = At Best Practicelevel
Our Gap to
Best Practice
(Importanceminus Rating)
Improvement actions
Environmental Health Ballarat Ballarat Ballarat Ballarat
1Routine Inspections1.1 Policy & Strategy1.1.1The inspection reports are to be signed by the proprietor uponcompletion, so as to ensure the inspector and proprietor agree on thefindings and actions required.
1 1 0
1.1.2Educate the proprietor (in addition to simply performing the
inspection program) education tools to include, fact sheets, informationbulletins.
4 2 2
What does the FSS do? An FSS (prop) should be
educated.
1.1.3 Announce scheduled inspection to the proprietor beforeattending the premises.
1 3 -2
1.1.4Council to provide more definitive standards coveringambiguous sections of the acts; examples are “adequate”, “appropriate”
etc. (Council is to define the parameters to cover off these ambiguities).4 2 2
1.2 Structure, Resourcing & Financing1.2.1Combine Food Act and Tobacco Act inspections together so asto get better utilization from our inspectors. 4 4 0
1.2.2Rotate Environmental Health Officers through the inspectionprogram so as to give them field experience, avoid repetition, variety for
the proprietor, and a wider view in the assessment of the premises. 4 4 0
1.2.3Provide inspectors with modern measurement tools to performtheir inspections quickly: could use digital thermometers, etc. 5 4 1
1.3 Planning & Scheduling1.3.1Develop a monthly action plan, that schedules inspections andfollow ups, so as to ensure performance is in line with the annual plan. 4 3 1
7/30/2019 Benchmark with Partners
http://slidepdf.com/reader/full/benchmark-with-partners 23/23
23 Continuous Improvement & BenchmarkingModule: Benchmark with partners
Disclaimer
The views expressed in this Toolkit are the views of the authors and do not necessarily reflect the views or policies of the Asian Development Bank (ADB) or Asian Development Bank Institute (ADBI), or their Board of Directors, or the governments they represent. ADB and ADBI do not guarantee the accuracy of the data included in this CD-ROM and accepts no responsibility for
any consequences of their use. Terminology used may not necessarily be consistent with ADB official terms.