private provision of public goods under quantity ... · private provision of public goods under...
TRANSCRIPT
Private provision of public goods under quantityregulation: Cap-and-trade schemes limit green
consumerism
Grischa Perinoa∗
a School of Business, Economics and Social Sciences, University of Hamburg
Welckerstr. 8, 20354 Hamburg, Germany
email: [email protected]
July 25, 2013
Abstract
Private provision of public goods can only supplement government provision ifindividual actions affect the level of the public good. Cap-and-trade schemes reducethe overuse of common resources such as a stable climate or fish stocks by imposinga binding cap on total use by regulated agents. Any private contribution provided bymeans of e.g. green consumerism or life-style choices within such a scheme only impactson who uses the resource but leaves total use unaffected. Perfect neutralisation ofmarginal contributions is a key design element of cap-and-trade schemes. As real worldcap-and-trade policies like the EU Emission Trading System have incomplete coverage,understanding what they cover is crucial for individuals aiming to contribute. Basingconsumption decisions e.g. on physical rather than effective carbon emissions is likelyto increase total emissions.
JEL codes: H23, H31, D64, H41, Q54, Q58Keywords: Cap-and-trade, green consumerism, emissions tax, crowding-out of private
contributions, carbon labelling
∗The author would like to thank Franz Wirl, seminar participants at the University of East Anglia andthe 2013 AURO workshop in Zurich for helpful comments. Special thanks are due to Sandra Bogelein as thepaper was inspired by discussions with her and she provided excellent comments and feedback.
1
1 Introduction
Climate change mitigation is a global, intergenerational public good that seriously challenges
established governance concepts. It is currently provided by international agreements, na-
tional governments and voluntary private contributions but because of its nature and scale
international agreements have usually been considered key in effectively addressing the prob-
lem. However, the apparent difficulty in achieving substantial and effective emission reduc-
tions both at the national and international level, have recently led researchers from several
disciplines and politicians and NGOs to more closely consider the potential of contributions
made by individuals and households as part of their consumption and life-style choices. There
is substantial evidence that a substantial share of the population is intriniscally motivated to
contribute to climate change mitigation and does so when given the chance. Examples are
subscriptions to ’green’ electricity tariffs (Kotchen and Moore 2007, Jacobsen et al. 2012,
Costa and Kahn 2013), purchases of hybrid cars (Ozaki and Sevastyanova 2011), grocery
shopping (Perino et al. 2013) and a general willingness-to-pay to purchase carbon offsets
(Diederich and Goeschl 2013). There is a drive to understand how these voluntary con-
tributions can be increased by non-price interventions (Abrahamse et al. 2005, Allcott and
Mullainathan 2010, Allcott 2011) and researchers1, governments2 and NGOs3 provide lists
of actions advising households in reducing their carbon footprint. In the context of grocery
shopping, carbon footprint labels provide the information necessary for consumers to take
into account the climate impacts of their consumption choices (Vandenbergh et al. 2011).
While still in their infancy, several large corporations like Coca Cola and UK’s Tesco super-
market have tested them. Common standards to compute life-cycle carbon footprints exist
in the UK (PAS 2050) and are currently under development internationally (ISO 14067).
While it is clear that private provision alone cannot solve the climate change problem, it
1Gardner and Stern (2008), Vandenbergh et al. (2008), Dietz et al. (2009)2See e.g. the U.S. Environmental Protection Agency’s ’What You Can Do’ (http :
//www.epa.gov/climatechange/wycd/index.html, accessed: 9th July 2013) and the European Commis-
sions ’Take Control!’ (http : //ec.europa.eu/clima/sites/campaign/control/takecontrolen.htm, accessed:
9th July 2013) campaigns.3e.g. Greenpeace’s carbon footprint reduction tool kit (http : //www.greenpeace.org/er −
ship/en/Galley/Activist− toolkits/, accessed: 9th July 2013).
2
is widely believed to be an important part of the solution. Ostrom (2010, 2012) advocates
actions being taken at many different levels including both national and international cap-
and-trade programmes and changes in household behaviour and Vandenbergh et al. (2008)
and Dietz et al. (2009) explicitly regard changes in consumption and life-style choices as
complements to cap-and-trade schemes. Cap-and-trade schemes for greenhouse gas (GHG)
emissions are opperating in the European Union, in North America as part of the Western
Climate Initative (WCI) and the Regional Greenhouse Gas Initative (RGGI).4 Australia will
convert what currently in effect is a carbon tax into a cap-and-trade scheme in 2015 and
China has started the first of a number of city-level cap-and-trade programmes for carbon
emissions in June 2013 to gain experience for a future national scale programme5.
Given the trend to extend the use of both cap-and-trade schemes and policies stimulating
voluntary behavioural change, it is important to understand how these two mechanisms to
reduce GHG emissions interact. In this paper I will make a first step toward developing such
an understanding. Combining a simple behavioural economics model of consumer choice
with basic environmental economics I investiage the static effects of green consumerism in the
presence of a cap-and-trade scheme. The interactions between quantity based government
intervention and voluntary contributions to the public good have profound - and mostly
unintended - impacts on the effectivity of both forms of provision. A key result is that
policies aimed e.g. at reducing domestic electrivity consumption (Allcott and Mullainathan
2010, Allcott 2011) can have profoundly different effects inside and outside a cap-and-trade
scheme. Outside such a scheme, they are likely to reduce total GHG emissions. However, if
the power sector’s carbon dioxide emissions are covered by a cap-and-trade scheme (which is
the case in all of the real world schemes mentioned above), then the exact opposite holds and
total emissions are likely to increase if the intervention is ’successfull’ due to an economy-
wide rebound effect. But the interaction also works the other way round as the introduction
of a cap-and-trade scheme might strictly increase total emissions.
4Participating states RGGI: Connecticut, Delaware, Maine, Maryland, Massachusetts, New Hampshire,
New York, Rhode Island, and Vermont (http : //www.rggi.org/). US states and Canadian provinces partic-
ipating in WCI: Arizona, British Columbia, California, Manitoba, Montana, New Mexico, Ontario, Oregon,
Quebec, Utah, and Washington (http : //www.westernclimateinitiative.org).5See Qui (2013)
3

It is important to note that none of the underlying effects is caused by negative inter-
actions between public and private provision in general such as the crowding out of private
contribution by government provision (Warr 1982, Bergstrom et al. 1986) or the crowding
out of intrinsic motivation (Frey and Jegen 2001, Bowles 2008). The effects presented are
very closey tied to specific design features of cap-and-trade schemes and would be very dif-
ferent under a carbon tax. However, at least one key result can be extended substantially.
Any government intervention aimed at reducing GHG emissions overlapping with a cap-and-
trade scheme such as feed-in tariffs for renewables, minimum prices for emissions by certain
sectors within the scheme6 or bans on incandescent light bulbs7 will trigger a rebound effect
that tends to increase total GHG emissions.
2 The Model
The reason is straightforward: The binding cap on GHG emissions imposed by the tradable
permit scheme neutralises any direct effect the reduction in electricity demand by some
consumers might have. However, there are important indirect effects. The reduced demand
for electricity shifts the demand function for emission allowances or permits to the left. Given
the fixed supply, this reduces the permit price and hence reduces the total sum of money
spend on goods covered by the cap-and-trade scheme.
Moreover, how exactly cap-and-trade and green consumerism interact crucially depends
on whether or not consumers understand the basic principles of emissions trading and the
coverage of the specific scheme operating in their region.
Based on the assumption that intrinsically motivated or ’green’ citizens care about the
impact of their consumption and life-style choices on total GHG emissions,
I show that, the conversion of an emissions tax into an emission trading scheme (i.e. the
Australian case) increases demand for products from regulated sectors by green consumers,
if consumers understand the basic principles of both regulatory interventions and are aware
of their coverage. This is because they realise that consumption of these goods no longer
6The UK has introduced a minimum price on carbon dioxide emissions from electricity producers in 2013.7The European Union started to phase-out incandescent light bulbs for use in households in 2009.
4
affects total GHG emissions: they are capped after all. Whether this increases or decreases
total emissions depends on the relative prices and pollution intensities of regulated and
unregulated products. However, if the unregulated goods are sufficiently cheap/clean, then
the introduction of a sufficiently lax cap-and-trade scheme with incomplete coverage can
result in an increase in total emissions. Given that real world cap-and-trade schemes tend
to allocate emission allowances somewhat generously, this clearly is bad news.
On the other hand, I find that if consumers do not understand the implications of cap-
and-trade schemes, total emissions are higher than if they do. This result highlights the
importance of information and education making voluntary contributions effective.
Public goods are usually provided either by voluntary contributions, government inter-
ventions or both. Governments can increase the supply of public goods either directly by
providing a certain quantity or by incentivising private provision via matching or tax break
schemes. In both cases it is crucial to take the response by individuals into account as
government subsidies might crowd out private contributions (Warr 1982, Bergstrom et al.
1986) and seemingly minor differences in the design of schemes intended to stimulate private
contributions can have substantial impacts (Eckel and Grossman 2003).
Models of ’warm glow’ giving (Andreoni 1989, 1990) or of moral or intrinsic motivation
(Brekke et al. 2003) assume that people might not only care about the aggregate level of
provision but also about their individual contribution to the public good. These models
are better able to accommodate empirical findings such as a smaller crowding-out effect of
subsidies and levels of private provision that tend to be substantially larger than predicted
by models of ’pure altruism’, regardless of group size.8 Warm glows or intrinsic motivation
effectively convert a pure public good into an impure one.9
This paper is relevant for both pure and impure altruism but in the context of large
scale public goods like climate change mitigation the effects described are only of relevant
scale for intrinsically motivated agents. I investigate how a particular form of government
intervention - the introduction of a cap-and-trade scheme - impacts on the private provision
8Andreoni (1988) shows that in a model of pure altruism private contributions converge to zero in very
large groups.9For models of private provision of impure public goods see e.g. Cornes and Sandler (1984a).
5

of a public good like the reduction of greenhouse gas (GHG) emissions or the reduction
of over-fishing that are mainly affected by negative contributions. Both examples have in
common that they involve large group sizes (in terms of consumers, billions in the former and
often millions in the latter), that there is some evidence of intrinsic motivation in the form
of green consumerism and that they are frequently subject to cap-and-trade type regulation.
The EU Emission Trading System (EU ETS) is the largest cap-and-trade scheme covering
almost half of all GHG emissions in participating countries. There are currently two cap-
and-trade schemes in operation in North America: the Regional Greenhouse Gas Initiative
(RGGI) in the east of the US10 and the Western Climate Initiative (WCI) in the western
US and Canada11. While RGGI focuses on emissions from electricity production, the WCI
in addition includes other energy intensive industries and from 2015 is planned to include
transportation, residential and commercial fuel uses covering about 90% of GHG emissions
of member states. Australia will convert its recently introduced emissions tax into a cap-
and-trade scheme in 2015. Total allowable catches (TAC) and individual transferable quota
(ITQ) type regulations are cap-and-trade schemes applied to fisheries in order to reduce
over-fishing and are employed in Australia, Canada, Iceland, New Zealand, the U.S. and
other countries.
Cap-and-trade schemes have an innate feature that is of particular relevance in the con-
text of private provision of public goods. The government sets a binding upper bound on
negative contributions to the public good, parcels them into permits or quotas and allows
trading. This mechanism effectively converts a public good or externality problem into one
of cost minimisation. The immediate implication of cap-and-trade is therefore that any
marginal change in emissions by one regulated source is perfectly offset by one or more other
regulated sources. The very institution of cap-and-trade makes the aggregate cap on say
GHG emissions of regulated sources exogenous, but renders the response by other parties
participating in the scheme endogenous and perfectly predictable in the aggregate. This
10Participating states are: Connecticut, Delaware, Maine, Maryland, Massachusetts, New Hampshire, New
York, Rhode Island, and Vermont (http : //www.rggi.org/).11The WCI includes the following US states and Canadian provinces: Arizona, British Columbia, Cal-
ifornia, Manitoba, Montana, New Mexico, Ontario, Oregon, Quebec, Utah, and Washington (http :
//www.westernclimateinitiative.org).
6
holds as long as the aggregate cap is indeed binding.
Institutionalised neutralisation of marginal contributions under a cap-and-trade scheme
renders efforts to privately improve the provision of the public good futile if these contri-
butions take place within the scheme. To illustrate this point consider the replacement of
an incandescent light bulb (or any other electric appliance) with an energy-efficient one. As
all existing cap-and-trade schemes for GHG emissions include electricity generation, this re-
placement has no impact on total GHG emissions by sources within the scheme because any
emissions reduced at one source will be neutralised by a corresponding increase in emissions
elsewhere and vice versa. The neutrality of marginal contributions in cap-and-trade schemes
is well established in the analysis of regulations, e.g. to stimulate generation of renewable
energy, overlapping with a cap-and-trade scheme12 and has also been discussed in the con-
text of green consumerism (Twomey et al. 2012) but so far no formal treatment of the latter
exists.
A cap-and-trade scheme with full coverage would therefore make private contributions
to the public good via consumption or life-style choices (green consumerism) impossible.
However, none of the real world incarnations of cap-and-trade are currently anywhere near
full coverage. The EU ETS for example focuses on aviation and big stationary sources
such as electricity production and energy intensive industries. All other sectors including
road transport, agriculture and all those with a low energy intensity are not covered. They
account for more than half of GHG emissions in participating countries.
Incomplete coverage requires that intrinsically motivated citizens are aware of the neu-
tralising effect and which emissions are covered by the cap-and-trade scheme and which are
not. Otherwise they will misallocate their efforts to contribute to the public good. Consider
the example of aviation. A green consumer might opt to travel by bus instead of by plane
in order to reduce the GHG emissions of her trip. This has the desired effect if that trip
takes place in the US. However, in the EU, taking the bus is likely to increase total GHG
emissions compared to the flight.13 The simple reason being that any additional emissions
12See e.g. Requate (2009), Bohringer and Rosendahl (2010), Fischer and Preonas (2010).13Note that there are dedicated allowances for the aviation sector (so called EUAAs) that cannot be used
by stationary sources. However, airlines can use ’standard’ allowances (EUAs). Given that the aviation
sector is predicted to grow and hence to be a net buyer of allowances, marginal emissions by airlines will be
7

caused by the flight are fully neutralised (potentially even twice if the individual chooses
to buy additional offsets offered by most airlines when buying tickets) while those of a bus
journey are not.
Many recommendations by government agencies14 and NGOs15 on how to reduce one’s
carbon footprint are inappropriate in the EU and to some extent also in the other regions
of the world operating a cap-and-trade scheme. Reducing the number of flights, installing
energy efficient light bulbs and many other recommended actions have no or a much lower
direct impact on total GHG emissions and depending on the alternatives chosen might ac-
tually have increase total emissions. The same holds for carbon footprint labels like those
used by the UK Carbon Trust or calculated based on Publicly Available Specification (PAS)
2050.16 They report life-cycle emissions of products and do not differentiate between emis-
sions covered by the EU ETS and those that are not. Consumption decisions influenced by
those labels are very likely to be misguided.17 Consumers caring about either total GHG
emissions or their own contribution to total GHG emissions that understand how a cap-
and-trade scheme works only take emissions not covered by the scheme into account. They
might still have very good reasons to buy energy efficient light bulbs, but directly reducing
covered by EUAs and hence the partial separation of the two schemes is unlikely to be relevant. One caveat
is in order. While carbon dioxide emission emissions are unaffected, the fact that planes fly at high altitudes
means that there are non-carbon effects associated with emissions by planes. How much this adds to their
global warming potential, depends crucially on the time scale considered, but seems to be relatively small if
time scales of more than a hundred years are considered (Forster et al. 2006).14Examples are the ’a world you like’ campaign by the EU (http : //world −
you − like.europa.eu/en/explore/, accessed 15.01.2013) and the ’What can I
do?’ website of the UK Department of Energy & Climate Change (http :
//www.decc.gov.uk/en/content/cms/tackling/savingenergy/individual/individual.aspx, accessed
15.01.2013)15Examples include advice by the Carbon Trust’s Empower Savings Calculator (http :
//www.carbontrust.com/resources/tools/empower − savings − calculator, accessed 15.01.2013), the Na-
tional Energy Foundation (http : //www.nef.org.uk/actonCO2/ecotravelling.asp, accessed 15.01.2013) and
Climate Care (https : //www.climatecare.org/climate/low − carbon− living/, accessed 15.01.2013)16PAS 2050 can be downloaded at http : //shop.bsigroup.com/en/forms/PASs/PAS − 2050 (accessed
15.01.2013).17Perino et al. (2013) provide evidence from a field experiment that UK grocery shoppers take the UK
Carbon Trusts carbon footprint label into account.
8

GHG emissions is not one of them.18 This has absolutely nothing to do with any of its
technical characteristics but is exclusively due to the regulatory framework. Also note that
this effect does not require any preferences to change and that it is neither a response to
the public provision itself nor to the fact that emissions are priced.19 It merely assumes
that consumers understand how a cap-and-trade scheme works, i.e. that there is a cap on
regulated emissions that is unaffected by their shopping and lifestyle choices.20
This paper studies the effect of cap-and-trade schemes on private contributions in a world
were regulation is second-best due to incomplete coverage and potentially a lack of strin-
gency. Section 4 makes comparisons with taxes of the same coverage and stringency. There
is no neutralisation of marginal contributions under a tax scheme and hence no crowding out.
The level of private contributions and their distribution over sectors in the economy differs
between instruments. Heyes and Kapur (2011) have recently compared price and quantity
based regulation with altruistic agents but they focus on uniform emission standards that are
not transferable between individuals. They therefore do not capture the crowding-out effect
caused by institutionalised neutralisation which is at the heart of this paper.21 Section 5
shows that the failure to understand how a cap-and-trade scheme works or equivalently bas-
ing decisions on both regulated and unregulated emissions as recommended by government
agencies, NGOs and established carbon footprint labels is likely to increase total emissions.
3 Green consumerism and regulatory interventions
There is a large number of consumers N who derive utility from the consumption of two
private goods x and y. Emissions are caused in the production of both private goods.
18There might be indirect effects on GHG emissions, e.g. via an impact on future emission caps. But they
are likely to be small compared to the alleged direct impact.19Hence, the response by consumers is neither crowding-out in the sense of Bergstrom et al. (1986), nor
motivation crowding as in Frey and Jegen (2001), Bowles (2008) or Perino et al. (2013).20The cap is of course not truly exogenous as consumers can also influence the political process as citizens,
see e.g. Malueg and Yates (2006). This is not explicitly modelled here in order to focus on the impact of
cap-and-trade schemes on private provision of the public good and green consumerism.21There is an extensive literature comparing price and quantity based regulation including e.g Weitzman
(1974), Montero (2002), Requate and Unold (2003), Krysiak (2008).
9
α ∈ [0, 1[ is the emission intensity of good x and y causes one unit of emissions per unit of
output. Hence, x is the cleaner good.
The utility function is assumed to be
ui = v(xi, yi)−mili, (1)
where v is the utility derived from consumption (with vk > 0, vkk < 0 with k = x, y
and vxy ≥ 0) and li are the emissions of individual of type i ∈ plain, green. Own emissions
cause a disutility of mi per unit to individual of type i due to intrinsic or moral motivation,
where mi is exogenously given. N green ∈ [1, N ] consumers are intrinsically motivated or
”green” and experience a warm glow associated with their own emissions (mgreen = m > 0).
The N − N green ”plain” individuals do not experience a special disutility from emissions
(mplain = 0). For simplicity consumers are assumed to be identical in all other aspects. Note
that since I focus on green consumerism in the context of public goods like a stable climate
that involve very large groups, I refrain from modelling the direct benefits of the public good
or the ’pure altruist’ dimension as it has been labelled in the literature on giving. This is in
line with results by Andreoni (1988) showing that the Nash contribution of plain individuals
is best approximated by zero.22
The exact nature of the warm glow, namely whether the preferences are defined over
the change in aggregate emissions E caused by the individual’s purchasing decisions (net
emissions), or whether they are defined over the emissions that can be physically attributed
to the individual regardless of whether they actually add to total emissions or not (gross
emissions), is of particular concern here. Formally the two concepts can be written as
linet =∂E
∂ (αxi + yi), (2)
ligross = αxi + yi, (3)
This will be relevant in what follows as the regulatory regime might affect lnet but not
lgross. To illustrate this point consider a cap-and-trade scheme with full coverage. It would
22All results derived below also hold for consumers that only care about the total level of the public good
and do not experience a warm glow. But in the context of large scale public goods like climate stability, this
effect is negligible.
10
imply that lgross > lnet = 0 since aggregate emissions are fixed by the cap on emissions and
independent of the consumption choices of the individiual. Nevertheless, even under a cap-
and-trade scheme with full coverage, there will be emissions that are directly attributable
to the individual’s consumption choices as long as at least one good is consumed in strictly
positive quantities. The distinction between net and gross contributions has not been raised
in the original models of warm glow (Andreoni 1989, 1990). However, Crumpler and Gross-
man (2008) experimentally compare net and gross contributions (where gross contributions
have no impact on aggregate provision, like in the example with a full-coverage cap-and-
trade scheme) to show that warm glow giving might indeed be based on whether or not a
contribution has ’my name on it’ rather than it ’making a difference’. In what follows I will
discuss both cases. In the remainder of this and the next section I will assume that green
consumers care about their net emissions and in section 5 the case of preferences over gross
emissions is considered.
In the absence of any regulatory intervention to restrict pollution, the budget constraint
is given by
xi + pyi = w, (4)
where w is the consumer’s income and p the (relative) price of good y. In what follows
the focus is on cases where the budget constraint is binding for all consumers. This cannot
be taken for granted as green consumers naturally restrict consumption by internalising at
least part of the pollution externality and because α > 0 all consumption causes pollution.
The condition for consumption to be constrained by budget is vx(xgreen∗, ygreen∗)− αm > 0
where xgreen∗ and ygreen∗ are the quantities consumed by green consumers in equilibrium.
The larger m, the less likely is it that the budget constraint is binding.23
If there is no regulatory intervention to restrict emissions, the provision of the public
good relies entirely on private provision by green consumers. Demand for goods x and
y by consumer of type i = plain, green is given by maximising (1) subject to (4) and
23There might well be individuals with very high levels of intrinsic motivation for which an exogenous
budget constraint might not be binding. However, in a richer model, the budget constraint is of course
endogenous and they would hence reduce their hours worked making the budget constraint binding again.
In any case, the group of people for which this is an issue is likely to be relatively small.
11

li,unnet = li,ungross = αxi + yi. In the unregulated case there is no difference between net and gross
emissions assuming that the Nash conjecture holds and all consumers take the actions of all
others as given when making their own choice. The familiar conditions determining xi,un
and yi,un are
p =vy (xi,un, yi,un)−mi
vx (xi,un, yi,un)− αmi, (5)
w = xi,un + pyi,un, i = plain, green. (6)
Note that mplain = 0.
3.1 Cap-and-trade
While cap-and-trade schemes are in theory able to fully solve the externality problem, all real
world examples both implemented and proposed are clearly imperfect. They tend to focus on
large, stationary sources but exclude emissions from e.g. road transport and agriculture. The
EU Emission Trading System (EU ETS) for example covers about half of GHG emissions in
participating countries including large scale electricity and heat generation, energy intensive
industries like aluminium and steel production and inner-European flights. Even if the
emission cap would be second-best optimal for regulated sectors, private provision of GHG
abatement still has substantial scope to improve welfare in unregulated sectors. Moreover,
the EU ETS has been plagued by over-provision of allowances, even leading to an effective
collapse of the scheme toward the end of Phase I (2005 - 2007). The price for allowances in
the EU ETS and RGGI are currently much lower than common estimates of the social costs
of carbon emissions. One might therefore conclude that even in regulated sectors a bit of
green consumerism might do good.
However, green consumerism within sectors regulated by a cap-and-trade scheme has
no immediate impact on aggregate emissions as long as the cap is binding. Any abatement
conducted in regulated sectors has no (direct) impact on aggregate emissions. Cap-and-trade
schemes are all about allocating a given amount of emissions such as to minimise abatement
costs. The environmental impact is decided ex-ante by the stringency of the cap and all
decisions at the micro-level, whether by firms, governments or consumers, are irrelevant for
total emissions from regulated sources unless they directly affect the cap or the cap ceases
12

to be binding. Hence, when green consumers choose their consumption bundle they can
no longer take the actions of all other consumers as given, as that would conflict with the
requirement to take as given what is given (the cap on aggregate emissions in the dirty
sector). In a small group setting this would require to look at potentially complex strategic
effects, but in a large group context it seems warranted to ignore an individual’s effects on
aggregate variables - with the exception of lnet as intrinsic motivation effectively works like a
magnifying glass and introduces an asymmetry in weighing the impacts of own versus others’
actions.24
Next I formalise these features of a cap-and-trade scheme with incomplete coverage.
Partial coverage is captured by assuming that only emissions associated with the production
of good y are included in the cap-and-trade scheme. Emissions from production of x remain
unregulated. Recall that x is the cleaner good and thereby this is in line with the fact that
the EU ETS and other schemes focus on emission-intensive sectors.
The aggregate cap on emissions C is assumed to be exogenous for the purposes of the
subsequent analysis. From an individual consumers’ perspective this is clearly justified in
the short run. However, the drop in the allowance prices induced by green consumerism in
regulated sectors might trigger further reductions in the cap in future periods, but this effect
is not only hard to quantify but also orthogonal to the focus of this paper as the presence
and size of this indirect effect is likely to be independent of the direct effect on emissions
highlighted in this paper.
The inclusion of the dirty good in a cap-and-trade scheme drives a wedge between net
and gross emissions. Consumption of the dirty good by an individual now has no impact on
aggregate emissions. Net emissions are therefore
li,c&tnet = αxi, i = plain, green. (7)
It is important to note that this does not reflect a change in preferences (so-called moti-
vation crowding) or a response to the total level of public good provided. Green consumers
merely take into account the very nature of a cap-and-trade scheme which causes lnet to differ
24For a discussion of non-Nash conjectures in the early literature on private provision of public goods see
Cornes and Sandler (1984b) and Sugden (1985).
13
from lgross. The key is therefore that green consumers care about lnet rather than lgross. The
value of mgreen is assumed to remain unaffected by both presence and type of the policy
intervention. Experimental evidence suggests that motivation crowding might indeed be an
issue when a price on emissions is introduced even if this only induces a small price change
in consumption goods (Perino et al. 2013). However, I am not aware of a clear conjecture or
evidence that this crowding effect would differ depending on whether the price on emissions
originates from an emission tax or a tradable permit scheme. Without such an instrument
specific effect, all results are robust to the consideration of changes in mgreen as long as it
remains strictly positive.
If the cap is binding, emission allowances are traded at a positive price γ. The budget
constraint becomes
xi + (p+ γ)yi = w, i = plain, green (8)
The permit constraint is
(N −N green)yplain +N greenygreen ≤ C, (9)
and attention is restricted to cases where (9) is binding.
Demand for goods x and y by consumer of type i = plain, green is given by maximising
(1) subject to (7) - (9). The conditions determining xi,c&t and yi,c&t under cap-and-trade are
p+ γ =vy(xi,c&t, yi,c&t
)vx (xi,c&t, yi,c&t)− αmi
, (10)
w = xi,c&t + (p+ γ)yi,c&t, i = plain, green (11)
C ≥ (N −N green)yplain,c&t +N greenygreen,c&t, (12)
which is a system of five equations and five unknowns. Note that again mplain = 0.
3.2 Emissions taxes
A second instrument available to reduce GHG emissions is a carbon tax. Australia has
recently introduced a tax on carbon emissions (which will be converted into a cap-and-trade
scheme in 2015), Germany taxes petrol and to some extent electricity based on associated
14
GHG emissions and in April 2013 the UK imposed a tax (binding price floor) of GBP 16 per
ton of CO2 (scheduled to rise to GBP 30 in 2020 and GBP 70 in 2030) on GHG emissions in
electricity production. Again, coverage of these schemes is limited and the appropriateness of
their stringency debatable. By and large emission taxes suffer from the same imperfections in
implementation as cap-and-trade schemes as they can only cover emissions that can be easily
measured and verified. However, in contrast to cap-and-trade schemes, taxes do not pre-
determine aggregate emissions in regulated sectors but set a pre-determined price for a unit
of emissions instead. Hence, green consumerism affects aggregate emissions in the standard
way so that li,taxnet = li,taxgross = αxi+yi. The consumer’s budget constraint is xi+(p+γ)yi = w,
i.e. the same as with a cap-and-trade scheme, where γ is now the tax rate.
Demand for goods x and y by consumers of type i = plain, green under taxes is given
by the following conditions
p+ γ =vy (xi,tax, yi,tax)−mi
vx (xi,tax, yi,tax)− αmi, (13)
w = xi,tax + (p+ γ)yi,tax, i = plain, green. (14)
Note that mplain = 0. There are two differences between the conditions under taxes and
permits. The first is that in (13) but not in (10) green consumerism is relevant for good y.
The second difference is the permit constraint (12) which is only relevant in the cap-and-
trade scheme, as the price of emissions is set exogenously under an emissions tax. In the
tax case consumption choices by individual consumers are independent of each other as they
are only linked through prices which here are treated as exogenous. In the cap-and-trade
scheme, however, the permit constraint reflects the neutralising aspect of this regulatory
approach directly linking choices by individuals.
4 Comparison of instruments
This section compares consumption and emission levels under cap-and-trade to those under
an emissions tax. For that purpose the emissions tax is set equal to the equilibrium price of
permits. This makes sure that consumers face the same set of prices and that any difference
can be attributed to the impact of the cap-and-trade scheme on private provision of the public
15

good by green consumers. Plain consumers’ consumption choices are the same under both
instruments as they only care about relative prices which by assumption are held constant.
The difference in consumption levels for green consumers is driven by them caring about
the impact of their consumption choices on total emissions and the fact that consumption
of good y is emission-neutral under a cap-and-trade scheme but not under an emissions
tax. This is reflected by the absence of m in the numerator of (10) while m appears in the
numerator of (13). Since vxx < 0, vyy < 0 and m > 0 it follows that
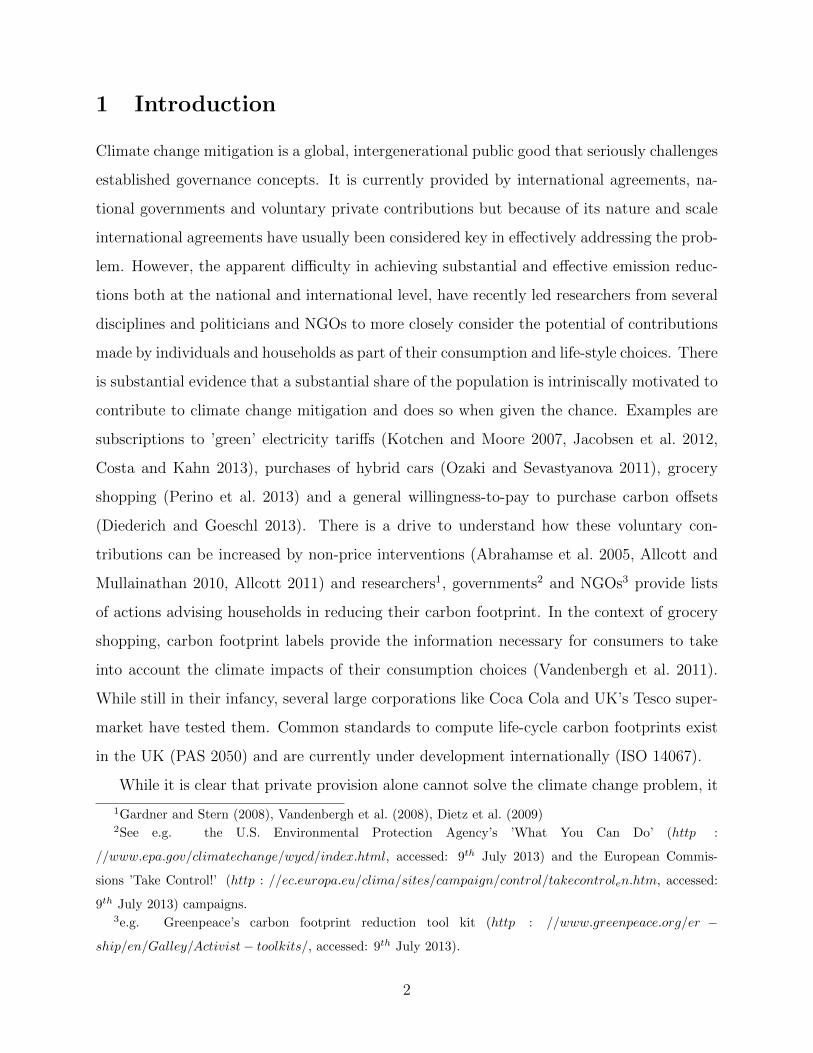
Proposition 1 (Demand by green consumers) Green consumers consume less of the rel-
atively clean good, i.e. xgreen,c&t(γ) < xgreen,tax(γ), and more of the relatively dirty good,
i.e. ygreen,c&t(γ) > ygreen,tax(γ), under a cap-and-trade scheme than under an emissions tax.
This holds for all γ > 0 and hence for all levels of the aggregate cap on emissions C.
The proof is given in the appendix. Figure 1 illustrates Proposition 1. Consumption
by green consumers under a cap-and-trade scheme is given by black lines. Consumption by
green consumers under an emissions tax are represented by grey lines.
Note that Figure 1 is drawn in a way that the equilibrium permit price approaches zero
at the right end of each panel and is strictly positive and strictly increasing as one moves
towards the left. Consumption under taxes converges to the unregulated level (shown as a
horizontal grey dashed line) when the price of emissions approaches zero. This can be easily
verfied by comparing conditions (5) - (6) and (13) - (14).
In contrast, under a cap-and-trade scheme only the budget constraint converges towards
the one in the unregulated case. An individual’s emissions in sector y are still fully neutralised
and hence green consumers ignore them in their consumption choices, affecting how they
value the dirty good at the margin. As derived above demand for the dirty good by green
consumers y is higher under cap-and-trade than under an equivalent emissions tax. This
implies that
Proposition 2 (Permit price with cap at unregulated level) The permit price is strictly
positive when the cap imposed on the dirty sector is equal to unregulated emissions in that
sector.
16

The proof is given in the appendix but the intuition for this result is straightforward.
Because private provision of reduction of greenhouse gas emissions is crowded-out by a cap-
and-trade scheme in the regulated sector, the demand for dirty goods increases when such
a scheme is introduced (Proposition 1). With an emission cap at the unregulated level of
emissions (represented by 1.0 on the horizontal axis in Figure 1), the permit constraint
is binding because the demand curve for dirty goods y has been shifted upwards by the
introduction of a cap-and-trade scheme. Permits are hence a scarce resource with a strictly
positive value. The permit price drops to zero only when the cap on emissions exceeds the
unregulated level significantly.
Figure 1: Consumption of goods x (left panel) and y (right panel) by green consumers as a
function of the stringency of the cap-and-trade scheme.
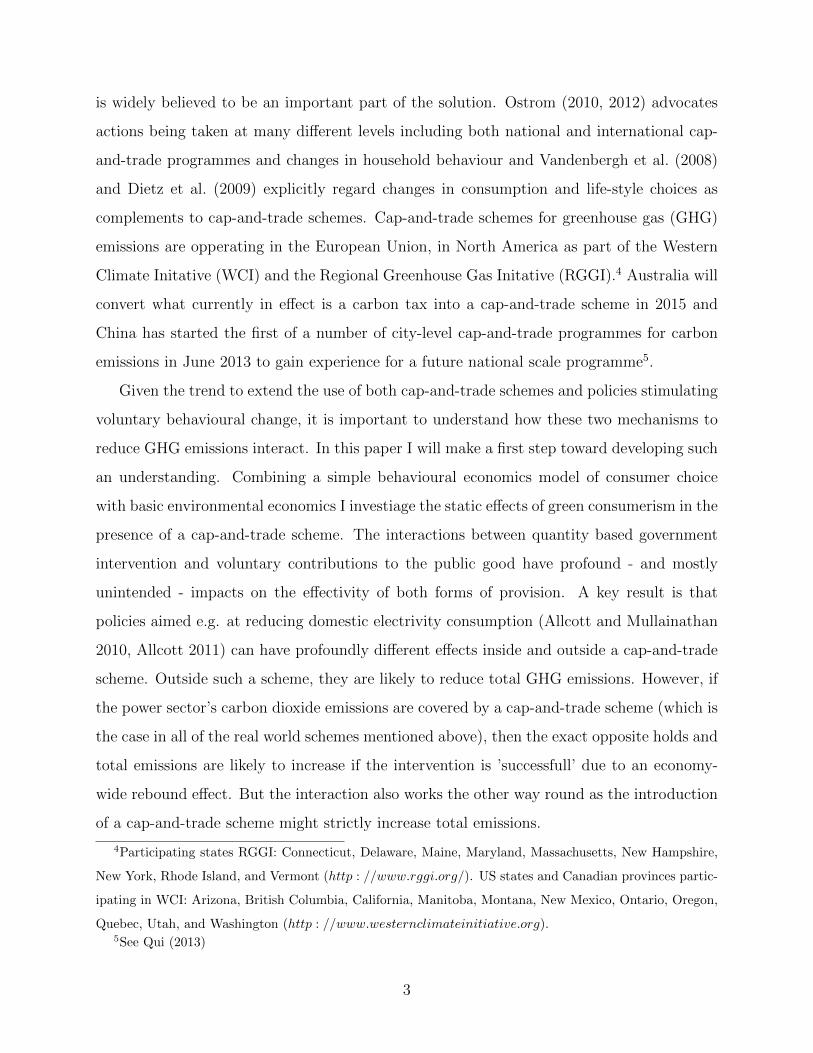
The neutralisation of private contributions to the public good also affects the aggregate
level of emissions (see Figure 2). To highlight this I focus again on the case where the
price of emissions converges to zero. All equilibrium conditions and hence consumption
choices and emissions under a tax converge to that without regulation. Under a cap-and-
trade scheme, the budget constraint again converges to the unregulated case, but green (not
plain) consumers choose a different point (one with a higher y and a lower x) on the budget
line as they no longer experience a warm glow by reducing emissions associated with y (see
Proposition 1). Such a movement along a given budget line implies that
17

Proposition 3 (Total emissions) Total emissions are higher under a cap-and-trade scheme
than under an emission tax (or in the absence of regulation) if the price of emissions is close
to zero and if the dirty good is sufficiently cheap (p < 1α> 1).
The proof is given in the appendix.
Figure 2: Total emissions as a function of the stringency of the cap-and-trade scheme.
The neutralisation of individual efforts to contribute to the provision of the public good
in a cap-and-trade scheme is of particular relevance if the permit price is very low. This
currently is the case in the EU ETS with the price per ton falling below 4 EUR in January
2013. In such a case total emissions potentially are higher than in the absence of any
regulation.
5 Consumers caring about gross contribution
Now let us briefly consider what happens if green consumers base decisions on their gross
rather than their net contribution and the dirty sector is again regulated by a cap-and-trade
scheme.25 Gross emissions lgross include all emissions physically associated with consumption
25Recall that under an emissions tax there is no difference between net and gross emissions and hence
behaviour is not affected by this distinction.
18
ignoring neutralisation occurring within a cap-and-trade scheme. This is the case if they care
about their net contribution but are unaware - as is arguably the case at the moment for
a substantial share of consumers - that consumption choices within cap-and-trade sectors
are emission-neutral at least as far as direct effects are concerned. Alternatively, consumers
might fully understand the regulatory framework, but their preferences are defined over full
carbon footprints of their consumption choices rather than the actual change in total GHG
emissions.26 In both cases they effectively follow advise by governments and NGOs on how
to reduce carbon footprints and in their shopping choices consider carbon footprint labels
based on life-cycle GHG emissions (such as those based on PAS 2050 and used by the UK
supermarket chain Tesco and Coca-Cola).
The equilibrium conditions are hence
p+ γ =vy(xi,c&t, yi,c&t
)−mi
vx (xi,c&t, yi,c&t)− αmi, (15)
w = xi,c&t + (p+ γ)yi,c&t, i = plain, green (16)
C ≥ (N −N green)yplain,c&t +N greenygreen,c&t, (17)
which are equivalent to the conditions under cap-and-trade when consumers care about
net emissions with the important exception that here (10) is replaced by (13). This has
a number of implications. The first is that the permit price is zero at a cap equal to the
unregulated level of emissions. Hence, Proposition 2 does not carry over to the case where
green consumers base their consumption choices on gross rather than net emissions. The
black dashed lines in Figure 1 both stop at 1.0 and quantities consumed coincide with the
unregulated levels as at this point the cap-and-trade scheme has neither an impact on how
consumers trade-off goods nor on the budget constraint. It is also straightforward to show
that consumption by green consumers of the dirtier (cleaner) good is decreasing (increasing)
in the m in the numerator of (15) while holding the m in the denominator constant. Hence,
green consumers buy more of the cleaner good if they base their consumption choices on gross
rather than net contributions under a cap-and-trade scheme. By doing this they increase
their unregulated emissions, and decrease their demand for regulated emissions - inducing
26Crumpler and Grossman (2008) provide experimental evidence that this might be the case in the context
of giving to a charity.
19

plain consumers to buy more of the dirty good as the price of emissions is lower.
Proposition 4 (Emissions when consumers consider gross contributions) If green consumers
take their gross emissions rather than only those outside a cap-and-trade scheme into account
total emissions increase compared to the case where they only consider their net emissions.
This only ceases to hold if:
• total emissions in the net emission scenario are at or above those in the unregulated
case (see Proposition 3). This implies that the permit constraint exceeds the level of
unregulated emissions in the dirty sector and the cap is therefore not binding in the
gross emission scenario, or
• the unregulated sector x is perfectly clean (α = 0) and coverage of the cap-and-trade
scheme therefore complete.
The proof is given in the appendix. Figure 2 illustrates the increase in total emissions.
One qualification is in order. The strong result that emissions always strictly increase
when consumers base decisions on gross emissions does not necessarily carry over to situations
where there are more than two goods. For example, if there are several goods covered by
the cap-and-trade scheme with different emission intensities consumers considering gross
emissions might substitute the one with the lower emission intensity for the one with the
higher one. As emissions from both goods are neutralised with in the cap-and-trade scheme,
such a switch does not affect total emissions. In the current model the result is driven by a
negative correlation between the gross emissions of a product and its net emissions. Overall
this is likely to hold for real world cap-and-trade schemes as they tend to focus on energy
intensive industries. It is therefore not only possible but likely that considering gross instead
of net emissions on average results in an increase of total emissions.
The comparison between a tax and a cap-and-trade scheme when consumers base their
decisions on gross emissions is straightforward: they are equivalent. Both budget constraints
and how consumers value the goods at the margin are the same under the two types of
regulation. This again hinges on the assumption that the emission tax rate equals the
equilibrium permits price. Note that since the latter is reduced compared to the case where
20

consumers consider net emissions, the curves representing consumption by green consumers
and total emissions under a tax in Figures 1 and 2 respectively, changes as well and coincides
with the corresponding curves for cap-and-trade. This also implies that if consumers base
their decisions on gross emissions, the choice of instrument has no impact on private provision
of the public good.
Cap-and-trade schemes reduce private efforts of GHG control when green consumers
realise that emissions caused in regulated sectors are fully neutralised. This results in higher
aggregate emissions than under an equivalent tax if the dirtier good is sufficiently cheap
and the cap on dirty sector emissions sufficiently lenient. However, if green consumers
are oblivious to or disregard the offsetting effects of the cap-and-trade scheme aggregate
emissions are higher than if they base decisions on net emissions whenever the cap is binding
in both scenarios. Emissions in this case are higher than when they only consider net
emissions because green consumers misallocate their restraint between sectors and cause too
many unregulated emissions which in contrast to regulated emissions are not neutralised.
6 Conclusions
Cap-and-trade schemes fundamentally change how an individual can affect aggregate provi-
sion of a public good. By imposing a binding upper bound on e.g. emissions and allowing
trading, it is no longer consistent to believe that one’s own decisions will not affect emis-
sions by others. Cap-and-trade schemes institutionalise perfect neutralisation of marginal
contributions made in the sectors covered by the scheme. Someone caring either about the
total level of the public good (pure altruism) or her individual contribution to the total level
(impure altruism) should therefore disregard any contribution made within a cap-and-trade
scheme. A cap-and-trade scheme fully crowds out voluntary contribution within the system.
The EU Emission Trading System (EU ETS) is the most prominent - but by no means the
only - example of a cap-and-trade scheme. Carbon footprint labels such as those calculated
based on PAS 2050 that include both regulated and unregulated emissions are misleading
for consumers that care about the impact of their consumption choices on total emissions in
the current period. Green consumers that base their consumption decisions on these labels
21

unwittingly emit more than if they would only consider emissions not covered by the EU
ETS. The same holds for following advise by both governments and environmental NGOs
on how to reduce carbon footprints as they so far do not differentiate between emissions
occurring within or outside cap-and-trade systems.
With a cap-and-trade scheme in place, green consumers are left with three options to
reduce total GHG emissions. First, they can reduce emissions not captured by the scheme,
e.g. by driving less or by eating less red meat. Second, they can influence the political
process via voting and lobbying to reduce the cap on regulated emissions. Third, they can
buy allowances (or other types of offsets) and retire them and thereby have a direct impact
on total GHG emissions.27
But it is not only green consumers that are vulnerable to failing to understand the full
implications of a cap-and-trade scheme. The European Commission - the same institution
that governs the EU ETS - claims that its recent ban of incandescent light bulbs ”will reduce
emissions of carbon dioxide by 15 million tons each year.”28 This is wrong. Any emissions
saved in electricity production will be emitted by another sector participating in the EU
ETS - or the electricity will be used to do other things.
It is important to note that the neutralisation of abatement efforts within a cap-and-
trade scheme does not preclude the presence of positive indirect or long-term effects on total
emissions. It might be argued that any voluntary abatement or restraint reduces the permit
price which might make future reductions in the cap politically more feasible. At the same
time consumption and life-style choices might help to change habits and social norms that
in the long-run make it easier to achieve more ambitious environmental targets. This paper
merely points out some of the short-run costs (e.g. in terms of increased aggregate emissions)
these strategies might have.
27Malueg and Yates (2006) compare lobbying and retiring of permits by consumers. Citizen involment in
permit markets is also studied by Ahlheim and Schneider (2002) and Eshel and Sexton (2009). For models
of demand for offsets in the presence of impure public goods see Kotchen (2005, 2006, 2009). Within the EU
ETS retiring of emission allowances is offered e.g. by the charity Sandbag.org (www.sandbag.org.uk). The
RGGI features a formal retiring scheme for allowances to create a direct impact on total emissions when
consumers switch to electricity produced by renewable sources. See also Twomey et al. (2012).28http : //ec.europa.eu/news/energy/090901en.htm, accessed on 15.01.2013.
22

The ineffectiveness of both private efforts and supplementary policies to reduce GHG
emissions within a cap-and-trade scheme are of particular relevance when the price for emis-
sion allowances is much lower than estimates of the marginal damages caused by these
emissions. Arguably this is currently the case in both the EU ETS and the RGGI. EU ETS
emission allowances were traded at about 4 EUR per metric ton in early 2013 while RGGI
allowances were auctioned off at just below 2 USD per short ton in December 2012. Both
are only a fraction of the estimated social costs of CO2 emissions. This is problematic for
two reasons: Firstly, as shown above, very low permit prices risk increasing total emissions
compared to no regulation. Secondly, low prices indicate that the cap on emissions is too lax.
Additional reduction efforts by consumers and governments have the potential to increase
social welfare. Them not being effective is therefore more of a tragedy when a cap-and-
trade scheme is too lax compared to a situation when it fully internalises the social costs of
emissions in the sectors covered, i.e. is second-best.
It is interesting to note that green consumerism is rendered partially ineffective in exactly
those regions of the world where it is most prevalent: Canada, Europe, and the East and West
coast of the US - with Australia to follow in 2015. The relatively strong representation of
environmental preferences in the political sphere has - by the choice of regulatory instrument
- substantially limited how these same preferences can impact in market settings.
The effects identified here are not limited to the particular way private contributions are
modelled. Using alternative specifications like reciprocity (Sugden 1984) would have very
similar effects. Reciprocity is impossible within a cap-and-trade system, unless voluntary
sacrifices are so large as to render the cap non-binding. But this is also true under the
specification used in this paper.
References
Abrahamse, W., Steg, L., Vlek, C. and Rothengatter, T.: 2005, A review of intervention studies
aimed at household energy conservation, Journal of Environmental Psychology 25, 273–291.
Ahlheim, M. and Schneider, F.: 2002, Allowing for household preferences in emission trading,
Environmental and Resource Economics 21, 317–342.
23

Allcott, H.: 2011, Social norms and energy conservation, Journal of Public Economics 95, 1082–
1095.
Allcott, H. and Mullainathan, S.: 2010, Behavior and energy policy, Science 327(5 March
2010), 1204–1205.
Andreoni, J.: 1988, Privately provided public goods in a large economy: The limits of altruism,
Journal of Public Economics 35, 57–73.
Andreoni, J.: 1989, Giving with impure altruism: Applications to charity and ricardian equivalence,
Journal of Political Economy 97(6), 1447–1458.
Andreoni, J.: 1990, Impure altruism and donations to public-goods: A theory of warm-glow giving,
Economic Journal 100(401), 464–477.
Bergstrom, T., Blume, L. and Varian, H.: 1986, On the private provision of public goods, Journal
of Public Economics 29(1), 25–49.
Bohringer, C. and Rosendahl, K. E.: 2010, Green promotes the dirtiest: on the interaction between
black and green quotas in energy markets, Journal of Regulatory Economics 37, 316–325.
Bowles, S.: 2008, Policies designed for self-interested citizens may undermine ”the moral senti-
ments”: Evidence from ecconomic experiments, Science 320, 1605–1609.
Brekke, K. A., Kverndokk, S. and Nyborg, K.: 2003, An economic model of moral motivation,
Journal of Public Economics 87, 1967–1983.
Cornes, R. and Sandler, T.: 1984a, Easy riders, joint production, and public goods, Economic
Journal 94, 580–598.
Cornes, R. and Sandler, T.: 1984b, The theory of public goods: Non-Nash behaviour, Journal of
Public Economics 23, 367–379.
Costa, D. L. and Kahn, M. E.: 2013, Energy conservation ”nudges” and environmentalist ideology:
evidence from a randomized residential electricity field experiment, Journal of the European
Economic Association 11(3), 680–702.
Crumpler, H. and Grossman, P. J.: 2008, An experimental test of warm glow giving, Journal of
Public Economics 92, 1011–1021.
24

Diederich, J. and Goeschl, T.: 2013, Willingness to pay for voluntary climate action and
its determinants: Field-experimental evidence, Environmental and Resource Economics DOI
10.1007/s10640-013-9686-3.
Dietz, T., Gardner, G. T., Gilligan, J., Stern, P. C. and Vandenbergh, M. P.: 2009, Household
actions can provide a behavioral wedge to rapidly reduce us carbon emissions, Proceedings of the
National Academy of Sciences 106(44), 18452–18456.
Eckel, C. C. and Grossman, P. J.: 2003, Rebate versus matching: does how we subsidize charitable
contributions matter?, Journal of Public Economics 87, 681–701.
Eshel, D. and Sexton, J.: 2009, Allowing communities to trade in imperfectly competitive pollution-
permit markets, Journal of Regulatory Economics 36, 60–82.
Fischer, C. and Preonas, L.: 2010, Combining policies for renewable energy: Is the whole less than
the sum of its parts?, International Review of Environmental and Resource Economics 4, 51–92.
Forster, P. M. d. F., Shine, K. P. and Stuber, N.: 2006, Is it premature to include non-CO2 effects
of aviation in emission trading schemes, Atmospheric Environment 40, 1117–1121.
Frey, B. S. and Jegen, R.: 2001, Motivation crowding theory, Journal of Economic Surveys
15(5), 589–611.
Gardner, G. T. and Stern, P. C.: 2008, The short list: The most effective actions u.s. households
can take to curb climate change, Environment September/October.
Heyes, A. and Kapur, S.: 2011, Regulating altruistic agents, Canadian Journal of Economics
44(1), 227–246.
Jacobsen, G. D., Kotchen, M. J. and Vandenbergh, M. P.: 2012, The behavioral response to vol-
untary provision of an environmental public good: Evidence from residential electricity demand,
European Economic Review 56, 946–960.
Kotchen, M.: 2005, Impure public goods and the comparative statics of environmentally friendly
consumption, Journal of Environmental Economics and Management 49, 281–300.
Kotchen, M. J.: 2006, Green markets and private provision of public goods, Journal of Political
Economy 114(4), 816–834.
25

Kotchen, M. J.: 2009, Voluntary provision of public goods for bads: A theory of environmental
offsets, Economic Journal 119, 883–899.
Kotchen, M. J. and Moore, M. R.: 2007, Private provision of environmental public goods: House-
hold participation in green-electricity programs, Journal of Environmental Economics and Man-
agement 53(1), 1–16.
Krysiak, F. C.: 2008, Prices vs. quantities: The effects on technology choice, Journal of Public
Economics 92(5-6), 1275–1287.
Malueg, D. and Yates, A.: 2006, Citizen participation in pollution permit markets, Journal of
Environmental Economics and Management 51, 205–217.
Montero, J.-P.: 2002, Prices versus quantities with incomplete enforcement, Journal of Public
Economics 85, 435–454.
Ostrom, E.: 2010, Polycentric systems for coping with collective action and global environmental
change, Global Environmental Change 20, 550–557.
Ostrom, E.: 2012, Nested externalities and polycentric institutions: must we wait for global solu-
tions to climate change before taking actions at other scales?, Economic Theory 49, 353–369.
Ozaki, R. and Sevastyanova, K.: 2011, Going hybrid: An analysis of consumer purchase motiva-
tions, Energy Policy 39(5), 2217–2227.
Perino, G., Panzone, L. A. and Swanson, T.: 2013, Motivation crowding in real consumption
decisions: Who is messing with my groceries?, Economic Inquiry DOI: 10.1111/ecin.12024.
Qui, J.: 2013, China gets tough on carbon, Nature 498(13 June 2013), 145–146.
Requate, T.: 2009, Zauberformel ”Innovation”, Jahrbuch fur okologische Okonomik 6, 283–316.
Requate, T. and Unold, W.: 2003, Environmental policy incentives to adopt advanced abatement
technology: Will the true ranking please stand up?, European Economic Review 47, 125–146.
Sugden, R.: 1984, Reciprocity: The supply of public goods through voluntary contributions, Eco-
nomic Journal 94, 772–787.
26

Sugden, R.: 1985, Consistent conjectures and voluntary contributions to public goods: Why the
conventional theory does not work, Journal of Public Economics 27, 117–124.
Twomey, P., Betz, R. and MacGill, I.: 2012, Achieving additional emission reductions under a
cap-and-trade scheme, Climate Policy 12(4), 424–439.
Vandenbergh, M. P., Barkenbus, J. and Gilligan, J.: 2008, Individual carbon emissions: the low-
hanging fruit, UCLA Law Review 55, 1701–1758.
Vandenbergh, M. P., Dietz, T. and Stern, P. C. a.: 2011, Time to try carbon labelling, Nature
Climate Change 1(April 2011), 4–6.
Warr, P. G.: 1982, Pareto optimal redistribution and private charity, Journal of Public Economics
19, 131–138.
Weitzman, M. L.: 1974, Prices vs. quantities, Review of Economic Studies 41(4), 477–491.
A Appendix
A.1 Proof of Proposition 1
The equilibrium conditions for the emissions tax (13) and (14) consist of two 2x2 systems of
equations. One for plain and one for green consumers with no interaction between them, because
all prices are fixed. To allow comparison between the two regulatory schemes the price for emissions
is assumed to be the equilibrium permit price under the cap-and-trade scheme. Note that the
conditions for plain consumers is the same as those under a cap-and-trade scheme. Hence the
equilibrium quantities are the same under a tax and cap-and-trade if all prices are the same. For
green consumers the budget constraint remains unaltered but the marginal rate of substitution has
changed due as emissions of the dirty good were not considered under cap-and-trade but have a
internalised marginal cost m under an emissions tax. The equilibrium quantities under tradable
permits hence do not satisfy (13) and (14) for green consumers. Rewriting the two conditions by
adding an exogenous parameter ρ in front of the m in the numerator one obtains a generalised
version that contains both the cap-and-trade conditions (ρ = 0) and those for the emissions tax
27

(ρ = 1).
p+ γ =vy − ρmi
vx − αmi, (A.1)
w = xi + (p+ γ)yi, i = plain, green. (A.2)
Using the implicit function theorem and Cramer’s rule it is straightforward to show that
∂xgreen
∂ρ= − m(p+ γ)
(p+ γ)2vxx − 2(p+ γ)vxy + vyy> 0 (A.3)
∂ygreen
∂ρ=
m
(p+ γ)2vxx − 2(p+ γ)vxy + vyy< 0 (A.4)
Hence xgreen,c&t(γ) < xgreen,tax(γ) and ygreen,c&t(γ) > ygreen,tax(γ).
A.2 Proof of Proposition 2
If the price of emissions approaches zero (from above) the equilibrium conditions under a tax (13)
and (14) and the unregulated case (5) and (6) converge. Hence quantities consumed and sector
emissions converge as well. Using Proposition 1 shows that as the permit price converges to zero,
the total quantity consumed of the dirty good and hence dirty sector emissions are always strictly
higher under a cap-and-trade scheme than under a tax. The price for permits is therefore strictly
positive at the unregulated level of dirty sector emissions and drops to zero only at a cap strictly
above the unregulated level of dirty sector emissions.
A.3 Proof of Proposition 3
Moving along the budget constraint requires that ∂x∂y = −(p+γ). The effect on individual emissions
e are ∂e∂y = α∂x∂y + 1 = 1− α(p+ γ). With γ approaching zero this is positive if p < 1
α ≥ 1.
A.4 Proof of Proposition 4
To assess the impact on emissions when green consumers care about gross contributions in a cap-
and-trade scheme we re-write the system (10) - (12) by again adding the parameter ρ. This is
different from the proof for Proposition 1 as we are looking now at the 5x5 cap-and-trade system
of equations and not at the 2x2 tax one.
p+ γ =vgreeny − ρmvgreenx − αm
, (A.5)
28
p+ γ =vplainy
vplainx
, (A.6)
w = xgreen + (p+ γ)ygreen, (A.7)
w = xplain + (p+ γ)yplain, (A.8)
C ≥ (N −Ngreen)yplain +Ngreenygreen, (A.9)
where vij = vj(xi, yi) and vijk = vjk(x
i, yi) with j, k ∈ x, y and i ∈ plain, green. Using the
implicit function theorem, Cramer’s rule and the fact that emissions in the dirty sector are capped
at C the effect of a change in ρ on total emissions E is
∂E
∂ρ= α
[∂xplain
∂ρ+∂xgreen
∂ρ
]
= αm(p+ γ)AplainC −Ngreen[(p+ γ)ygreen + yplain]Bplain − (p+ γ)(N − 2Ngreen)vplainx
Ω(A.10)
where Ω = −(N − Ngreen)Bgreen[vplainx − Aplainyplain] + Ngreen(vgreenx − αm)[(p + γ)Aplain −
Bplain] + Agreen[BplainygreenNgreen + (p + γ)[vplainx (N − Ngreen) − Aplain[(N − Ngreen)yplain +
Ngreenygreen]]] < 0, Ai = (p + γ)vixx − vixy < 0 and Bi = (p + γ)vixy − viyy > 0. If Ngreen ≤ 0.5N
then (A.10) is strictly positive. If Ngreen > 0.5N then the last term in the nominator of (A.10)
becomes positive and the sign of the entire expression potentially ambiguous. The conditions for
the nominator to be strictly positive are
Ngreen >(p+ γ)vplainx − (p+ γ)AplainC
2(p+ γ)vplainx − [(p+ γ)ygreen + yplain]Bplain>
1
2(A.11)
or
Ngreen <(p+ γ)vplainx − (p+ γ)AplainC
2(p+ γ)vplainx − [(p+ γ)ygreen + yplain]Bplain< 0 (A.12)
The latter is irrelevant since Ngreen ≥ 0. We therefore check the sign for the extreme case when
Ngreen = 1, i.e. all consumers are green. In this case the system (A.5) - (A.9) collapses to
p+ γ =vgreeny − ρmvgreenx − αm
, (A.13)
w = xgreen + (p+ γ)ygreen, (A.14)
C ≥ ygreen, (A.15)
which yields ygreen = C, xgreen = w−(p+γ)C and γ implicitly defined by p+γ =vy(w−(p+γ)C,C)−ρmvx(w−(p+γ)C,C)−αm .
Differentiating the latter w.r.t. γ and ρ yields
dγ
dρ= − m
vxyC + vx − αm− C(p+ γ)vxx< 0. (A.16)
29

Hence, for Ngreen = N it holds that
∂E
∂ρ= α
∂x
∂ρ= α
∂x
∂γ
∂γ
∂ρ= α
Cm
vxyC + vx − αm− C(p+ γ)vxx≥ 0. (A.17)
The expression in (A.10) is therefore always positive (strictly if α > 0) and total emissions
higher when green consumers are unaware of or ignore the neutralisation induced by a cap-and-
trade scheme if production of x is not perfectly clean α > 0.
The above requires that the cap on emissions in the dirty sector is binding in both scenarios.
This is not the case if the cap exceeds emissions in the dirty sector in the unregulated case.
Aggregate emissions are still increasing in ρ as long as total emissions in the net emission scenario
do not exceed total emissions without regulation. Proposition 3 shows that this can indeed happen
if the cap is sufficiently lenient and the dirty good sufficiently cheap.
30