private provision of environmental public goods · private provision of environmental public ......
TRANSCRIPT

Private Provision of Environmental Public Goods:Household Participation in Green-Electricity Programs*
By
Matthew J. Kotcheny
Department of EconomicsWilliams College
and
Michael R. MooreSchool of Natural Resources & Environment
University of Michigan
August 10, 2004
� We gratefully acknowledge �nancial support from the United States Environmental ProtectionAgency and the Michigan Department of Environmental Quality. We thank Rich Bishop for helpfulcomments on an earlier draft of the paper. We also thank Ruth Seleske, Elvana Hammoud, andNorm Stevens of Detroit Edison for information on the SolarCurrents program; and Je¤rey Feldtand Tim Arends of Traverse City Light & Power for information on the Green Rate program.
y Corresponding author: Department of Economics, Williams College, Williamstown, MA 01267;Email: [email protected]; Telephone (413) 597-2101; Fax (413) 597-4045.

Private Provision of Environmental Public Goods:Household Participation in Green-Electricity Programs
Abstract
Green-electricity programs provide an opportunity to study private provision of public goodsin a �eld setting. The �rst part of this paper develops a theoretical framework to analyzehousehold decisions about voluntary participation in green-electricity programs. We con-sider di¤erent participation mechanisms and show how they relate to existing theory oneither pure or impure public goods. The models are used to examine the implications ofparticipation mechanisms for the level of public-good provision. The second part of thepaper provides an empirical investigation of actual participation decisions in two green-electricity programs� one based on a pure public good and the other based on an impurepublic good. The data come from original household surveys of participants and nonpar-ticipants in both programs, along with utility data on household electricity consumption.The econometric results are interpreted in the context of the theoretical models and arecompared to other studies of privately provided public goods.
JEL Classi�cation Numbers: H41, Q42.
Keywords: Pure and impure public goods; private provision; green electricity.

1 Introduction
The option to purchase �green�electricity is increasingly available to households across the
United States. Green electricity is electricity generated from renewable sources of energy�
such as solar, wind, geothermal, and biomass� and it is distinguished from conventionally
generated electricity by its relatively low (or nonexistent) pollution emissions. Typically,
green electricity is marketed at prices ranging from 10 to 30 percent above the price of
conventional electricity. In states with regulated electricity markets, electric utilities are
developing green-electricity programs as a distinct supply option that households can vol-
untarily choose; more than 350 utilities have implemented such green-electricity programs.
In states with deregulated electricity markets, suppliers of green electricity are competing
with suppliers of conventional electricity; there are 29 green-electricity suppliers currently
competing in 8 states.1
Two primary mechanisms are available for households to participate in green-electricity
programs. Some programs are based on a voluntary contribution mechanism (VCM),
whereby households simply donate money to support the capacity for generating green
electricity. Such contribution-based programs are structured so that payments for green
electricity are independent of a household�s electricity consumption. Other programs, in
contrast, link payments for green electricity with household electricity consumption. Pro-
grams of this type are structured so that payments for green electricity are based on a green
tari¤ mechanism (GTM), whereby households must pay a �xed tari¤ per kilowatt-hour of
consumption. In some cases the tari¤ must apply to 100 percent of the household�s con-
sumption, while in other cases the tari¤ need only apply to a proportion of consumption
that the household chooses.
The �rst part of this paper develops a theoretical framework to analyze household de-
cisions about participation in green-electricity programs. We consider programs of both
types, VCMs and GTMs. The theory begins with recognition that participants in green-
electricity programs provide an environmental public good. Because increased production
1The basic facts reported here are taken from Bird and Swezey (2003). The information is periodicallyupdated by the National Renewable Energy Laboratory of the U.S. Department of Energy and is availableonline at http://www.eere.energy.gov/greenpower.
1

of green electricity implies a reduction in demand for conventional electricity, participants in
green-electricity programs are responsible for a reduction in pollution emissions� a public
good. There is, however, an important distinction between programs based on VCMs or
GTMs. As we will show, the former are consistent with theory on private provision of a
pure public good (Bergstrom, Blume, and Varian, 1986; Andreoni, 1988), while the latter
are consistent with theory on private provision of an impure public good (Cornes and San-
dler, 1984, 1994). We consider this distinction explicitly in the theoretical analysis, and we
examine its implications for program participation and the level of public-good provision.
The second part of the paper provides an empirical investigation of actual participation
decisions in two di¤erent green-electricity programs. One program, Detroit Edision�s �So-
larCurrents,�is based on a VCM. Participating households choose to lease 100-watt blocks
of solar generation capacity at a centralized facility. Each block costs $6.59 per month, and
households can choose to lease any number of blocks. The other program, Traverse City
Light & Power�s �Green Rate,� is based on an all-or-nothing GTM. Participating house-
holds must agree to pay a premium of 1.58 cents per kilowatt-hour for 100 percent of their
household�s electricity consumption. Revenues are then used to �nance capacity at a cen-
tralized wind turbine. We analyze participation in both programs using data from original
household surveys of participants and nonparticipants, along with utility data on household
electricity consumption.
Prior research on green electricity has focused primarily on estimating willingness-to-
pay or willingness-to-donate. These studies have employed various techniques, including the
hedonic price method (Roe et al., 2000), conjoint analysis (Goett, Hudson, and Train, 2000;
Roe et al., 2000), and contingent valuation (Ethier et al., 2000; Champ and Bishop, 2001;
Poe et al., 2002). In several cases, estimates from stated-preference techniques are compared
to those from revealed-preference techniques (Roe et al., 2000; Champ and Bishop, 2001;
Poe et al., 2002). The general �ndings are that many households are willing to pay a
premium for green electricity and that, while stated preferences result in overestimates,
calibration techniques based on revealed preferences can be used to adjust for the upward
bias.
The objectives of this paper are di¤erent. We set out to accomplish the following:
2
(1) provide a theoretical basis for di¤erent participation mechanisms of green-electricity
programs, (2) compare the theoretical implications of di¤erent mechanisms in terms of
participation and public-good provision, (3) investigate empirically the factors that in�uence
participation in green-electricity programs of di¤erent types, (4) interpret the results in the
context of the theoretical models, and (5) compare the results to studies of other privately
provided public goods.
The paper is of general interest because it analyzes private provision of a public good
in a �eld setting. This perspective on green-electricity programs has been the focus of two
other studies. Rose et al. (2002) test the use of a provision point mechanism to �nance
a green-electricity program and �nd that participation is responsive to the mechanism.
Oberholzer-Gee (2001) analyzes a sample of contributors to a VCM-based program and
�nds evidence that motives related to altruism and egoism underlie contributions. Our
study, in contrast, focuses on the primary mechanisms for participation in green-electricity
programs, and we consider motives of both participants and nonparticipants in the two types
of programs. We �nd, for example, that environmental concern and altruistic attitudes are
important determinants of household decisions about green electricity.
Regarding other types of public goods, there have been surprisingly few studies that
use microdata to analyze privately provided public goods in a �eld setting.2 This paper
reports on two case studies� one for a pure public good and one for an impure public good.
After developing and comparing the theoretical models (Section 2), we further describe the
empirical settings and data collection (Section 3). Three results of the econometric analysis
(Section 4) contribute to the literature on private provision of public goods. First, we �nd
that, while several household characteristics in�uence the decision of whether to contribute
to a public good, only household income in�uences the size of a contribution. This result
supports Smith, Kehoe, and Cremer�s (1995) �nding that di¤erent factors in�uence the
extensive and intensive margins of charitable giving. Second, household income in�uences
participation in a green-electricity program that provides a pure public good, but not one
that provides an impure public good. This empirical �nding, as we will show, is consistent
2Some existing studies have focused on contributions to public radio (Kingma, 1989), donations to arural health care facility (Smith, Kehoe, and Cremer, 1995), and alumni giving to colleges and universities(Clotfelter, 2003).
3
with the theory. Third, using data on actual household electricity consumption, we �nd
a signi�cant price e¤ect on participation in a green-electricity program that is based on
an impure public good. We discuss these results and others, along with limitations and
suggestions for future study, in the �nal section of the paper.
2 Theoretical Framework
Assume the economy consists of n households denoted i = 1; :::; n. Each household is
endowed with exogenous income mi and seeks to maximize a continuous and strictly quasi-
concave utility function of the form
Ui = U (xi; yi; G; �) ;
where xi is a numeraire consumption good, yi is household electricity consumption, G is
the generation capacity of green electricity, and � is a vector of taste parameters that
characterize heterogenous preferences. G has no subscript because it is a public good� that
is, all households bene�t from the total amount of green-electricity capacity.
2.1 The Voluntary Contribution Mechanism (VCM)
Consider a green-electricity program in which households have the opportunity to make a
voluntary contribution to �nance generation capacity. Total capacity, measured in �nancing
expenditures, is determined by the aggregate level of contributions such that G =Pni=1 gi,
where gi is household i�s contribution. An important feature of this program structure, as
discussed previously, is that contribution levels are not a function of electricity consumption.
While contributions are used to �nance green electricity, households continue to consume
conventional electricity at the price pc.
Each household takes the contribution of all other households, denoted G�i = G � gi,
as exogenously given (the Nash assumption) and solves the following utility maximization
problem:
maxxi;yi;gi
fU (xi; yi; gi +G�i; �) j xi + pcyi + gi = mig . (1)
4
This setup is closely related to the standard model for private provision of a pure public
good.3 The only di¤erence in (1) is the choice over two private goods, rather than one. The
addition of the numeraire is useful, as we will see, for contrasting di¤erent participation
mechanisms for green-electricity programs.
To analyze the model, it is convenient to add G�i to both sides of the budget constraint
in (1) and rewrite the household�s problem with a choice over the aggregate level of G rather
than gi:
maxxi;yi;G
fU (xi; yi; G; �) j xi + pcyi +G = mi +G�i; G�i � Gg , (2)
where the additional constraint G�i � G follows from nonnegativity of gi. The solution to
this problem yields a continuous demand function for G that (after suppressing notation
for pc) can be written as
G = max ff (mi +G�i; �) ; G�ig ; (3)
where f (�) is demand for G ignoring the inequality constraint. We assume that G is a
normal good, which implies that f (�) is strictly increasing. Now subtracting G�i from both
sides of (3), we have each household�s best-response function for a contribution:
gi = max ff (mi +G�i; �)�G�i; 0g . (4)
Using these best-response functions, it is relatively straightforward to prove existence of a
Nash equilibrium (see the Appendix).4
Letting G� denote an equilibrium level of contributions to �nance green-electricity ca-
pacity, we can solve for each household�s equilibrium contribution. Assume G� > G��i in
(3), invert f (�), and add g�i to both sides. Solving for the household�s contribution yields
g�i = mi�f�1 (G�; �i)+G�. Now de�ne a critical level of income m� (�) = f�1 (G�; �)�G�.
We can then write each household�s equilibrium contribution as
3See Bergstrom, Blume, and Varian (1986) for the standard model and Andreoni (1988) for the extensionto heterogenous preferences.
4The results in this paper rely on existence and not uniqueness of a Nash equilibrium.
5

g�i =
8<: 0 if mi � m� (�)
mi �m� (�) if mi > m� (�) :
(5)
Several implications of the contribution function are worth noting. First, households with
di¤erent tastes have di¤erent critical levels of income. If, for example, � is de�ned such that
greater values indicate a greater taste for G, then m� (�i) < m� (�j) for �i > �j . Second,
whether a household is a free-rider (contributor) depends on whether its actual income is
less than (greater than) its critical level of income. Thus, households that free-ride are
those with relatively low income, low �, or both. Finally, households that are contributors
contribute all of their income above their critical level, implying that households making
larger contributions are those with relatively high income, high �, or both.
2.2 The Green Tari¤Mechanism (GTM)
Now consider a green-electricity program in which �nancing is based on a green tari¤.
Each household chooses a proportion of its electricity consumption, �i 2 [0; 1], on which
to pay a voluntary price premium (green tari¤), � > 0, in excess of pc. The e¤ective
contribution of a household in support of green electricity is therefore ��iyi. Total capacity
is G = �Pni=1 �iyi, and we carryover the notation G�i = G � ��iyi. Compared to the
VCM, the GTM is distinct because a household�s contribution is linked to its electricity
consumption through the choice of �i. In fact, the quantity of electricity consumption �iyi
can be thought of as an impure public good because it generates a private characteristic
(electricity consumption) and a public characteristic (green-electricity capacity).5
Each household�s utility maximization problem with the GTM can be written as
maxxi;yi;�i
fU (xi; yi; ��iyi +G�i; �) j xi + pcyi + ��iyi = mig . (6)
This setup is technically distinct from the standard impure public good model because �i
is a choice variable� that is, the private and public characteristics of the impure public
good are not generated in �xed proportions. Furthermore, unlike the standard model, con-
5See Cornes and Sandler (1984, 1994) for the setup and analysis of the standard impure public goodmodel.
6

sumers e¤ectively have more than one way to obtain the private characteristic: conventional
electricity and green electricity.6
In order to compare the GTM with the VCM, we once again write the household�s
problem with a choice over the aggregate level of G. Rewriting (6) in this way yields
maxxi;yi;G
fU (xi; yi; G; �) j xi + pcyi +G = mi +G�i and G�i � G � �yi +G�ig , (7)
where the �rst constraint follows from adding G�i to both sides of the budget constraint,
and the additional constraints follow because 0 � �i implies G�i � G, and �i � 1 im-
plies G (= ��iyi +G�i) � �yi + G�i. Once again, it is relatively straightforward to prove
existence of a Nash equilibrium (see the Appendix).
Note that maximization problem (7) is equivalent to maximization problem (2) if �i < 1,
in which case the constraint G � �yi + G�i is not binding. This observation leads to
an important result about equivalence between di¤erent �nancing mechanisms for green
electricity: if all households in a GTM choose to pay the premium on less than 100 percent
of their electricity consumption, then the GTM is equivalent to a VCM. It follows that all
of the same households will participate in the program, all households will contribute the
same amount, and the total capacity of green electricity will be the same. Intuition for the
equivalence follows from recognizing that, conditional on a household�s choice of electricity
consumption yi, each household e¤ectively chooses a contribution level with its choice of �i.
In the case of a corner solution with �i = 1, however, the household faces an additional
constraint with the GTM� whereby increasing the contribution level by increasing �i is no
longer possible� and equivalence breaks down. Admitting the possibility for such corner
solutions leads to a more general result: the GTM will generate a (weakly) lower level of
public-good provision than the VCM. This result follows from the simple fact that the GTM
imposes a more restrictive upper bound on each household�s level of provision, �mipc+�
versus
mi.
It is worth considering in more detail a restricted GTM in which households face an
6See Kotchen (forthcoming) for extensions of the standard impure public good model that consider pure-private and pure-public substitutes for the impure public good. In fact, the setup in (6) is equivalent toKotchen�s scenario involving a substitute conventional good.
7

�all-or-nothing� decision. Many green-tari¤ programs, including the one studied in the
empirical portion of this paper, are structured so that participation requires households to
apply the price premium to 100 percent of their electricity consumption. Thus, the choice
of �i is constrained to the values of 0 or 1. The model predicts that a household will
participate in equilibrium if
V (pc; �;mi; �;G�i; �i = 1) � V (pc; �;mi; �;G�i; �i = 0) ; (8)
where V (�) is the indirect utility function that equals the maximized value of (6). Note that
the only di¤erence between the two sides of the inequality is whether �i = 1 or 0.
We know that the all-or-nothing GTM is not equivalent to the VCM. But how do the
two mechanisms di¤er in terms of the level of public-good provision? The answer di¤ers
from that for the more �exible GTM: the all-or-nothing GTM can generate either a higher
or lower level of public-good provision than the VCM. We demonstrate this result with a
simple example:
Example. Assume there are two identical households with income m, pc = 1,and preferences are given by Ui = qi (1 +G) where qi = xi + yi. With theVCM, it is straightforward to solve for the equilibrium level of provision Gvcm =2(m+1)
3 . With an all-or-nothing GTM, the equilibrium level of provision willdepend on �. With participation, the level of provision will be G�=1 = 2�m
1+� ;and without participation, the level of provision will be G�=0 = 0.7 Figure 1demonstrates how the level of provision changes with �. At low levels of �, thereis participation, the upper bound on provision is binding, and G�=1 � Gvcm. Atintermediate levels of �, there is participation, and G�=1 > Gvcm; the reason forthe higher level of provision is that, despite being forced to provide more thanunder the VCM, the households prefer �all�to �nothing�with the GTM. Thisis no longer true at su¢ ciently high levels of �, in which case the households donot participate, and the level of provision drops to G�=0 = 0.
The breakdown of equivalence between the all-or-nothing GTM and the VCM raises a
further question: How might household characteristics a¤ect participation di¤erently in the
two types of green-electricity programs? We have already investigated the in�uence of �
and mi on participation with a VCM. But how will changes in � and mi a¤ect participation
in an all-or-nothing GTM? To answer this question intuitively, it is useful to consider the
7The equilibrium is symmetric, and both households will participate if q�=1i
�1 +G�=1
��
q�=0i
�1 +G�=0
�, which is satis�ed if and only if � � 2m� 1.
8

12 −m
G =0
G =1
Gvcm
121
−+
mm
G*
Figure 1: Example of provision with a VCM versus an all-or-nothing GTM
comparative statics of demand for G. Continuing to assume that greater values of � indicate
a greater taste for G, demand for G is nondecreasing in � for given values of mi and G�i.
Thus, an increase in � will make satisfying the participation condition in (8) easier. The
e¤ect of a change in mi is less clear, however. Cornes and Sandler (1994, 1996) show that
demand for the joint products of an impure public good need not be increasing in income,
even if one or both of the joint products satisfy normality.8 Their result implies that demand
for G can be either increasing or decreasing in mi for given values of � and G�i. Thus,
given a change in mi, it is ambiguous whether satisfying the participation condition in (8)
becomes easier or harder.
3 Data
Our empirical analysis assesses the in�uence of household characteristics on participation
in the two types of green-electricity programs. We collected household data on participants
and nonparticipants in two di¤erent programs in Michigan. One program was �nanced with
a VCM, and the other was �nanced with an all-or-nothing GTM. This section describes the
two green-electricity programs, the survey methods used to collect data, and the variables
8Detailed explanations of this result can be found in Cornes and Sandler (1994, p. 410; 1996, p. 264).
9

Table 1: Participation in Detroit Edison�s SolarCurrents program
Number of Blocks Annual Contribution Number of Households1 $79.08 2222 $158.16 293 $237.24 144 $316.32 75 $395.40 46 $474.48 47 $553.56 1
Note: Annual contribution is based on the price of $6.59 per block per month.
for the econometric models.
The �rst program is Detroit Edison�s �SolarCurrents� program. Detroit Edison is a
large electric utility that serves over two million customers in southeastern Michigan. The
SolarCurrents program began operating in August 1996. Solar energy is generated at two
centralized photovoltaic facilities in the Detroit metropolitan area. Electricity produced
at these facilities is fed directly onto the regional power grid and displaces an equivalent
amount of electricity generated at conventional power plants. Participation is based on a
VCM, whereby households agree to lease one or more 100-watt block(s) of solar capacity.
Each block costs $6.59 per month, and no limit is placed on the number of blocks a house-
hold can lease. Participating households must sign a two-year contract, and participation is
completely independent of a household�s metered consumption of electricity. The total ca-
pacity of the SolarCurrents program, 54.8 kilowatts, was determined according to the initial
level of participation that resulted from 80,000 informational inserts in billing statements.
In 1998, there were 281 households participating in the program at levels ranging from 1 to
7 blocks. Table 1 summarizes the distribution of participation levels based on the number
of leased blocks and annual contributions per household.
The second program is Traverse City Light & Power�s (TCL&P) �Green Rate�program.
TCL&P is a municipal utility company that provides electrical service to approximately
7,000 residential customers in Traverse City, Michigan. In 1994, TCL&P began soliciting
households to voluntarily �nance a centralized wind turbine that would generate electricity
and replace generation at the local coal-�red power plant. Based on the initial level of par-
ticipation, TCL&P constructed a wind turbine in 1996. At the time, the turbine was the
10
largest operating in the United States, producing roughly 800,000 kilowatt-hours of electric-
ity per year, or enough to meet the demand of approximately 125 households. Participation
in the Green Rate program is based on an all-or-nothing GTM. Participating households
must purchase all of their electricity at a price premium of 1.58 cents per kilowatt-hour
under a three-year contract. This translates into an average residential premium of $8.50
per month ($102 per year), or a 25-percent increase in the average household�s electricity
bill. In 2001, there were 122 households participating in the program, and 32 households
were on a waiting list due to capacity limits.
We conducted household mail surveys of participants and nonparticipants in both of
the green-electricity programs. The surveys were designed to collect data on socioeconomic
characteristics and indicators of environmental concern and altruistic attitudes (described
below).9 The survey of Detroit Edison customers was conducted in 1998, while the survey
of TCL&P customers was conducted in 2001. Both surveys were administered using the
Dillman (1978) Total Design Method. The utility companies provided the names and ad-
dresses.10 The sample sizes for the Detroit Edison and TCL&P surveys were 900 and 1000,
respectively. Both samples were strati�ed to include all participants and a random sample
of nonparticipants.11 After accounting for undeliverable addresses, the response rates were
75 and 70 percent for the Detroit Edison and TCL&P surveys, respectively.12
A key feature of both surveys was the inclusion of questions designed to measure environ-
mental concern and altruistic attitudes. The questions designed to measure environmental
concern were taken from the New Ecological Paradigm (NEP) Scale, which is considered the
standard instrument in the social and behavioral sciences for measuring concern about the
environment (Dunlap, et al., 2000). The NEP scale is based on a series of questions that ask
respondents to indicate on a �ve-point scale the extent to which they agree or disagree with
di¤erent statements. Responses to the questions are then checked for internal consistency,
9Copies of the survey instruments are available from the authors upon request.10Surveys were addressed to the person whose name appeared on billing statements, and who we assume
to be the household decision-maker with respect to electricity.11For the Detroit Edison survey, questionnaires were sent to all 281 participants and a random sample
of 619 nonparticipants. For the TCL&P survey, questionnaires were sent to all 122 participants, all 32households on the waiting list, and a random sample of 846 nonparticipants.12For the Detroit Edison survey, 624 questionnaires were returned and 72 were undeliverable. For the
TCL&P survey, 677 questionnaires were returned and 28 were undeliverable.
11

after which they may be combined into a summated scale that provides a measure of general
environmental concern. Five statements from the NEP scale were included in both surveys
and comprise the scale used here. We report the speci�c statements in the Appendix Table,
along with statistics to test for internal consistency (item-total correlations and Cronbach�s
alpha) for both surveys. The results indicate reasonable internal consistency and support
combining the items into a summated scale.
The questions designed to measure altruistic attitudes followed the same format. Re-
spondents were asked to indicate on a �ve-point scale the extent to which they agree or
disagree with a series of statements that probed di¤erent aspects of the Schwartz (1970,
1977) model for the activation of altruistic behavior. While questions of this type are com-
monly used in experimental economics to explain private provision of public goods, they
are less commonly used in the �eld where such data are more di¢ cult to obtain.13 This,
however, was not a limitation for this study given the household mail survey. The scale
that we use is based on a subset of the items used by Clark, Kotchen, and Moore (2003).
The speci�c items are listed in the Appendix Table, along with the statistics to test for
internal consistency. Based on these results, it is reasonable to combine the responses to
form another summated scale that measures a general altruistic attitude.
The NEP scale and the altruism scale enter the econometric analysis as indicators of
heterogenous tastes that may in�uence participation in a green-electricity program. The
econometric analysis also includes variables constructed from data on annual household
income, the number of people living in each household, and the age and gender of the
respondents. A �nal source of data is for only the TCL&P customers. TCL&P provided
data on actual household electricity consumption that we could match with the households
in the survey. With these data, which span January 1994 through May 2002, we were able
to create a variable for average daily electricity consumption. In the next section, we explain
how this variable can be used to determine each household�s e¤ective price of participation
in a program based on a GTM.
Table 2 compares descriptive statistics for the Detroit Edison and TCL&P populations.
13For example, Eckel and Grossman (2000) conduct an experiment that uses a multi-item altruism scaleto explain charitable contributions in laboratory setting.
12
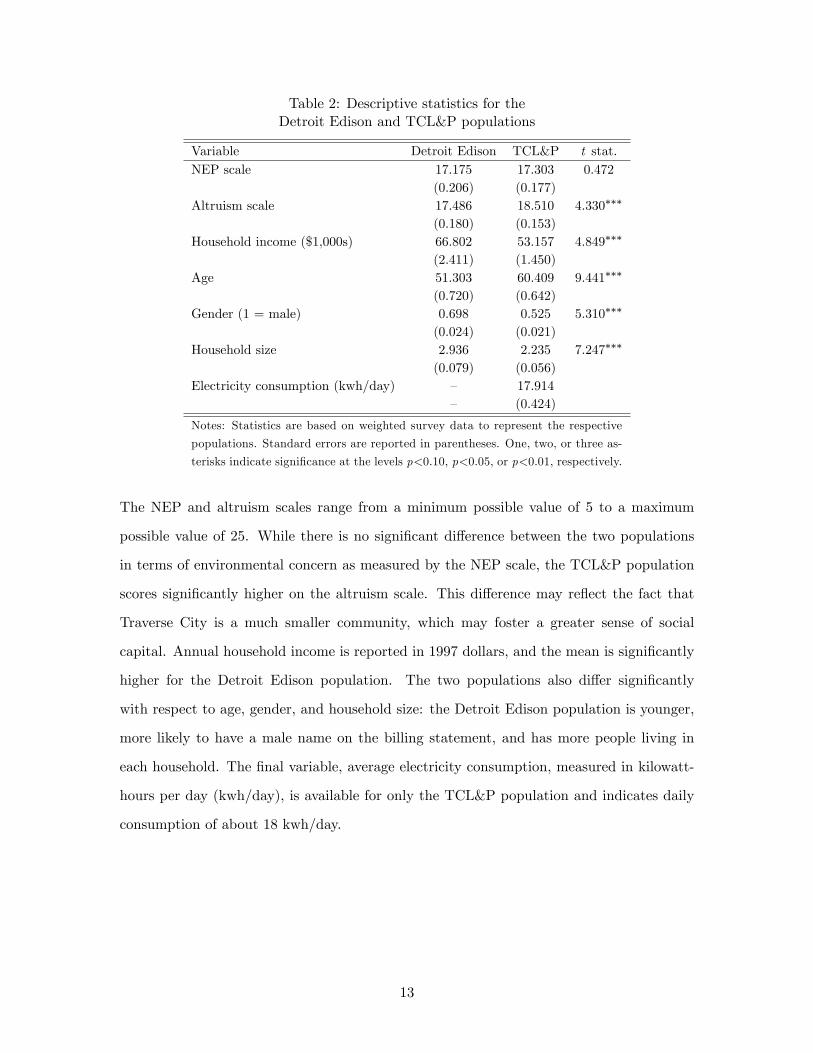
Table 2: Descriptive statistics for theDetroit Edison and TCL&P populations
Variable Detroit Edison TCL&P t stat.NEP scale 17.175 17.303 0.472
(0.206) (0.177)Altruism scale 17.486 18.510 4.330���
(0.180) (0.153)Household income ($1,000s) 66.802 53.157 4.849���
(2.411) (1.450)Age 51.303 60.409 9.441���
(0.720) (0.642)Gender (1 = male) 0.698 0.525 5.310���
(0.024) (0.021)Household size 2.936 2.235 7.247���
(0.079) (0.056)Electricity consumption (kwh/day) � 17.914
� (0.424)
Notes: Statistics are based on weighted survey data to represent the respective
populations. Standard errors are reported in parentheses. One, two, or three as-
terisks indicate signi�cance at the levels p<0.10, p<0.05, or p<0.01, respectively.
The NEP and altruism scales range from a minimum possible value of 5 to a maximum
possible value of 25. While there is no signi�cant di¤erence between the two populations
in terms of environmental concern as measured by the NEP scale, the TCL&P population
scores signi�cantly higher on the altruism scale. This di¤erence may re�ect the fact that
Traverse City is a much smaller community, which may foster a greater sense of social
capital. Annual household income is reported in 1997 dollars, and the mean is signi�cantly
higher for the Detroit Edison population. The two populations also di¤er signi�cantly
with respect to age, gender, and household size: the Detroit Edison population is younger,
more likely to have a male name on the billing statement, and has more people living in
each household. The �nal variable, average electricity consumption, measured in kilowatt-
hours per day (kwh/day), is available for only the TCL&P population and indicates daily
consumption of about 18 kwh/day.
13
4 Econometric Analysis
We use the data on participants and nonparticipants in the two green-electricity programs
to estimate econometric models of the participation decision. We begin with the VCM of
the SolarCurrents program. We then consider the all-or-nothing GTM of the Green Rate
program.
4.1 The SolarCurrents Program
Equation (5) provides the theoretical foundation for analyzing household contributions to
the SolarCurrents program. The theory predicts that a household�s contribution will depend
on tastes � and income mi. Speci�cally, households with di¤erent tastes will have di¤erent
critical levels of income such that a household�s contribution will be zero if income falls
below the critical level; otherwise a household�s contribution will be all of its income above
the critical level.
We estimate regression models to explain household contributions to the SolarCurrents
program in terms of income and heterogeneous tastes. The variables listed in Table 2
are included as regressors. The theory makes a clear prediction that contributions should
be increasing in household income. We use the NEP and altruism scales as indicators
of household tastes that may in�uence contributions. Formally, both scales are treated
as elements of �, and our hypothesis is that greater environmental concern and stronger
altruistic attitudes will have a positive e¤ect on contributions. The other variables of age,
gender, and household size are also treated as elements of �. While we have no strong priors
about how age and gender may a¤ect contributions, we hypothesize that household size will
have a negative e¤ect, as the amount of disposable income is likely to decrease with more
members in a household.
We begin with a tobit model because of the large number of households that make no
contribution to the SolarCurrents program.14 The dependent variable is a household�s an-
nual contribution. The results are reported in the �rst column of Table 3. As predicted,
both the NEP and altruism scales have a positive e¤ect on contributions; both variables
14The tobit model is commonly used for regressions of voluntary contributions with microdata. Forexamples see Kingma (1989), Smith, Kehoe, and Cremer (1995), and Clotfelter (2003).
14

have coe¢ cients that are positive and statistically signi�cant. The positive and statistically
signi�cant coe¢ cient on household income is also consistent with the theoretical prediction,
as contributions do in fact increase with income. The marginal e¤ect of income, however,
is substantially lower than the theoretical prediction that contributions will increase with
income one-for-one. The coe¢ cient of 0.692 implies that a $1000 increase in annual income
increases the annual contribution by roughly 70 cents. Despite di¤ering from the quantita-
tive prediction, the magnitude of this income e¤ect is close to the results of other studies on
voluntary contributions.15 The e¤ect of age is positive, but not statistically signi�cant. The
coe¢ cient on gender is statistically signi�cant, and the negative sign indicates that males
tend to make smaller contributions than females. Finally, household size has a negative and
statistically signi�cant e¤ect on contributions, suggesting the importance of considering
disposable income.
To test the robustness of the tobit results, we also estimate count data models for the
number of leased blocks of solar capacity. The count data models are motivated by the
nature of the data on blocks, involving a preponderance of zeros and small positive integer
values. We report the results of a negative binomial model in the second column of Table 3.
A poisson model (not reported) generates very similar results, yet fails a speci�cation test
against the negative binomial model. With the exception of the statistical insigni�cance of
gender, the qualitative results are robust to the count data speci�cations.
A common feature of the tobit and count data models is the restriction that explanatory
variables in�uence the extensive and intensive margins of contributions in the same way.
That is, an implicit assumption is made that the decision of whether to contribute is the
same as the decision of how much to contribute. While this restriction is consistent with the
theoretical foundation in equation (5), it is possible that the explanatory variables in�uence
voluntary contributions on the extensive and intensive margins in di¤erent ways. Smith,
Kehoe, and Cremer (1995) make this observation and �nd empirical support for it in a study
of charitable contributions to a rural health care facility. We explore the same possibility
here by decomposing the tobit model into a probit model for the decision of whether to
15For instance, comparable marginal e¤ects are estimated to be 0.54 for contributions to public radiostations in the United States (Kingma, 1989) and 0.01 for contributions to a green-electricity program inZurich, Switzerland (Oberholzer-Gee, 2001).
15
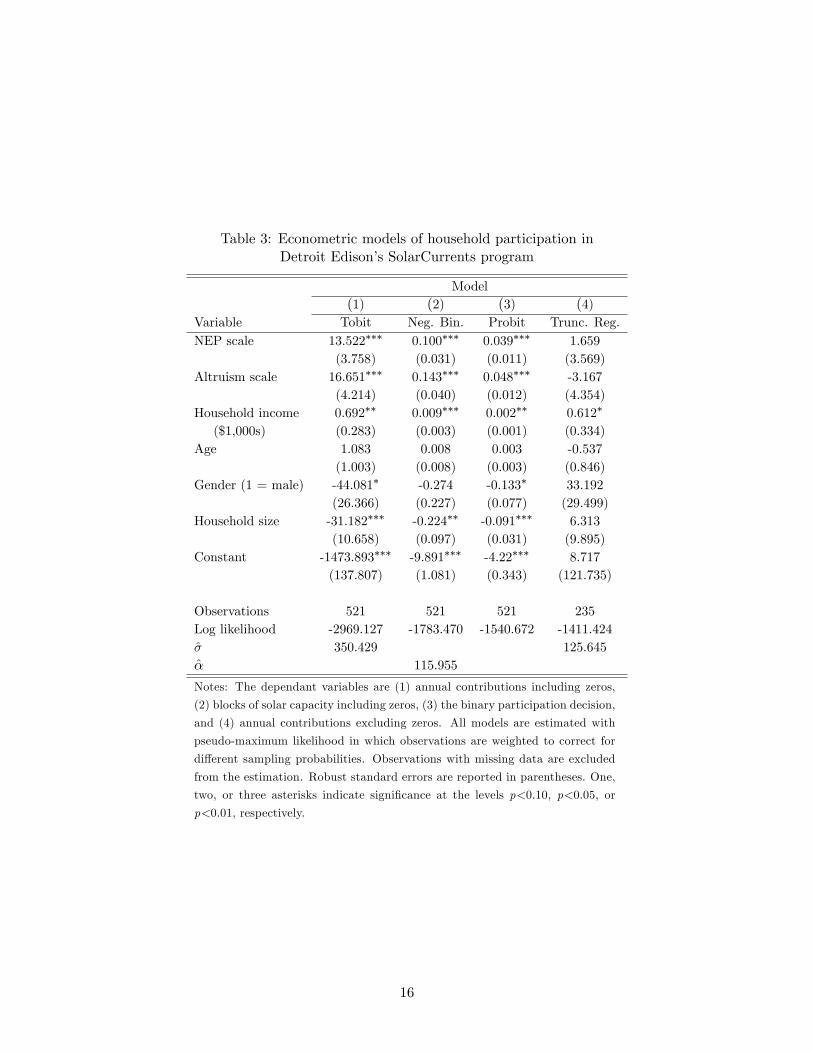
Table 3: Econometric models of household participation inDetroit Edison�s SolarCurrents program
Model(1) (2) (3) (4)
Variable Tobit Neg. Bin. Probit Trunc. Reg.NEP scale 13.522��� 0.100��� 0.039��� 1.659
(3.758) (0.031) (0.011) (3.569)Altruism scale 16.651��� 0.143��� 0.048��� -3.167
(4.214) (0.040) (0.012) (4.354)Household income 0.692�� 0.009��� 0.002�� 0.612�
($1,000s) (0.283) (0.003) (0.001) (0.334)Age 1.083 0.008 0.003 -0.537
(1.003) (0.008) (0.003) (0.846)Gender (1 = male) -44.081� -0.274 -0.133� 33.192
(26.366) (0.227) (0.077) (29.499)Household size -31.182��� -0.224�� -0.091��� 6.313
(10.658) (0.097) (0.031) (9.895)Constant -1473.893��� -9.891��� -4.22��� 8.717
(137.807) (1.081) (0.343) (121.735)
Observations 521 521 521 235Log likelihood -2969.127 -1783.470 -1540.672 -1411.424�̂ 350.429 125.645�̂ 115.955
Notes: The dependant variables are (1) annual contributions including zeros,
(2) blocks of solar capacity including zeros, (3) the binary participation decision,
and (4) annual contributions excluding zeros. All models are estimated with
pseudo-maximum likelihood in which observations are weighted to correct for
di¤erent sampling probabilities. Observations with missing data are excluded
from the estimation. Robust standard errors are reported in parentheses. One,
two, or three asterisks indicate signi�cance at the levels p<0.10, p<0.05, or
p<0.01, respectively.
16
contribute, and a truncated regression model for the decision of how much to contribute.16
We report the results of these two models in the third and fourth columns of Table 3.
The qualitative results of the probit model mirror those of the tobit; all of the coe¢ cients
have the same sign and level of statistical signi�cance. Thus, variables that in�uence only
the extensive margin of contributions are the same as those that in�uence the extensive and
intensive margins jointly. The results di¤er substantially, however, when considering only
the intensive margin. In the truncated regression model, only household income is a statis-
tically signi�cant explanatory variable, which continues to imply that contributions increase
with income. Nevertheless, the overall model explains little variation in contributions, as
it fails a Wald test restricting all coe¢ cients to zero��2 = 4:42, p = 0:6
�. Although not
reported here, estimates of truncated count data models generate an identical pattern of
results, yet do not fail the Wald test restricting all coe¢ cients to zero.
Together, these results provide evidence that the decision of whether to contribute is not
determined in the same way as the decision of how much to contribute. Speci�cally, we �nd
that environmental concern, altruistic attitudes, household income, gender, and household
size in�uence the decision about whether to contribute to the SolarCurrents program, yet
only household income in�uences the decision of how much to contribute.
4.2 The Green Rate Program
We now consider participation in TCL&P�s Green Rate program. Because the program
is based on an all-or-nothing GTM, the condition speci�ed in equation (8) provides the
theoretical foundation for analyzing household participation decisions.
We start with a probit model of participation that includes all of the same variables
that were used to analyze the SolarCurrents program. The results are reported as model
(1) in Table 4. The NEP and altruism scales have a positive and statistically signi�cant
e¤ect on participation. These results are consistent with those for the SolarCurrents pro-
gram. We therefore conclude that the NEP and altruism scales provide reliable measures of
16Our approach di¤ers from that of Smith, Kehoe, and Cremer (1995), who examine the di¤erent marginswith a Heckman selection model. We do not follow their approach because our sample includes all house-holds that participated in the SolarCurrents program; therefore, the analysis of the intensive margin needsno correcting for sample-selection bias. For cases such as this, Greene (2000) notes that the appropriatedecomposition of a tobit model is into a probit model and a truncated regression model.
17

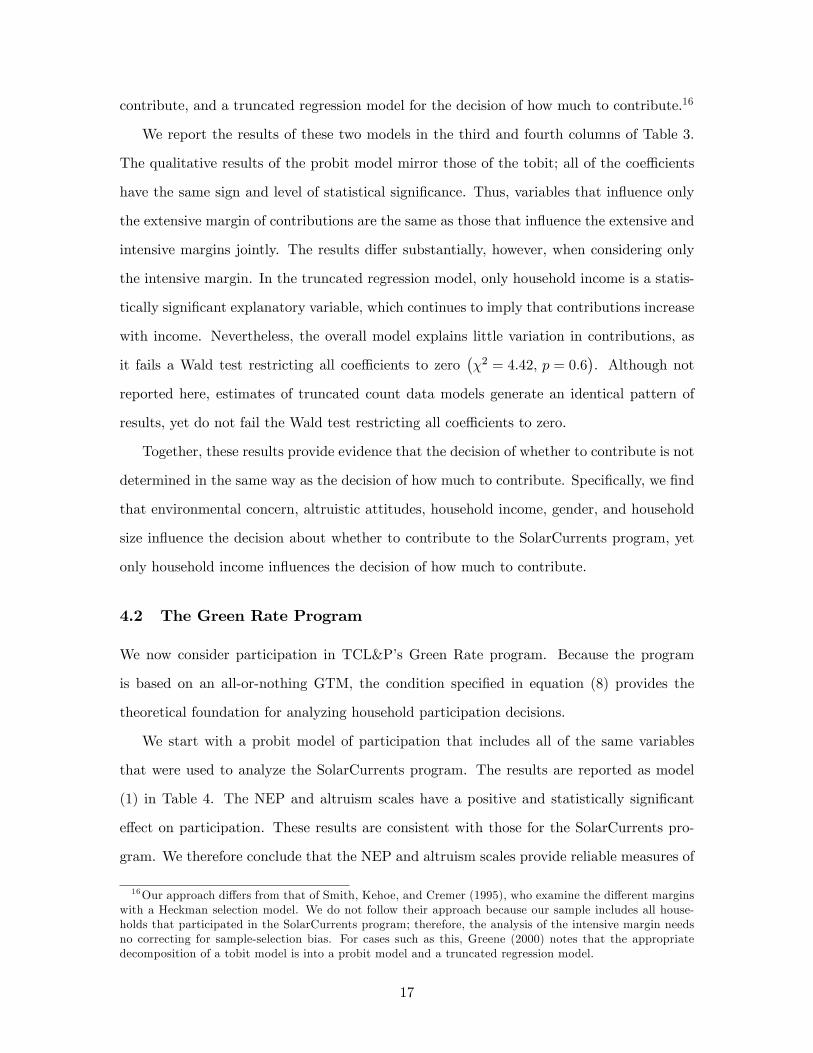
Table 4: Probit models of household participationin TCL&P�s Green Rate program
ModelVariable (1) (2)NEP scale 0.074��� 0.073���
(0.015) (0.015)Altruism scale 0.076��� 0.075���
(0.017) (0.018)Household income 0.001 0.002($1,000s) (0.002) (0.002)
Age -0.006 -0.006(0.005) (0.004)
Gender (1 = male) 0.109 0.119(-0.029) (0.116)
Household size -0.029 0.015(0.046) (0.048)
Electricity consumption � -0.017���
(kwh/day) � (0.006)Constant -4.644��� -4.464���
(0.512) (0.508)
Observations 528 525Log likelihood -533.434 -524.341
Notes: The dependant variable in both models is the binary participation
decision. Both models are estimated with pseudo-maximum likelihood in
which observations are weighted to correct for di¤erent sampling probabili-
ties. Observations with missing data are excluded from the estimation. Ro-
bust standard errors are reported in parentheses. One, two, or three asterisks
indicate signi�cance at the levels p<0.10, p<0.05, or p<0.01, respectively.
18

heterogeneous tastes with respect to preferences for participation in a green-electricity pro-
gram. Other studies have attempted to measure environmental and/or altruistic attitudes
to explain contributions to green-electricity programs (Champ and Bishop, 2001; Rose, et
al., 2002) or other public goods (e.g., Smith, Kehoe, and Cremer, 1995; Clotfelter, 2003).
With mixed degrees of success, the typical approach in these studies is to employ a survey
question about other charitable activities and/or a single-item question about a speci�c
attitude. While the summated scales used here require more demanding survey questions,
the approach is more reliable for measuring general attitudes (Spector, 1992), and both
scales have a conceptual foundation in the social and behavioral sciences.
Inclusion of the NEP and altruism scales in the probit model is particularly compelling
because not one of the other explanatory variables is statistically signi�cant. Most notable
is the insigni�cance of household income. Recall that the theoretical model accounts for this
possibility because participation is based on provision of an impure public good. Indeed, the
prediction that income may a¤ect participation di¤erently with a VCM or an all-or-nothing
GTM is an important insight of the theoretical model. Now, consistent with this insight
is the empirical �nding that income a¤ects participation in the SolarCurrents program but
not the Green Rate program.17 A similar pattern emerges from a cross-program comparison
of the in�uence of household size, which we interpret as a proxy for disposable income after
controlling for household income. Household size has a statistically signi�cant a¤ect on
participation in the SolarCurrents program but not the Green Rate program.
An interesting feature of the all-or-nothing GTM is the way that, in general, households
face di¤erent e¤ective prices of participation. Even though participating households pay
an identical price premium �, electricity demand yi will vary across households. This
implies that the e¤ective price of participation, �yi, will also vary across households. We
hypothesize that, controlling for other factors, the e¤ective price of participation will exert
a negative e¤ect on the probability of participating in an all-or-nothing GTM.
We test this hypothesis using utility-provided data on household electricity consumption
as a proxy for the e¤ective price of participation. Model (2) in Table 4 is another probit
17 It is worth mentioning that the coe¢ cient on income becomes positive and statistically signi�cant at the0.05 level if the NEP and altruism scales are dropped from model (1) in Table 4. Controlling for heterogenoustastes is therefore important for obtaining an accurate estimate of the income e¤ect.
19
model of the participation decision that di¤ers by the inclusion of average daily electric-
ity consumption as an explanatory variable.18 As expected, the coe¢ cient on electricity
consumption is negative and statistically signi�cant, indicating that a higher e¤ective price
decreases the probability of participation in the Green Rate program. By way of compar-
ison, Champ and Bishop (2001) �nd a negative price e¤ect when soliciting participation
in a green-electricity program with randomly assigned contribution levels. Their result,
however, pertains to provision of pure public good, while our result pertains to provision of
an impure public good. The magnitude of our estimated price e¤ect implies an elasticity
(evaluated at the mean of electricity consumption) of -0.83, suggesting that the probability
of participation is inelastic with respect to e¤ective price. With inclusion of e¤ective price
in the model, the coe¢ cient estimates on the other explanatory variables remain virtually
unchanged.
5 Conclusions
The increasing number of green-electricity programs combined with the diversity of their
participation mechanisms raises two important questions: Why do households participate in
green-electricity programs? And how does a program�s structure a¤ect participation? These
questions can be addressed with economic theory on private provision of public goods. The
�rst part of this paper extends models of privately provided pure and impure public goods
to capture the primary participation mechanisms for green-electricity programs, namely
VCMs and GTMs. The models show how participation in these programs will depend on
income and heterogeneous tastes. The models also reveal several insights about public-
good provision under a VCM versus a GTM. First, a GTM is equivalent to a VCM if all
households choose to pay the tari¤ on less than 100 percent of their electricity consumption.
Second, a GTM will result in (weakly) less privately provided capacity of green electricity
18There is a potential endogeneity concern with including average daily electricity consumption as anexplanatory variable. Upon entering the Green Rate program and paying the voluntary tari¤, householdsmay change their electricity consumption. See Kotchen and Moore (2004) for a detailed investigation of thispossibility. To address this concern here, we use the times series data on household consumption to calculatean alternative variable for each household�s average daily consumption when not participating in the GreenRate program. When this variable is included instead, all of the results remain nearly identical to those inmodel (2).
20

than a VCM. Finally, depending on the size of the tari¤, an all-or-nothing GTM can result
in more or less privately provided capacity of green electricity than a VCM.
The empirical portion of the paper focuses on the in�uence of household characteristics
on participation in two green-electricity programs� one based on a VCM and one based on
an all-or-nothing GTM. The data come from a combination of revealed preferences for actual
green-electricity programs and original surveys of both participating and nonparticipating
households. In the program based on a VCM, several variables in�uence contributions in
predicted ways. Models that combine the extensive and intensive margins of participation
reveal that contributions are increasing in household income, environmental concern, and
altruistic attitudes; yet they are decreasing in the number of people living in the household
and whether a male name is on the electricity billing statement. Interestingly, the results
di¤er substantially when the extensive and intensive margins are analyzed separately. All of
the same variables a¤ect the decision of whether to contribute, but only household income
a¤ects the decision of how much to contribute. In the program based on an all-or-nothing
GTM� where there is only an extensive margin� fewer variables in�uence the participa-
tion decision. The probability of participation is increasing in environmental concern and
altruistic attitudes; yet it is decreasing in household electricity consumption, which proxies
for the e¤ective price of participation. Household income does not signi�cantly in�uence
participation; this result is particularly interesting because, according to the theoretical
models, it is one of the potential di¤erences that may occur between VCMs and GTMs.
Our theoretical and empirical results have several implications for the design of green-
electricity programs. The theory suggests that participation based on a VCM will induce
more green-electricity capacity than participation based on a fully �exible GTM. However,
the comparison between a VCM and an all-or-nothing GTM will depend on the size of the
green tari¤. While su¢ ciently low or high tari¤s continue to favor the VCM, there exists a
middle range of tari¤s under which the all-or-nothing GTM will induce more capacity. The
empirical results suggest ways to most e¤ectively market green electricity. It appears that
the greatest success will occur if marketing e¤orts can be targeted to households that have
greater concern for the environment and/or stronger altruistic attitudes. Marketing green-
electricity programs through environmental and charitable organizations may thus prove
21

useful. Other suggestions are to target households with higher income when participation
is based on a VCM, and to target households with lower electricity consumption when
participation is based on an all-or-nothing GTM.
We conclude with remarks about limitations and suggestions for future studies. While
we test some predictions of the theoretical model, the fact that our data set encompasses
only two green-electricity programs limits the empirical scope of the research. Speci�cally,
we cannot test for the e¤ect of program structure on participation and the level of public-
good provision. This would be possible with either microdata or aggregate data on many
green-electricity programs, or even experimental data on participation in hypothetical pro-
grams with di¤erent participation mechanisms. This is a task for future research. Our
empirical results suggest, however, that further advancement of the theory on voluntary
contributions is also necessary. Following Smith, Kehoe, and Cremer (1995), we �nd that
di¤erent variables in�uence the extensive and intensive margins of voluntary contributions;
nevertheless, the theory does not account for this empirical �nding. In a recent study, Mur-
doch, Sandler, and Vijverberg (2003) consider a two-stage game in which agents �rst choose
whether or not to participate, and then they choose their level of participation. While the
model accounts for di¤erent determinants at each stage, the natural application is to in-
ternational treaties. Similar studies that focus on individual or household contributions
and motives would be useful. For instance, models could be developed to further consider
how notions such as the buying-in mentality (Rose-Ackerman, 1982), warm glow (Andreoni,
1990), and prestige (Harbaugh, 1998) may operate di¤erently at the extensive and intensive
margins of contributions. To the extent that these same considerations interact di¤erently
with VCMs and GTMs, they may also be important to more fully understand participation
in green-electricity programs.
22
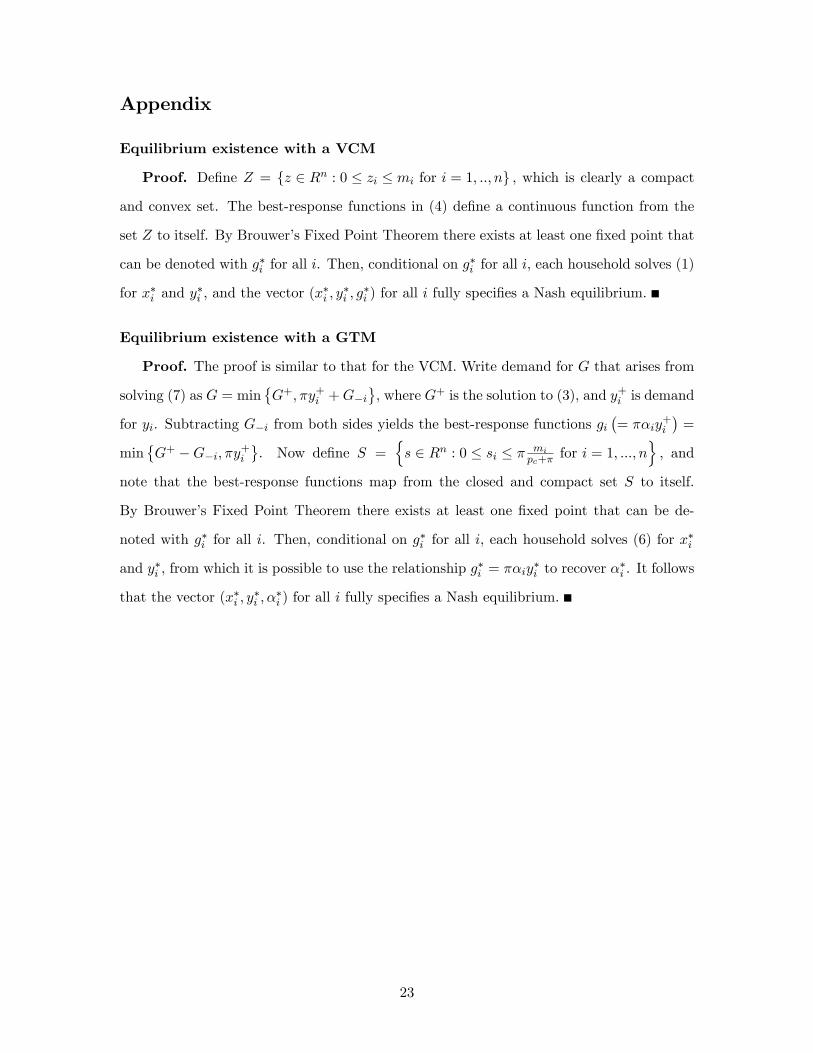
Appendix
Equilibrium existence with a VCM
Proof. De�ne Z = fz 2 Rn : 0 � zi � mi for i = 1; ::; ng ; which is clearly a compact
and convex set. The best-response functions in (4) de�ne a continuous function from the
set Z to itself. By Brouwer�s Fixed Point Theorem there exists at least one �xed point that
can be denoted with g�i for all i. Then, conditional on g�i for all i, each household solves (1)
for x�i and y�i , and the vector (x
�i ; y
�i ; g
�i ) for all i fully speci�es a Nash equilibrium.
Equilibrium existence with a GTM
Proof. The proof is similar to that for the VCM. Write demand for G that arises from
solving (7) as G = min�G+; �y+i +G�i
, where G+ is the solution to (3), and y+i is demand
for yi. Subtracting G�i from both sides yields the best-response functions gi�= ��iy
+i
�=
min�G+ �G�i; �y+i
. Now de�ne S =
ns 2 Rn : 0 � si � � mi
pc+�for i = 1; :::; n
o; and
note that the best-response functions map from the closed and compact set S to itself.
By Brouwer�s Fixed Point Theorem there exists at least one �xed point that can be de-
noted with g�i for all i. Then, conditional on g�i for all i, each household solves (6) for x
�i
and y�i , from which it is possible to use the relationship g�i = ��iy�i to recover �
�i . It follows
that the vector (x�i ; y�i ; �
�i ) for all i fully speci�es a Nash equilibrium.
23

App
endi
xTa
ble:
Item
-tot
alco
rrel
atio
nsan
dC
ronb
ach’
sal
pha
for
the
NE
Pan
dal
trui
smsc
ales
Det
roit
Edi
son
TC
L&P
NEP
scal
e1.
Pla
nts
and
anim
als
have
asm
uch
righ
tas
hum
ans
toex
ist.
0.60
40.
562
2.T
heso
-cal
led
“eco
logi
calc
risi
s”fa
cing
hum
anki
ndha
sbe
engr
eatl
yex
agge
rate
d.0.
737
0.74
53.
Hum
anin
genu
ity
will
insu
reth
atw
edo
not
mak
eth
eea
rth
unliv
able
.0.
631
0.64
34.
The
eart
his
like
asp
aces
hip
wit
hve
rylim
ited
room
and
reso
urce
s.0.
600
0.67
15.
The
bala
nce
ofna
ture
isst
rong
enou
ghto
cope
wit
hth
eim
pact
sof
mod
ern
indu
stri
alna
tion
s.0.
738
0.77
2
Cro
nbac
h’s
alph
a0.
680
0.70
7
Altru
ism
scal
e1.
Con
trib
utio
nsto
com
mun
ity
orga
niza
tion
sra
rely
impr
ove
the
lives
ofot
hers
.0.
654
0.65
82.
The
indi
vidu
alal
one
isre
spon
sibl
efo
rhi
sor
her
wel
l-bei
ngin
life.
0.46
20.
644
3.It
ism
ydu
tyto
help
othe
rpe
ople
whe
nth
eyar
eun
able
tohe
lpth
emse
lves
.0.
678
0.60
84.
My
resp
onsi
bilit
yis
topr
ovid
eon
lyfo
rm
yfa
mily
and
mys
elf.
0.71
60.
755
5.M
ype
rson
alac
tion
sca
ngr
eatl
yim
prov
eth
ew
ell-b
eing
ofpe
ople
Ido
n’t
know
.0.
686
0.64
4
Cro
nbac
h’s
alph
a0.
636
0.67
5
Not
es:
Res
pons
esar
eba
sed
ona
…ve-
poi
ntL
iker
tsc
ale
rang
ing
from
“str
ongl
yag
ree”
to“s
tron
gly
disa
gree
.”R
esp
onse
sar
eco
ded
from
1to
5su
chth
athi
gher
num
bers
corr
espo
ndto
grea
ter
conc
ern
abou
tth
een
viro
nmen
tor
altr
uism
.T
wo
min
orch
ange
sw
ere
mad
eto
the
wor
ding
ofth
eal
trui
smsc
ale
inth
eT
CL&
Psu
rvey
:it
em1
was
adju
sted
toa
posi
tive
stat
emen
tby
subs
titu
ting
“can
grea
tly”
for
“rar
ely,
”an
dit
em2
was
adju
sted
bysu
bsti
tuti
ng“s
atis
fact
ion”
for
“wel
l-bei
ng.”
References
Andreoni, J., �Privately Provided Public Goods in a Large Economy: The Limits of Al-truism,�Journal of Public Economics, Vol. 35 (1988) 57�73.
Andreoni, J., �Impure Altruism and Donations to Public Goods: A Theory of Warm-GlowGiving,�The Economic Journal, Vol. 100 (1990) 464�477.
Bergstrom, T. C., L. Blume, and H. Varian, �On the Private Provision of Public Goods,�Journal of Public Economics, Vol. 33 (1986) 25�49.
Bird, L. and B. Swezey, �Green Power Marketing in the United States: A Status Report,Sixth Edition,�NREL/TP-620-35119, National Renewable Energy Laboratory, Golden,Colorado (2003).
Champ, P. A. and R. C. Bishop, �Donation Payment Mechanisms and Contingent Val-uation: An Empirical Study of Hypothetical Bias,�Environmental and Resource Eco-nomics, Vol. 19 (2001) 383�402.
Clark, C. F., M. J. Kotchen, and M. R. Moore, �Internal and External In�uences onPro-Environmental Behavior: Participation in a Green Electricity Program,� Journalof Environmental Psychology, Vol. 23 (2003) 237-246.
Clotfelter, C.T., �Alumni Giving to Elite Private Colleges and Universities,�Economics ofEducation Review, Vol. 22 (2003) 109�120.
Cornes, R. C. and T. Sandler, �Easy Riders, Joint Production, and Public Goods,�Eco-nomic Journal, Vol. 94 (1984) 580�598.
Cornes, R. C. and T. Sandler, �The Comparative Static Properties of the Impure PublicGood Model.�Journal of Public Economics, Vol. 54 (1994) 403�421.
Dillman, D. A., Mail and Telephone Surveys: The Total Design Method, New York: Wileyand Sons (1978).
Dunlap, R. E., K. D. Van Liere, A. D. Mertig, R. E. Jones, �Measuring Endorsement ofthe New Ecological Paradigm: A Revised NEP Scale,�Journal of Social Issues, Vol. 56(2000) 425�442.
Eckel, C. C. and P. J. Grossman, �Volunteers and Pseudo-Volunteers: The E¤ect of Re-cruitment Method in Dictator Experiments,� Experimental Economics, Vol. 3 (2000)107-120.
Ethier, R. G., G. L. Poe, W. D. Schulze, and J. Clark, �A Comparison of Hypotheti-cal Phone and Mail Contingent Valuation Responses for Green-Pricing Electricity Pro-grams,�Land Economics, Vol. 76 (2000) 54�67.
Goett, A. A., K. Hudson, and K. E. Train, �Customers�Choice Among Retail Energy Sup-pliers: The Willingness-to-Pay for Service Attributes,�Energy Journal, Vol. 21 (2000)1�28.
Greene, W. H., Econometric Analysis, Fourth Edition, Prentice Hall: Upper Saddle River,NJ (2000).
25
Harbaugh, W. T., �What do Donations Buy? A Model of Philanthropy Based on Prestigeand Warm Glow,�Journal of Public Economics, Vol. 67 (1998) 269�284.
Kingma, B. R., �An Accurate Measurement of the Crowd-out E¤ect, Income E¤ect, andPrice E¤ect for Charitable Contributions,�Journal of Political Economy, Vol. 97 (1989)1197�1207.
Kotchen, M. J., �Impure Public Goods and the Comparative Statics of EnvironmentallyFriendly Consumption,�Journal of Environmental Economics and Management, (forth-coming).
Kotchen, M. J. and M. R. Moore, �Conservation Behavior: From Voluntary Restraintto a Voluntary Price Premium,�Working Paper, Department of Economics, WilliamsCollege, Williamstown, MA (2004).
Murdoch, J. C., T. Sandler, and W. P. M. Vijverberg, �The Participation Decision Versusthe Level of Participation in and Environmental Treaty: A Spatial Probit Analysis,�Journal of Public Economics, Vol. 87 (2003) 337-362.
Oberholzer-Gee, F., �Your Contribution Counts: An Empirical Analysis of the Decisionto Support Green Electricity,�in Environmental Contracts: Comparative Approaches toRegulatory Innovation in the United States and Europe, E. W. Orts and K. Deketelaere(eds.). London: Kluwer Law International (2001).
Poe, G. L., J. E. Clark, D. Rondeau, and W, D. Schulze, �Provision Point Mechanisms andField Validity Tests of Contingent Valuation,�Environmental and Resource Economics,Vol. 23 (2002) 105�131.
Roe, B., M. F. Teisl, A. Levy, and M. Russell, �US Consumers�Willingness to Pay forGreen Electricity,�Energy Policy, Vol. 29 (2001) 917�925.
Rose, S. K., J. Clark, G. L. Poe, D. Rondeau, and W. D. Schulze, �The Private Provi-sion of Public Goods: Tests of a Provision Point Mechanism for Funding Green PowerPrograms,�Resource and Energy Economics, Vol. 24 (2002) 131�155.
Rose-Ackerman, S., �Charitable Giving and �Excessive�Fundraising,�Quarterly Journalof Economics, Vol. 97 (1982) 193�212.
Schwartz, S. H., �Elicitation of Moral Obligation and Self-Sacri�cing Behavior,� Journalof Personality and Social Psychology, Vol. 15 (1970) 283�293.
Schwartz, S. H., �Normative In�uences on Altruism,�in Advances in Experimental SocialPsychology, Vol. 10, Leonard Berkowitz (ed.), New York: Academic Press (1977).
Smith, V. H.; M. R. Kehoe, and M. E. Cremer, �The Private Provision of Public Goods:Altruism and Voluntary Giving,�Journal of Public Economics, Vol. 58 (1995) 107�126.
Spector, P. E. Summated Rating Scale Construction, Newbury Park, CA: Sage Publications(1992).
26