private investment and the institutionalization of
TRANSCRIPT

Private Investment and the Institutionalization ofCollective Action in Autocracies: Ruling Parties and
Legislatures∗
Scott GehlbachUniversity of Wisconsin–Madison and CEFIR, Moscow
E-mail: [email protected]
Philip KeeferThe World Bank
E-mail: [email protected]
August 2010
Disclaimer: The opinions and findings herein are those of the authors and do not necessarilyrepresent the views of the World Bank or its directors.
∗We thank Mark Hallerberg, Brandon Lamson, Peter Lorentzen, Eddy Malesky, Melanie Manion, EricMaskin, Alberto Simpser, David Singer, Jim Snyder, Konstantin Sonin, and Tuong Vu for many helpfulcomments, and Evgeny Finkel, Vera Zuo, and Amber Wichowsky for research assistance. Much usefulfeedback was received from seminar and conference participants at MIT, the Hertie School of Governancein Berlin, the University of Basel, the University of Wisconsin–Madison, the Eighth International ScientificConference of the Higher School of Economics in Moscow, the Yale Conference on Non-Democratic Regimes,and annual meetings of the International Society for New Institutional Economics and the American PoliticalScience Association.

Abstract
Despite the absence of formal institutions to constrain opportunistic behavior, someautocracies successfully attract private investment. Prior work explains such successby the relative size of the autocrat’s winning coalition or the existence of legislatures.We advance on this understanding by focusing on the key constraint limiting coalitionsize and legislative efficacy: organizational arrangements that allow group membersto act collectively against the ruler. We introduce three new quantitative measuresof the ability of ruling party members to act collectively: ruling-party institutional-ization, the regularity of leader entry, and the competitiveness of legislative elections.These characteristics are robustly associated with higher investment and lower risk ofopportunistic behavior in non-democracies.
Keywords: investment, dictatorship, collective action, ruling parties, legislatures
Although much is known about the determinants of economic performance, the fact that
some non-democracies manage to attract large amounts of private investment remains a per-
sistent puzzle. In 2007, for example, 40 percent of countries lacking competitive multiparty
elections attracted more private investment than the median country with competitive elec-
tions. Such performance is not easily explained by the presence of formal institutions that
constrain opportunistic behavior by governments; almost by definition, such institutions are
lacking in non-democracies. Moreover, variation in private investment among autocracies is
far greater than in democracies: in 2007, the standard deviation of private investment/GDP
among non-democracies was 7.1 percentage points, versus 2.4 percentage points in democ-
racies.1
In this paper, we investigate variation in private investment among non-democracies, ex-
plaining it with a new argument: autocracies succeed in attracting private investment when
they exhibit specific institutions that promote collective action by regime supporters in the
event of their expropriation. We identify these institutions and provide three new measures
of their existence: ruling-party institutionalization, the regularity of leadership transitions,
and the presence of multiple candidates in single-party legislative elections. Quantitative evi-
dence demonstrates that private investment is robustly higher in non-democracies with these
institutions than those without. This effect, however, extends only to domestic private in-
vestment; foreign investors are not members of domestic political coalitions, and their actions
are presumably less sensitive to whether regime supporters can act collectively. Consistent
with our general argument, we also find that expropriation risk is smaller in non-democracies
where regime supporters are allowed to act collectively.
In the discussion that follows, we describe this paper’s contribution to a large literature on
regime performance. We then show how specific institutions can create capacity for collective
action among regime supporters, thus constraining opportunistic behavior by autocratic
rulers and encouraging private investment. We introduce three measures of the degree to
1We provide data sources in Section 4 below.
1
which leaders allow (or are compelled to tolerate) collective action by their supporters: the
age of the ruling party at the time the ruler takes power; the degree to which rulers enter office
through regular procedures; and the extent to which legislators build personal constituencies
through competitive elections. The remainder of the paper presents quantitative estimates
of the effects of these variables on private investment and opportunistic behavior by non-
democratic leaders.
1 Autocratic Performance in the Literature
The literature on autocratic performance is vast and quickly growing. Given space con-
straints, we focus here on a few works closely related to our contribution. This related
research assumes, in common with much of the literature, that supporters of the autocrat
can remove the autocrat from office. Bueno de Mesquita, Morrow, Siverson, and Smith
(2003), for example, assume that the ruler must maintain the support of some subset (the
“winning coalition”) of the group of individuals with the power to replace him (the “se-
lectorate”); they conclude that rulers are more likely to adopt policies in the broad public
interest when the winning coalition is large. Similarly, Besley and Kudamatsu (2008) argue
that good policy results when the selectorate can replace the leader without losing power
itself. North and Weingast’s (1989) analysis of the Glorious Revolution can be viewed in
a similar light: once the wealthy acted collectively to wage war against an opportunistic
king, the threat of royal expropriation declined. Even Acemoglu and Robinson (2002) and
Boix (2003), who focus more on conflict between a ruling elite and an excluded majority,
implicitly assume that the elite’s representative acts on their behalf. Our paper extends this
work by examining the precise institutional arrangements under which a selectorate can act
collectively to restrain an unelected leader.
Among the specific arrangements that we examine, our paper is related to work that
asks ask whether autocratic performance differs in the presence of legislatures. Boix (2003)
and Wright (2008) argue that legislatures in autocracies (or, as in Wright, military and
single-party regimes) are a constraint on the executive and encourage private investment.
2

In contrast, Gandhi and Przeworski (2006) and Gandhi (2008) suggest that legislatures act
as fora for co-opting the opposition rather than as solutions to the credible-commitment
problem confronting leaders. Regardless of their function, the puzzle in this work is that
a ruler who can establish a legislature can also dismantle it. The argument here helps to
resolve this puzzle, showing that only legislatures whose members have independent support
bases can resist transgressions by the ruler.
Our emphasis on ruling parties also has antecedents in other work on parties in non-
democracies. Wintrobe (2000) emphasizes the role that parties in autocracies play in gen-
erating loyalty among some citizens; we demonstrate that some parties can achieve this by
creating an environment that encourages private investment. Further, in their analyses of
the Partido Revolucionario Institucional (PRI) in Mexico, both Haber, Razo, and Maurer
(2003) and Magaloni (2006) link ruling-party characteristics to economic performance. Our
arguments draw a contrast between Mexico under the (institutionalized) PRI and Mexico
under the autocrat Porfirio Dı́az, or China under Deng Xiaoping and China under Mao Ze-
dong. Brownlee (2007) argues that parties serve to hold elite coalitions together; the analysis
here can be seen as describing organizational prerequisites for elite cohesion. Finally, Ged-
des (2008) argues that autocrats create ruling parties as a way to defend against coups by
impressing upon dissident elements of the military their ability to mobilize citizen demon-
strations. From our perspective, to the extent that mobilization requires the delegation of
authority to supporters, the ability of supporters to act collectively against the leader may
be enhanced.
2 Collective Action and Investment in Non-democracies
In this section we develop the argument that capacity for collective action among an auto-
crat’s supporters can increase private investment. We begin by discussing the prerequisites
for collective action. We then illustrate the links between these prerequisites and private
investment with several examples from East Asia and the Middle East.
Recent contributions to the political economy literature emphasize information transmis-
3

sion as a key obstacle to collective action among regime supporters. Gehlbach and Keefer
(2010), for example, argue that collective action to punish ruler expropriation can be hin-
dered by incomplete information about who has been expropriated. Leaders can mitigate
this problem through a specific organizational response: creating an institutionalized rul-
ing party. In Gehlbach and Keefer’s model, institutionalization increases information flows
within the party, thus making expropriation of supporters common knowledge among party
cadres; it also assures cadres that citizens outside the party will not invest. Similarly, Boix
and Svolik (2009) argue that organizations such as legislatures can facilitate the provision
of information to supporters. Consistent with this, they find that leaders are less likely to
be evicted by (unnecessary) rebellions in non-democracies with legislatures.
Non-informational obstacles to collective action, though not the focus of the literature,
are at least as important. Most obvious among these, leaders may simply prohibit or limit
independent initiatives by group members. Where supporter organizations are characterized
by tight leader controls over the timing, agenda, and attendance of group meetings, collective
action by the group to sanction the leader is less likely. Similarly, when leaders prohibit
coordination among supporters in the pursuit of any task—even those such as public-good
provision that could increase support for the leader among the population—they again make
it more difficult for supporters to coordinate against them.
This discussion suggests that the presence of specific institutions may increase the cred-
ibility of commitments by an autocratic leader to his supporters. To the extent that these
supporters have the opportunity to invest, this should encourage private investment. A brief
comparison of autocratic performance in East Asia and the Middle East helps to illustrate
the point. East Asian non-democracies are well-known for their ability to attract investment,
in stark contrast to (non-oil producing) Middle Eastern countries. Averaged over the periods
during which no competitive elections were held, private investment in China, Indonesia, and
Singapore was 13.5, 15.4, and 19.9 percent of GDP, respectively. In Egypt and Syria it was
8.4 and 10.8 percent. Consistent with this pattern, these countries exhibit correspondingly
4
large differences in the degree to which they permit collective action by regime supporters
through ruling parties.
Consider in particular the case of China. Under Mao, members of the party could not
act collectively against the leadership but instead were subjected to “divide and conquer”
strategies. Those who appeared to be focal points of coordination were suppressed, and two of
Mao’s “chosen successors” died politics-related deaths. During the Cultural Revolution, Mao
used the Red Guards, whom he directly controlled and who lay outside the party hierarchy,
to attack his opponents within the party. Thousands of party officials were transferred to
lower-level jobs, sent to the countryside for re-education, or imprisoned (e.g., Whiting, 2006).
After Mao’s death, and coincident with the economic reforms that accelerated Chinese
growth, Deng Xiaoping undertook numerous actions to build institutions within the Chinese
Communist Party. He abolished the Red Guard and introduced personnel reforms in 1980
in which promotion and cadre evaluation were “governed by rules, clear lines of authority,
and collective decision-making institutions to replace the over-concentration of power and
patriarchal rule that had characterized China under Mao” (Shirk, 1993, p. 9). Mao had
explicitly opposed intra-party institutionalization of this kind, and in fact had sent Deng
into internal exile for advocating similar reforms. Though Deng’s motivations are not well-
documented, observers link them to a desire for a more functional country.
To be clear, it is not that these broad institutional changes were sufficient to allow local
cadres to act collectively to restrain leaders in Beijing. Naturally, local cadres at the village
level, no matter how transparent the Party management of their careers and no matter how
low the barriers they confronted to coordinating with each other, stood little chance of acting
collectively against the top leadership. However, at every level of the party, leaders in the
post-Mao era confronted greater constraints imposed by at least the hundreds of cadres just
below them.
As Gehlbach and Keefer (2010) describe, this institutionalization appears to have played
an important role in encouraging private investment in China. Although it is not necessary
5

that entrepreneurs be in the party in order to enjoy the protection of party institutionalization—
they could also rely on personal ties with party members—party membership of large private
investors is common in China. Party members lead, and serve as the largest investors in,
Baidu and Tencent, two large Internet companies; ZTE and Hua Wei, leading providers of
communications equipment for telecommunications operators (i.e., competitors with Cisco);
and the Hua Yuan group, a major real estate developer. The first two sets of examples
are particularly instructive: although party membership could signal cronyism rather than
security from expropriation, this is less likely to be true for firms reliant on new technologies
and markets.2
Similar cases are hard to find in the Middle East. Iraqi and Syrian rulers were careful
to take measures to prevent collective action by the ruling Ba’ath parties. They established
competing organizations, particularly security forces, that reported directly to them, much
as Mao had repressed collective action by Communist Party cadres by establishing the Red
Guard. In Syria, for example, General Hafiz al-Asad, representing the military wing of the
Ba’ath Party, came to power by overthrowing the civilian Ba’ath Party in 1970. The Ba’ath
Party remained the ruling party, but al-Asad gave it no role in internal security, which was
controlled by members of al-Asad’s small Alawi tribe and by the army. Recruitment to
the party was based on regional and sectarian considerations rather than on adherence to
the ideological principles that had historically been the basis for collective action by Ba’ath
Party members (Owen, 1992, pp. 261-62).
The example of Algeria helps to illustrate the relationship between ruling-party institu-
tionalization and private investment. Houari Boumedienne took over in a 1965 coup and
2China is generally thought to be a magnet for foreign direct investment, suggesting a
possible inconsistency with this discussion, as foreigners are not generally members of the
Communist Party. Relative to GDP, however, FDI into China has not been extraordinary.
Since 1980, net foreign direct investment has averaged 2.5 percent of GDP, compared to 3.2
percent for all non-democracies and 3.3 percent for all countries.
6
placed the ruling Front de Liberation Nationale under his personal control, replacing party
officials with veterans of the independence war (Owen, 1992, p. 258). In the mid-1970s,
he made efforts to build up the party as a vehicle of political mobilization, which required
delegating authority to party members and rewarding them for their success in mobilizing
support. This late effort at institutionalization ended with his death in 1979, when his suc-
cessor, Chadli Ben Jalid, assumed the power to appoint members of the political bureau
(abandoning internal party elections) and reduced the number of party commissions from 11
to 5 (Owen, 1992, p. 259). Though lucrative oil reserves attracted more private investment
than in East Asia, consistent with our general argument, private investment fluctuated with
the degree of institutionalization of the ruling party, averaging 25.1 percent of GDP from
1971–1975 (before institutionalization), 32.3 percent from 1976–1979 (during institutional-
ization), and 18.6 percent from 1980–1985 (after party institutions were dismantled).
Thus, ruling-party institutionalization can increase the credibility of leader commitments
to regime supporters, creating an environment in which those supporters feel secure enough
to invest. Similar arguments hold for legislatures in autocracies, but only to the degree that
legislators have support bases of their own. Malesky and Schuler (2010) illustrate the mech-
anism using micro-level evidence from Vietnam on the degree to which legislators challenge
the executive. Consistent with our theoretical perspective, local candidates selected in com-
petitive elections are more likely to challenge the performance and policies of central leaders
than are legislators nominated by the central leadership or who who hold non-competitive
seats.
Thus, when leaders allow more competitive legislative elections, as when multiple can-
didates from the ruling party must compete for seats, they essentially require successful
candidates to mobilize citizen support for themselves.3 By then allowing these individuals
3In related work, Blaydes (2008) argues that leaders use elections to ensure that those
with privileged access to rents deliver a share to local constituents sufficient to secure their
election.
7

to assemble in the legislature, leaders facilitate coordination among precisely those individ-
uals who are best able to mobilize support against them.
Three related testable predictions emerge from this discussion. First, countries with
these arrangements should exhibit more private investment, as supporters are presumably
more insulated against leader expropriation. Second, however, the ability of supporters to
act collectively should have a larger effect on domestic private investment than on foreign
direct investment: foreign investors do not typically number among the supporters who
can collectively enforce agreements with the leader, nor are they as likely to enjoy the
personal relationships with party members and legislators that domestic investors have.
Third, expropriation risk (the intervening variable between capacity for collective action and
private investment) should itself be lower when these institutional arrangements are present.
We test these predictions in the remainder of the paper.
3 Measuring Supporters’ Ability to Act Collectively
In this section, we describe three new measures of the ability of a regime’s supporters to act
collectively. The first variable is a proxy for the institutionalization of the ruling party: the
age of the ruling party at the time the leader took office (age of ruling party less leader
years in office), set equal to zero if the expression is negative. The two components are
taken from the 2009 version of the Database of Political Institutions (Beck, et al, 2001); the
largest government party is assumed to be the ruling party. For two related reasons, this
variable reflects the degree to which party members can act collectively. First, parties that
pre-date rulers are more likely to be organized independently of them and thus to impose
greater restraints. Second, and conversely, parties that permit collective action are more
likely to survive ruler transitions and thus to be older than the tenure of any particular
ruler.
With regard to the first rationale, long-lived parties are likely to have been organized
independently of the current leader, rather than created under his aegis. This implies an
organizational capacity independent of the ruler, which may provide members with greater
8

ability to act collectively. Of course, as Geddes (2008) describes (and following the discus-
sion of the Ba’ath Party above), leaders may take over pre-existing parties and erase any
semblance of independence. To the extent that is the case, however, this should create a bias
against finding a relationship between ruling-party institutionalization and private invest-
ment. Similarly, if a ruler established a personalized (not institutionalized) party before he
took power, that party would be older than the ruler’s tenure in office but not be a vehicle
for collective action by supporters. The presence of such parties in the data also yields a
downwards bias in the estimated association between ruling-party institutionalization and
investment.
At the same time, parties that facilitate collective action by members are likely to survive
leadership changes and thus be older than the current ruler. A simple model illustrates this
logic. Assume a selectorate of S individuals, of whom W belong to a ruling party that has
just lost its leader, where W < S2. At the time of the ruler’s death, an infinitely divisible
resource is divided equally among the W party members. One member of the ruling party—
a new leader—is chosen at random to propose a new allocation among the S selectors,
x = (x1, . . . , xS), where∑
i xi = 1. A proposal needs the agreement of W selectors to pass;
if it fails, the status-quo allocation is implemented. The survival of the ruling party can
be measured by the fraction of the party’s members who are included in the new leader’s
coalition (i.e., who vote for the new leader’s proposal).
Assume first that the members of the ruling party have no capacity for collective action.
Then in any equilibrium, the new leader retains the entire resource for himself, offering
xi = 0 to all other selectors i. All members of the ruling party vote against the proposal,
so other than the new leader there is complete turnover in the ruling coalition (i.e., a new
ruling party replaces the old).
Now assume that if x passes, then any member i of the ruling party for whom xi <1W
can
choose to contest the new allocation. If at least K members contest, where 1 < K < W , then
the status quo allocation is restored; otherwise x is implemented. Then it is an equilibrium
9

for the new leader to offer 1W
to W −K members of the ruling party, each of whom votes for
the proposal, and keep the remainder(
KW
)for himself. (At least K−1 other selectors vote for
the proposal.) Off the equilibrium path, any member who receives less than 1W
contests if at
least K−1 other members also are allocated less than 1W
. The ruling party is institutionalized
both in the sense that contestation is possible in principle (i.e., K < W ) and that members
coordinate on contestation if the new leader engages in excessive expropriation. Relative to
the case with no capacity for collective action, there is greater survival of the ruling party,
in the sense that more party members are included in the new leader’s coalition.
This same logic suggests that when regime supporters can act collectively, leadership
changes are more likely to be the product of decisions made through formal organizations
such as the ruling party. Such transitions are more likely to be regular or orderly. Our
second collective-action variable therefore measures the degree to which, during the entire
non-democratic episode, new leaders enter regularly (regular entry into office). Lead-
ership transitions in non-democracies are regular (regular entry into office equals one) if
the entry variable in the Archigos database (Goemans, et al., 2008) is equal to zero (their
coding for regular entry); our entry variable takes a value of zero (irregular entry) if the
Archigos indicator is coded one (irregular entry) or two (leader imposed by another state).
This variable contrasts, for example, the extremely regular leadership succession under the
Partido Revolucionario Institucional (PRI) in Mexico with irregular leadership transitions
in countries such as Libya. As described, for example, by Magaloni (2006), the early years
of the PRI were characterized by drastic measures to enforce a five-year presidential term
limit. The first PRI president, who sought to exceed his five-year term, was assassinated;
after that, leadership transitions were entirely regular. Although collective action by party
members was largely off the equilibrium path once party rule was institutionalized, the threat
of coordinated behavior served to enforce the five-year rule.
Finally, previous research has only compared non-democracies with and without legisla-
tures. However, as discussed in the previous section, ruler commitments to supporters who
10

convene in legislatures should be more credible to the extent that legislators are allowed
to mobilize support for themselves through elections. The Legislative Index of Electoral
Competitiveness (LIEC) from the Database of Political Institutions is well-suited to differ-
entiating among legislatures with and without the support of private constituencies. We use
this index, which takes values from one to seven, to construct two dummy variables. The
first (legislature) takes a value of one when the average value of LIEC is greater than 1.5,
and zero otherwise; this captures the presence of any legislature. The second (legislature,
competitive elections) is nested in the first, taking a value of one when the average value of
LIEC is greater than 3.5, and zero otherwise. Relative to the first indicator, the second vari-
able excludes unelected legislatures and legislatures in which candidates face no competition.
Our prediction is that the estimated effect of the first variable should be indistinguishable
from zero, whereas the second should be positive and significant; that is, non-democracies
with competitively-elected legislators should exhibit greater investment and lower expropri-
ation risk than non-democracies either with no legislatures or with legislatures that are not
competitively elected.
Summary statistics for these and other variables are provided in Table 1. Of the 69
percent of legislatures with competitive elections, 23 percent exhibit elections with multiple
candidates from the ruling party; an additional 11 percent allow candidates from other
parties, none of which compete; a further 23 percent feature candidates from other parties
who do compete, but the ruling party nevertheless controls more than 75 percent of the
seats; and 12 percent result in fewer than 75 percent of the seats controlled by the ruling
party. As we discuss below, our results are robust to excluding nondemocratic episodes in
which the ruling party controls fewer than 75 percent of the seats.
4 Empirical Strategy
Our estimating equation is
yi = β0 + β1zi +Xiβ2 + εi.
11

The variable yi is some measure of investment or governance, where i indexes non-democratic
episodes; zi represents any of the variables used to indicate whether the ruler allows sup-
porters to act collectively; Xi is a vector of covariates; εi is an error term; and β0, β1, and
β2 are (vectors of) parameters to be estimated.
We use the Legislative Index of Electoral Competitiveness, discussed in the previous sec-
tion, and its similarly defined companion, the Executive Index of Electoral Competitiveness,
to define the set of non-democratic episodes over which we conduct the analysis. We primar-
ily report results from a definition of non-democracy as a country governed by legislative and
executive leaders who are not both competitively elected in multiparty elections (i.e., either
LIEC or EIEC is less than seven). We check the robustness of our results to two stricter
criteria: both the LIEC and EIEC measures are less than or equal to six, and (at consider-
able cost to sample size) both indexes are less than six. Non-democratic episodes run from
the first year that a country’s Legislative and Executive Indices of Electoral Competitiveness
meet the non-competitiveness criteria to the last year. Dependent and independent variables
are averages over the non-democratic episode.
4.1 Data
The hypotheses tested here concern several dependent variables. The first two, private in-
vestment/GDP and foreign direct investment/GDP, are taken from the World Bank’s
World Development Indicators (WDI) database. The third, domestic private invest-
ment/GDP, is calculated as the difference between these two variables. We use investment
data from 1975, the first year of coverage for the political variables from the Database of
Political Institutions, through 2008, the last year for which investment data are available.
Further below we discuss various issues related to the investment data.
The other key dependent variable is a direct, albeit subjective, measure of leaders’ ability
to make credible commitments. Expropriation risk (available from 1984–1997) is taken
from Political Risk Services’ International Country Risk Guide (ICRG). Larger values of
this widely used variable imply less risk and thus greater ability of leaders to make credible
12
commitments.
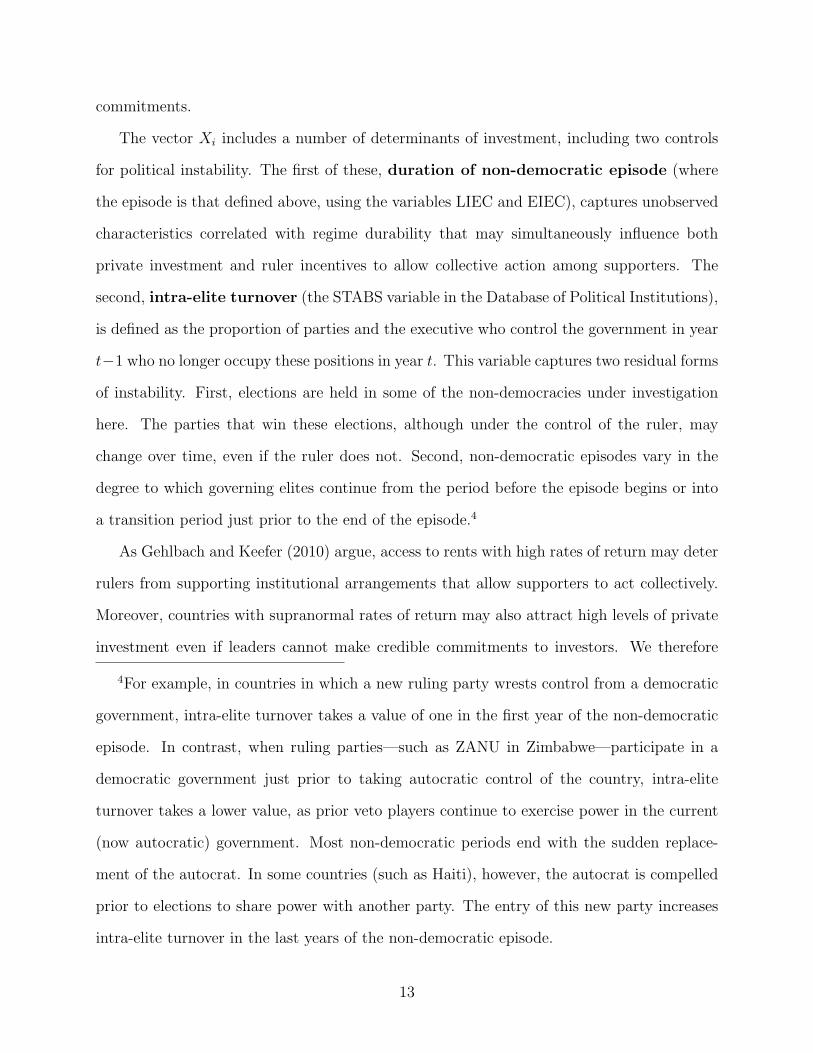
The vector Xi includes a number of determinants of investment, including two controls
for political instability. The first of these, duration of non-democratic episode (where
the episode is that defined above, using the variables LIEC and EIEC), captures unobserved
characteristics correlated with regime durability that may simultaneously influence both
private investment and ruler incentives to allow collective action among supporters. The
second, intra-elite turnover (the STABS variable in the Database of Political Institutions),
is defined as the proportion of parties and the executive who control the government in year
t−1 who no longer occupy these positions in year t. This variable captures two residual forms
of instability. First, elections are held in some of the non-democracies under investigation
here. The parties that win these elections, although under the control of the ruler, may
change over time, even if the ruler does not. Second, non-democratic episodes vary in the
degree to which governing elites continue from the period before the episode begins or into
a transition period just prior to the end of the episode.4
As Gehlbach and Keefer (2010) argue, access to rents with high rates of return may deter
rulers from supporting institutional arrangements that allow supporters to act collectively.
Moreover, countries with supranormal rates of return may also attract high levels of private
investment even if leaders cannot make credible commitments to investors. We therefore
4For example, in countries in which a new ruling party wrests control from a democratic
government, intra-elite turnover takes a value of one in the first year of the non-democratic
episode. In contrast, when ruling parties—such as ZANU in Zimbabwe—participate in a
democratic government just prior to taking autocratic control of the country, intra-elite
turnover takes a lower value, as prior veto players continue to exercise power in the current
(now autocratic) government. Most non-democratic periods end with the sudden replace-
ment of the autocrat. In some countries (such as Haiti), however, the autocrat is compelled
prior to elections to share power with another party. The entry of this new party increases
intra-elite turnover in the last years of the non-democratic episode.
13

control for a country’s natural-resource dependence, using fuel exports/GDP and ore
exports/GDP from the World Development Indicators database.
Finally, we control for various other characteristics that might be correlated with both
our dependent variables and our measures of capacity for collective action. These include
the following demographic characteristics: percent population ≤ 15 years old, percent
population rural, and total population. The land area of a country is also relevant, as
all else equal, a larger area raises the infrastructure requirements to serve a country’s markets.
Income per capita (in purchasing power parity-adjusted, 2000 US dollars) captures not
only the purchasing power of a country’s consumers but also its capital stock: the larger
the capital stock, the lower is the marginal return to investment. All of these variables are
taken from the World Development Indicators database. Last, social fractionalization also
might influence investor’s incentives to invest (for example, to the extent that inter-ethnic
contracts are more costly to enforce). We control for this possibility using the three measures
of social fractionalization provided by Alesina, et al. (2002).
4.2 Identification
In principle, both selection bias and omitted-variable bias could undermine our results.
With respect to selection bias, longer episodes could be systematically different than shorter
episodes, and (unobserved) differences between the two could drive an association between
our measures of collective action and investment. For several reasons, however, this is unlikely
to be the case. As discussed above, we control for episode duration, and in any event,
our measures of capacity for collective action are in general not systematically related to
episode length. By construction, party age less ruler years in office is constant during a
non-democratic episode until the ruler changes, at which point it takes on a new value that
could be higher (if the new ruler is from the same party) or lower (e.g., if the new ruler has
no party). Within our sample, the correlation between this variable and episode duration
is -0.01, as is the correlation between regular entry into office and episode duration; the
correlation between legislature with competitive elections and episode duration is slightly
14

higher, at 0.14. Further, as we discuss below, our results are robust to dropping non-
democratic episodes lasting five or fewer years; they would not be robust if they were driven
by the difference between shorter and longer episodes.
Similarly, again for several reasons, omitted-variable bias is unlikely to drive our results.
Where omitted-variable bias is severe, estimates tend not to be stable across numerous spec-
ifications, but the estimates reported below are quite robust to changes in the set of control
variables. In addition, most omitted variables that could plausibly create an association be-
tween collective action and investment should have this effect for all types of investment. As
predicted, however, the estimated effects of collective action differ sharply between domestic
private and foreign direct investment. Finally, the most theoretically plausible unobserved
influences should operate through political instability. As we show below, however, there
is no significant effect on investment of observed regime characteristics related to stability
(duration of non-democratic episode and intra-elite turnover).
These considerations notwithstanding, as an additional check for endogeneity, we also
estimate the effects of the the first two collective-action variables by two-stage least squares.
We instrument party age less ruler years in office and regular entry into office, in turn, on a
dummy variable equal to one if the country’s executive in the first year of the non-democratic
period is an active-duty military officer. (We cannot adopt this approach in the legislature
regressions, as we have two potentially endogenous variables but only one instrument.) The
theoretical justification for this variable emerges from several arguments in the literature.
Gehlbach and Keefer (2009) argue that dictators who come to power with the backing of
the military require less popular support to remain in power and are therefore less likely
to promote private investment by allowing supporters to organize. Geddes (2008) makes
this point explicitly: ruling parties are likely to be loosely organized when the autocrat is
a military leader. Similarly, Wright (2008) provides evidence that the incentives to create
binding constraints—in his case, legislatures rather than parties—may be lower for military
than for non-military dictatorships.
15

The instrument is a robust predictor of both the party-age and regular-entry proxies for
supporter collective action, with precisely estimated, substantively large, negative effects on
both variables in first-stage regressions.5 As to whether the instrument satisfies the exclusion
restriction—government by a military ruler should not affect private investment or gover-
nance except through its effect on the ability of supporters to organize collectively—it should
be noted that the sample includes not only Augusto Pinochet of Chile but also leaders like
Jerry Rawlings of Ghana and Samuel Doe of Liberia who emerged from poorly disciplined
militaries. Nonetheless, if (contrary to the exclusion assumption) military leadership were
systematically associated with well-organized militaries that were better able to attract in-
vestment, then the exclusion of the military instrument from the second stage would bias
upward the estimated effect of the collective-action variables on investment. Although the
instrument would be invalid in this case, the resulting bias would nevertheless be consis-
tent with the broad thrust of the arguments here—that is, an institutionalized support base
(whether in the party, legislature, or military) should encourage investment.
Two other issues arise in connection with identification. First, given that the underly-
ing data are country-year observations, it is natural to consider a panel specification that
controls for unobserved time-invariant characteristics with episode fixed effects, rather than
the cross-section specification that we employ. By construction, however, our measure of
ruling-party institutionalization (party age less ruler years in office) exhibits little within-
episode variation, potentially changing value only when there is a change in ruler. In fact,
most episodes only have one ruler; in a fixed-effects specification, such episodes would pro-
vide no information with which to estimate the effect of ruling-party institutionalization
5We explored numerous other instruments that are not as theoretically motivated as the
military instrument, but that are commonly used in the literature on regime type. None of
these—ranging from latitude and fraction of the population that speaks English, to settler
mortality in countries that have a colonial history, to whether the ruler died in office—are
strong instruments (i.e., predict the specific institutions that promote collective action).
16

on investment or governance. Similarly, our measure of regular entry into office varies little
within episodes, and half of the episodes exhibit no change in the legislature variables. These
practical concerns aside, our argument is not that increases in the values of these variables
reflect a contemporaneous increase in capacity for collective action. Rather, it is that previ-
ous decisions to facilitate collective action allow these variables to take higher values when
there is a change in leadership (typically at the start of the non-democratic episode). Thus,
a cross-section specification is most appropriate.
Second, already-organized citizens could compel leaders to create institutions that further
facilitate collective action. Gandhi and Przeworski (2006) implicitly make this point in their
discussions of Jordan and Poland. If these citizens also happen to be investors (because
they are organized), then investment could “cause” higher values of our collective-action
variables. This possibility is consistent, however, with our argument that leaders can make
more credible commitments to groups capable of collective action. In a sense, it is immaterial
whether leaders choose to allow groups to organize or whether they have organized without
the leaders’ consent. In any event, our instrumental-variable strategy also serves as a check
for this form of endogeneity.
5 Private Investment and the Institutionalization of Collective Action
5.1 Baseline results
In this section we present the estimated effects on investment of our three measures of
institutionalized capacity for collective action: ruling-party institutionalization (party age
less ruler years in office), the regularity of leader entry into office, and the competitiveness
of legislative elections. Table 2 displays the results for ruling-party institutionalization,
reporting estimated coefficients and heteroskedasticity-robust standard errors corrected to
allow for clustering across episodes within countries.
Consistent with the foregoing discussion, the OLS estimates indicate that a 16-year (one
standard deviation) increase in ruling party age less ruler years in office is associated with
17

a statistically significant and substantively large increase in private investment of 1.8 per-
cent of GDP (over one-quarter of the standard deviation of that variable). The results are
slightly stronger for domestic private investment. In the instrumental-variable regressions
the estimated magnitude of these effects is nearly three times greater, consistent with the
real possibility that the party-age variable measures ruling-party institutionalization with
error, thus attenuating the OLS estimates.
In contrast, when foreign direct investment is the dependent variable, the estimated
effect of ruling-party institutionalization is insignificant in both regressions.6 Autocratic
institutions that protect domestic investors appear not to affect FDI significantly. This
result complements a large literature on the effect of regime type on FDI. Jensen (2006),
for example, finds that democratic institutions, which presumably protect most investors,
significantly attract multinational investment and reduce expropriation risk. Our findings
suggest that the logic of expropriation risk in autocracies may be different.7
In the first stage of all of the IV regressions, the estimated effect of the military-leader
instrument is significant at better than a one-percent level and substantively large: if the
first ruler in a non-democratic episode is a military officer, the party-age variable is ten years
lower than would otherwise be the case. The first-stage F -statistic is approximately 9 in
6By construction, the right-hand side variables should have smaller coefficients in the
FDI than in the total-investment equations, as FDI is a subcomponent of total investment.
This does not explain our results, however: the collective-action coefficients are much less
precisely estimated in the FDI equation, and for the instrumental-variables specification,
the estimated coefficient in the FDI regression is much smaller than can be explained by the
share of FDI in total investment.
7The results in this and the following table are robust to inclusion of the Chinn-Ito
measure of capital-account openness (Chinn and Ito, 2007). As is to be expected, this
variable is a significant determinant of foreign direct investment (only), but it is almost
completely uncorrelated with our collective-action measures.
18

the first and third regressions, exceeding the Stock-Yogo critical value for weak instruments
(Stock and Yogo, 2005); it is slightly lower (7.6) in the second.
Table 3 summarizes results from regressions analogous to those in Table 2, substitut-
ing the other two collective-action variables: regular entry of rulers during the nondemo-
cratic episode and the competitiveness of legislative elections. Again consistent with our
predictions, regular entry is associated with greater total private and domestic private
investment—the estimated effect on the latter variable is insignificant but large in the
instrumental-variable regression—but not with greater foreign direct investment. Further,
non-democracies with competitive legislative elections outperform other autocracies in at-
tracting investment: total private and domestic private investment is approximately four
percentage points of GDP greater than in autocracies with non-competitively elected leg-
islatures. In contrast, there is only a small (positive) and insignificant difference between
autocracies with non-competitive legislatures and those with no legislatures at all, which
supports the argument that only legislators able to mobilize support can impose constraints
on rulers.
5.2 Robustness
The results in Tables 2 and 3 are robust to numerous changes in sample and specification.
With respect to sample, a first important question is whether the results are sensitive to
the definition of non-democracy. The definition used in Tables 2 and 3 is typical in the
literature: countries in which either the legislature or the autocrat are not competitively
elected in multiparty elections. This definition identifies 104 nondemocratic episodes in the
first specification in Table 2 (missing values result in fluctuating sample sizes from regression
to regression). Alternatively, one could define non-democracies as those in which both LIEC
and EIEC are less than or equal to six, where six means that multiparty elections are held
but the winning candidate/party receives more than 75 percent of the vote/seat share; 80
nondemocratic episodes meet this definition. Most strictly still, confining attention only to
countries in which both LIEC and EIEC are less than six yields 55 nondemocratic episodes,
19

a reduction from the most generous definition of approximately one-half.
All of the qualitative results related to ruling-party institutionalization and regular entry,
with the exception of party age in the domestic-private-investment OLS regression (still pos-
itive but substantially smaller and insignificant), are robust to the first alternative definition
of non-democracy. The results for competitive legislative elections are somewhat more am-
biguous: autocracies with competitively elected legislatures significantly outperform those
with no legislatures (those with non-competitive legislatures do so only for domestic pri-
vate investment), but there is no significant difference between autocracies with competitive
and non-competitive legislatures (though the estimated difference is positive). The pat-
tern reverts to that in the original sample with the strictest definition: autocracies with
competitively elected legislatures attract significantly more investment than those with non-
competitive legislatures. Further, despite the greatly reduced sample size, the results for
regular entry are fully robust to the strictest definition of non-democracy. Finally, although
insignificant, the estimated coefficients on party age less leader years in office are similar in
magnitude in the smallest sample to those in Table 2 for all specifications but the first.
The regressions summarized in Table 4 demonstrates that the estimated relationships are
robust to a large number of other sample and specification changes. For ease of presentation,
we report robustness checks only for the estimates in the first column of Tables 2 and 3: the
OLS regression of private investment on the institutional variables. The first row repeats
the baseline results for easy reference. A glance at the table shows that these results are
highly robust, with both significance levels and parameter estimates very similar to those in
Tables 2 and 3.
The second and third rows in Table 4 presents results from bivariate regressions, using
first the sample of all non-democratic episodes and then the smaller samples on which the
estimates in Tables 2 and 3 are based. In both rows, the estimated effects are very precisely
estimated, with parameter estimates close to those in the baseline regressions (especially so
with the restricted sample).
20

The results are also robust to adding controls for continent fixed effects, as reported in
the fourth row of Table 4. Again, the parameter estimates vary little from those reported
in Tables 2 and 3. The baseline estimates are also robust to the inclusion of the Frankel-
Romer Trade Index (the fifth row of Table 4), which captures the degree to which a county’s
geographic and other attributes give it inherent advantages in international trade, thus
raising returns to investors (Frankel and Romer 1999).
Sample sizes vary substantially across the FDI and private -investment samples, flowing
from the fact that the two investment series are assembled from different sources and through
different methodologies. The sixth row of Table 4 shows that this difference in samples does
not drive the results: the estimated effects of the collective-action variables are similar to
those in the first row.
The seventh row demonstrates that influential outliers are not responsible for the results
reported in Tables 2 and 3. On the contrary, estimates from “robust regressions” are quite
similar to our baseline estimates, though here there is a significant difference not only between
having a legislature with competitive and non-competitive elections, respectively, but also
between having a legislature with non-competitive elections and no legislature.8
Collective-action problems are more severe as group size increases. The same should
apply to countries: regime supporters in large countries should confront more severe collective
action problems than those in small countries. Although our baseline specification includes a
control for population, there may also be interaction effects with our institutional variables.
To see if heterogeneity between large and small countries drives our results, we therefore
exclude all non-democratic episodes in countries with a population of less than one million,
reducing sample sizes by between 10 and 15 percent. The estimates in the eighth row show
that our results are not influenced by the inclusion of very small countries.
Nor, as the ninth row demonstrates, are the results influenced by the presence in the
8We use the rreg command in Stata, with a biweight tuning constant of 6. The estimated
coefficient on legislature is 4.920, with a standard error of 1.776.
21

sample of a very large country, China. As discussed below, China’s investment data were
subject to a significant revision in the World Development Indicators data, so it is especially
relevant to ask whether our estimates are robust to inclusion of a China dummy. They are.
The specifications in Tables 2 and 3 control for the duration of an autocratic regime,
thereby accounting for unobserved factors correlated with regime durability that might si-
multaneously affect both private investment and ruler incentives to allow collective action
among supporters. An alternative approach, following Besley and Kudamatsu (2008), is to
exclude autocracies that are fewer than five years old from the analysis. The tenth row
of Table 4 demonstrates that our results are robust to this restriction (which reduces the
sample size by approximately 20 percent).
Besley and Kudamatsu (2008) also partition non-democratic episodes into “regimes”
based on changes in three authority characteristics from the Polity IV database (Marshall and
Jaggers, 2006): political competition (POLCOMP), constraints on the executive (XCONST),
and method of chief-executive recruitment (EXREC). POLCOMP and XCONST both sug-
gest some form of institutionalized capacity for collective action, whereas the definition of
EXREC seems to preclude that interpretation.9 Consistent with this reading, the first two
variables are significant predictors of private investment when entered one-by-one in place of
our collective-action measures, whereas the third is not. In any event, the estimated effect of
all three variables drops to insignificance when entered jointly with our collective-action mea-
sures. (The single exception is that POLCOMP exerts a positive, significant effect on private
investment when entered with age of ruling party less leader years in office.) In contrast,
9It is easy to see that EXREC does not distinguish autocracies according to institu-
tionalized capacity for collective action. One component of EXREC, openness of executive
recruitment (XROPEN), gives the same score (four) to any country not governed by some
form of hereditary succession. The other component, competitiveness of executive recruit-
ment (XRCOMP), gives the same score (one) to any country whose leaders are not chosen
in competitive elections.
22

all three collective-action variables robustly predict private investment in these regressions.
The selectorate’s ability to act collectively thus seems to be more precisely measured by the
objective variables introduced in Section 3.10
The World Development Indicators investment data are based on reports from individual
country statistics offices, and changes in criteria used to translate country into WDI cate-
gories can alter reported investment dramatically. In 2007, for example, the World Bank
country office in China retroactively reallocated all investment by SOE-private joint ventures
from 1995–2007 away from private to public investment; this single change reduced reported
private investment by as much as 14 percent of GDP. (Of course, investment by state-owned
enterprises may itself be contingent on whether leaders can make credible commitments to
supporters.) To verify that such decisions are not driving our results, which use investment
data as reported in 2010, we checked robustness to the use of data as reported in 2007 and
2009. The qualitative results are very similar to those reported in Tables 2 and 3. Although
we lose some precision in a few of the instrumental-variable regressions, all of the OLS re-
sults retain significance at conventional levels, and for both sets of regressions the estimated
coefficients are similar in magnitude (sometimes larger, sometimes smaller) to those reported
above. Overall, our results prove quite robust.
6 Governance and the Institutionalization of Collective Action
In this section, we examine the mechanism by which institutionalized capacity for collective
action encourages private investment. To do so, we use the expropriation-risk variable from
the International Country Risk Guide described above. This is the most direct measure
available of whether rulers can credibly commit to not acting opportunistically once invest-
10Besley and Kudamatsu (2008) define autocracies as those countries that score zero or
less on the Polity IV democracy scale (Marshall and Jaggers, 2000). The results in the first
column of Tables 2 and 3 are also robust to removing all autocratic episodes from the sample
with an average score greater than zero on this variable.
23

ments have been made. Unfortunately, the variable captures expropriation risk for both
domestic and foreign investors, so that we cannot distinguish between domestic and foreign
investment as with our previous results. Nonetheless, since we do not expect institutions
that promote collective action among domestic actors to influence the expropriation risk
confronting foreign investors, a significant association between expropriation risk and our
measures of institutions would provide supportive (and conservative) evidence that these
institutions increase private investment by reducing the risk of opportunistic behavior.
Table 5 reports the results of regressions that repeat the specifications in Tables 2 and
3, substituting expropriation risk for the investment variables. As expected, the estimated
effect of the collective-action variables is positive in each case, significantly so in four out of
five regressions. (The estimated difference between autocracies with competitive legislatures
and those with no legislatures is insignificant, as the estimated coefficient on legislature is
negative and large, albeit imprecisely estimated.) The estimated magnitude of the effects is
large: a one-standard-deviation increase in each variable is associated with a reduction in
expropriation risk of between one-fifth and one-half standard deviations.
Earlier results in the literature argue that leaders with longer horizons are more likely
to pursue policies that promote investment and growth (e.g., Clague, et al., 1996; McGuire
and Olson, 1996; and Wright, 2008). The regressions in Table 5, however, like those in
Tables 2 and 3, shift the explanation away from the ruler’s time horizon and toward the
institutional arrangements that allow supporters to act collectively in the event of their
expropriation—that is, the time horizons of the ruler’s supporters.11 One way to see this
informally is to re-estimate the first regression in Table 5, replacing our measure of ruling-
party institutionalization with its component variables: the age of the ruling party and
leader years in office. The estimated effect of both variables is positive and significant,
but the estimated coefficient on party age is more precisely estimated (with p-values of
0.03 and 0.10, respectively). Similarly, including leader years in office jointly with each of
11For a related argument, see Debs (2007).
24

the other collective-action variables does little to change the results reported in the third
and fifth columns of Table 5, whereas the estimated effect of leader years in office is itself
inconsistently significant.
7 Conclusion
How do autocracies solve the problem of credible commitment to investors? The evidence
presented in this paper points to organizational arrangements that facilitate collective action
by regime supporters, allowing them to defend themselves against acts of expropriation.
Three different measures of capacity for collective action—ruling-party institutionalization,
the regularity of ruler entry into office, and the competitiveness of legislative elections—
are positively associated with private investment in non-democracies. Consistent, however,
with the argument that these arrangements benefit domestic but not foreign investors (the
latter have comparatively few opportunities to participate in the politics of the countries
where they invest), foreign direct investment responds little to such institutional differences
across non-democracies. Expropriation risk is also lower in the presence of these institutional
arrangements, again pointing to the conclusion that the threat of opportunistic behavior by
the ruler diminishes when supporters can act collectively.
These findings help to resolve the puzzle of higher investment in some autocracies. At
the same time, they reveal various areas in which further research is needed. Our results
are the first to document a sharply different effect on domestic and foreign investment of
institutions that constrain opportunistic behavior by rulers. Given that foreign investors do
sometimes invest in autocracies, notwithstanding the apparent lack of protection provided
by these institutions, this calls for a better understanding of how foreign direct investment
responds to local political conditions.
The conditions under which rulers permit collective action by supporters are also not
fully understood. As we show, organizational arrangements that allow for collective action
may increase private investment, with consequent direct and indirect benefits to the ruler.
They may also, of course, help the ruler to deal with internal and external aggressors: our
25

identification strategy exploits the fact that the threat posed by such aggressors may be
smaller when the ruler is a military leader. Yet, as our brief discussion of the Middle East in
Section 2 demonstrates, rulers may sacrifice these benefits by imposing barriers to collective
action in various organizations, even in an environment bristling with internal and external
threats. Future work should further explore the tradeoffs that rulers face in deciding whether
to facilitate or discourage collective action.
References
Acemoglu, Daron, and James A. Robinson. 2002. Economic Origins of Dictatorship and
Democracy. New York: Cambridge University Press.
Alesina, Alberto, Arnaud Devleeschauwer, William Easterly, Sergio Kurlat, and Romain
Wacziarg. 2002. “Fractionalization.” Journal of Economic Growth. 8(2):155–94.
Beck, Thorsten, George Clarke, Alberto Groff, Philip Keefer, and Patrick Walsh. 2001. “New
Tools in Comparative Political Economy: The Database of Political Institutions.” World
Bank Economic Review. 15(1):165–176.
Besley, Timothy, and Masayuki Kudamatsu. 2008. “Making Autocracy Work.” In Elhanan
Helpman, ed., Institutions and Economic Performance. Cambridge, MA: Harvard Univer-
sity Press.
Blaydes, Lisa. 2008. “Authoritarian Elections and Elite Management: Theory and Evidence
from Egypt.” Paper presented at the Princeton University Conference on Dictatorships,
April 2008.
Boix, Carles. 2003. Democracy and Redistribution. New York: Cambridge University Press.
———, and Milan Svolik. 2009. “The Foundations of Limited Authoritarian Government:
Institutions and Power-Sharing in Dictatorships.” Mimeo, Department of Political Science,
University of Illinois, Urbana-Champaign.
Brownlee, Jason. 2007. Authoritarianism in an Age of Democratization. New York: Cam-
bridge University Press.
Bueno de Mesquita, Bruce, James Morrow, Randolph Siverson, and Alistair Smith. 2003.
26

The Logic of Political Survival. Cambridge, MA: MIT Press.
Chinn, Menzie David, and Hiro Ito. 2007. “A New Measure of Financial Openness.” Mimeo,
La Follette School of Public Affairs, University of Wisconsin.
Clague, Christopher, Philip Keefer, Stephen Knack, and Mancur Olson. 1996. “Property
and Contract Rights under Democracy and Dictatorship.” Journal of Economic Growth.
1(2):243–276.
Debs, Alexandre. 2007. “Political Strength and Economic Efficiency in a Multi-Agent State.”
Mimeo, Department of Political Science, Yale University.
Frankel, Jeffrey, and David Romer. 1999. “Does Trade Cause Growth?” American Economic
Review. 89(3):379–399.
Gandhi, Jennifer. 2008. Political Institutions under Dictatorship. New York: Cambridge
University Press.
———, and Adam Przeworski. 2006. “Cooperation, Cooptation, and Rebellion Under Dic-
tatorships.” Economics and Politics 18(1):1–26.
Geddes, Barbara. 2008. “Party Creation as an Autocratic Survival Strategy.” Mimeo, De-
partment of Political Science, UCLA.
Gehlbach, Scott, and Philip Keefer. 2010. “Investment Without Democracy: Ruling-Party
Institutionalization and Credible Commitment in Autocracies.” Mimeo, Department of
Political Science, University of Wisconsin.
Goemans, H. E., Kristian Skrede Gleditsch, and Giacomo Chiozza. 2008. “Archigos: A
Data Set on Leaders: 1875 - 2004, Version 2.9.” Mimeo, Department of Political Science,
University of Rochester.
Haber, Stephen, Armando Razo, and Noel Maurer. 2003. The Politics of Property Rights:
Political Instability, Credible Commitments, and Economic Growth in Mexico, 1876-1929.
New York: Cambridge University Press.
Jensen, Nathan M. 2006. Nation-States and the Multinational Corporation: A Political Econ-
omy of Foriegn Direct Investment. Princeton, NJ: Princeton University Press.
27
Magaloni, Beatriz. 2006. Voting for Autocracy: The Politics of Party Hegemony and its
Demise. New York: Cambridge University Press.
Malesky, Edmund, and Paul Schuler. 2010. “Nodding or Needling: Analyzing Delegate Re-
sponsiveness in an Authoritarian Parliament.” American Political Science Review. Forth-
coming.
Marshall, Monty G., and Keith Jaggers. 2006. “Polity IV Project: Political Regime Charac-
teristics and Transitions, 1800–1999.” Integrated Network for Societal Conflict Research
Program, University of Maryland, College Park.
McGuire, Martin C., and Mancur Olson, Jr. 1996. “The Economics of Autocracy and Ma-
jority Rule: The Invisible Hand and the Use of Force.” Journal of Economic Literature.
34(1):72–96.
North, Douglass C., and Barry R. Weingast. 1989. “Constitutions and Commitment: The
Evolution of Institutions Governing Public Choice in Seventeenth-Century England.”
Journal of Economic History. 49(4):803–832.
Owen, Roger. 1992. State, Power and Politics in the Making of the Modern Middle East.
London: Routledge.
Shirk, Susan L. 1993. The Political Logic of Economic Reform in China. Berkeley: University
of California Press.
Stock, J. H., and M. Yogo. 2005. “Testing for Weak Instruments in Linear IV Regression.” In
Identification and Inference for Econometric Models: Essays in Honor of Thomas Rothen-
berg, D. W. K. Andres and J. H. Stock, eds. New York: Cambridge University Press.
Whiting, Susan H. 2006. Power and Wealth in Rural China: The Political Economy of
Institutional Change. New York: Cambridge University Press.
Wintrobe, Ronald. 2000. The Political Economy of Dictatorship. New York: Cambridge
University Press.
Wright, Joseph. 2008. “Do Authoritarian Institutions Constrain? How Legislatures Affect
Economic Growth and Investment.” American Journal of Political Science. 52(2):322-343.
28
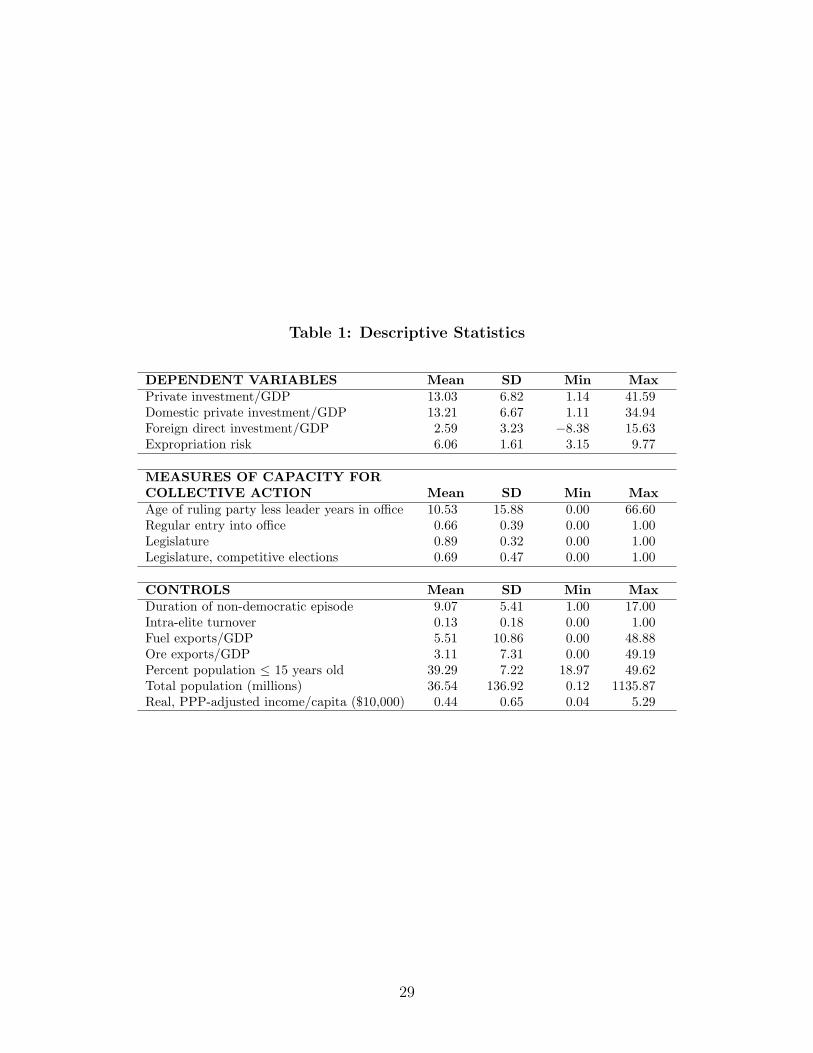
Table 1: Descriptive Statistics
DEPENDENT VARIABLES Mean SD Min MaxPrivate investment/GDP 13.03 6.82 1.14 41.59Domestic private investment/GDP 13.21 6.67 1.11 34.94Foreign direct investment/GDP 2.59 3.23 −8.38 15.63Expropriation risk 6.06 1.61 3.15 9.77
MEASURES OF CAPACITY FORCOLLECTIVE ACTION Mean SD Min MaxAge of ruling party less leader years in office 10.53 15.88 0.00 66.60Regular entry into office 0.66 0.39 0.00 1.00Legislature 0.89 0.32 0.00 1.00Legislature, competitive elections 0.69 0.47 0.00 1.00
CONTROLS Mean SD Min MaxDuration of non-democratic episode 9.07 5.41 1.00 17.00Intra-elite turnover 0.13 0.18 0.00 1.00Fuel exports/GDP 5.51 10.86 0.00 48.88Ore exports/GDP 3.11 7.31 0.00 49.19Percent population ≤ 15 years old 39.29 7.22 18.97 49.62Total population (millions) 36.54 136.92 0.12 1135.87Real, PPP-adjusted income/capita ($10,000) 0.44 0.65 0.04 5.29
29

Table
2:
Ruli
ng-P
art
yIn
stit
uti
onali
zati
on
and
Invest
ment
Pri
vate
Dom
.pri
vate
Pri
vate
Dom
.pri
vate
inve
st./
GD
Pin
vest
./G
DP
FD
I/G
DP
inve
st./
GD
Pin
vest
./G
DP
FD
I/G
DP
(OL
S)(O
LS)
(OL
S)(I
V)
(IV
)(I
V)
Age
ofru
ling
part
yle
ss0.
114∗
∗∗0.
130∗
∗∗0.
033
0.31
7∗0.
326∗
0.04
3le
ader
year
sin
office
(0.0
34)
(0.0
33)
(0.0
20)
(0.1
69)
(0.1
82)
(0.0
68)
Dur
atio
nof
non-
0.06
1−
0.04
10.
049
0.10
40.
019
0.05
4de
moc
rati
cep
isod
e(0
.148
)(0
.138
)(0
.082
)(0
.181
)(0
.164
)(0
.099
)In
tra-
elit
etu
rnov
er1.
912
3.40
8−
0.57
35.
062
6.74
7−
0.32
9(4
.830
)(6
.102
)(2
.095
)(4
.777
)(6
.254
)(3
.203
)Fu
elex
port
s/G
DP
0.11
80.
175∗
∗0.
085∗
0.20
30.
278∗
0.08
9(0
.103
)(0
.084
)(0
.044
)(0
.142
)(0
.145
)(0
.057
)O
reex
port
s/G
DP
−0.
106∗
−0.
054
0.05
5∗∗
−0.
151∗
−0.
115
0.05
5∗∗
(0.0
62)
(0.1
02)
(0.0
25)
(0.0
80)
(0.1
05)
(0.0
25)
Per
cent
popu
lati
on≤
15−
0.37
6∗∗∗
−0.
424∗
∗∗−
0.12
6∗∗
−0.
395∗
∗∗−
0.49
0∗∗∗
−0.
130∗
∗
year
sol
d(0
.111
)(0
.100
)(0
.053
)(0
.126
)(0
.118
)(0
.059
)T
otal
popu
lati
on−
0.01
0∗−
0.01
8∗∗∗
−0.
003
−0.
014
−0.
027∗
∗−
0.00
3(m
illio
ns)
(0.0
06)
(0.0
05)
(0.0
03)
(0.0
10)
(0.0
12)
(0.0
06)
Rea
l,P
PP
-adj
uste
d−
1.73
1∗−
4.48
8∗∗
−1.
601∗
−2.
759
−7.
698∗
−1.
660
inco
me/
capi
ta($
10,0
00)
(0.9
97)
(1.9
26)
(0.8
38)
(1.7
66)
(4.2
53)
(1.0
01)
Obs
erva
tion
s10
494
112
104
9411
2R
-squ
ared
0.29
0.36
0.18
Not
es:
All
regr
essi
ons
cont
rol
for
perc
ent
popu
lati
onru
ral,
land
area
,an
dth
ree
mea
sure
sof
soci
alfr
acti
onal
izat
ion;
none
ofth
ese
esti
mat
edeff
ects
issi
gnifi
cant
inan
ysp
ecifi
cati
on.
Con
stan
tsno
tre
port
ed.
The
inst
rum
ent
inth
eIV
regr
essi
ons
isan
indi
cato
rfo
rw
heth
erth
efir
stru
ler
ina
non-
dem
ocra
tic
epis
ode
isa
mili
tary
lead
er.
Inpa
rent
hese
s,he
tero
sked
asti
city
-rob
ust
stan
dard
erro
rsco
rrec
ted
for
clus
teri
ngof
epis
odes
wit
hin
coun
trie
s.**
*p
<0.
01,
**p
<0.
05,
*p
<0.
10.
30

Table
3:
Regula
rE
ntr
yin
toO
ffice
,L
egis
lati
ve
Ele
ctio
ns,
and
Invest
ment
Pri
vate
Dom
.pri
vate
Pri
vate
Dom
.pri
vate
inve
st./
GD
Pin
vest
./G
DP
FD
I/G
DP
inve
st./
GD
Pin
vest
./G
DP
FD
I/G
DP
(OL
S)(O
LS)
(OL
S)(I
V)
(IV
)(I
V)
Reg
ular
entr
yin
to4.
272∗
∗4.
386∗
∗0.
193
6.21
2∗5.
402
0.75
7offi
ce(1
.830
)(1
.864
)(0
.735
)(3
.610
)(3
.319
)(1
.515
)O
bser
vati
ons
9789
104
9789
104
R-s
quar
ed0.
280.
340.
21L
egis
latu
re1.
916
1.88
60.
298
(2.1
26)
(2.4
21)
(0.9
43)
Leg
isla
ture
,co
mpe
t-4.
285∗
∗∗3.
875∗
∗∗0.
832
itiv
eel
ecti
ons
(1.0
54)
(1.0
87)
(0.8
26)
Obs
erva
tion
s10
696
114
R-s
quar
ed0.
330.
370.
17
Not
es:
Eac
hen
try
repo
rts
the
esti
mat
edeff
ect
ofei
ther
regu
lar
entr
yor
the
legi
slat
ure
vari
able
son
the
indi
cate
din
vest
men
tva
riab
lefr
oma
sepa
rate
regr
essi
on.
The
spec
ifica
tion
sar
eot
herw
ise
iden
tica
lto
thos
ere
port
edin
Tab
le2.
The
inst
rum
ent
inth
eIV
regr
essi
ons
isan
indi
cato
rfo
rw
heth
erth
efir
stru
ler
ina
non-
dem
ocra
tic
epis
ode
isa
mili
tary
lead
er.
Inpa
rent
hese
s,he
tero
sked
asti
city
-rob
ust
stan
dard
erro
rsco
rrec
ted
for
clus
teri
ngof
epis
odes
wit
hin
coun
trie
s.**
*p
<0.
01,
**p
<0.
05,
*p
<0.
10.
31

Table 4: Robustness of the Estimates in Tables 2 and 3
CompetitiveDependent variable: Party Regular legislativePrivate investment/GDP age entry electionsCoefficients from Tables 0.114∗∗∗ 4.272∗∗ 4.285∗∗∗
2 and 3 (0.034) (1.830) (1.054)
Drop all controls (bivariate 0.061∗ 4.849∗∗∗ 5.258∗∗∗
regressions) (0.033) (1.282) (1.167)
Bivariate regressions, with sample 0.099∗∗∗ 5.594∗∗∗ 4.935∗∗∗
from Tables 2 and 3 (0.035) (1.545) (1.232)
Add continent dummies 0.096∗∗ 4.329∗∗ 4.232∗∗∗
(0.038) (1.731) (1.120)
Add log of Frankel-Romer 0.119∗∗∗ 4.001∗∗ 4.243∗∗∗
Trade Index (0.037) (1.952) (1.204)
FDI sample 0.130∗∗∗ 3.762∗∗ 3.935∗∗∗
(0.034) (1.791) (1.051)
Robust regression (under-weight 0.124∗∗∗ 3.631∗∗ 4.238∗∗∗
influential outliers) (0.036) (1.611) (1.056)
Exclude countries with population 0.135∗∗∗ 4.273∗∗∗ 4.209∗∗∗
under 1 million (0.034) (1.547) (0.960)
Add China dummy 0.127∗∗∗ 4.124∗∗ 4.204∗∗∗
(0.032) (1.869) (1.084)
Exclude non-democratic 0.116∗∗∗ 4.678∗∗ 4.834∗∗∗
episodes ≤ 5 years (0.031) (1.807) (1.114)
Note: Each cell represents the estimated effect of the particular collective-action variable on private investment from a separate OLS regression.Other than the given modification, both sample and specification are iden-tical to those in the first column of Tables 2 and 3. “Continents” defined asSouth Asia, East Asia, Africa, Middle East, and Latin America. In paren-theses, heteroskedasticity-robust standard errors corrected for clusteringof episodes within countries. *** p < 0.01, ** p < 0.05, * p < 0.10.
32
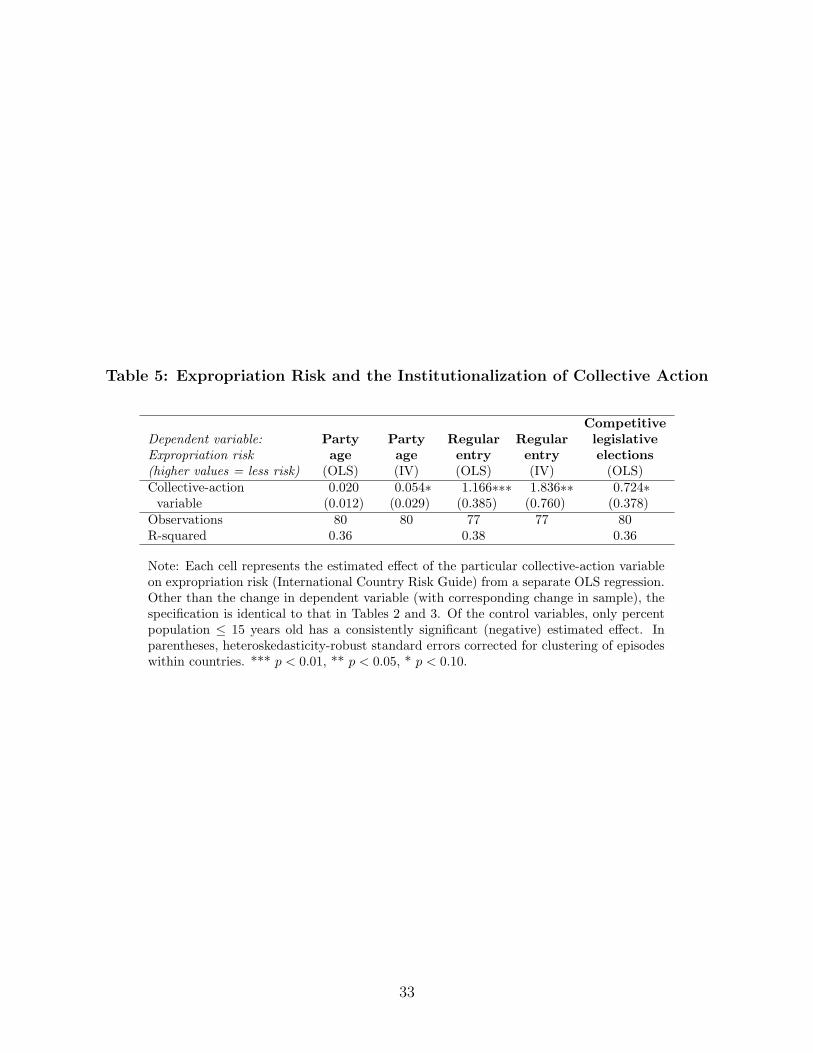
Table 5: Expropriation Risk and the Institutionalization of Collective Action
CompetitiveDependent variable: Party Party Regular Regular legislativeExpropriation risk age age entry entry elections(higher values = less risk) (OLS) (IV) (OLS) (IV) (OLS)Collective-action 0.020 0.054∗ 1.166∗∗∗ 1.836∗∗ 0.724∗
variable (0.012) (0.029) (0.385) (0.760) (0.378)Observations 80 80 77 77 80R-squared 0.36 0.38 0.36
Note: Each cell represents the estimated effect of the particular collective-action variableon expropriation risk (International Country Risk Guide) from a separate OLS regression.Other than the change in dependent variable (with corresponding change in sample), thespecification is identical to that in Tables 2 and 3. Of the control variables, only percentpopulation ≤ 15 years old has a consistently significant (negative) estimated effect. Inparentheses, heteroskedasticity-robust standard errors corrected for clustering of episodeswithin countries. *** p < 0.01, ** p < 0.05, * p < 0.10.
33