prithwiraj choudhury and tarun khanna q1 · prithwiraj choudhury and tarun khanna q1 charting...
TRANSCRIPT

Prithwiraj Choudhury and Tarun KhannaQ1
Charting Dynamic Trajectories: MultinationalEnterprises in India
In this article, we provide a synthesizing framework that we callthe “dynamic trajectories” framework to study the evolution ofmultinational enterprises (MNEs) in host countries over time.We argue that a change in the policy environment in a hostcountry presents an MNE with two sets of interrelateddecisions. First, the MNE has to decide whether to enter, exit,or stay in the host country at the onset of each policy epoch;second, conditional on the first choice, it has to decide on itslocal responsiveness strategy at the onset of each policyepoch. India, which experienced two policy shocks—shuttingdown to MNEs in 1970 and then opening up again in 1991—offers an interesting laboratory to explore the “dynamic trajec-tories” perspective. We collect and analyze a unique dataset ofall entry and exit events for Fortune 50 and FTSE 50 firms (asof 1991) in India in the period from 1858 to 2013 and, addition-ally, we document detailed case studies of four MNEs (thatarguably represent outliers in our sample).
In a report published in November 2012, Computerworld reportedthat IBM’s India workforce likely exceeded the size of the U.S. IBM
workforce.1 Earlier, in March 2009, IBMwas in the news for outsourcingthousands of technology jobs from the United States to India. Business-Week reported that the worldwide workforce at IBM went from 386,558at the end of 2007 to 398,000 at the end of 2008. But U.S. IBM employ-ment fell from 121,000 to 115,000 during the same time. These develop-ments were ironic for a firm that was asked to leave India in 1977 becauseit refused to comply with local regulations. IBM’s exit from India and
S000768051300144Xjra pp: 1–38 Techset Composition Ltd, Salisbury, U.K. 2/15/2014
The authors wish to thank Mohit Agarwal for his help as a research analyst on this project.1 Patrick Thibodeau, “In a Symbolic Shift, IBM’s India Workforce Likely Exceeds U.S.,”
Computerworld, 29 Nov. 2012, available athttp://www.computerworld.com/s/article/9234101/In_a_symbolic_shift_IBM_s_India_workforce_likely_exceeds_U.S.; Web siteaccessed on 26 July 2013.
Business History Review 88 (Spring 2014): 1–38. doi:10.1017/S000768051300144X© 2014 The President and Fellows of Harvard College. ISSN 0007-6805; 2044-768X (Web).
1
2
3
4
5
6
7
8
9
10
11
12
13
14
15
16
17
18
19
20
21
22
23
24
25
26
27
28
29
30
31
32
33
34
35
36
37
38
39
40
41
422
43
subsequent reentry was in stark contrast to the continued presence inIndia of multinationals such as Unilever and British American Tobacco(BAT).
In this article, we develop a historical perspective on the policyregime change related to multinationals in India and describe, usingboth time series and across-home-country variation, the differentreactions of multinational enterprises (MNEs) to the same policyevents. We analyze the events through two epochs—India shuttingdown to MNEs in the 1970s and reopening to MNEs in 1991 (i.e., 1991onward)—and develop insights into how multinationals chart varieddynamic trajectories during these two epochs. We argue that for anMNE, such a change in policy environment represents two sets ofdecisions. First, the MNE had to decide whether to exit or stay in Indiain the 1970s and then whether or not to reenter in the 1990s (conditionalon exiting in the 1970s). Second, at the onset of each policy epoch, theMNE had to decide on continuity or change in its local responsivenessstrategy, represented by investments in the input side (manufacturingplants, plantations, trademarks, patents, and talent), output side (func-tional focus, product mix, pricing, distribution, etc.), and host countrygovernment relationships. We also argue that both the direction (i.e.,what lever the MNE uses to change local responsiveness: investmentin physical, intellectual, or human capital or modifications in functionalfocus and product mix) and the degree (i.e., the extent) of change in localresponsiveness are endogenous to the decision to stay/exit/enter. As anexample, if an MNE decides to stay at the onset of a negative policyepoch, it might decide to focus on changing its local responsiveness strat-egy on the input side and concentrate less on drastically changing theproduct or functional mix for reasons of continuity. However, if theMNE follows an exit/reenter strategy, it might be able to drasticallyalter its functional and product mix on reentry after several decades,as there are fewer concerns about continuity with the passage of time.Investments in the input side also generate employment—a lever usedto navigate difficult government negotiations.
Given these strategic choices to be made at the onset of both policyepochs, MNEs have a choice of decisions, leading to possible dynamictrajectories in the host country. We will detail this “dynamic trajectories”framework later. We also collect and analyze a unique dataset of all entryand exit events for Fortune 50 and FTSE 50 firms in India in the periodfrom 1858 to 2013 and, additionally, we document four detailed casestudies of Anglo-Dutch, British, and American MNEs to develop thedynamic trajectories perspective. The four case studies, developedusing archival and other data gathered from multiple sources, such asLinkedIn, arguably represent extremes in our sample. While the two
Prithwiraj Choudhury and Tarun Khanna / 2
44
45
46
47
48
49
50
51
52
53
54
55
56
57
58
59
60
61
62
63
64
65
66
67
68
69
70
71
72
73
74
75
76
77
78
79
80
81
82
83
84
852
86

European multinationals, Unilever and BAT, followed a well-crafted“stay/stay” strategy, the two American multinationals, Coca-Cola andIBM, successfully executed an “exit/reenter” strategy. The study ofextreme differences in strategy is intended to identify large differencesin the adoption of dynamic trajectories. We start the analysis with adescription of the policy regime in India prior to 1970.
Indian Policy toward MNEs Prior to 1970
Business historians have long studied the history of multinationalfirms in India. Tirthankar Roy, in his article in this special issue of theBusiness History Review, provides a history of foreign trading firms incolonial India. He outlines how European trading firms started inCalcutta as agency houses and attracted Scottish, Welsh, English,German, and French capitalists. Some of these firms moved inland andfocused on indigo processing factories while the rest remained inCalcutta and conducted three functions related to the indigo trade: ship-ping, financing, and insurance. After the Indian mutiny ended andCrown rule began in 1858, “born-industrial” foreign firms that hadbecome industrial after a relatively short period in trading enteredIndia. Examples of such firms included Andrew Yule in tea, jute andcoal, McLeod Russell in tea, Balmer Lawrie in engineering and coal,and Bird Brothers in jute and coal.2
In Multinationals and Global Capitalism, Geoffrey Jones docu-ments the evolution of India as a destination of inward foreign directinvestment (FDI) over time. In 1914, India was ranked eighth (behindthe U.S., Russia, Canada, Argentina, Brazil, South Africa, and Austria-Hungary) in terms of inward FDI. In 1929, India ranked third, onlybehind Canada and the United States.3 B. R. Tomlinson providesseveral estimates of FDI in India from 1921 to 1960.4 By 2002, accordingto Jones’s estimates, India had fallen way behind as a destination forinward FDI, with only 0.4 percent of the world total FDI. In his bookDis-lodging Multinationals: India’s Strategy in Comparative Perspective,political scientist Dennis Encarnation describes the decline of Britishcolonial agencies and the evolution of Indian business houses and newBritish multinationals in India over time, starting with independencein 1947. He outlines “The Indianization of Colonial Enterprises” post-
2 Tirthankar Roy, “Trading Firms in Colonial India,” Business History Review 88 (Spring2014).
3 Geoffrey Jones, Multinationals and Global Capitalism (Oxford, 2005), ch. 10.4 B. R. Tomlinson, “Foreign Private Investment in India, 1920–1950,” Modern Asian
Studies (1978): 657, Table 1.
Multinational Enterprises in India / 3
87
88
89
90
91
92
93
94
95
96
97
98
99
100
101
102
103
104
105
106
107
108
109
110
111
112
113
114
115
116
117
118
119
120
121
122
123
124
125
126
127
1282
129

1947.5 Given that the London and Liverpool headquarters of theseagencies were not able to invest overseas, Indian business housesbegan to invest capital in the British agencies and, by mid-1948,Indian businesses held more than 85 percent of the equity in colonialmanaging agencies. The takeover of British business interests in India,particularly in Bengal, was largely engineered by Marwari businessgroups (including the Birla family, Juggilal Kamalpat, and SurajmullNagarmull). Tomlinson provides a detailed account of this shift in own-ership.6 In her classic study of the history of American multinationals,The Maturing of Multinational Enterprise, business historian MiraWilkins documents that U.S. direct investment in India in 1929 was$32.7 million, a mere 0.4 percent of the total U.S. direct investmentabroad ($7.55 billion).7
Postindependence the institutional environment for multinationalfirms changed quite rapidly. In his article “Treatment of Foreign Enter-prise in India,” legal scholar Matthew Kust writes, “foreign enterprise nolonger has its own way as it did when India was under foreign rule.” OnApril 6, 1949, Indian Prime Minister Jawaharlal Nehru released a policystatement on foreign enterprise in the Constitutional Assembly of India,stating, “As a rule, the major interest in ownership and effective controlof an undertaking should be in Indian hands. . . . Government will notobject to foreign capital having control of a concern for a limitedperiod if it is found to be in the national interest.” During the firstyears of independence, foreign enterprise almost never gained majorityownership of a new industry; Kust notes that one “notable exception wasthe licensing of three oil refineries to Stanvac, Caltex and Burmah-Shellduring the early 1950s where 100 percent foreign ownership wasgranted.”8Majority ownership by foreign enterprise was a rare exceptionwith only twenty-six of more than four hundred collaboration agree-ments concluded in 1961 giving the foreign company majority owner-ship. In addition, in 1955, the Fourth Amendment to the IndianConstitution removed from the scope of judicial review the adequacyof compensation upon state acquisition of private property and businessinterests. After this amendment, India nationalized the Kolar goldmines, which had been completely British-owned, and the ImperialBank of India (later the State Bank of India) and the life insurance
5Dennis Encarnation, Dislodging Multinationals: India’s Strategy in Comparative Per-spective (Ithaca, N.Y., 1989), ch. 2.
6 B. R. Tomlinson, “Colonial Firms and the Decline of Colonialism in Eastern India, 1914–47,” Modern Asian Studies (1981): 455–86.
7Mira Wilkins, The Maturing of Multinational Enterprise: American Business Abroadfrom 1914–1970 (Cambridge, Mass., 1974), 59, Table 3.4.
8Matthew J. Kust, “Treatment of Foreign Enterprise in India,” Rutgers Law Review 17(1962): 364, 354.
Prithwiraj Choudhury and Tarun Khanna / 4
130
131
132
133
134
135
136
137
138
139
140
141
142
143
144
145
146
147
148
149
150
151
152
153
154
155
156
157
158
159
160
161
162
163
164
165
166
167
168
169
170
1712
172
business, which had minority foreign ownership. In his book ForeignEnterprise in India, Kust described the policy instruments on industryclassification, licensing, capital controls and taxation employed by thegovernment of India to protect “new (domestic) industry.”9
In the years leading to 1970, India’s policy toward multinationalfirms was captured in a central planning policy document known asthe “Five-Year Plan.” The first Five-Year Plan (1951–1956) outlinedthat foreign investment was allowed where the nation needed new pro-duction lines; where special skills not available locally were required;and where the domestic production volume was insufficient to meetdemand and there was no expectation that indigenous industry couldexpand quickly. In 1961, the government also released a list of industrieswhere foreign investment was particularly welcome, noting the gaps inproduction capacity of the nation. The list included extremely profitableindustries, such as pharmaceuticals, aluminum, and fertilizers. Thispolicy regime attracted several multinational corporations, particularlypharmaceutical companies, to India. In 1970, in fact, India was hometo forty-six foreign pharmaceutical companies. The Hathi Committeeof 1975 noted the evolution of pharmaceuticalMNEs setting upmanufac-turing subsidiaries in India. These companies were attracted to Indiabecause of its large domestic market, mild drug control measures,limited competition, and tax concessions. The government also sentout invitations to MNEs such as Glaxo, General Motors, and FordMotor to invest in India, with an informal suggestion to include localequity. MNE investments increased substantially in the 1957–1963period.10
However, foreign firms did face certain constraints in conductingbusiness in India. The Indian currency, the rupee, was nonconvertibleand high tariffs and import licensing prevented foreign goods fromreaching the market. Any business that wanted to operate in Indianeeded a license and several permits.Multiple restrictions required com-panies to go through several government departments before gettingpermission to set up shop in India: A firm would have to get the greenflag from up to eighty agencies before it was granted a license toproduce in India. Even after getting a license, the state interfered inmatters like the nature of the item produced and the quantity andpricing of the finished product (in certain industries). The state also pre-vented laying off workers and closing factories as well as limiting the
9Matthew J. Kust, Foreign Enterprise in India: Laws and Policies (Chapel Hill, 1964).10Medha Kudaisya, The Oxford India Anthology of Business History (Oxford, 2011); Amar
Nayak,Multinationals in India: FDI and Complementation Strategy in a Developing Country(New York, 2008), chs. 2, 4, and 5; and Nagesh Kumar,Multinational Enterprises and Indus-trial Organization: The Case of India (Thousand Oaks, Calif., 1994), ch. 1.
Multinational Enterprises in India / 5
173
174
175
176
177
178
179
180
181
182
183
184
185
186
187
188
189
190
191
192
193
194
195
196
197
198
199
200
201
202
203
204
205
206
207
208
209
210
211
212
213
2142
215

number of licenses it issued in each industry. Each industry had a cap onlicenses, usually four or five for the whole nation, creating amonopolisticmarket. Investors focused on procuring licenses rather than on improv-ing their services and products. Owing to the limited number of players, alicense guaranteed profits. Thus, regulation, with extreme controls onFDI, along with a high tariff wall, sheltered domestic companies fromoverseas competition. This policy emerged from the nation’s socialistviewpoint and the prior experience of colonial exploitation, but thismonopolistic situation hurt the country’s overall infrastructure.
1970: India Shuts Down to MNEs
In the early 1970s, the Indian government gradually began tighten-ing the regulatory noose on MNEs operating in the country. This shiftwas driven by a concerted effort by the Indian state and local firms to“dislodge” multinationals from India. Encarnation outlines a “causalmodel” of how MNEs were dislodged from India: In the first step, localfirms gained financial independence and managerial autonomy fromMNEs; in the second step, Indian firms began to secure technologyfree of foreign capital; and in the third step, Indian firms acquiredcontrol of markets previously dominated by MNEs.11
From a policy point of view, this converged into two new policiesdesigned to control India’s economic resources and foreign interests,especially to curb the outflow of capital in the form of earnings. Bothof these policy instruments directly affected multinational firms. Wefirst examine the Foreign Exchange Regulation Act (FERA).
FERA was passed by an act of Parliament in 1973 and came intoeffect on January 1, 1974. This act consolidated and amended the pre-vious FERA Act of 1947. FERA’s goal was to restrict dealings in foreignexchange and other securities that could impact the nation’s currencyand foreign exchange reserves. The act had a provision to cap theforeign investment in all companies operating in the nation, andforeign companies had to dilute their shareholdings to 40 percent.FERA also vested power in the hands of the Reserve Bank of India(RBI) to regulate the foreign equity in the companies operating inIndia and to ensure that the cap was maintained. As a result, all compa-nies came under the direct control of the Reserve Bank of India.12 Allfirms operating in India with more than 40 percent foreign equity hadto obtain permission from the RBI to continue operations after
11 Encarnation, Dislodging Multinationals.12Harpreet Dusanjh and A.S. Sidhu, “Policy Framework for Multinational Corporations in
India: A Historical Perspective,” Indian Journal of Economics and Business (2010): 527–29.
Prithwiraj Choudhury and Tarun Khanna / 6
216
217
218
219
220
221
222
223
224
225
226
227
228
229
230
231
232
233
234
235
236
237
238
239
240
241
242
243
244
245
246
247
248
249
250
251
252
253
254
255
256
2572
258

January 1, 1974. FERA affected already-established foreign companies inIndia that had foreign equity stakes exceeding 40 percent, and it appliedregardless of a firm’s initial terms and conditions. FERA also outlinedthat all companies operating in India (with the exception of foreignairline, shipping, and banking companies) would be incorporatedunder the Indian Companies Act, which would curb tax-free outflowsof profits. Additionally, the maximum foreign equity percentage stakediffered by industry. Violations of FERA would incur criminal charges.13
Out of the 881 companies that applied to the RBI, only 150 compa-nies were allowed to keep a higher level of foreign equity than the pre-scribed cap; the others diluted to fit the ambit of FERA. Companiesthat found the terms unacceptable began to wind up operations inIndia. Fifty-four companies applied to exit India by 1977–1978 andnine companies applied to exit in 1980–1981.14
1970 Patent Act Spurs Reverse Engineering in Pharmaceuticals
In addition to FERA, the Indian government introduced the PatentAct of 1970, and this policy change had far-ranging implications for bothmultinational and domestic firms, particularly in the pharmaceuticalindustry. The two policy instruments, FERA and the new patent act,were introduced within a span of three years and represented parallelattempts to tighten control of MNEs. In accordance with Encarnation’scausal model of dislodging MNEs, the new patent act intended to levelthe playing field for Indian firms in the domain of intellectual property.15
As of 1970, multinational companies controlled 68 percent of themarket share in India’s pharmaceuticals. These multinationals—withthe support of the Patent Act of 1911—prevented local Indian companiesfrom manufacturing new drugs. The patent law allowed the MNEs amonopolistic position, and they used their stronghold on the market tocharge extremely high prices, resulting in little access to medicines forthe Indian masses.
The Indian government replaced the Patent Act of 1911 and alsodecided to introduce drug price controls through the Drug PriceControl Order of 1970. The Patent Act of 1970 represented a set ofrules that laid out the legal management of intellectual property inIndia. The act was a keystone in the nation’s treatment of intellectualproperty.
13 Kudaisya, The Oxford India Anthology of Business History; Kumar, MultinationalEnterprises and Industrial Organization.
14Nayak, Multinationals in India.15 Encarnation, Dislodging Multinationals.
Multinational Enterprises in India / 7
259
260
261
262
263
264
265
266
267
268
269
270
271
272
273
274
275
276
277
278
279
280
281
282
283
284
285
286
287
288
289
290
291
292
293
294
295
296
297
298
299
3002
301

The central piece of the patent law was that it recognized onlyprocess patents and not product patents in the pharmaceutical and agro-chemical sectors. It also reduced the patent period from sixteen years toseven years in these sectors and to fourteen years in other cases. Thisprocess patent regime triggered reverse engineering in the Indianpharmaceutical sector for drugs patented in other countries. Indian com-panies could now discover alternate processes for manufacturing drugsthat were not patented in India.16
In summary, from 1970 to 1990, FERA and the Indian Patent Act of1970 had leveled the playing field for Indian firms with regard to MNEs.FERA gave Indian firms financial and managerial autonomy fromforeigners and the patent act gave Indian firms an opportunity toreverse engineer products.
1991: India Reopens Doors to MNEs
By the early 1990s, India was deep in an economic crisis triggered byboth political and economic factors. The two years prior to 1991 had seenpolitical turmoil, with four prime ministers and four finance ministers.This led to unclear policies and virtual economic paralysis. The yearsbefore 1991 saw increased defense expenditures, reduced tax revenue,slow growth in the export market, and a lack of a coherent budget,which brought about an ever-increasing deficit and inflation. FERAwas hampering India’s ability to compete with other countries. Duringthe Persian Gulf War of 1990–91, India had purchased oil at an extre-mely high price, and instability in the Middle East affected India aswell. Additional problems included an annual rate of inflation of 17percent, an unsustainably large fiscal deficit, and widespread flight ofcapital. The need for economic reform was further accentuated by thecollapse of the Soviet Union, a country with which India had hadstrong political and economic ties.
A major concern in 1991 was the unprecedented possibility thatIndia would default on its external debt, something that had not hap-pened since independence. India’s foreign debt stood at $72 billion,making it the world’s third-largest debtor after Brazil and Mexico. Thisgrowth in debt was rapid, as the foreign debt of the nation stood at$20.5 billion in 1980. In 1991, India had only $1.1 billion in its hard cur-rency reserves, enough for only two weeks of imports. Realizing that itdid not have enough money to pay for its imports and was nearly bank-rupt, India reconsidered its stance on Western influence. The govern-ment entered talks with the International Monetary Fund (IMF) to
16Kumar, Multinational Enterprises and Industrial Organization.
Prithwiraj Choudhury and Tarun Khanna / 8
302
303
304
305
306
307
308
309
310
311
312
313
314
315
316
317
318
319
320
321
322
323
324
325
326
327
328
329
330
331
332
333
334
335
336
337
338
339
340
341
342
3432
344

seek emergency aid. India needed more than $5 billion from the IMF tomeet its immediate obligations. Taking such a huge loan from the IMFwould grant the IMF substantial lobbying power with India, as the inter-national body disbursed loans under “conditions that often includedaltering policies viewed by the fund asmistaken or counterproductive.”17
Among the IMF’s demands was a reduction of the budget deficit, adecrease in the licensing requirements for companies, opening doorsfor foreign companies, and liberalizing investment.
Though India was traditionally socialist in its policies after indepen-dence, this was not the country’s first attempt at economic liberalization.A prior attempt in 1966 was reversed in 1967, after which a strongersocialistic model was adopted. The next major attempt was in 1985,driven by Prime Minister Rajiv Gandhi; it came to an end in 1987. Thefour or five licensed producers in each industry were instrumental inblocking the 1980s reforms.18
Spurred by the IMF in 1991, the government of Prime MinisterP. V. Narasimha Rao and Finance Minister Manmohan Singh pushedfor structural policy reform. These policies included opening thecountry to international trade and investment, deregulation, privatiza-tion of state-owned entities, tax reforms, and inflation-controllingmeasures. The country went through a deregulation makeover—onethat encouraged foreign investment.
Since 1991, arguably India has sustained the spirit of liberalization,despite changing governments, making these reforms more sustainable.This liberalization resulted in India’s rising GDP growth, peaking at 9percent in 2007.19 With economic reforms came relaxation of the FDInorms. While the GDP growth of the nation prior to 1990 was a littleunder 4 percent on average, the GDP growth postreform stood atbetween 6 and 7 percent toward the end of the 1990s.20
FERA was repealed in 1999 by the government of Prime MinisterAtal Bihari Vajpayee. The less stringent Foreign Exchange ManagementAct (FEMA) replaced it, loosening restrictions on foreign exchange andinvestment in India. FEMA was more aligned to the new economic
17 Bernard Weinraub, “Economic Crisis Forcing Once Self-Reliant India to Seek Aid,”New York Times, 29 June 1991, available at http://www.nytimes.com/1991/06/29/world/economic-crisis-forcing-once-self-reliant-india-to-seek-aid.html; Web site accessed on 21Oct. 2013.
18Daron Acemoglu and James A. Robinson, Why Nations Fail: The Origins of Power,Prosperity, and Poverty (New York, 2012).
19 Central Intelligence Agency, World Factbook: India, available at https://www.cia.gov/library/publications/the-world-factbook/geos/in.html#Econ; Web site accessed on 22 July2013.
20 BBC News, “India: The Economy,” 3 Dec. 1998, available at http://news.bbc.co.uk/2/hi/south_asia/55427.stm; Web site accessed on 22 July 2013.
Multinational Enterprises in India / 9
345
346
347
348
349
350
351
352
353
354
355
356
357
358
359
360
361
362
363
364
365
366
367
368
369
370
371
372
373
374
375
376
377
378
379
380
381
382
383
384
385
3862
387

reforms the nation was witnessing. FEMA made all violations regardingforeign exchange civil, not criminal, offenses, making it more investorfriendly. FEMA tried to consolidate legislation relating to foreignexchange in India, with an ultimate goal of allowing external trade andpayments, and to facilitate the development of a foreign exchangemarket in India. The reforms also immediately reduced the number ofsteps required to procure a license to four or five approvals, mainlyenvironmental. Most goods underwent a tariff cut, apart from goods inthe consumer sector.
Indian Patent Reform Starting 1999
Following FEMA, the Indian patent system underwent a number ofreforms starting in 1999, triggered when India signed the agreement onTrade Related Aspects of Intellectual Property Rights (TRIPs) at theWorld TradeOrganization and joined the Patent Cooperation Treaty (PCT).
Product patents in medicine, food, and agrochemicals were nowallowed and the patent expiry period was extended to twenty years,similar to that in the U.S. The average time required to get a patentwas reduced from five to three years. The patent filing fee did notchange during this period and remained substantially less compared tothat of the United States Patent and Trademark Office (USPTO). Thepatent system also granted exclusive marketing rights (EMRs) basedon patents granted; this enabled multinational firms with patents toderive competitive advantage in selling their patented products. In thepast twenty years, Indian patent law has been amended three times—in 1999, 2002, and 2005—to increase compatibility with TRIPs and toallay MNEs’ fears of intellectual property theft.
With the Indian patent reforms, a lot of MNEs’ worries regardingintellectual property protection seemed to disappear. An analysis ofIndian patent filings shows a steep rise in the total number of patentsfiled in India, with an inflexion point in 1997. This increase is attributedto positive expectations about the 1999 reforms. From 1995 to 2004,MNEs from fourteen countries filed a total of 8,426 patents, of whichMNEs from the U.S. filed the most (2,477 patents), followed by firmsfrom Germany and Switzerland. Patent applications by foreign MNEsin India started increasing further around 2000 and have been increas-ing ever since. The EMR, “mailbox” provisions, and the belief that Indiawould abide by TRIPS, gave MNEs confidence, leading to a surge in thenumber of applications. In contrast, Indian entities filed 1,486 appli-cations in the same period.21 The number of patents filed in India
21 Analysis conducted by researchers.
Prithwiraj Choudhury and Tarun Khanna / 10
388
389
390
391
392
393
394
395
396
397
398
399
400
401
402
403
404
405
406
407
408
409
410
411
412
413
414
415
416
417
418
419
420
421
422
423
424
425
426
427
428
4292
430
ranged between 2,000 and 4,000 patents per year from the early 1970sall the way to 1993. Post-1993, there was a rapid increase in the numberof patent filings with a spike of around 10,000 patents per year in 1997, inanticipation of the 1999 reforms.22
MNEs Stream into India: Analysis of Fortune 50and FTSE 50 MNEs
With the initiation of economic reforms, India attracted unprece-dented foreign direct investment. Average annual FDI rose from $100million in the mid-1980s to around $2 billion in the mid-1990s. Thestock of FDI rose from less than $2 billion in 1991 to almost $39billion in 2004.23 TheWorld Investment Report (WIR) of 2007 indicatesthat the 1990 inward stock level of FDI was roughly $1.7 billion; the 2000inward stock was $17.5 billion and the 2004 inward stock was $38.7billion. The city of Bangalore became one of the largest magnets offoreign investment in India; in 2001–2002 alone, a total of 230 MNEsset up offices in Bangalore’s industrial parks, employing 25,000 engineers.
In this section, we analyze unique data that documents every entryand exit event for each Fortune 50 and FTSE 50 multinational firm.The entry and exit events were tracked from 1858 to 2013 and multipledata sources were used, including historical narratives of several firms,SEC company filings (the complete list of subsidiaries was found inForm 10-K, Exhibit 21 for each firm), and data on company registrationin India from the Ministry of Corporate Affairs (MCA) and the Govern-ment of India. As the Fortune 50 and the FTSE 50 lists have changed overtime, we have compiled data for the lists as of 1991 as well as 2013. In ourprimary analyses and in the Appendix, we use the Fortune and FTSE listsfrom 1991, the year of the IMF-induced reforms.
There are several limitations in conducting historical analysis usingcurrently available primary data. Wilkins describes these limitations assometimes introducing “blinders that obscured important past occur-rences.”24 To circumvent some of these constraints, in addition to con-ducting our own primary research, we based our analyses on priorarticles in business history on multinational entry in India.25 Appendix
22 Information from Technology Information, Forecasting and Assessment Council(TIFAC).
23 Chandana Chakraborty and Peter Nunnenkamp, “Economic Reforms, FDI, and Econ-omic Growth in India: A Sector Level Analysis,” World Development 36, no. 7 (2008):1192–1212.
24Mira Wilkins and Frank Ernest Hill, American Business Abroad: Ford on Six Conti-nents, new ed. with new intro. by Mira Wilkins (Cambridge, U.K., 2011), 11.
25 For example, Tomlinson, “Foreign Private Investment in India 1920–1950”; GeoffreyJones, British Multinational Banking, 1830–1990: A History (Oxford, 1993); Wilkins and
Multinational Enterprises in India / 11
431
432
433
434
435
436
437
438
439
440
441
442
443
444
445
446
447
448
449
450
451
452
453
454
455
456
457
458
459
460
461
462
463
464
465
466
467
468
469
470
471
4722
473
Table 1 documents the data on the entry and exit of Fortune 50 multina-tional firms as of 1991 with operations in India over the period 1905–1999. Appendix Table 2 documents the data for the FTSE 50 firms asof 1991 with operations between 1847 and 1999.26
Analysis of the data in these tables reveals several interestinginsights. In comparison to the FTSE 50, Fortune 50 MNEs exhibitgreater number of entries, but also greater numbers of exit events.While Fortune 50 firms have a total of forty entry events, the FTSE 50firms only have twenty entry events. On the other hand, FTSE 50 firmshave a total of two exit events in this period while Fortune 50 firmshave a total of eleven exit events. Between 1971 and 1990, Fortune 50firms have a total of seven exit events while FTSE 50 firms only haveone exit event.
In addition, Fortune and FTSE firms had differences in functionalfocus. Fortune 50 firms had a more balanced focus in terms of manufac-turing and sales/services while FTSE 50 firms had a greater focus onsales/services. Also, the Fortune 50 firms show a slightly higher concen-tration on R&D in India compared to the FTSE 50.27
We compare the entry mode of both categories of firms as well asstudy whether the firms entered solo or otherwise. A non-solo entryrefers to an entry through acquisition or a joint venture (JV), whereasa solo entry represents the firm entering by itself.
There is a small business history literature on MNEs’ choice of entrymodel (joint ventures vs. acquisition vs. solo entry, but this has notincluded the case of India).28 Encarnation does describe the evolutionof joint ventures between multinational firms and Indian businesshouses. From 1948 to 1957, the Indian government prohibited foreigntakeovers of existing local firms and proscribed foreign-owned portfolioinvestments. India averaged fewer than forty new foreign collaborations
Hill,American Business Abroad; Howard Cox, TheGlobal Cigarette: Origins andEvolution ofBritish American Tobacco, 1880–1945, (Oxford, 2000), 202–37; Geoffrey Jones, Entrepre-neurship and Multinationals: Global Business and the Making of the Modern World (Chel-tenham, 2013), ch. 8; Harold van B. Cleveland and Thomas F. Huertas, Citibank, 1812–1970(Cambridge, Mass., 1985); Ralph W. Hidy and Muriel E. Hidy, Pioneering in Big Business,1882–1911 (New York, 1955); and Henrietta M. Larson, Evelyn H. Knowlton, and Charles S.Popple, History of Standard Oil Company (New Jersey): New Horizons, 1927–1950(New York, 1971).
26 An entry in our sample indicates opening of the Indian subsidiary with a well-definedmandate to sell, manufacture, conduct R&D, etc. An exit in our sample indicates closingdown of the Indian subsidiary and/or a visible shutting down of all operations in India.Coding was done by two independent research analysts and validation was done by theauthors in case of disagreement between the analysts. The tables here have been condensed;please contact the authors for the full tables with data to 2013.
27 Pure R&D entry referring to an entry with the only function of the firm as R&D in India.28 For example, Jones, Entrepreneurship and Multinationals, ch. 4.
Prithwiraj Choudhury and Tarun Khanna / 12
474
475
476
477
478
479
480
481
482
483
484
485
486
487
488
489
490
491
492
493
494
495
496
497
498
499
500
501
502
503
504
505
506
507
508
509
510
511
512
513
514
5152
516

annually in this period, most of them with Indian business houses suchas Tata (which had sixty joint ventures with foreign partners by 1958),Mahindra, and Bangur. The years from 1947 to 1957 also witnessed thetakeover of the British colonial managing agencies by the Indianbusiness houses. Encarnation also documents a foreign exchange crisisthat affected India in 1957 that led to a reversal of government policytoward JVs. Government regulators began encouraging Indian firms toseek foreign equity, and local enterprises that secured foreign tie-upsalso had better chances of securing the licenses needed for expansion.Encarnation indicates that JVs with foreign multinationals started dra-matically increasing from 1958 and hit peak levels during 1964.However, JVs with foreign multinationals started declining in the late1960s and, as a result, stocks of foreign equity invested in the privatesector began to shrink and reached their lowest levels in 1973, the yeargovernment policy flipped again with the passage of FERA.29 Our analy-sis is an attempt to augment this narrative.
The Fortune 50 firms exhibited a preference towards solo entrybefore 1970 (62 percent of entries). However, between 1971 and 1990,90 percent of the Fortune 50 entries were either a JV or an acquisition.In the 1990s, the Fortune 50 firms increased the percentage of solo entryto 37.5 percent. FTSE 50 firms were more stable, with only a single soloentry between 1971 and 1990 and post-1991; 83 percent of entries wereeither a JV or an acquisition in both periods.
The Dynamic Trajectories Framework
Our analysis of selected MNEs reveals important distinctions in thetrajectories followed by British or Anglo-Dutch and American multina-tional firms over four decades. There are differences in whether or notthey exited India in the 1970s and in how they crafted their local respon-siveness strategies both in the 1970s and the 1990s. We now outline anew “dynamic trajectories” framework to show that adopting certainstrategic decisions at the onset of different policy epochs leads to pathdependencies resulting in different long-term trajectories for the focalfirm in the host country. The dynamic trajectories framework is basedon the premise of two policy epochs in a host country—one unwelcomingof MNEs (“negative epoch”) and the other welcoming ofMNEs (“positiveepoch”). A focal host country could experience a negative epoch followedby a positive epoch or vice versa.
We argue that an MNE manager in the host country must make twosets of decisions at the onset of each policy epoch. The first decision is
29Encarnation, Dislodging Multinationals, 60.
Multinational Enterprises in India / 13
517
518
519
520
521
522
523
524
525
526
527
528
529
530
531
532
533
534
535
536
537
538
539
540
541
542
543
544
545
546
547
548
549
550
551
552
553
554
555
556
557
5582
559

whether or not to be present in the host country during either or bothpolicy epochs. Here we assume that the MNE is present in the hostcountry prior to the start of the first epoch. If the negative epoch is fol-lowed by the positive epoch, the manager has to decide whether to exitor stay at the onset of the negative epoch. Also, conditional on exitingin the negative epoch, the manager also has to decide whether or notto reenter at the onset of the positive epoch. We also assume that, con-ditional on staying at the onset of the negative epoch, the managerdecides to stay during the positive epoch. An MNE thus must facethree possible choices: exit/reenter; exit/do not reenter; or stay/stay.30
However, if the positive epoch is followed by the negative epoch, themanager has two possible choices: stay/exit; or stay/stay. We assumethat the MNE stays during the positive epoch.
The second decision set relates to whether or not the manager of theMNE in the host country modifies the “local responsiveness strategy” ofthe firm at the onset of each policy epoch and how the manager craftschanges in that strategy. According to business scholars Christopher Bar-tlett and Sumantra Ghoshal, MNEs have to concurrently manage the fol-lowing three priorities: global efficiency; national responsiveness; andworldwide learning. A key strategy element of this three-dimensionalframework is the importance of each foreign subsidiary in managingthe overall MNE strategy. Bartlett and Ghoshal call this strategyelement “local responsiveness” or “multinational flexibility” and definea “differentiated and specialized role” for each MNE subsidiary.31
We build on this construct of local responsiveness and argue that theMNE in the host country could craft changes in the local responsivenessstrategy by investing in inputs, outputs, and/or host country governmentrelationships. Investments in inputs relate to physical, intellectual,and human capital—e.g., plants, plantations, trademarks, patents, andtalent. Crafting changes on the output side could include altering thefunctional focus of the firm (to focus on distribution, sales, or manufac-turing), choosing new businesses enter, changing the product mix foreach business, and modifying the local pricing or distribution strategyfor each product. Finally, investments in host country governmentrelationships might involve investments in managing government stake-holders and/or crafting negotiation strategies to navigate host countrypolicy interventions.
Figure 1 outlines the “dynamic trajectories” perspective for a hostcountry experiencing a negative policy epoch followed by a positive
30Theoretically, a fourth option of stay/exit is also possible since later exit might be motiv-ated by activities in another geography.
31 Christopher A. Bartlett and Sumantra Ghoshal, Managing across Borders: The Trans-national Solution, vol. 2 (Boston, 1999), 67.
Prithwiraj Choudhury and Tarun Khanna / 14
560
561
562
563
564
565
566
567
568
569
570
571
572
573
574
575
576
577
578
579
580
581
582
583
584
585
586
587
588
589
590
591
592
593
594
595
596
597
598
599
600
6012
602

policy epoch, from the perspective of a multinational that was in thecountry already at the onset of the first epoch. The horizontal lines inthe figure represent the three possible dynamic trajectories. In addition,for options 1 and 3, at the onset of each epoch, the MNE has to decidewhether to maintain or modify its local responsiveness strategy. If theMNE decides to maintain its prior local responsiveness strategy, theMNE manager in the host country does not make any significant newinvestments in the input side; makes no changes to the functionalfocus and product mix; and makes no changes in managing governmentstakeholders. Still, if the manager of the MNE in the host country mod-ifies the local responsiveness strategy at the onset of either or both policy
Fig.1-B/W
online,
B/W
inprint
Figure 1. Dynamic trajectories framework. This graphic is a representation of the “dynamictrajectories” framework and depicts the evolution of the policy environment in a focal hostcountry that passes through a “negative epoch” followed by a “positive epoch” with regard topolicy toward multinationals. At the onset of the negative epoch, a focal MNC has to decidewhether to exit or stay. Conditional on deciding to stay, the firm has to decide whether ornot to maintain the prior local responsiveness strategy or whether or not to modify thesame. Modification of the local responsiveness strategy could be on the input side (manufac-turing plants, plantations, patents, talent); output side (functional focus, product mix, pricing,distribution, etc.); or in managing host country government relationships. At the onset of thepositive epoch, conditional on exiting earlier, theMNC has to decide whether or not to reenter.For both the stay/stay option and exit/reenter option, the focal MNC has to decide at the onsetof the positive epoch whether or not to maintain the prior local responsiveness strategy orwhether to modify the same. We also posit that the direction (which lever—input, output, orgovernment relationships) and degree (howmuch) of change in the local responsiveness strat-egy is conditional on the decision to stay/exit at the onset of Epoch 1 and the decision toreenter/stay at the onset of Epoch 2.
Multinational Enterprises in India / 15
603
604
605
606
607
608
609
610
611
612
613
614
615
616
617
618
619
620
621
622
623
624
625
626
627
628
629
630
631
632
633
634
635
636
637
638
639
640
641
642
643
6442
645

epochs, changes could be made on the input side, the output side, or inmanaging government stakeholders.
It is also plausible that both the direction and the degree ofchange in local responsiveness strategy are endogenous to the decisionof exiting/staying/reentering. We define direction of change aswhether or not the focal MNE focuses on input, output, or govern-ment relationships and degree of change as the extent and natureof change on any of these levers. We also argue that the directionand degree of change MNE depends on the decision to exit/stay/reenter. As an example, in the face of a negative policy epoch followedby a positive policy epoch, an MNE that decides to follow a stay/staystrategy might not be able to make drastic changes on the output side(e.g., functional focus, product mix) for reasons of continuity and mayinstead focus on investments in the input side (e.g., human capital,manufacturing plants, plantations.). However, an MNE following anexit/reenter strategy might have fewer concerns regarding continuitygiven the passage of time and might be able to make drasticchanges to the output side. In that case, the MNE might be able toalter the functional and/or product mix in the host country. Inaddition, the need to focus on host country government relationships,especially in a negative epoch, might imply a focus on input, since it isrelated to the creation of local jobs, a key lever to engage with govern-ment stakeholders.
We now outline four detailed qualitative case studies of these multi-national firms to indicate differences in how they reacted to the twopolicy epochs in India. The four case studies arguably represent extremesin our sample—while the Anglo-Dutch Unilever and British BAT fol-lowed a well-crafted “stay/stay” strategy, the two American multina-tionals, IBM and Coca-Cola, successfully executed an “exit/reentry”strategy.32
Further, we show that Unilever and BAT adapted to the negativepolicy epoch (represented by the FERA regulation and 1970 patentlaw) by continuously investing in the input side—manufacturing plantsand human capital. In contrast, IBM and Coca-Cola exited India follow-ing the FERA regulations of the 1970s, subsequently returning with dras-tically different local responsiveness strategies on the output siderepresented by different functional and product mixes.
32 The use of outliers in the context of India to outline differences in dynamic trajectories issimilar in principle to the analysis used by Jones and Khanna where they compared the differ-ent trajectories taken by Jardines and Swire in face of Communist intervention in China. Geof-frey Jones and Tarun Khanna, “Bringing History (Back) into International Business,” Journalof International Business Studies 37 (2006): 453–68.
Prithwiraj Choudhury and Tarun Khanna / 16
646
647
648
649
650
651
652
653
654
655
656
657
658
659
660
661
662
663
664
665
666
667
668
669
670
671
672
673
674
675
676
677
678
679
680
681
682
683
684
685
686
6872
688

Unilever in India
The Anglo-Dutch corporation Unilever originated as separateBritish and Dutch firms making soap and margarine, respectively.Lever Brothers, the British company, began exporting Sunlight soapbars to India as early as 1888. Over time, Lever Brothers broughtother products and brands to India, including Lifebuoy in 1895.33 In1917, Lever Brothers acquired partial interest in two other British soapcompanies, one of which had an office and depots in India. Decliningsales between 1918 and 1921 further triggered Lever Brothers’ interestin India as a manufacturing center. Other factors included the growinglocal Indian production of soap spurred by wartime shortages, and thewidespread Swadeshi movement in India, which advocated self-suffi-ciency through use of locally made products. In the 1920s, Lever Broth-ers bought a site at Sinduria, near Calcutta. Unilever (the product of theamalgamation of Lever Brothers andMargarine Unie in 1930) continuedto expand in the country after 1929. The Hindustan Vanaspati Manufac-turing Company was established in 1931. In 1933, a new company calledLever Bros. (India) Ltd. was incorporated in Bombay. Subsequently,Unilever set up factories to manufacture soap in Calcutta and Bombayand vegetable ghee just outside Bombay, using the brand name Dalda.Another subsidiary, United Traders Limited, was formed in 1935.34
These subsidiaries functioned independently until 1956, when theymerged to form Hindustan Lever Limited (HLL), which sold 10percent of its equity to the public; the share of public equity wasincreased to 14 percent in 1965.35 The country’s planned economy atthe time protected local manufacturers, and Unilever flourished. Thecompany, under the influence of the government, also recruited Indianmanagers, naming P. L. Tandon chairman in 1961—the first instance ofan Indian heading a multinational (see Jaithirth Rao’s contribution tothis special issue). Hindustan Lever Limited evolved into a consumergoods company, with Unilever as its major stakeholder. HLL had beenin the beverages industry since 1903 with its brand Red Label tea. In1972 Unilever’s acquisition of Lipton Ltd. from the British companyAllied Suppliers included a large and very poorly managed Indian teapackaging and distribution business, which could not be integrated
33Amar Nayak, Multinationals in India: FDI and Complementation Strategy in a Devel-oping Country (New York, 2008), chs. 2, 4, and 5; Sushil Vachani, Multinationals in India:Strategic Product Choices (Columbia,Mo., 1992), 12–31; D. K. Fieldhouse,Unilever Overseas:The Anatomy of aMultinational, 1895–1965 (Stanford, 1978). Vanaspati is vegetable ghee andDalda is a brand.
34 Jones, Entrepreneurship and Multinationals, ch. 8.35 “Hindustan Unilever Limited Factsheet,” available at http://www.hul.co.in/Images/
HUL-Factsheet_tcm114-188694.pdf; Web site accessed on 22 July 2013.
Multinational Enterprises in India / 17
689
690
691
692
693
694
695
696
697
698
699
700
701
702
703
704
705
706
707
708
709
710
711
712
713
714
715
716
717
718
719
720
721
722
723
724
725
726
727
728
729
7302
731

with HLL. The Indian business was reconstituted as a separate company,Lipton Tea (India) Limited, in 1977, with 60 percent localshareholding.36
When the Indian economy tightened in the 1970s, HLL chose to stayin India. As Jones documents, Unilever disliked the tightening of theeconomy and it feared the loss of intellectual property, but “Unileverbecame a master at delaying tactics, using its extensive contacts andgoodwill . . . tomodify regulations, and generally bargaining with govern-ments.”37 The 1970 price controls dented the profitability of HLL. By1971, the vanaspati business was unprofitable and HLL decided to with-draw in 1972. However, HLL’s synthetic detergents were not regulatedand remained profitable. From 1972 to 1974, HLL negotiated with thegovernment to shelter itself from price controls. An agreement wasreached that if large manufacturers released a toilet soap product forthe poor at a controlled price, the price control on other soaps wouldbe lifted. Later, in 1975 vanaspati came out of the price control regimeand the Dalda brand was reestablished.
With FERA came the need for most companies to bring foreignshareholding down to 40 percent, which was unacceptable to Unilever.HLL tried to retain 74 percent, the permitted amount for core or technol-ogy companies. After negotiations, foreign entities were allowed to hold“51 percent of the equity, provided that 60 percent of its turnover was inthe core or high technology sectors, and that it exported 10 percent of itsproduction.”38
To meet these criteria, HLL increased exports, especially soaps anddetergents, to the Soviet Union. Gradually, the company began exportingmore until it became India’s second largest private sector exporter by theearly 1980s. HLL also tried to argue that manufacturing its soap withnonedible oils was a sophisticated technology, but the government didnot agree.
In 1977, the newly elected government mandated that Unilever godown to the specified 40 percent foreign ownership by 1979. With noway out, HLL began delaying and stalling, asking to reduce the share-holding in two stages—the first stage to 51 percent in 1978, which wasimplemented. With yet another new government taking over in 1980,the second stage was delayed, and in 1981, the government permittedUnilever to maintain majority holding.
In Dislodging Multinationals, Encarnation describes Unilever’sfinancial engineering strategy to overcome the constraints imposed by
36 Jones, Entrepreneurship and Multinationals, 178.37 Ibid., 168.38 Ibid., 177.
Prithwiraj Choudhury and Tarun Khanna / 18
732
733
734
735
736
737
738
739
740
741
742
743
744
745
746
747
748
749
750
751
752
753
754
755
756
757
758
759
760
761
762
763
764
765
766
767
768
769
770
771
772
7732
774

FERA. To comply with the requirements of “maximum foreign equity,”Unilever issued fresh equity to Indian investors and dispersed thisequity sale among many individual shareholders, each with a smallholding. “In 1980, for example, more than 89,000 Indians held 47percent of Hindustan Lever’s stock, while Unilever held the remainingblock of shares.”39 This ensured that Unilever had unchallenged man-agerial control over its Indian operations.
Around this time, HLL also started making significant investmentsin a key input—managerial talent. HLL initiated several managementdevelopment programs and attracted the best students from thepremier Indian Institutes of Management. The company continues tobe an attractive employer today; AC Nielsen rated it the best employerof choice for business school graduates of the class of 2013. Arguably,the firm’s talent management programs have contributed to thegrowth of the broader managerial labor market in India. Companyalumni have taken more than four hundred CEO positions (includingmany within Unilever).40 The company’s name changed in June 2007fromHindustan Lever Limited toHindustan Unilever Limited (hereafterHUL for the years following 2007).
To analyze the impact that the firm’s talent development programhad on the broader Indian managerial labor market, we collected andanalyzed the attrition patterns of 751 HUL alumni who have sincebeen working in senior management positions in other firms in India.The highest fraction of HUL alumni were working at other firms in thefast-moving consumer goods or FMCG industry (27.8 percent). HULalumni have also moved to telecommunications (17.8 percent), infor-mation technology (16 percent), food and beverages (15 percent), phar-maceuticals (6.4 percent), management consulting (4.6 percent),banking (4.2 percent), and retail (4.2 percent).
Through the 1970s and 1980s, Unilever modified its local respon-siveness strategy by making significant investments in the input side—predominantly in talent management programs and manufacturingcapabilities. It also successfully negotiated with successive Indian gov-ernments and modified its product mix based on the prevailing policyenvironment.
Post-1991, the company went on a merger-and-acquisition spree,merging with Tata Oil Mills Company (TOMCO) in 1993 and formingthe equal stake joint venture Lakme Limited with another Tata
39Encarnation, Dislodging Multinationals, 71.40 Vinod Mahanta, “License to Lead: Hindustan Unilever’s Incredible Talent Grooming
Machinery,” Economic Times, 20 Apr. 2012, available at http://articles.economictimes.india-times.com/2012-04-20/news/31374112_1_hul-managers-hul-ceo-nitin-paranjpe-leverites; Website accessed on 22 July 2013.
Multinational Enterprises in India / 19
775
776
777
778
779
780
781
782
783
784
785
786
787
788
789
790
791
792
793
794
795
796
797
798
799
800
801
802
803
804
805
806
807
808
809
810
811
812
813
814
815
8162
817

company, Lakme Unilever Limited, in 1996. In 1998, Lakme Limitedsold its brands and divested its 50 percent stake to HLL. HLL alsoexpanded geographically and set up a subsidiary in Nepal, UnileverNepal Limited (UNL). In early 2000, the government awarded 74percent equity in Modern Foods to HLL—an instance of the governmentdivesting its equity in state-owned entities. In 2002, HLL acquired thegovernment’s remaining stake in Modern Foods.41
In the second policy epoch, the company again modified its localresponsiveness strategy by making significant investments in inputs byacquiring manufacturing plants; it also made additional investmentson the output side by acquiring brands such as Lakme and ModernFoods. Through both periods, the organization has remained focusedon manufacturing, marketing, and talent management. Sales grewfrom around US$33 million 1991 to around US$793 million in 2000,showing a compound annual growth rate of close to 40 percent.42 Asof 2013, HUL sells more than thirty-five brands in more than twenty cat-egories in India—“soaps, detergents, shampoos, skin care, toothpastes,deodorants, cosmetics, tea, coffee, packaged foods, ice cream, andwater purifiers.”43 It employs more than 16,000 employees and hasannual sales of more than US$11 billion. HUL still operates as a subsidi-ary of Unilever, which has a 52 percent shareholding.44 Arguably, HUL isone of the “most local” MNEs operating in India.
British American Tobacco (BAT) in India
American Tobacco Company (ATC) formed in the year 1890 fromthe merger of several tobacco firms. Looking to expand its geographies,ATC moved out of the U.S. to countries like India and China only to runinto competition from British cigarette manufacturers. ATC thereforeacquired British firm Odgen Tobacco Co. As a countermeasure, theBritish players rallied to form the Imperial Tobacco Co. Ltd. ATC andthe Imperial Tobacco Company entered into a price war. Both companiestook a beating; to resolve matters, they decided to pull out of each other’sdomestic markets in 1902. For entry into foreign markets, they collec-tively formed the British American Tobacco Company (BAT), with ATCowning a majority stake of 67 percent. While initially BAT relied on
41Hindustan Unilever Limited, “Our History,” available at http://www.hul.co.in/aboutus/ourhistory/; Web site accessed on 22 July 2013.
42 “Nitin Paranjpe of Hindustan Unilever: Remaining ‘Relevant and Contemporary’ toIndian Consumers,” Knowledge@Wharton, 21 Oct. 2010, available at http://knowledge.wharton.upenn.edu/india/article.cfm?articleid=4536; Web site accessed on 26 July 2013.
43Hindustan Unilever Limited, “Introduction to HUL,” http://www.hul.co.in/aboutus/introductiontohul/; Web site accessed on 22 and 24 July 2013.
44 Ibid.
Prithwiraj Choudhury and Tarun Khanna / 20
818
819
820
821
822
823
824
825
826
827
828
829
830
831
832
833
834
835
836
837
838
839
840
841
842
843
844
845
846
847
848
849
850
851
852
853
854
855
856
857
858
8592
860

factories in the U.S. and the U.K. for supplying cigarettes to foreignmarkets, the company gradually transitioned to manufacturing the ciga-rettes locally or in nearby nations for all its export markets.45
Prior to the formation of BAT, ATC had made its first foray intoIndia, marketing its products through an agency called George Atherton& Co., which was based in Calcutta. ATC had previously set up distri-bution facilities centered outside of Calcutta, which were strengthenedafter the formation of BAT to cover all of India. The volume of importedcigarettes doubled from 1901 to 1905. The India operations, which wereinitially a branch of BAT, were upgraded to a subsidiary called BAT Co.(India), registered in London in 1905.
BAT’s operations in India transitioned from marketing importedcigarettes to manufacturing cigarettes locally and to even processingleaf that was locally grown.46
The boycott movement in India acted as an impetus for the companyto set upmanufacturing operations. In 1910, BAT Co. registered a whollyowned subsidiary in Calcutta, the Imperial Tobacco Co. of India (ITC),which went on to become the main subsidiary for BAT in India. Withina month, ITC had an issued capital of Rs. 3 million and had taken overBAT Co.’s interests not only in India, but in Aden and Burma as well.ITC had the selling and distribution rights for all BAT products inIndia, which BAT Co. had previously held. The increasing tariffs ontobacco imports acted as the catalyst for BAT to look to procure leaveslocally. BAT Co. therefore set up the Indian Leaf Tobacco DevelopmentCo. (ILTD) in 1912 as a subsidiary. That year, the company began build-ing a manufacturing plant in Bangalore to better utilize the southerntobacco-growing region of Guntur, in which ILTD had offices. ILTDgrew rapidly, exporting leaf to Britain in the 1920s. Soon the Gunturheadquarters shifted to Chirala, with a buying center located close tothe railway station. In 1922 a factory for redrying leaves was also estab-lished there.47 Thus, BAT had three branches in India—the PeninsularTobacco Company looking after the manufacturing, ITC as its sellingwing, and ILTD responsible for local leaf procurement. By 1921, ITC’sissued capital was raised from Rs. 3 million to Rs. 41.6 million; andPeninsular and ILTD were brought under the direct control of ITC.Furthermore, as the company grew, it shifted offices to Virginia Housein Calcutta, which was modeled after BAT Co.’s Millbank, U.K.,
45Howard Cox, “Growth and Ownership in the International Tobacco Industry: BAT,1902–27,” Business History 31, no. 1 (1989).
46 Cox, “Growth and Ownership in the International Tobacco Industry”; Howard Cox, “TheGlobal Cigarette: Origins and Evolution of British American Tobacco, 1880–1945,” in BAT inIndia (Oxford, 2000), 202–37; and Nayak, Multinationals in India.
47 Cox, “The Global Cigarette.”
Multinational Enterprises in India / 21
861
862
863
864
865
866
867
868
869
870
871
872
873
874
875
876
877
878
879
880
881
882
883
884
885
886
887
888
889
890
891
892
893
894
895
896
897
898
899
900
901
9022
903
headquarters. During this period, corporate restructuring resulted in allbranches except ITC reregistering in the Isle of Man, U.K.48
In the 1920s, ITC boomed, with sales of cigarettes rising from 3.5billion to 8.8 billion per annum. A wide sales and marketing networkwas set up, utilizing local along with British salesmen operating out offive depots in India. A distribution network was set up in parallel, withsupplies shipped out of the depots. Indian salesmen understood thedomestic market. ITC appealed to sellers by promising to take backunsold or old stock, a benefit that local brands were not offering. Overthis, ITC also changed credit from unsecured to secured, which greatlybenefited wholesalers.
By 1923, ITC’s had factories in Monghyr, Bangalore, and Saharan-pur. The Monghyr factory had its own printing facilities as well. Overthe years, the company went through multiple restructurings, changingits name to India Tobacco Company Limited in 1970 and then to I.T.C.Limited in 1974. By 1975, the tobacco leaf business came under ILTD,while all the other businesses—including the factories, printing, salesand marketing, hotels, and exports—were under I.T.C. Limited. At thetime, BAT had a 60 percent holding in I.T.C. Limited. While I.T.C.Limited owed its origin to BAT, BAT gradually pulled out its own man-agement personnel, who numbered only seven by 1972. This increasein the percentage of Indians in the management of the companyhelped the firm establish deep relationships with stakeholders in theIndian government and was a driver in the firm’s name change. Itsname again changed, to ITC Limited, in 2001.
While other MNEs resented FERA’s regulatory requirement forequity dilution, BAT accepted it. In fact, BAT began diluting its Indianequity rights starting in 1954, taking it down to 75 percent in 1969, 60percent in 1974, to the required cap of 40 percent in 1976. The dilutionfreed up equity for institutional investors and private Indian investors.Amar Nayak discusses most MNEs’ attempts to maintain or increasetheir shareholdings in the 1970s; in contrast, BAT sought local investors,in contrast to MNEs like IBM, General Motors, and Ford Motors.However, there were some management disputes between BAT andITC in the 1990s, leading to an inquiry into whether ITC violatedFERA, which led to arrests of some top executives of ITC. The casewas settled in 1997.49
In the pre-FERA years, the government mandated that foreign firmsgenerate employment, reduce imports through substitutions by localproducts, increase exports, and invest in core industries. While some
48 Ibid.49Nayak, Multinationals in India.
Prithwiraj Choudhury and Tarun Khanna / 22
904
905
906
907
908
909
910
911
912
913
914
915
916
917
918
919
920
921
922
923
924
925
926
927
928
929
930
931
932
933
934
935
936
937
938
939
940
941
942
943
944
9452
946

multinationals left India in the 1970s, BAT continued to invest in man-ufacturing and negotiated with key government decision makers. ITCcommenced growing and processing tobacco leaves in the country,thus generating large-scale employment in the farm sector. Accordingto Encarnation, “The company embarked on this strategy of ‘phasedIndianization’ after it had realized, in the late 1960s, that the governmentwas unlikely to grant majority foreign ownership to a subsidiary in anindustry (tobacco) that remained closely tied to agriculture, requiredlittle new technology or large capital investments, and had minisculeprospects for exports.”50
To further secure the goodwill of the government, ITC investedheavily in corporate social responsibility initiatives as well. In 1990,ITC began to export agricultural commodities; in 2000, it commencedits famous e-Choupal initiative. The e-Choupal model, which suppliedcomputers with internet access to rural areas, helped farmersmore effec-tively participate in the supply chain process.
As of 2013, the company is one of the leading FMCG companies inIndia and its product portfolio comprises food, personal care, cigarettes,branded apparel, education and stationery products, incense sticks,hotels, paperboard, agribusiness, information technology, and more.51
It has successfully built and acquired leading brands in the FMCG,apparel, and hospitality industries.
In summary, the firm responded to the passing of the two policyepochs by making investments in manufacturing plants and farming,by hiring Indian managers, and by investing in government relation-ships. In the second epoch, the firm also made investments in theoutput side by creating new brands.
Coca-Cola in India
Wilkins documents that in the early 1920s, Coca-Cola’s French bot-tling plant recorded substantial losses and had to be abandoned. This ledCoca-Cola to turn to the policy of licensing bottling plants overseas,rather than direct investment. Up until 1977, Coca-Cola employed thesame strategy of licensing bottling plants in India and was the leadingsoft drink brand in India, flourishing under the government of IndiraGandhi. Coca-Cola was the first multinational soft drink brand inIndia, having entered in 1956. Prior to that, the market was dominated
50Encarnation, Dislodging Multinationals, 69–70.51 ITC, “History and Evolution,” available at http://www.itcportal.com/about-itc/profile/
history-and-evolution.aspx; Web site accessed on 26 July 2013.
Multinational Enterprises in India / 23
947
948
949
950
951
952
953
954
955
956
957
958
959
960
961
962
963
964
965
966
967
968
969
970
971
972
973
974
975
976
977
978
979
980
981
982
983
984
985
986
987
9882
989

by domestic brands like Limca. In India, Coca-Cola was incorporated as a“branch” of a consumer goods company.52
But the passage of FERA and the Indian Patent Act of 1970 had anegative effect on Coca-Cola. FERA required that Coca-Cola convert itsbranch into an Indian company that would divest 60 percent of itsstake to Indian investors. The company was given two years to achievethis result. The patent act imposed another condition on the company—Coca-Cola would have to share its drink’s secret formula, nicknamed“7X.” Coca-Cola refused to do this so it exited India in 1977.
Coca-Cola’s departure opened the beverage playing field in India.Local companies began to produce their own soft drinks and beganvying for the vacuum that Coca-Cola had left behind. The first playerwas Pure Drinks, which launched Campa-Cola, and by the end of the1970s, Campa-Cola was the only cola soft drink in the Indian market.Following suit, Parle, a major competitor, launched Thums Up in1980; it remains a popular drink in India today. Parle dominated theIndian soft drink market after Coca-Cola’s exit, with a 70 percentmarket share in 1990.
Despite the new regulations, Pepsi, another multinational firm, sub-sequently tried to enter the Indian market. The first attempt at entry wasin May 1985, when PepsiCo partnered with the RPG Group to form AgroProduct Export Limited. It planned to import the cola concentrate andsell soft drinks under the Pepsi brand, while exporting juice concentratefrom the state of Punjab. Since the foreign name of Pepsi was to be usedand the cola concentrate was being imported, the government rejectedthe proposal. The second attempt was through promises of investing$15 million in Punjab for the development of agricultural researchcenters and various processing units. The investment would createjobs and improve the agricultural processing business in Punjab. Weigh-ing the benefits, the government agreed in 1988. PepsiCo entered Indiaas Lehar Pepsi.
Coca-Cola finally returned to India in 1993 after the economicreforms of 1991. By then, Pepsi dominated the market and Coca-Colawas at an initial disadvantage. Coca-Cola went on to invest $1 billionin India from 1993 to 2003.53
52Wilkins, The Maturing of Multinational Enterprise; August W. Giebelhaus, “The Pausethat Refreshed theWorld: The Evolution of Coca-Cola’s Global Marketing Strategy,” inAddingValue: Brands and Marketing in Food and Drink, ed. Geoffrey Jones and Nicholas J. Morgan(London, 1994).
53 “Coca-Cola and Pepsi in Indian Market,” CoolAvenues.com, 27 May 2010, available athttp://www.coolavenues.com/marketing-zone/coca-cola-and-pepsi-in-indian-market?page=0,1; Web site accessed on 26 July 2013.
Prithwiraj Choudhury and Tarun Khanna / 24
990
991
992
993
994
995
996
997
998
999
1000
1001
1002
1003
1004
1005
1006
1007
1008
1009
1010
1011
1012
1013
1014
1015
1016
1017
1018
1019
1020
1021
1022
1023
1024
1025
1026
1027
1028
1029
1030
10312
1032

Upon reentry, Coca-Cola modified its local responsiveness strategyby making significant investments on the output side and by drasticallymodifying its product mix. The company acquired popular Indianbrands, introduced several of its mainstream global brands in India,and conducted local R&D to come up with new products to cater toIndian consumers. The passage of time between exit and reentryallowed Coca-Cola to significantly modify its product mix and positionitself as a diversified beverage company with both global and Indianbrands.
When Coca-Cola returned to India in the 1990s, it acquired the localsoft drink brands Limca, Thums Up, Maaza, Citra, and Gold Spot fromParle Agro. Coca-Cola then employed different strategies with each ofthe brands. The company decided to continue to promote Thums Up,Limca, and Maaza. However, the orange-flavored Gold Spot was indirect competition with Fanta, a product in its existing global productportfolio, and Coca-Cola decided to withdraw Gold Spot from themarket even though it was popular in the Indian market at the time.
Coca-Cola, Fanta, Sprite, Burn, and Minute Maid are among thecompany’s popular international brands that have been introduced inIndia. In some cases, the company has employed local responsivenessin product design and packaging. As an example, Georgia Gold is notsold as a canned product in India in contrast to other locations. Indiais also one of the few countries where Coca-Cola sells bottled waterunder the Kinley brand.
Coca-Cola has also conducted local R&D and has created new pro-ducts for the Indian market. Minute Maid Nimbu Fresh, first launchedin South India in January 2010, is an important product launched forIndia. The drink was developed exclusively for the Indian consumerand competes directly with Pepsi’s Nimbooz. Coca-Cola also developeda nutritional beverage called Vitingo to address the issue of irondeficiency and iron deficiency anemia in India. Vitingo is a low-cost bev-erage powder containing iron, folic acid, vitamin A, vitamin C, and zinc.In summary, upon reentry Coca-Cola has made investments to theoutput side (brands) and, in order to do so, has made investments tothe input side (R&D).
IBM in India
Prime Minister Nehru facilitated IBM’s entry into India in 1951. Thecompany had a strong run for nearly two decades before it got into a con-flict with the government. The company enjoyed a market share of80 percent in India, and as IBM had control over which products to
Multinational Enterprises in India / 25
1033
1034
1035
1036
1037
1038
1039
1040
1041
1042
1043
1044
1045
1046
1047
1048
1049
1050
1051
1052
1053
1054
1055
1056
1057
1058
1059
1060
1061
1062
1063
1064
1065
1066
1067
1068
1069
1070
1071
1072
1073

market to India, the company essentially controlled the development ofthe computing industry in the country.
IBM would bring old machines to India and refurbish them, thenlease them to the government at inflated rates. Vikram Sarabhai, whoheaded the government Electronics Committee, intervened. IBMdefended its practice, stating that it was trying to meet the nation’spolicy of gradual growth. However, the Indian government argued thatIBM’s prevailing system of lease and maintenance restricted the devel-opment of engineering and programming skills for end users. After theIndian central government established the Department of Electronics(DoE) in the 1960s, the DoE wanted to control the development of thecomputer hardware industry and it initiated a parliamentary investi-gation into the functioning of IBM.
Additionally, IBM got into FERA-related trouble. According toFERA guidelines, given IBM’s industry, the company had to reduce itsequity ownership to 26 percent, which the company did not accept. Asit did not comply with FERA, IBM was asked to exit India in 1977.
According to Anant Negandhi and Aspy Palia, “total remittableprofits at the time of phasing out its operations in 1977 were approxi-mately $10 million.”54 The performance of the company in India wasnot exceptional, and this was partly attributed to assets sold at lessthan book value and a high rate of effective taxation (80 to 85 percent).
However, IBM did not completely sever its ties with India afterdeparture. In 1980, it secured its first customer after exiting—CMC,which had been set up to maintain IBM’s computers in India. IBMsent a proposal to the DoE to set up a software development and traininginstitute in 1986, while in 1989 it supplied a major system to the Aero-nautical Development Agency.55 IBM had changed its business modeland was doing business as an offshore entity with only a few localemployees.
IBM reentered the country in 1992 through a joint venture with theTata Group. Both the Tata Group and IBM Corporation enjoyed an equalstake in the joint venture, which was called Tata Information SystemsLtd. In 1997, IBM Global Services was launched as a separate companythat offered a wide spectrum of IT services, including software develop-ment, hardware design, and networking services.56 In parallel, the name
54 *Anant R. Negandhi and Aspy P. Palia, “The Changing Multinational Corporation: ANation State’s Relationship—The Case of IBM in India,” Asia-Pacific Journal of Management6, no. 1 (1988): 15–38.
55Dinesh C. Sharma, “Rise, Fall and Rise of IBM in India,” Business Today, 17 June 2011,available at http://businesstoday.intoday.in/story/ibm-india-george-fernandes-history-in-india/1/16367.html; Web site accessed on 26 July 2013.
56 IBM, “IBM India Milestones,” available at http://www-07.ibm.com/in/careers/history.html; Web site accessed on 26 July 2013.
Prithwiraj Choudhury and Tarun Khanna / 26
1075
1076
1077
1078
1079
1080
1081
1082
1083
1084
1085
1086
1087
1088
1089
1090
1091
1092
1093
1094
1095
1096
1097
1098
1099
1100
1101
1102
1103
1104
1105
1106
1107
1108
1109
1110
1111
1112
1113
1114
1115
11162
1117

of the joint venture was changed from Tata Information Systems Ltd. toTata IBM Ltd.
While IBM’s initial operations were based in Bangalore, thecompany expanded and set up the IBM India Research Laboratory inNew Delhi. In 1999, Tata divested its stake in IBM and, followingapproval by the government, IBM India Limited was launched. IBMIndia Limited was completely owned by IBM Corporation, except for a1 percent token holding Tata retained. The Tata Group also withdrewfrom IBM Global Services (in which it had had a 10 percent stake).IBM India Limited was a combination of IBM Global Services andTata IBM Ltd.
Tata IBM Ltd. was initially responsible for the marketing andsupport of IBM products in India, while IBM Global Services offeredIT services. Estimates are that Tata IBM had $165 million in sales in1999 and that IBM Global Services had $85 million in sales.57 Thedetails of the transaction were not made public by mutual agreementbetween IBM and Tata, and the move was in accordance with IBM’sglobal strategy of operating through wholly owned subsidiaries. Sincethen, the company has been expanding across India, with centers inmajor cities like Gurgaon, Pune, and Pondicherry; it has also beenexpanding its offerings within the broad domain of software services.
IBM’s recent growth in India has been rapid. The company’s Indianworkforce outnumbers its employees in the U.S. While IBM had lessthan 10,000 employees in India in 2002, this sharply increased tomore than 120,000 employees in 2011. As of 2010, IBM was thesecond-largest private sector employer in India, falling short of onlyTata Consultancy Services. While the Indian workforce was continuouslyexpanding, the U.S. workforce was shrinking, declining from 121,000 in2007 to 105,000 in 2009. IBM also made significant R&D investmentsin India focused on the Indian domestic market. By 2012, IBM’srevenue in India was close to $3 billion. IBM also had six deliverycenters in India. In 2009, IBM India spearheaded a research projectwith a focus on analytics to help telecom service providers and e-retailerswith customer acquisitions and service. The project involved scientists inthe IBM Research Labs in India and Israel who examined customertrends. IBM Research India is the pioneer in the social network analysisfor the company.
Local firms Infosys and TCS pioneered the Indian software deliverymodel and it can be argued that IBM was borrowing their model when it
57 “Tata Pulls Out of IBM Indian Joint Venture,”Computer Business Review, 03 June 1999,available at http://www.cbronline.com/news/tata_pulls_out_of_ibm_indian_joint_venture;Web site accessed on 26 July 2013.
Multinational Enterprises in India / 27
1118
1119
1120
1121
1122
1123
1124
1125
1126
1127
1128
1129
1130
1131
1132
1133
1134
1135
1136
1137
1138
1139
1140
1141
1142
1143
1144
1145
1146
1147
1148
1149
1150
1151
1152
1153
1154
1155
1156
1157
1158
11592
1160

set up its global services in 1997. IBM bought PricewaterhouseCooper’sglobal consultancy business and paid $30.8 million for the Indian armof the company. It also courted twelve of the thirteen individual share-holders of the consulting practice of PwC India, converting them toIBM India employees.58
IBM significantly modified its focus on the output side by changingboth its product mix and functional focus. While IBM prior to 1977 wasfocused on hardware and government sales, post-1991 the firm made adrastic change by abandoning its focus on hardware and by establishinga strong presence in the services and offshore software delivery model.To do this, IBM made investments in the input side by acquiring R&Dresources and talent from entities such as PwC.
Conclusion
Over the past several decades, a rich literature has emerged on mul-tinational firms and their relationships with host countries. On the onehand, scholars such as Raymond Vernon and Richard Caves describe aconflict-prone relationship between the host country and the MNE. Onthe other hand, Richard J. Barnet and Ronald E. Müller depictcooperation and dependency between the host country and the multina-tional firm. Christopher A. Bartlett and Sumantra Ghoshal outline theor-etical approaches as to how MNEs should balance between the twinpriorities of global integration and local responsiveness in the countriesto which they expand. In the context of India, Encarnation offers a causalmodel and empirical evidence of how MNEs were dislodged by the stateand local firms.59
In this article, we develop the “dynamic trajectories” framework todescribe how MNE strategy evolves over time to different policyepochs in a focal host country. For a host country transitioning from anegative policy environment toward MNEs to a positive environment(or vice versa), the dynamic trajectories perspective is hinged on atleast two sets of salient and inter-related decisions that MNEs have tomake at the onset of each policy epoch: 1) whether to stay, exit, or
58 Prasenjit Bhattacharya and Sanjeev Sharma, “IBM Paid $31mn for PwC India,” Econ-omic Times, 26 Mar. 2003, available at http://articles.economictimes.indiatimes.com/2003-03-26/news/27550412_1_pwc-india-ibm-shares-samuel-palmisano; Web site accessed on26 July 2013.
59Raymond Vernon, “Sovereignty at Bay: The Multinational Spread of U.S. Enterprises,”International Executive 13, no. 4 (1971): 1–3; Richard E. Caves, “Research on InternationalBusiness: Problems and Prospects,” Journal of International Business Studies 29, no. 1(1998): 5–19; Richard J. Barnet and Ronald E. Müller, Global Reach: The Power of the Multi-national Corporations (New York, 1974); Bartlett and Ghoshal, Managing across Borders;Encarnation, Dislodging Multinationals.
Prithwiraj Choudhury and Tarun Khanna / 28
1161
1162
1163
1164
1165
1166
1167
1168
1169
1170
1171
1172
1173
1174
1175
1176
1177
1178
1179
1180
1181
1182
1183
1184
1185
1186
1187
1188
1189
1190
1191
1192
1193
1194
1195
1196
1197
1198
1199
1200
1201

enter the host country; and 2) whether to embrace continuity or changewith regard to a local responsiveness strategy. Ourmodel of dynamic tra-jectories is related to the dynamic capabilities framework in the strategyliterature.60 This framework analyzes the sources andmethods of wealthcreation, and capture, by private enterprise firms operating in environ-ments of rapid technological change. The dynamic capabilities frame-work builds on distinctive processes (ways of coordinating andcombining), shaped by the firm’s asset positions and the evolutionpath(s) it has adopted or inherited. The strategy authors also state thatthe importance of path dependencies is amplified where conditions ofincreasing returns exist. However, this framework does not explicitlystudy the evolution of MNE strategy in host countries over time.
We collected unique primary data of entry/exit by Fortune 50 andFTSE 50 firms in India and augmented the same using existing historicalnarratives of multinationals in India. Using this combination of primarydata and existing historical narratives, we develop four in-depth casestudies of firms with stark differences in dynamic trajectories tooutline how Anglo-Dutch and British multinationals differed fromAmerican MNEs in how they reacted to changes in the policy regimein India.61
As India shut down toMNEs in the 1970s and opened up toMNEs in1991, American MNEs such as IBM and Coca-Cola followed an exit/reenter strategy. In contrast, Unilever and BAT followed a stay/staystrategy. There were also important differences in how the MNEsaltered their local responsiveness strategy over time. As outlined in thecase studies, in the face of a negative policy environment, Unilever andBAT made investments in the input side (manufacturing plants,human capital, brands) and followed a negotiate/buy time strategy todeal with hostile policy makers. Unilever and BAT also sustained theirfunctional focus on manufacturing. In contrast, IBM started with asales-only model and a focus on hardware prior to exiting; uponreentry, though, it altered its functional focus and emphasized R&Dand service delivery. It also embraced software services instead of
60David J. Teece, Gary Pisano, and Amy Shuen, “Dynamic Capabilities and Strategic Man-agement,” Strategic Management Journal 18, no. 7 (1997): 509–33.
61Our focus on contrasting Anglo-Dutch/British and Americanmultinationals in India is inthe spirit of prior work by business historians in the context of India. MiraWilkins provides aninteresting narrative of how British and American multinationals had conflicting strategies inIndia in the late 1920s. In 1929, American & Foreign Power acquired a 50 percent stake in theTata Hydroelectric Agencies Ltd. of Bombay and tried to make an investment in the CalcuttaElectric Supply Corporation, “a move that was blocked by British opposition”; Wilkins, TheMaturing of Multinational Enterprise, 134. In 1947, following India’s independence and fol-lowing pressure from the Indian government, “American & Foreign Power Company relin-quished control of its Indian properties” (p. 302).
Multinational Enterprises in India / 29
1203
1204
1205
1206
1207
1208
1209
1210
1211
1212
1213
1214
1215
1216
1217
1218
1219
1220
1221
1222
1223
1224
1225
1226
1227
1228
1229
1230
1231
1232
1233
1234
1235
1236
1237
1238
1239
1240
1241
1242
1243

hardware as its product mix focus. Coca-Cola had concerns about intel-lectual property theft at the time of exit; upon reentry, given the newpatent regime, it introduced its leading global brands in India andadditionally conducted local R&D and created new local brands tocater to the Indian consumer.
Our theoretical model has limitations. The model places dispropor-tionate weight on the two specific episodes of policy in driving decisionsby multinational firms in entering a host country and, as an example,does not focus on entry decisions at the onset of the negative policyshock. In the case of India, between 1981 and 1990, eleven U.S. firmsentered the Indian economy compared to one firm from the U.K. Notonly is this the main point of divergence in the historical patterns ofBritish (or Anglo-Dutch) and American firms’ investment decisions(which otherwise track each other quite closely) but it is also a featurethat the dynamic trajectories framework does not study in detail.
In this article, we have attempted to provide only a broad outline ofthe dynamic trajectories framework; much future work is needed tofurther develop this perspective. For instance, it is not clear ex antewhether exiting or staying (in the face of a negative policy regime) andentering or not (in the face of a positive policy regime) is optimal foran MNE facing rapid policy change in a host country. For example, fora host country transitioning from a negative to a positive policy environ-ment, a stay/stay strategy could be better in developing host countryrelationships and in securing concessions from the host government inthe long run; however, an exit/reentry strategy could help employscarce firm resources on the most profitable opportunities anywhere inthe firm. Future work needs to develop this analysis both from the per-spective of the MNE shareholder and the perspective of the hostcountry stakeholder. There is opportunity for future research to studythe performance implications of the exit/reenter strategy compared tothe stay/stay strategy from both the view of the internal shareholderand from the view of the host country stakeholder.62
Future research also has an opportunity to “unpack” the antecedentsof what drives different MNEs to follow these different dynamic trajec-tories. For instance, we need to study whether the apparent correlationbetween these decisions and the home country nationality of the firmis a correlation endogenous to other firm/managerial-level variables or
62We conducted very preliminary analysis using stock prices for Hindustan Unilever inIndia. This analysis indicates that while both HUL and the parent Unilever outperformedtheir relative stock market indices from 1990 to 2013, HUL disproportionately outperformedthe parent Unilever on that measure from 1993 to 2007. This indicates that the Unilever Indiastrategy of stay/stay was paying rich dividends for the firm, even compared to the performanceof the global parent.
Prithwiraj Choudhury and Tarun Khanna / 30
1245
1246
1247
1248
1249
1250
1251
1252
1253
1254
1255
1256
1257
1258
1259
1260
1261
1262
1263
1264
1265
1266
1267
1268
1269
1270
1271
1272
1273
1274
1275
1276
1277
1278
1279
1280
1281
1282
1283
1284
1285

whether there is a deeper causal story related to the home country of theMNE and/or historical ties between the home country and host country.
This article makes a contribution to the theoretical literature inbusiness history and international business by providing a synthesizingframework that takes into account the element of time and how MNEtrajectories in host countries evolve over time. The element of time hasbeen long considered in prior work by business historians describingthe evolution of the multinational firm. In The Maturing of Multina-tional Enterprise, Wilkins describes “three stages” of multinationalgrowth in host countries. In the first stage (“initial monocentric relation-ship”), new and distinct foreign units are established or acquired by theparent company “radiating from the parent company.” In stage two, theforeign units develop their “own separate histories” and take on largerfunctions, introducing new products and sometime acquiring otherfirms. Over time, the initial monocentric structure is replaced with a“polycentric industrial relationship with heterogeneous foreign centershaving varied trading, administrative, and corporate relationships”with the parent. In the third stage, foreign subsidiaries of the multina-tional firm raise money from where available, often have foreign share-holders, recruit managerial talent in various nations and trade amongthemselves, often ignoring the parent in constructing intersubsidiarytrade deals. To quote Wilkins, “the simple polycentric industrial struc-ture is shattered” and restructuring happens on a “worldwide basisrelated to product, geographic area, a combination of both.”63
Wilkins also writes extensively on how the evolution of the Americanmultinational firm has been influenced by events external to their ownoperations (e.g., the two World Wars, the Spanish Civil War, theKorean War, the Vietnam War) and by American foreign policy. Fromthe perspective of host countries, Wilkins writes, “nationalism, social-ism, and communism have had profound impact on the path taken byU.S. international businesses.”64 These statements implicitly documentthat the “path” charted by multinational firms in host countries is influ-enced by events in the host country, home country, and beyond. In thisarticle, we attempt to formalize this path dependency of multinationalfirm evolution in the host country by presenting our dynamic trajectoriessynthesizing framework.
InMultinationals and Global Capitalism, Jones states that the mul-tinational investment in a host country does not always lead to long termbenefits for the host country. To quote Jones, “since the nineteenthcentury, they [multinationals] have transferred resources between
63Wilkins, The Maturing of Multinational Enterprise, 417–21.64 Ibid., 439.
Multinational Enterprises in India / 31
1287
1288
1289
1290
1291
1292
1293
1294
1295
1296
1297
1298
1299
1300
1301
1302
1303
1304
1305
1306
1307
1308
1309
1310
1311
1312
1313
1314
1315
1316
1317
1318
1319
1320
1321
1322
1323
1324
1325
1326
1327

countries . . . however, there have been strict limits to the transformingpower of multinationals . . . the knowledge transfers arising from thehuge FDI in developing countries during the first global economy werelimited by the enclavist nature of many investments, and by the reluc-tance to train local workforces.”65 In Multinational Enterprises andthe Global Economy, economists John Dunning and Sarianna Lundanprovide a four-part framework of multinational investment in a hostcountry. Implicit in this framework is the passage of time. In the firstphase, the MNE engages in exports and foreign sourcing; in thesecond phase, the MNE makes investments in marketing and distri-bution; in the third phase, the MNE initiates “foreign production ofintermediate goods and services;” in the fourth phase, the MNE“deepens” and “widens” this value added network; and in the fifth andfinal phase, this leads to the creation of the “integrated networkmultinational.”66
In summary, though business historians and international businessscholars have long considered the element of time in the analysis ofMNEs in host countries, we provide a synthesizing framework that cap-tures several of the assumptions that have been more implicit in the lit-erature. Our historical analysis of British/Anglo-Dutch and AmericanMNEs in India provides evidence to the existence of different dynamictrajectories followed by MNEs in response to changes in the hostcountry policy environment, and future work will have to explore per-formance implications of following different trajectories.
65 Jones, Multinationals and Global Capitalism, 283.66 John H. Dunning and Sarianna M. Lundan, Multinational Enterprises and the Global
Economy, 2nd ed. (Cheltenham, 2008).
Prithwiraj Choudhury and Tarun Khanna / 32
1329
1330
1331
1332
1333
1334
1335
1336
1337
1338
1339
1340
1341
1342
1343
1344
1345
1346
1347
1348
1349
1350
1351
1352
1353
1354
1355
1356
1357
1358
1359
1360
1361
1362
1363
1364
1365
1366
1367
1368
1369
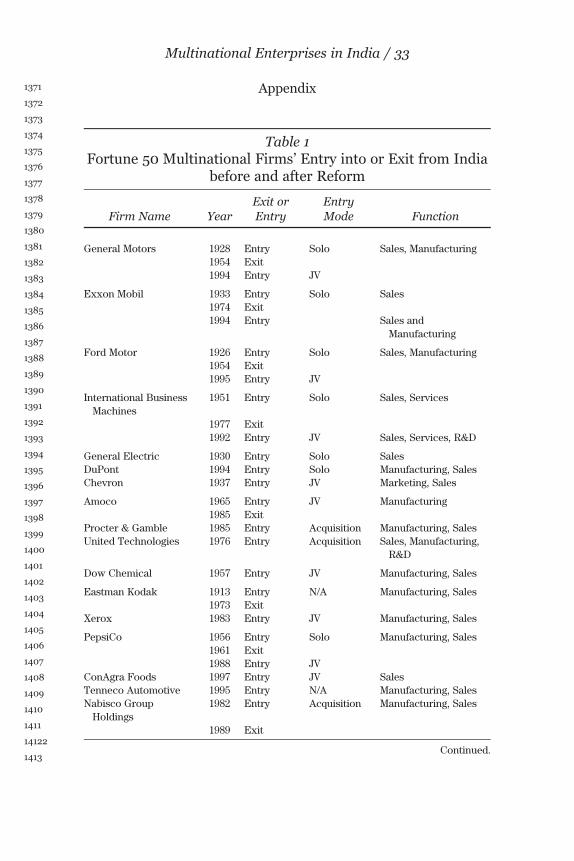
Appendix
Table 1Fortune 50 Multinational Firms’ Entry into or Exit from India
before and after Reform
Firm Name YearExit orEntry
EntryMode Function
General Motors 1928 Entry Solo Sales, Manufacturing1954 Exit1994 Entry JV
Exxon Mobil 1933 Entry Solo Sales1974 Exit1994 Entry Sales and
Manufacturing
Ford Motor 1926 Entry Solo Sales, Manufacturing1954 Exit1995 Entry JV
International BusinessMachines
1951 Entry Solo Sales, Services
1977 Exit1992 Entry JV Sales, Services, R&D
General Electric 1930 Entry Solo SalesDuPont 1994 Entry Solo Manufacturing, SalesChevron 1937 Entry JV Marketing, Sales
Amoco 1965 Entry JV Manufacturing1985 Exit
Procter & Gamble 1985 Entry Acquisition Manufacturing, SalesUnited Technologies 1976 Entry Acquisition Sales, Manufacturing,
R&D
Dow Chemical 1957 Entry JV Manufacturing, Sales
Eastman Kodak 1913 Entry N/A Manufacturing, Sales1973 Exit
Xerox 1983 Entry JV Manufacturing, Sales
PepsiCo 1956 Entry Solo Manufacturing, Sales1961 Exit1988 Entry JV
ConAgra Foods 1997 Entry JV SalesTenneco Automotive 1995 Entry N/A Manufacturing, SalesNabisco GroupHoldings
1982 Entry Acquisition Manufacturing, Sales
1989 Exit
Continued.
Multinational Enterprises in India / 33
1371
1372
1373
1374
1375
1376
1377
1378
1379
1380
1381
1382
1383
1384
1385
1386
1387
1388
1389
1390
1391
1392
1393
1394
1395
1396
1397
1398
1399
1400
1401
1402
1403
1404
1405
1406
1407
1408
1409
1410
1411
14122
1413

Table 1Continued
Firm Name YearExit orEntry
EntryMode Function
Hewlett-Packard 1989 Entry Solo Manufacturing, SalesDigital Equipment 1988 Entry JV Manufacturing, Sales,
Services3M 1988 Entry N/A Manufacturing, Sales,
R&DRockwell Automation 1991 Entry N/A Sales, ServicesHoneywell Intl. 1988 Entry JV ManufacturingSara Lee 1995 Entry JV Manufacturing, SalesCaterpillar 1988 Entry JV SalesGoodyear Tire &Rubber 1961 Entry JV ManufacturingJohnson & Johnson 1957 Entry N/A Manufacturing, SalesMotorola 1989 Entry N/AAlcoa 1998 Entry N/A Sales
Bristol-Myers Squibb 1989 Entry Acquisition Manufacturing, Sales1996 Exit2004 Entry Solo R&D
Coca-Cola 1956 Entry Franchise Manufacturing, Sales1977 Exit1993 Entry Solo
Mobil 1905 Entry Solo Sales1974 Exit1993 Entry Manufacturing, Sales
Texaco 1911 Entry Solo Sales
N/A =Not AvailableNotes: This table lists details of entry and exit events in India for the Fortune 50 firms. Toidentify the firms in the sample, we used the list of Fortune firms as of 1991, the year of theIMF-led reform. To collate this table, we used primary data from multiple sources. The datasources include: SEC Form 10-K Exhibit 21 for each firm, data on company registration inIndia collected by the Ministry of Corporate Affairs (MCA) and the Government of India,and Web searches. We also used the following additional sources: Laura Bloodgood, Competi-tive Conditions for Foreign Direct Investment in India, U.S. International Trade Commission,1 July 2007; Suseela Yesudian, Innovation in India: The Future of Offshoring (New York,2012); Upendra Kachru, Strategic Management: Concepts and Cases (New Delhi, 2005);Pratap Subramanyam, Investment Banking (New Delhi, 2007); Mira Wilkins and FrankE. Hill, American Business Abroad: Ford on Six Continents (Detroit, 1964); Mira Wilkins,Interview with C. Thomas, Bombay, 10 Sept. 1953, Mira Wilkins files, Miami, Florida, sup-plemented by Mira Wilkins, The Maturing of Multinational Enterprise (Cambridge, Mass.,1974).We could not find any entry/exit data for the following firms: Unisys, General Dynamics,Unocal, Sunoco, McDonnell Douglas, Atlantic Richfield, Marathon Oil, Occidental Petroleum,Altria Group, Chrysler.
Prithwiraj Choudhury and Tarun Khanna / 34
1414
1415
1416
1417
1418
1419
1420
1421
1422
1423
1424
1425
1426
1427
1428
1429
1430
1431
1432
1433
1434
1435
1436
1437
1438
1439
1440
1441
1442
1443
1444
1445
1446
1447
1448
1449
1450
1451
1452
1453
1454

Table 2FTSE 50 Multinational Firms’ Entry into or Exit from India
before and after Reform
Firm Name Year Entry or Exit Entry Mode Function
Royal Dutch Shell 1894 Entry Solo Sales1993 Entry JV Manufacturing, Sales
GlaxoSmithKline 1925 Entry Solo SalesBritish AmericanTobacco
1908 Entry Solo Manufacturing, Sales
Willis Corroon 1997 Entry JV ServicesTate & Lyle 1997 Entry N/ARio Tinto Group 1930 Entry N/AStandard Chartered 1858 Entry Solo ServicesBG Group 1995 Entry JV Sales, Manufacturing,
ServicesInchcape 1847 Entry N/A Sales
Barclays 1959 Entry Acquisition Services1969 Exit1989 Entry Solo
Lloyds 1923 Entry Acquisition Services1984 Exit
Unilever 1917 Entry Acquisition Sales
Prudential 1923 Entry Services1998 Entry JV
BT Group 1995 Entry N/A SalesRolls-Royce Group 1991 Entry N/A ServicesBAE Systems 1993 Entry JV Manufacturing, Sales,
R&DReed Elsevier N/A Entry Solo Services, Sales
N/A =Not AvailableNotes: This table lists details of entry and exit events in India for the FTSE 50 firms. To identifythe firms in the sample, we used the list of FTSE 50 firms as of 1991, the year of the IMF-ledreform. To collate this table, we used primary data from multiple sources. The data sourcesinclude: SEC Form 10-K Exhibit 21 for each firm, data on company registration in Indiacollected by the Ministry of Corporate Affairs (MCA) and the Government of India, andWeb searches. We also used the following additional sources: Howard Cox, The GlobalCigarette: Origins and Evolution of British American Tobacco, 1880–1945 (Oxford, 2000),202–37; Geoffrey Jones, British Multinational Banking, 1830–1990 (Oxford, 1993);D. K. Fieldhouse, Unilever Overseas: The Anatomy of a Multinational, 1895–1965 (Stanford,Calif., 1978); Margaret Ackrill and Leslie Hannah, Barclays: The Business of Banking, 1690–1996 (Cambridge, 2001); J. Forbes Munro, Maritime Enterprise and Empire: Sir WilliamMackinnon and His Business Network, 1823–1893 (Woodbridge, U.K., 2003); and JoostJonker and J. L. van Zanden, A History of Royal Dutch Shell. Vol. 1, From Challenger toJoint Industry Leader, 1890–1939 (Oxford, 2007). We could not find any entry/exit datafor the following firms: Eurotunnel, Scottish Power, Northern Foods, Thames Water, Power-Gen, Wiggins Teape Appleton, North West Water, Severn Trent, British Insulated Callender’sCables (BICC), Lonrho, Scottish & Newcastle, Enterprise Oil, Williams Holdings, RMC Group,Lucas Industries, Abbey National, Lasmo, British Steel, Hillsdown Holdings, British Airways,Rothmans International, Argyll Group, or BAA (Now Heathrow Airport Holdings).
Multinational Enterprises in India / 35
1456
1457
1458
1459
1460
1461
1462
1463
1464
1465
1466
1467
1468
1469
1470
1471
1472
1473
1474
1475
1476
1477
1478
1479
1480
1481
1482
1483
1484
1485
1486
1487
1488
1489
1490
1491
1492
1493
1494
1495
1496

Table 3Comparison of Dynamic Trajectories: Unilever, BAT, IBM, and Coca-Cola
Epoch 1: 1970–1990 Epoch 2: 1991–2013
MNE Nationality
Stay/Exit/Enter
Direction ofChange in LocalResponsiveness
Details of Changein Local
ResponsivenessStay/Exit/
Enter
Direction ofChange in LocalResponsiveness
Details of Change inLocal
Responsiveness
Unilever Anglo-Dutch Stay Input side Managerial talentdevelopment pro-grams, manufactur-ing capabilities
Stay Input and outputside
Managerial talent devel-opment programs,manufacturing capa-bilities, modification ofproduct mix throughacquisition of brands
BAT British Stay Input side Manufacturing capa-bilities, captivefarming/ planta-tions, brands,Indian managerialtalent
Stay Input and outputside
Manufacturing capabili-ties, captive farming/plantations, Indianmanagerial talent;building brands andchanging product mix
Coca-Cola
American Exit N/A N/A Re-enter Output and inputside
Acquisition and buildingof brands; local R&D
Prith
wira
jChou
dhury
andTaru
nKhanna/36
1498
1499
1500
1501
1502
1503
1504
1505
1506
1507
1508
1509
1510
1511
1512
1513
1514
1515
1516
1517
1518
1519
1520
1521
1522
1523
1524
1525
1526
1527
1528
1529
1530
1531
1532
1533
1534
1535
1536
1537
1538

IBM
American
Exit
N/A
N/A
Re-en
ter
Outpu
tan
dinpu
tside
Drastic
switch
infunc
-tion
alfocu
sfrom
selling
hardwareto
R&Dan
dtheoffsho
resoftwarede
velopm
ent
mod
el;a
cquisition
ofPwCco
nsultanc
ybu
sine
ssan
dIndian
talent
Multinational Enterprises in India / 37
1540
1541
1542
1543
1544
1545
1546
1547
1548
1549
1550
1551
1552
1553
1554
1555
1556
1557
1558
1559
1560
1561
1562
1563
1564
1565
1566
1567
1568
1569
1570
1571
1572
1573
1574
1575
1576
1577
1578
1579
1580
15812
1582

. . .
PRITHWIRAJ CHOUDHURY is assistant professor at Harvard BusinessSchool. His research is focused on innovation in emerging markets, especiallyon the management of human capital within multinational R&D centers. Hehas also studied innovation by state owned entities in emerging markets andhas an ongoing project on the patenting of herbal medicine by multinationalfirms. In 2010, he was awarded the Haynes Prize by the Academy of Inter-national Business and recognized as the most promising scholar under theage of forty in the field of International Business.
TARUN KHANNA is Jorge Paulo Lemann Professor at Harvard BusinessSchool and Director of Harvard University’s South Asia Institute. An expert onemerging markets, he writes extensively in economic strategy and manage-ment journals, is an occasional newspaper columnist, and was recentlyelected a Fellow of the Academy of International Business and a YoungGlobal Leader by the World Economic Forum. He is the author of Billions ofEntrepreneurs: How China and India are Reshaping their Futures, andYours (Harvard Business Press, 2008), and coauthor ofWinning in EmergingMarkets: A Roadmap for Strategy and Execution (Harvard Business Press,2010).
Prithwiraj Choudhury and Tarun Khanna / 38
1583
1584
1585
1586
1587
1588
1589
1590
1591
1592
1593
1594
1595
1596
1597
1598
1599
1600
1601
1602
1603
1604
1605
1606
1607
1608
1609
1610
1611
1612
1613
1614
1615
1616
1617
1618
1619
1620
1621
1622
1623