principles-based versus rules-based accounting · pdf filetransaction is fas 133...
TRANSCRIPT
I would like to thank Shiva Rajgopal, my Dissertation Committee Chair, for his helpful guidance. I would also like to thank the members of my Dissertation Committee (Dave Burgstahler, Terry Shevlin, Jonathan Karpoff, Ed Rice, and Roland Hjorth) for their useful advice and comments. I appreciate the comments I have received from Bob Bowen, Andy Call, Frank Hodge, Todd Kravet, Dawn Matsumoto, Lisa Sedor, Ryan Wilson, and Jenny Zhang. I am also grateful to Jonathan Karpoff, Gerald S. Martin, and Scott Lee for providing me with data on enforcement actions. Finally, I appreciate the financial assistance I received from the Deloitte Fellowship and PricewaterhouseCoopers.
Principles-Based versus Rules-Based Accounting Standards and
Extreme Cases of Earnings Management
Richard D. Mergenthaler University of Washington
Business School Seattle, WA 98195
Tel: (206) 543-0664, Fax: (206) 685 9392 E-mail: [email protected]
Version: February 4, 2008 Dissertation in progress. Please do not quote without permission.
Comments are welcome.
Abstract: In this study, I investigate whether characteristics that are commonly claimed to indicate whether a standard is principles-based or rules-based are associated with the dollar magnitude of earnings management, the probability of being penalized for earnings management, and the penalty assessed to firms that manage earnings. To address these questions, I develop an instrument that measures the extent to which a standard contains rules-based characteristics. I identify earnings management firms as those firms that restate earnings due to fraud or whose restatement is investigated by the SEC. Finally, I determine whether the SEC penalized earnings management firms by issuing an enforcement action. I find that the SEC is less likely to issue an enforcement action when a firm violates a standard that has more rules-based characteristics. If executives realize they are less likely to be penalized for a rules-based violation, then I expect executives to manage the dollar amount of earnings more when standards contain rules-based characteristics. Consistent with this notion, I find the dollar magnitude of earnings management is greater when an executive violates a standard that has more rules-based characteristics.
Principles-Based versus Rules-Based Accounting Standards and Extreme Cases of Earnings Management
1 Introduction
In this study, I investigate whether rules-based characteristics are associated with the
dollar amount executives manage earnings, the likelihood of being penalized for earnings
management, and the penalty assessed to firms that manage earnings.1 The implications of
shifting away from standards that contain rules-based characteristics are a concern for U.S.
standard setters. In fact, the Sarbanes-Oxley Act required the Securities Exchange Commission
(SEC) to conduct a study investigating the implications of shifting away from standards
containing rules-based characteristics to principles-based standards.2 In the SEC study (2003),
the SEC staff “recommends that those involved in the standard-setting process more consistently
develop standards on a principles-based or objectives-oriented basis” because standards that have
rules-based characteristics “often provide a vehicle for circumventing the intention of the
standard.” SEC Chairman, Christopher Cox, reiterated this focus in a 2006 congressional
hearing. He indicates that the SEC is encouraging the FASB to “develop new standards more
consistent with a principles-based, objectives-oriented system.” This paper provides empirical
evidence about some of the potential implications of shifting away from standards that contain
rules-based characteristics.
1 I use Healy and Wahlen’s (1999) definition of earnings management. Healy and Wahlen (1999) define earnings management as follows.
“Earnings management occurs when managers use judgment in financial reporting and in structuring transactions to alter financial reports to either mislead some stakeholders about the underlying economic performance of the company or to influence contractual outcomes that depend on reported accounting numbers.”
2 Schipper (2003) indicates that U.S. GAAP is based on principles. She indicates that certain characteristics (scope exceptions, treatment exceptions, and implementation guidance) create the perception that U.S. GAAP is rules-based. I am interested in capturing the degree to which these characteristics vary from standard to standard and how this variation influences earnings management. Therefore, although U.S. GAAP is based on principles, the extent to which standards contain these characteristics and the effects of these characteristics on earnings management remains an empirical question.
1
The evidence provided by this study will help inform investors, companies, the FASB,
and the SEC of potential implications of shifting away from standards containing rules-based
characteristics on earnings management. This evidence seems particularly relevant since the
effect of rules-based characteristics on earnings management is not clear. Carnahan (2007)
indicates that standards containing rules-based characteristics foster a “‘check the box mentality’
where the emphasis on black-letter compliance has encouraged companies to actively engineer
their way around the standards.” Furthermore, the SEC (2003) contends that standards
containing rules-based characteristics “not only constitute a guideline to fraud, but a ready-made
set of defenses, providing management and accountants with the colorable claim that they
followed the rules, even while they may have intended to mislead.” Alternatively, the FASB
(2002) indicates that principles-based standards require executives to “apply professional
judgment” to determine the appropriate way to record a business transaction. Robert Herz
(2003), FASB Chairman, indicates, “some point to recent events in the U.S. as evidence that
preparers and auditors cannot be trusted to properly exercise professional judgment with
objectivity and courage.” Overall, it is not clear that executives will manage earnings less in a
principles-based environment than in a rules-based environment. Hence, this study provides
timely evidence on the matter.
This paper adds to the prior earnings management literature by documenting whether the
extent to which a standard contains rules-based characteristics is associated with the dollar
magnitude of earnings management, the probability of being penalized for earnings management,
and the expected penalty levied upon firms that manage earnings. Overall, the evidence
provided in this study furthers our understanding of the factors that influence executives’
decision to manage earnings.
2
Finally, this paper also proposes a new rules-based continuum measure that documents
the extent to which a standard contains rules-based characteristics. This measure can be used to
investigate many research questions in the future. For example, one could investigate (i) whether
the probability and size of a lawsuit differ when a firm violates a standard containing many rules-
based characteristics, (ii) whether and why U.S. standards have become more rules-based over
time, and (iii) whether the presence of a “true and fair override” caveat influences the application
of standards that contain rules-based characteristics.3
There is no agreed upon definition of rules-based standards. However, prior literature
and regulators describe rules-based standards as follows. Schipper (2003) indicates that “U.S.
GAAP is based on a recognizable set of principles derived from the FASB's Conceptual
Framework, but nonetheless contains elements that cause some commentators to conclude that
U.S. accounting is ‘rules-based.’” The SEC (2003) describes rules-based standards in terms of
three “elements:” (1) voluminously detailed implementation guidance, (2) numerous exceptions,
and (3) numerous bright-line tests. Nelson (2003) indicates that rules-based standards contain
“relatively more elaborate rules.”
The above discussion suggests that certain characteristics make standards more rules-
based, or at least appear to be more rules-based. However, providing a clear definition that
identifies rules-based standards is fraught with difficulty because standards do not fit neatly into
two mutually exclusive categories-- one category that is rules-based and another category that is
principles-based. Rather, standards lie along a continuum where the extremes of this continuum
are standards that contain very few rules and standards that contain many rules. In addition, the
“optimal” structure of a standard may vary based upon the underlying complexity of a
3 A “true and fair override” caveat permits departure from the standard’s requirements when complying with the standard would result in a “misleading” presentation of the financial statements.
3
transaction. One example of a standard that prescribes how to account for a complex underlying
transaction is FAS 133 (derivatives). Schipper (2003) indicates that a principles-based derivative
standard would “require all financial instruments to be measured at fair value.” Schipper (2003)
also notes that after stating the intent of the standard, regulators must decide “how much
additional explanation should be provided? How many terms should be defined, and at what
level of detail? How much prescriptive explanation about how to apply the standard, such as
numerical examples, should be included?” These issues are particularly salient when it is
difficult to measure the fair value of a financial instrument. Furthermore, defining what
constitutes a “financial instrument” is not an easy task. Therefore, a standard that prescribes how
to account for a complex transaction, such as derivatives, may require more detail than a
standard that prescribes how to account for a simple transaction. Finally, the task of identifying
rules-based standards or defining the “optimal” standard is further complicated by the desire to
preserve relevance and reliability, while maintaining comparability. Hence, I do not attempt to
provide a normative definition of the “optimal structure of a standard,” but rather approach the
issue from an empirical perspective.
Consistent with Nelson (2003), I discuss the structure of standards “in terms of being
more or less rules-based” where standards lie along a continuum. At the extremes of this
continuum are standards that contain no rules-based characteristics and standards that contain
many rules-based characteristics. I use several sources including the SEC, the FASB, the Big
Four Accounting Firms, and prior literature (Schipper 2003, Nelson 2003, Bartov et al. 2003) to
identify the characteristics of rules-based standards; which include: (1) bright-line thresholds, (2)
scope and legacy exceptions, (3) large volumes of implementation guidance, and (4) a high level
of detail. I then develop a rules-based continuum instrument that measures the extent to which a
4
standard contains these characteristics, and label a standard that contains more characteristics as
being relatively more rules-based.
Next, I obtain a sample of restatements from the Audit Analytics database. My sample
period begins in 1995 and extends through 2006. I classify a firm as an earnings management
firm if it restates earnings because of fraudulent behavior or if its restatement is investigated by
the SEC.4 This procedure provides me with a sample of earnings management firms.5 I then
read the company’s restatement filings (i.e. 10-KA, 10-QA, and 8-K) to identify the GAAP
standards violated and the income statement impact associated with each GAAP violation. My
final sample includes 209 usable earnings management firms. I use these data to explore
whether there is an association between the dollar magnitude of earnings management and the
structure of the standard (i.e. the extent to which a standard contains rules-based characteristics)
violated, holding incentives to manage earnings constant. I also use these data to investigate
whether the likelihood receiving an SEC enforcement action is associated with the structure of
the standard violated. Finally, I document whether there is an association between the magnitude
of the SEC fine and the structure of the standard violated.
I find a positive association between rules-based characteristics and the dollar magnitude
of earnings management. I argue that this is because the expected cost of managing earnings is
lower in a rules-based environment. Two factors that influence the expected cost of earnings
management are the probability of being penalized for earnings management and the expected
penalty for managing earnings. The expected cost of earnings management will be lower when
4 Audit Analytics contains a dummy variable that indicates whether firms disclose that their restatement was investigated by the SEC or whether fraud led to the restatement. I use these indicator variables to identify restatements due to fraud or investigated by the SEC. 5 I acknowledge that my sample likely contains extreme earnings management firms. However, I chose this sample to avoid the presence of technical violations in my sample. Hence, I am relatively confident that the executives in my sample managed earnings. In addition, I am able to identify the standard violated for the firms in my sample.
5
both the probability of being penalized and the penalty for managing earnings are smaller.
Therefore, I expect the probability of being penalized for earnings management and the penalty
associated with earnings management to be lower when an executive violates a standard
containing rules-based characteristics. I find the likelihood of being penalized for earnings
management is indeed lower when a firm violates a standard containing more rules-based
characteristics. However, I find no association between the structure of the standard violated and
the fine imposed on executives who manage earnings.
Currently, the SEC is emphasizing the importance of developing more principles-based
standards. My findings suggest that a shift away from standards that contain many rules-based
characteristics may potentially decrease the dollar magnitude of earnings management. Figure 1
(discussed later) also suggests that U.S. GAAP contains more rules-based characteristics than it
did in the past. The SEC may want to consider the reasons for this shift and the other potential
implications this may have on companies and their stakeholders.
The remainder of the paper is outlined as follows. I develop my hypotheses in Section 2.
In Section 3, I develop the rules-based continuum instrument that measures the extent to which a
standard contains rules-based characteristics. I outline my research design in Section 4 and
discuss my sample selection in Section 5. Section 6 discusses my results and Section 7
concludes.
2 Hypothesis Development
Although prior literature (e.g. Beatty and Weber 2006, Marquardt and Wiedman 2005,
Riedl 2004, Nelson et al. 2002, Imoff and Thomas 1988) indicates earnings management occurs
in both a principles-based environment and rules-based environment, it is not apparent that less
earnings management will occur in a principles-based environment. To determine if there is a
6
difference in the magnitude of earnings management in a principles-based versus a rules-based
environment, it is important to examine the factors that executives consider when deciding to
manage earnings. Executives will maximize their utility from earnings management by setting
the marginal benefit of managing earnings equal to the marginal cost of managing earnings.
Similar to Erlich and Posner (1974), I contend that the probability of being penalized for
earnings management and the penalty imposed on executives who manage earnings are factors
that influence executives’ estimate of the expected cost of earnings management. In this paper, I
discuss how the structure of a standard is related to these factors and, in turn, is related to the
expected cost of earnings management. If the cost of earnings management differs in these
environments, then I also expect magnitude of earnings management to differ.
In the following paragraphs, I describe how the structure of a standard could influence (i)
the likelihood of being penalized for earnings management, (ii) the penalty imposed on
executives who manage earnings, and (iii) the dollar magnitude of earnings management. In
particular, I posit three arguments for a negative association between rules-based standards and
the probability of being penalized for earnings management.
First, executives are less likely to be penalized for transaction structuring within GAAP,
which some contend is facilitated by rules-based characteristics (e.g. SEC 2003; Jopson 2006;
Kroeker 2007). This allegation stems from the fact that rules-based standards often contain
bright-line thresholds, which clearly delineate between two methods of accounting for a
transaction. Executives with incentives to manage earnings will determine a desired outcome
and structure the transaction to ensure that they are able to account for the transaction in a
manner that benefits the firm or themselves. In a law literature review, Kaplow (1999) indicates
that increased advanced specificity “might be problematic because parties will better be able to
7
evade legal norms.” Hence, if rules-based characteristics do facilitate earnings management via
within GAAP transaction structuring, then one could contend that the probability of receiving an
SEC enforcement action is lower when standards contain rules-based characteristics.
Second, if complex standards with voluminous implementation guidance and a high level
of detail are not understood by auditors, then auditors will be less likely to detect earnings
management and the probability of being penalized for violating complex standards with these
characteristics will be lower. One factor that may influence whether auditors are privy to the
requirements of a standard is the cost of becoming informed. The costs of becoming informed
include the cost of hiring experts to train auditors and the time required to train auditors. These
costs are higher when standards are detailed and contain large volumes of implementation
guidance. In addition, auditors may find it difficult to learn and retain knowledge of complex
standards. Sir David Tweedie (2007), Chairman of the IASB, indicates that standards
“frequently baffle many accountants so much so that few audit partners can complete an audit
without relying on the advice of experts within the firm.” If accountants don’t understand
complex standards with rules-based characteristics, then they will be less likely to detect
violations. In turn, executives will be less likely to be penalized for violating complex standards
with rules-based characteristics.
Third, if the SEC does not believe that an executive tried to mislead investors, then the
SEC is less likely to penalize the executive. In the SEC’s 2007 Annual Report, the SEC
indicates that one of their aims is to “halt misconduct, sanction wrongdoers effectively, and,
where possible, return funds to harmed investors.” In instances where executives violate
complex standards with rules-based characteristics, they can claim they did not intend to mislead
investors and contend that the violation was simply due to a misunderstanding of the standard. If
8
the SEC believes executives who violate complex standards with rules-based characteristics do
not intend to mislead investors, then the executives who violate complex standards with rules-
based characteristics are less likely to be penalized by the SEC.
The above three points suggest that executives are less likely to be penalized for
managing earnings when a standard contains more rules-based characteristics. Therefore, my
first hypothesis is as follows.
H1a: The probability of being penalized for earnings management is negatively associated with the extent to which the standard violated contains rules-based characteristics.
On the other hand, a case can also be made that executives who violate standards with
rules-based characteristics are more likely to be penalized for earnings management. As noted
above, rules-based standards generally contain bright-line thresholds that allow enforcement
agencies to clearly determine whether a firm violated a standard. For example, FAS 13 outlines
four thresholds that, if met, require leased assets to be recorded on the balance sheet. An
enforcement agency would simply need to consult the thresholds to determine whether the firm
violated the standard. Due to the fact that this objective evidence can be used against an
executive, one could argue executives will assess a high likelihood of being penalized for
violating a standard that contains bright-line thresholds.
One could also argue that enforcement costs are higher when standards do not contain
rules-based characteristics, leading to a lower probability of enforcement. For example, a
principles-based standard containing no rules-based characteristics could require a company to
capitalize all its investments that will produce “probable future benefits.” In order to determine
if the company violated the standard, the SEC would need to define “probable future benefits,”
determine whether the investment had “probable future benefits,” and justify their decision.
9
Robert Herz (2003), FASB Chairman, indicates “it simply may be harder to properly enforce a
principles-based system . . . this process takes more time than the (already considerable) time
required to decide if a given registrant followed a clearly written rule.” The SEC has limited
resources; therefore, increased enforcement cost will decrease the number of investigations that
can be conducted. If enforcement costs are higher in an environment devoid of rules-based
characteristics, then the number of investigations and the likelihood of an SEC enforcement
action will decrease.
Based on these arguments, one could contend that the probability of an enforcement
action is greater (smaller) when the standard violated contains (does not contain) rules-based
characteristics. Hence, the following competing hypothesis results.
H1b: The probability of being penalized for earnings management is positively associated with the extent to which the standard violated contains rules-based characteristics.
Executives also consider the penalty for earnings management when deciding whether or
not to manage earnings. In the following paragraphs, I hypothesize two reasons why the penalty
for managing earnings will be smaller when an executive violates rules-based standards.
First, within GAAP transaction structuring in a rules-based environment will be
associated with smaller penalties. As noted above, one characteristic of rules-based standards is
bright-line thresholds. In addition, the above discussion indicates that some (e.g. SEC 2003;
Jopson 2006; James Kroeker 2007) contend bright-line thresholds facilitate transaction
structuring within GAAP. Because this is not a violation of GAAP, executives are not expected
to be penalized for this behavior. Hence, if rules-based characteristics facilitate transaction
structuring within GAAP, then penalties levied upon earnings management firms will be smaller
when standards contain rules-based characteristics.
10
Second, increased enforcement costs are likely associated with larger penalties. As noted
above, principles-based standards do not provide objective evidence, making it difficult and
more costly to enforce standards. Becker (1968) contends that higher enforcement costs should
be positively associated with the “optimal” penalty. Hence, if standards devoid of rules-based
characteristics are more costly to enforce, then Becker (1968) suggests the penalty levied upon
firms will be higher when standards are devoid of rules-based characteristics. Furthermore, if the
cost of enforcement is high and the SEC has limited resources, then the SEC will focus its
resources on instances where the harm to investors is greatest. Karpoff et al. (2007a) provides
evidence that indicates penalties levied upon executives who commit fraud are positively
associated with the harm imposed on investors. Therefore, if the SEC only pursues egregious
cases of earnings management when standards are devoid of rules-based characteristics, then one
could argue that penalties will be greater when standards are devoid of rules-based
characteristics.
In summary, these arguments suggest that the penalty for earnings management will be
smaller (greater) when an executive violates a standard containing (not containing) rules-based
characteristics.6 Therefore, my second hypothesis is as follows.
H2a: The penalty for managing earnings will be negatively associated with the extent to which the standard violated contains rules-based characteristics.
On the other hand, one could contend that the penalty levied upon firms that manage
earnings will be larger when an executive violates a standard containing rules-based
characteristics. As noted above, an executive can intentionally violate a complex standard
containing large volumes of implementation guidance and a high level of detail, and claim they
6 I recognize that the probability of an enforcement action may be negatively associated with the penalty imposed on executives. Although I do not explicitly discuss this, I recognize this could influence the association between the structure of the standard violated and the penalty imposed by the SEC.
11
did not intend to mislead investors, but rather misunderstood the complex standard. If the SEC
does not perceive the violation to be intentional, then the probability of being caught and
receiving an SEC fine may be lower. According to Becker (1968), the “optimal” penalty
assessed to firms will be larger when the probability of being caught and penalized is lower. If
complex standards with rules-based characteristics are less likely to be detected and penalized,
then Becker (1968) predicts that the SEC fine assessed to firms that violate standards containing
rules-based characteristics will be large, resulting in the following competing hypothesis results.
H2b: The penalty for managing earnings will be positively associated with the extent to which the standard violated contains rules-based characteristics.
The above arguments provide reasons why the probability of being penalized and the
penalty assessed to executives who manage earnings likely differ depending upon the structure
of the standard violated. These factors likely influence executives’ expected cost of earnings
management. Assuming executives weigh the costs and benefits of earnings management before
deciding whether and how much to manage earnings, the dollar magnitude of earnings
management is likely associated with the structure of the standard violated. If the extent to
which a standard contains rules-based characteristics is associated with a high probability of an
enforcement action and large SEC fines, then the expected cost of earnings management would
be large. As a result, executives would manage earnings less and the dollar magnitude of
earnings management would be smaller. Hence, the following hypothesis predicts a negative
association between standards with rules-based characteristics and the dollar magnitude of
earnings management.
H3a: The dollar magnitude of earnings management will be negatively associated with the extent to which a standard contains rules-based characteristics.
12
However, if standards containing many rules-based characteristics are associated with a
lower probability of an enforcement action and smaller SEC fines, then the expected cost of
earnings management will be small. Hence, rules-based characteristics would be positively
associated with the dollar magnitude of earnings management, leading to the following
competing hypothesis.
H3b: The dollar magnitude of earnings management will be positively associated with the extent to which a standard contains rules-based characteristics.
3 Rules-Based Continuum Measure
In this section, I discuss my measure of the extent to which a standard contains rules-
based characteristics. I use my measure to identify the extent to which APB Opinions, ARBs,
Statement of Financial Accounting Standards, Statement of Financial Accounting Concepts, and
SAB 101 contain rules-based characteristics. A major concern that surfaces is whether U.S.
GAAP contains any principles-based standards. The SEC (2003) contends U.S. GAAP contains
several principles-based standards; in fact, the SEC identifies several principles-based standards
including: (1) ARB 43_4 (inventory pricing), (2) FAS 34 (capitalization of interest costs), (3)
FAS 52 (foreign currency translation), and (4) FAS 121 (impairment of long-lived assets).
Consistent with prior research (Nelson 2003; Schipper 2003; Bartov et al. 2003), I contend that
U.S. standards lie along a continuum where the extremes of this continuum are standards that
contain no rules-based characteristics and standards that contain many rules-based
characteristics. I expect there is enough variation in U.S. GAAP to create a measure that
captures the extent to which a standard contains rules-based characteristics.
I use several sources to determine the characteristics of rules-based standards. First, I
rely on a report issued by the SEC on July 25, 2003. The SEC issued this report in response to
Section 108 of the Sarbanes-Oxley Act of 2002, which required the SEC to conduct a study
13
investigating the following items: (1) the extent to which U.S. GAAP is principles-based, (2) the
length of time required to move to a principles-based financial reporting system, (3) the method
by which a principles-based system can be implemented, and (4) the economic implications of
shifting to a principles-based system. This report explicitly outlines the characteristics of
standards the SEC considers to be rules-based standards. Second, I use a report entitled “A
Vision From the CEOs of the International Audit Networks” to identify additional rules-based
characteristics.7 This report discusses the need to shift to principles-based standards and the
characteristics of rules-based standards that limit the understandability of financial statements.
Third, I utilize a hearing held by the U.S. House of Representatives Financial Services
Committee (2006), which featured testimony from the PCAOB, the SEC, the FASB, and the
AICPA. This hearing discussed the need to move “away from the retrospective, rules-based
reporting.” Finally, I rely on a FASB (2002) report that discusses the characteristics of rules-
based standards in the U.S. and responses to this report by entities such as KPMG, PwC, Deloitte
and Touche, Ernst & Young, and IBM. Each of the above sources is either an authoritative
expert on standard setting or is highly involved in the standard-setting process. Therefore, I use
these sources to determine what characteristics of rules-based standards to include in my
measure. In the following paragraphs, I discuss each of the characteristics I include in my
measure.
7 This report was written by the CEOs of the following accounting firms: (1) PricewaterhouseCoopers, (2) Deloitte and Touche, (3) Ernst and Young, (4) KPMG, (5) Grant Thorton, and (6) BDO Seidman.
14
3.1 Bright-line thresholds
The FASB (2002), KPMG (2002), and SEC (2003) indicate that bright-line thresholds are
a characteristic of rules-based standards.8 The authoritative literature on lease accounting
provides an excellent example of bright-line thresholds. When classifying a lease as either
capital or operating, preparers of financial statements must determine whether the lease meets
one of the four bright-line thresholds. If the lease meets any one of these thresholds, then the
lease is classified as a capital lease, otherwise it is classified and accounted for as an operating
lease. I define a bright-line threshold as a test that includes a numeric threshold which delineates
between two alternative accounting treatments. I identify bright-line thresholds by searching
each standard for the following key words: (1) criteri*, (2) condition*, (3) provision*, (4)
require*, and (5) percent*. I then read the paragraph surrounding these key words to identify
bright-line thresholds. I count the number of numeric bright-line thresholds in each standard to
obtain the total number of bright-line thresholds in each standard.
3.2 Scope and legacy exceptions
Deloitte and Touche (2002), Ernst & Young (2002), the FASB (2002), KPMG (2002),
PricewaterhouseCoopers (2002), the SEC (2003), and the House of Financial Services
Committee (2006) identify scope and legacy exceptions as a characteristic of rules-based
standards.9 Accounting for Derivative Instruments and Hedging Activities (FAS 133) is a good
example of a standard that contains several scope exceptions. The SEC (2003) notes that FAS
8 I investigate violations of GAAP standards. Therefore, one could contend that bright-line thresholds should not be included in my measure because it seems unlikely that an executive would violate a bright-line threshold. Although violations of bright-line thresholds may be unlikely, I argue that some executives will violate bright-line thresholds. For example, some individuals drive 65 mph when the speed limit is 60 mph. This example illustrates that some individuals violate bright-line thresholds. Individuals may violate bright-line thresholds because they believe they will not be caught. Alternatively, the benefit of violating a bright-line threshold may exceed the cost for some individuals; hence, these individuals will choose to violate bright-line thresholds. Therefore, I include bright-line thresholds in my rules-based continuum measure. 9 The SEC (2003) contends that scope and legacy exceptions make standards more rules-based because scope and legacy exceptions often lead to “inconsistent accounting among companies for similar transactions.”
15
133 contains nine scope exceptions. In addition, a standard may have legacy exceptions, which
exempt certain industries from complying with the standard. I search each standard for the
following key words: (1) not subject, (2) not consider*, (3) exclusion*, (4) exempt*, (5) except*,
(6) scope, and (7) does not apply. I then read the paragraphs surrounding these words to identify
scope and legacy exceptions. I count the number of scope and legacy exceptions in each
standard to determine the total number of exceptions in each standard.
3.3 Large volumes of implementation guidance
The SEC (2003), FASB (2002), IBM (2002), and PwC (2002) report that another
thumbprint of rules-based standards is large volumes of implementation guidance. On the other
hand, these reports also indicate that principles-based standards should contain some
implementation guidance.10 Accordingly, I focus on standards that have large volumes of
implementation guidance, which I operationalize as follows. First, I count the number of
“interpretive pronouncements” documents that relate to each standard.11 Next, I sort the
standards by the number of “interpretive pronouncements.” Finally, I classify standards in the
top “interpretive pronouncement” decile as standards with large volumes of implementation
guidance.12
10 Nelson and Clor-Proell (2006) find that implementation guidance can be used by managers as a justification to increase income or lower expenses. They conclude that regulators can encourage conservatism by providing examples that disallow (allow) revenue (expense) recognition. 11 In the summary of each standard, the SEC identifies the “interpretive pronouncements” that relate to each standard. “Interpretive pronouncements” are generally issued by the FASB or AICPA (e.g. EITFs, SOPs, or DIGs). 12 In response to instances of earnings management, the SEC may issue additional implementation guidance, add more detail, or add bright-line thresholds to make it more difficult for executives to manage earnings. Hence, regulators’ response to earnings management may make standards more rules-based. However, H3a and H3b suggest that rules-based characteristics are associated with the dollar amount executives manage earnings. Therefore, it may be difficult to ascertain whether rules-based characteristics influence the magnitude of earnings management or whether regulators’ response to earnings management makes standards more rules-based. I attempt to differentiate between these two explanations by making the following research design decisions. First, I measure RBC as of the first year of the manipulation period (i.e. the first year the executive managed earnings) because regulators are unaware of the firm’s earnings management at this point in time. Hence, regulators’ ex-post responses to the firm’s violation are not reflected in my measure. Second, I look at a relatively short time period where many of my observations are clustered between the years 2000 and 2004. As a result, most standards did not
16
3.4 High level of detail
In the SEC report (2003), the SEC identifies a high level of detail as another
characteristic of rules-based accounting standards. Similar to standards with large volumes of
implementation guidance, I identify standards that contain a high level of detail by performing
the following procedure: (i) I count the number of words in each standard; (ii) I rank the
standards by the total number of words in each standard; and (iii) I classify those standards in the
upper detail decile as “high level of detail” standards.
3.5 Rules-based continuum score
I use two proxies that measure the extent to which a standard contains rules-based
characteristics. I discuss these two rules-based continuum measures in the following paragraphs.
My first measure, RBC1, is obtained by performing the following steps. First, I
document which standards have bright-line thresholds, exceptions, large volumes of
implementation guidance (as defined above), and a high level of detail (as defined above). I add
one point to RBC1 when the characteristic is found in the standard (e.g. one point is added if the
standard has at least one scope or legacy exception). The maximum value of the RBC1 is four
and the minimum value is zero. This measure equally weights each criterion and places equal
weight on standards with high and low values of each characteristic.
I define the characteristic values of my second measure, RBC2, as follows.
1. Bright-line Exceptions--The total number of bright line exceptions.
2. Scope and Legacy Exceptions--The total number of scope and legacy exceptions.
3. Implementation Guidance--The total number of “interpretive pronouncement”
documents.
change during my sample period. Hence, the rules-based continuum score of those standards is not influenced by regulators’ reactions to earnings management.
17
4. Detail--The total number of words in each standard.
The below equation outlines how RBC2 is calculated.
4
Value=1
Value -ValueRBC2 =
σ i
ijtjt
i
i∑
First, I calculate the value of characteristic i for standard j at year t (Valueijt). Second, I compute
the average value of characteristic i across all standards ( Valuei ). Third, I calculate the standard
deviation of characteristic i across all standards ( ). Fourth, I subtract Valueσ i Valuei from Valueijt.
Fifth, I divide the difference between Valueijt and Valuei by Valueiσ , providing me with a
characteristic score for standard j at time t. The characteristic score is a measure of how extreme
the value of characteristic i for standard j at time t is, relative to the characteristic i value of other
standards. I repeat this process for each characteristic of standard j at time t. Finally, I sum the
characteristic scores of standard j at time t to obtain an overall measure of the extent to which the
standard contains rules-based characteristics. RBC2 differs from RBC1 in that it gives greater
weight to standards that have extreme characteristic values relative to other standards.
Table 1 provides the median rules-based continuum score for select standards. This table
illustrates the extent to which these standards contain rules-based characteristics. The higher the
RBC1 or RBC2 score the more rules-based characteristics the standard contains. As noted
above, the SEC identified several principles-based standards in its 2003 report. I document the
median RBC score of several of these standards including ARB 43_4 (inventory pricing), FAS
34 (capitalization of interest costs), FAS 52 (foreign currency translation), and FAS 121
(impairment of long-lived assets). Consistent with the SEC, I find that these standards contain
fewer rules-based characteristics. For example, the RBC1 (RBC2) score for ARB 43_4 is 0 (-
1.58), indicating that ARB 43_4 contains relatively few rules-based characteristics. However,
18
the SEC also identifies FAS 141 (business combinations), FAS 142 (goodwill), and FAS 144
(impairment of long-lived assets) as principles-based standards. The RBC1 score for FAS 141,
FAS 142, and FAS 144 is three, indicating that these standards contain relatively more rules-
based characteristics than the above-mentioned standards. Even though these standards have no
bright-line thresholds, the RBC score for these standards is higher because of the number of
“interpretive pronouncement” documents and the level of detail in these standards. Finally, the
SEC identifies FAS 13 (leases), FAS 66 (gain/loss on the sale of real-estate), FAS 87 (pension
accounting), FAS 109 (Income Taxes), FAS 123 (stock compensation), FAS 133 (derivatives),
and FAS 140 (transfers and servicing of financial assets) as rules-based standards. My measure
also identifies these standards as rules-based (i.e. standards containing relatively more rules-
based characteristics).
Figure 1 displays the average RBC1 and RBC2 score by year. The yearly average RBC
score is calculated using all standards that are applicable to companies for that particular year.
For example, the effective date for FAS 121 was December 15, 1995. In addition, FAS 121 was
superseded on December 15, 2001. Therefore, FAS 121 was included in the calculation of the
RBC mean from 1995 to 2001. This figure indicates that both RBC1 and RBC2 have steadily
increased over time, which suggests that U.S. GAAP now contains more rules-based
characteristics than it did in the past.
There are several potential reasons why U.S. GAAP contains more rules-based
characteristics. First, Dye (2002) indicates that, in the presence of “classification manipulation”
(i.e. earnings management), there will be a divergence from the official standard to a “shadow
standard” that is less effective at capturing the true economics of the underlying transaction. Dye
(2002) indicates that regulators can either change the official standard, which keeps the “shadow
19
standard” constant, or keep the official standard constant, which leads to a change in the
“shadow standard.” Hence, regulators may add new rules to a standard in an attempt to curb
“classification manipulation,” which will lead to an increase in the structure of a standard over
time. Second, one could argue that executives obtain refuge from the litigation by showing that
they comply with the letter of the law. Schipper (2003) indicates that one potential effect of
increased implementation guidance is “reduced incidence of litigation over allegedly defective
accounting.” If companies lobby for additional rules to reduce the incidence of litigation, then
this may lead to an increase in the structure of a standard over time. Finally, one could argue
that businesses have become more complex over time leading to an increase in the complexity of
standards.
4 Data and Sample Selection
Panel A of Table 2 details my sample selection process. I obtained a sample of 7,180
firm restatements from the Audit Analytics database. I use this restatement sample to identify
potential earnings management firms. However, not all firms that restate earnings have managed
earnings. Therefore, I only classify a firm as an earnings management firm when the firm
discloses that the restatement was investigated by the SEC or when the firm discloses that fraud
led to the restatement.13 This provides me with a sample of 511 earnings management firms. I
chose this sample because I am reasonably comfortable that I have captured firms that have
managed earnings. In addition, I am able to document which standard was violated and the
dollar amount of the violation by reading the firm’s 10-KA, 10-QA, and/or 8-K.14 I also require
13 An SEC investigation is not the same as an SEC enforcement action. First, the SEC informally/formally investigates the firm. After gathering information, the SEC decides whether or not to issue an enforcement action. 14 I also considered using other proxies for earnings management such as performance adjusted abnormal accruals (Kothari et al. 2005). However, in samples such as this, it is difficult to determine what standard the firm violated. In addition, I contend that abnormal accrual proxies have greater measurement error than my measure of earnings management.
20
firms to have the requisite data on Compustat to calculate the control variables I include in my
analysis. Finally, I am not able to find information on the standard violated or the amount of the
violation for 129 firms. Therefore, my final sample includes 209 firms.
I obtained the SEC enforcement action data from Karpoff, Lee, and Martin’s (JFE 2007a,
JFQA 2007b,) database. They collected the data from several sources.15 First, the SEC discloses
all enforcement actions that occurred after September 19, 1995 on its web site. Information
about the penalties imposed on these firms are obtained from the Department of Justice and
through supplemental searches of the Lexis-Nexis’ FEDSEC: SECREL library. Finally,
additional public information about the enforcement action was obtained through searches
performed on EDGAR, Lexis-Nexis’ Academic Business News, Legal Research, and General
News Categories.
Panel B of Table 2 provides a distribution of my sample by year, where year is defined as
the first year of the manipulation period (i.e. the first year the executive allegedly managed
earnings). My sample period begins in 1995, but the majority (i.e. approximately 71.3%) of my
sample falls in the years 2000 through 2004. This is consistent with the onslaught of corporate
misconduct (e.g. Enron, Adelphia, and Worldcom) that was detected during these years.
5 Research Design
In this section of the paper, I discuss the research design I employ to test my three
hypotheses regarding the likelihood of being penalized for earnings management, the penalty
imposed on executives who manage earnings, and the amount of earnings management.
15 I am grateful to Jonathan Karpoff, Gerald S. Martin, and Scott Lee for providing me with data on enforcement actions.
21
5.1 Likelihood of being penalized for earnings management
H1a and H1b are competing hypotheses that predict a negative (positive) association
between rules-based characteristics and the likelihood of being penalized for managing earnings.
My proxy for the likelihood of being penalized for earnings management is a dummy variable
(EA) that equals one if a firm’s restatement resulted in an SEC enforcement action and zero
otherwise.16 In the following paragraphs, I outline the control variables I include in my analysis
along with the model I use to test hypothesis one.
5.1.1 Resource constraint
The SEC indicates that one of its mandates is to “protect investors.” However, the SEC
has limited resources and must decide the most effective way to allocate these resources.17 One
way the SEC could allocate its resources is to focus its efforts on instances where the potential
harm to investors is greatest. Therefore, the SEC likely employs more resources monitoring
large firms. I include the natural log of the market value of equity (LNMKTVAL) to control for
firm size in my analysis.
5.1.2 Ability to pay
In the SEC’s 2007 annual report, the SEC indicates that one of its objectives is to “return
funds to harmed investors.” If the SEC is unable to accomplish this objective, then I expect the
SEC to be less likely to pursue an enforcement action. Therefore, I include free cash flows
16 My sample includes firms that disclose that their restatement was investigated by the SEC or was due to fraud. However, I do not control for the firm’s decision to disclose an SEC investigation or fraud. I chose not to control for the firm’s disclosure decision because it is not apparent how the rules-based continuum score of standards violated by firms that don’t disclose is systematically different from the rules-based continuum score of standards violated by firms that do disclose. Hence, it is unclear how firm’s disclosure decision is correlated with the rules-based classification of standards violated. 17 I attempt to control for certain factors that likely influence the SEC’s decision to issue an enforcement action, but I do not model the SEC’s policing function and recognize that the SEC’s policing function is not likely constant over time.
22
(FCF) and a bankruptcy proxy (DLST) in my analysis to control for the firm’s ability to pay the
SEC fine. I expect the SEC to pursue firms that are more able to pay the SEC fine.
5.1.3 Size of harm
The SEC also indicates that one of its aims is to “sanction wrongdoers effectively.”
However, as noted above, the SEC has limited resources to pursue wrongdoers. Therefore, the
SEC likely focuses its efforts on instances where investor losses are most egregious. I include
the amount the executive managed earnings scaled by total assets (IS_AMT/TA) as a proxy for
the harm imposed on investors in my analysis. If the SEC only pursues cases where investor
losses are greatest, then the relation between the likelihood of an enforcement action and investor
losses may not be linear. Thus, I include the square of IS_AMT/TA in my analysis. I expect a
positive association between the likelihood of an enforcement action and investor losses.
5.1.4 Model 1
I employ a logistic regression where I regress EA (an enforcement action dummy
variable defined above) on the RBC measure and the above noted control variables. If after
issuing an enforcement action, the SEC adds rules to a standard to mitigate future earnings
management, then the association between RBC and the SEC enforcement action dummy
variable may reflect the SEC’s reaction to earnings management. To avoid this, I measure RBC
as of the first year of the manipulation period (i.e. the first year the executive managed earnings)
because regulators are unaware of the firm’s earnings management at this point in time. Hence,
regulators, response or ex-post adjustments to the firm’s violation are not reflected in my
measure. In the SEC enforcement action analysis, I limit my sample to restatements that began
before 2002. I do this to ensure that the SEC has had sufficient time to issue an enforcement
action. I chose 2002, because the average number of years between the time the executive began
23
managing earnings and the time the SEC begins its regulatory enforcement is typically five
years. My data on enforcement actions extends through 2006; hence, I eliminate restatements
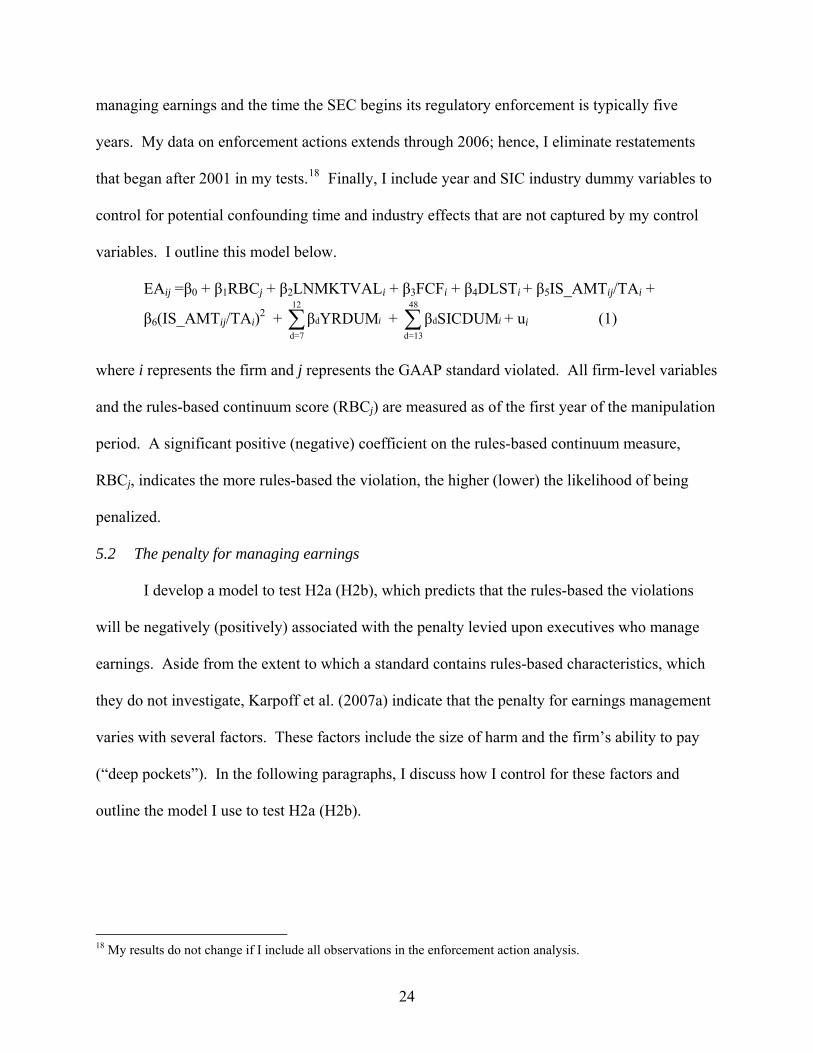
that began after 2001 in my tests.18 Finally, I include year and SIC industry dummy variables to
control for potential confounding time and industry effects that are not captured by my control
variables. I outline this model below.
EAij =β0 + β1RBCj + β2LNMKTVALi + β3FCFi + β4DLSTi + β5IS_AMTij/TAi +
β6(IS_AMTij/TAi)2 + + + u12
dd=7β YRDUMi∑
48
dd=13
β SICDUMi∑ i (1)
where i represents the firm and j represents the GAAP standard violated. All firm-level variables
and the rules-based continuum score (RBCj) are measured as of the first year of the manipulation
period. A significant positive (negative) coefficient on the rules-based continuum measure,
RBCj, indicates the more rules-based the violation, the higher (lower) the likelihood of being
penalized.
5.2 The penalty for managing earnings
I develop a model to test H2a (H2b), which predicts that the rules-based the violations
will be negatively (positively) associated with the penalty levied upon executives who manage
earnings. Aside from the extent to which a standard contains rules-based characteristics, which
they do not investigate, Karpoff et al. (2007a) indicate that the penalty for earnings management
varies with several factors. These factors include the size of harm and the firm’s ability to pay
(“deep pockets”). In the following paragraphs, I discuss how I control for these factors and
outline the model I use to test H2a (H2b).
18 My results do not change if I include all observations in the enforcement action analysis.
24
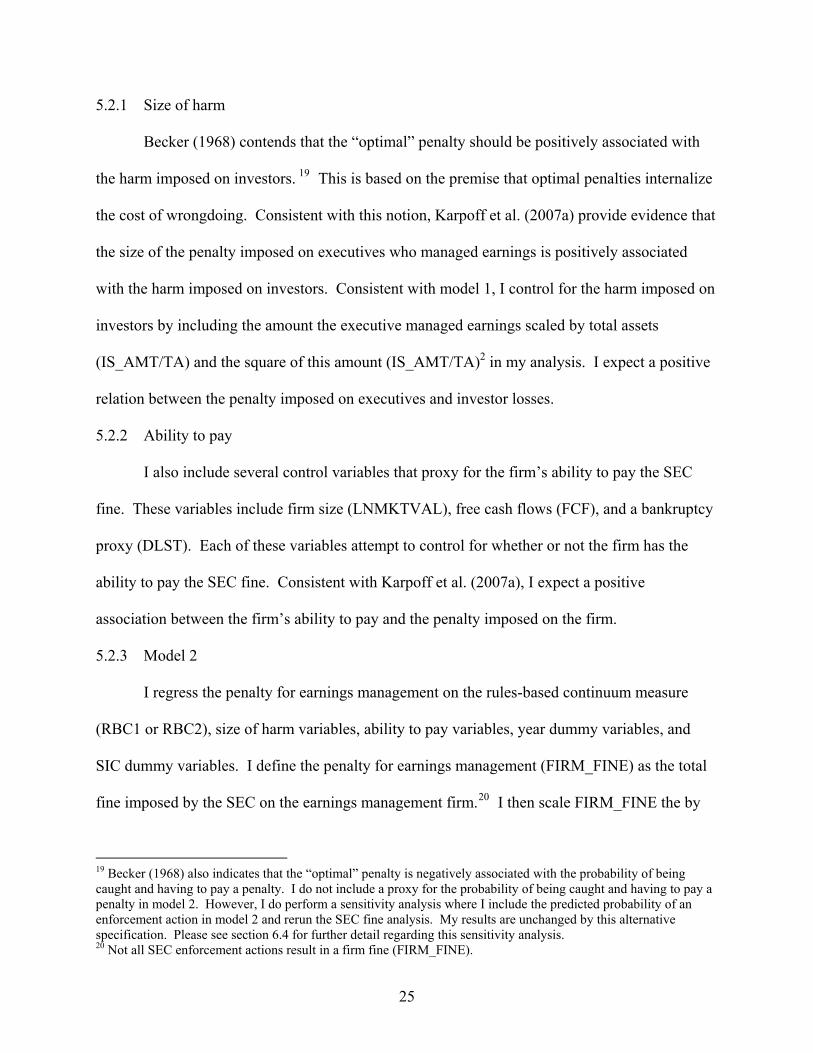
5.2.1 Size of harm
Becker (1968) contends that the “optimal” penalty should be positively associated with
the harm imposed on investors. 19 This is based on the premise that optimal penalties internalize
the cost of wrongdoing. Consistent with this notion, Karpoff et al. (2007a) provide evidence that
the size of the penalty imposed on executives who managed earnings is positively associated
with the harm imposed on investors. Consistent with model 1, I control for the harm imposed on
investors by including the amount the executive managed earnings scaled by total assets
(IS_AMT/TA) and the square of this amount (IS_AMT/TA)2 in my analysis. I expect a positive
relation between the penalty imposed on executives and investor losses.
5.2.2 Ability to pay
I also include several control variables that proxy for the firm’s ability to pay the SEC
fine. These variables include firm size (LNMKTVAL), free cash flows (FCF), and a bankruptcy
proxy (DLST). Each of these variables attempt to control for whether or not the firm has the
ability to pay the SEC fine. Consistent with Karpoff et al. (2007a), I expect a positive
association between the firm’s ability to pay and the penalty imposed on the firm.
5.2.3 Model 2
I regress the penalty for earnings management on the rules-based continuum measure
(RBC1 or RBC2), size of harm variables, ability to pay variables, year dummy variables, and
SIC dummy variables. I define the penalty for earnings management (FIRM_FINE) as the total
fine imposed by the SEC on the earnings management firm.20 I then scale FIRM_FINE the by
19 Becker (1968) also indicates that the “optimal” penalty is negatively associated with the probability of being caught and having to pay a penalty. I do not include a proxy for the probability of being caught and having to pay a penalty in model 2. However, I do perform a sensitivity analysis where I include the predicted probability of an enforcement action in model 2 and rerun the SEC fine analysis. My results are unchanged by this alternative specification. Please see section 6.4 for further detail regarding this sensitivity analysis. 20 Not all SEC enforcement actions result in a firm fine (FIRM_FINE).
25
restated total assets as of the first year of the manipulation period (Firm_FINE/TA). Consistent
with the enforcement action analysis, I limit the number of observations in the SEC fine analysis
to years before 2001 and measure RBC as of the first year of the manipulation period. These
steps ensure that the SEC has had time to fine the company and that the RBC measure is not
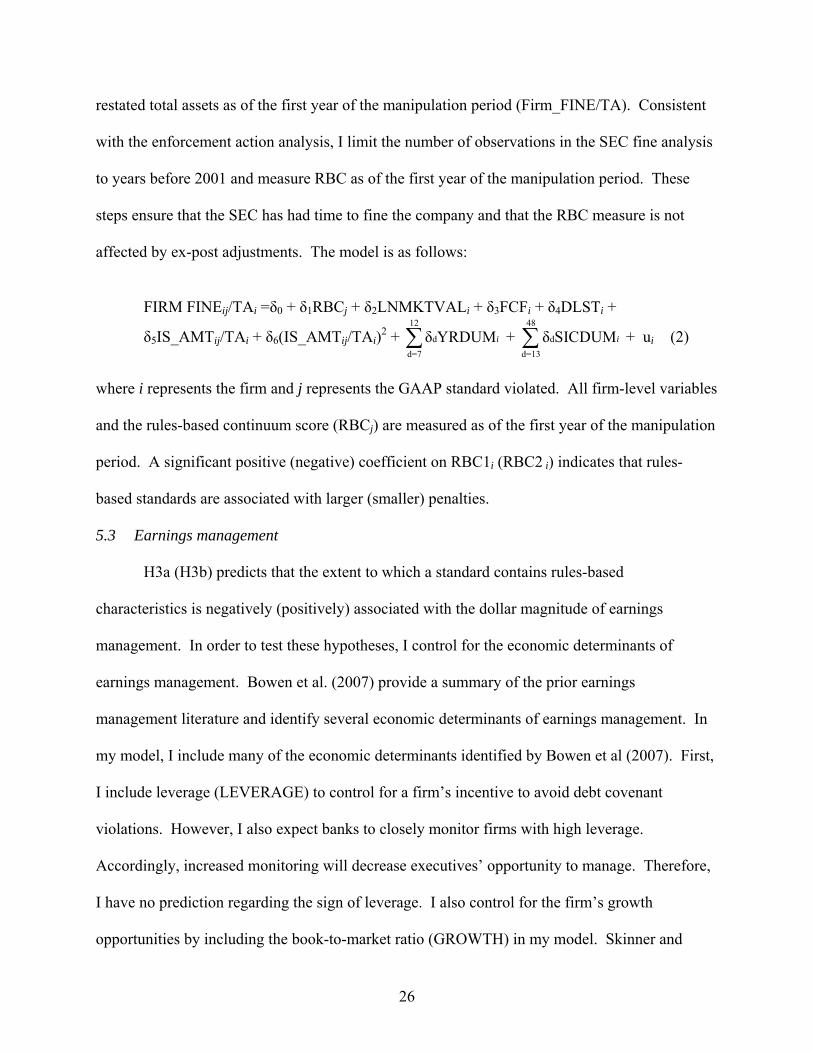
affected by ex-post adjustments. The model is as follows:
FIRM FINEij/TAi =δ0 + δ1RBCj + δ2LNMKTVALi + δ3FCFi + δ4DLSTi +
δ5IS_AMTij/TAi + δ6(IS_AMTij/TAi)2 + + + u12
dd=7δ YRDUMi∑
48
dd=13
δ SICDUMi∑ i (2)
where i represents the firm and j represents the GAAP standard violated. All firm-level variables
and the rules-based continuum score (RBCj) are measured as of the first year of the manipulation
period. A significant positive (negative) coefficient on RBC1i (RBC2 i) indicates that rules-
based standards are associated with larger (smaller) penalties.
5.3 Earnings management
H3a (H3b) predicts that the extent to which a standard contains rules-based
characteristics is negatively (positively) associated with the dollar magnitude of earnings
management. In order to test these hypotheses, I control for the economic determinants of
earnings management. Bowen et al. (2007) provide a summary of the prior earnings
management literature and identify several economic determinants of earnings management. In
my model, I include many of the economic determinants identified by Bowen et al (2007). First,
I include leverage (LEVERAGE) to control for a firm’s incentive to avoid debt covenant
violations. However, I also expect banks to closely monitor firms with high leverage.
Accordingly, increased monitoring will decrease executives’ opportunity to manage. Therefore,
I have no prediction regarding the sign of leverage. I also control for the firm’s growth
opportunities by including the book-to-market ratio (GROWTH) in my model. Skinner and
26
Sloan (1999) find that the market severely penalizes growth firms that miss earnings targets.
Therefore, I expect high growth firms (i.e. firms with a low book-to-market ratio) to manage
earnings more. Third, I control for the demand for external financing by including free cash
flows (FCF) in my analysis. I expect firms with high free cash flows to have smaller incentives
to manage earnings. Finally, I control for political cost incentives by including the natural log of
the market value of equity (LNMKTVAL) in my analysis. I expect large firms with high
political costs to manage earnings less.
Including the above-mentioned economic determinants of earnings management in my
model controls for other factors, aside from the structure of a standard, which might be
associated with earnings management. I obtain the income statement adjustment related to each
GAAP violation from the company’s SEC filings (10-K, 10-Q, or 8-K). I multiply this amount
by negative one to obtain the dollar amount the executive overstated (understated) net income
during the manipulation period. I scale this amount by restated total assets (IS_AMT/TA), as of
the first year of the manipulation period, to obtain a measure for how large the dollar magnitude
of earnings management is relative to the size of the company. I regress IS_AMT/TA on a proxy
for the structure of the standard (j) violated (RBC1 or RBC2) measured as of the first year of the
manipulation period, economic determinants of earnings management, year dummy variables,
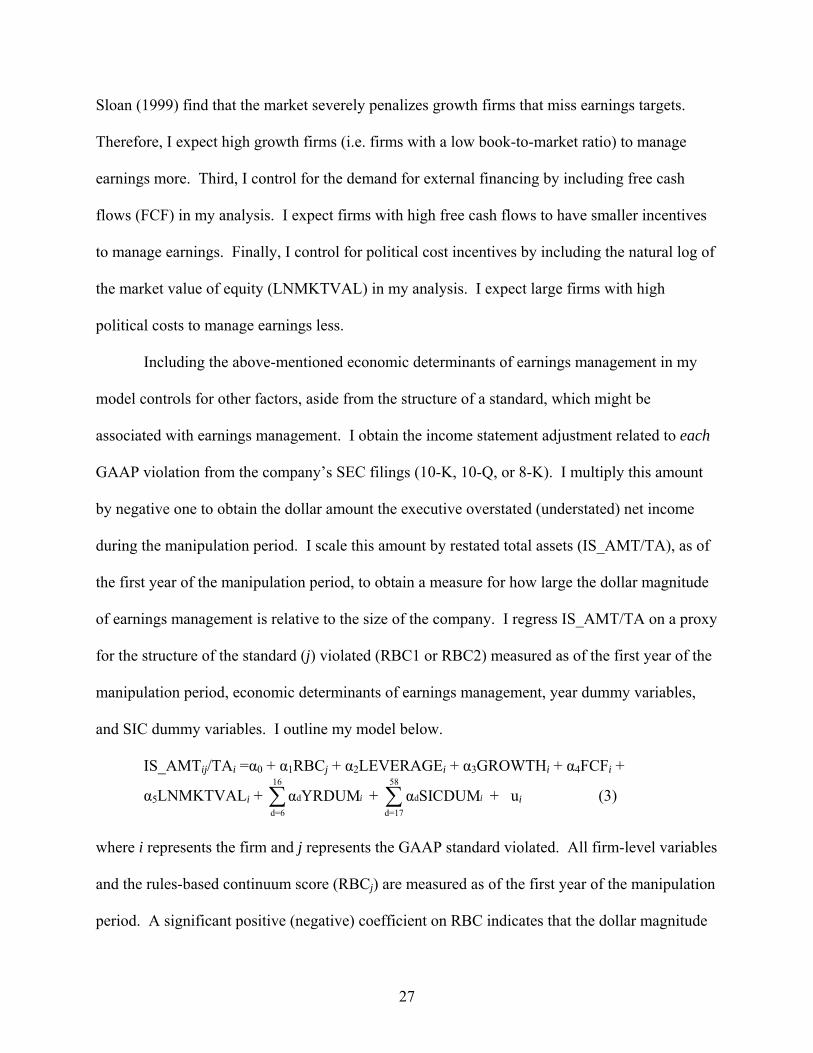
and SIC dummy variables. I outline my model below.
IS_AMTij/TAi =α0 + α1RBCj + α2LEVERAGEi + α3GROWTHi + α4FCFi +
α5LNMKTVALi + + + u16
dd=6α YRDUMi∑
58
dd=17
α SICDUMi∑ i (3)
where i represents the firm and j represents the GAAP standard violated. All firm-level variables
and the rules-based continuum score (RBCj) are measured as of the first year of the manipulation
period. A significant positive (negative) coefficient on RBC indicates that the dollar magnitude
27
of earnings management is greater (smaller) when a firm violates a standard containing rules-
based characteristics.
6 Empirical Results
Table 3 provides descriptive statistics for the variables used in my analyses. Panel A of
Table 3 shows that the median GAAP violation (IS_AMT) overstates earnings by $2.59
million.21 In addition, my earnings management proxies (IS_AMT and IS_AMT/TA) are highly
skewed to the right. The mean earnings management amount is approximately 27.4 percent of
total assets while the median earnings management amount is approximately 0.5 percent of total
assets. To ensure that the skewness of these variables does not affect my results, I winzorize all
independent and dependent variables by setting all variables that lie below the 1st percentile
(above the 99th percentile) to the 1st (99th) percentile value. I also rerun my analyses using the
natural log of earnings management scaled by total assets (LN(IS_AMT/TA)). Untabulated
results are robust to this alternative specification.22 The median RBC1 (RBC2) score is 3 (3.34).
This indicates that there are many rules-based violations in my sample. However, the
distribution also indicates that I capture principles-based standards (e.g. the first quartile of
RBC1 is zero and the first quartile of RBC2 is below -.26). In an untabulated analysis, I
compute the average size, leverage, and book-to-market ratio of firms on Compustat during my
sample period. The average firm in my sample is larger, less levered, and has a lower book-to-
market ratio than the average firm in the Compustat universe. In addition, approximately eight
percent of the firms in my sample are delisted from their stock exchange in the years following 21 The number of observations is greater than 209 for IS_AMT, IS_AMT/TA, LN(IS_AMT/TA), RBC1, RBC2, EA, FIRM_FINE, and FIRM_FINE/TA because each firm restatement can have multiple GAAP violations. These variables are specific to the GAAP standard violated. Hence, my sample includes 390 GAAP standard violations. In addition, the number of observations is less than 390 for EA, FIRM_FINE, and FIRM_FINE/TA because I exclude observations from years after 2001 to ensure that the SEC has had time to issue an enforcement action for the GAAP violation. Therefore, of the 390 GAAP violations in my sample, 253 GAAP violations occurred from 1995 through 2001. 22 See section 6.4 “Sensitivity Analyses” for further detail about this and other sensitivity analyses.
28
their restatement. Approximately 39.9 percent of GAAP violations in my sample result in an
SEC enforcement action.
Panel B of Table 3 provides Pearson correlations among my dependent and independent
variables. This table illustrates a significant positive univariate correlation between rules-based
characteristics (RBC1 or RBC2) and earnings management (IS_AMT/TA). This suggests that
violations standards containing rules-based characteristics are associated with larger magnitudes
of earnings management. Panel B of Table 3 displays a significant negative association between
RBC1 or RBC2 and the enforcement action dummy (EA). Panel B of Table 3 also displays a
significant negative association between RBC1 or RBC2 and the amount of the SEC fine. These
associations imply that executives are less likely to be penalized and the penalty is smaller when
executives violate a standard containing rules-based characteristics. Finally, I observe a
significant positive association between free cash flows, size (LNMKTVAL), and the
enforcement action dummy. This implies that the SEC targets larger firms with greater free cash
flows. In the following paragraphs, I provide the results from the multivariate tests of these
relationships.
6.1 The effect of the structure of a standard on the likelihood of an enforcement action
First, I explore whether the extent to which a standard contains rules-based characteristics
is associated with the likelihood that an earnings management firm receives an enforcement
action. The dependent variable in Table 4 is a dummy variable that equals one if the earnings
management resulted in an enforcement action and is equal to zero otherwise. I employ a
logistic regression where I regress the enforcement action dummy variable (EA) on my rules-
based continuum score (RBC1 or RBC2), investor harm variables (IS_AMT/TA and
(IS_AMT/TA)2), ability to pay variables (FCF and DLST), and the natural log of market value.
In this analysis, I limit my sample to GAAP violations that began before 2002 to ensure the SEC
29
has had time to issue an enforcement action. Hence, of the 390 GAAP violations in my sample,
this analysis includes 224 GAAP violations. Columns 1 (2) discuss results associated with
RBC1 (RBC2). In column 1, consistent with my expectations, I find that the likelihood of an
enforcement action increases with firm size (χ2 = 3.97 [p-value = .046]) and free cash flows (χ2 =
2.90 [p-value = .089]). This indicates that the SEC focuses its efforts on large firms and firms
that have greater free cash flow. I also find a significant negative association between the extent
to which a standard contains rules-based characteristics (RBC1 (χ2 = 5.69 [p-value = .017]) and
RBC2 (χ2 = 5.73 [p-value = .017])) and the likelihood of an enforcement action. This finding
supports H1a, indicating the more rules-based the standard violated, the lower the likelihood of
an enforcement action. In an untabulated calculation, I calculate the change in the implied
probability of an enforcement action at different values of RBC1 (RBC2). Holding all
continuous variables at their mean and all dummy variables at zero, the implied probability of an
enforcement action when RBC1 (RBC2) is equal to the 25th percentile value is 13.42 % (4.68 %).
However, the implied probability of an enforcement action when RBC1 (RBC2) is equal to the
75th percentile value, holding other variables unchanged, is 4.05 % (0.21 %). Thus, the change
from the 25th percentile RBC1 (RBC2) value to the 75th percentile value results in a 9.37 % (4.47
%) decrease in the implied probability of an enforcement action. Overall, the results indicate
that executives are less likely to be penalized by the SEC when they violate standards containing
rules-based characteristics. In addition, the change in the implied probability of an SEC
enforcement action at different values of RBC appears to be substantial.
6.2 The effect of the structure of a standard on the penalty imposed on executives who manage earnings
Next, I explore the association between the penalty imposed on executives who manage
earnings and the structure of the standard violated. Consistent with the enforcement action
30
analysis, I limit my sample in this analysis to GAAP violations that began before 2002 to ensure
the SEC has had time to fine the earnings management firm. Therefore, of the 390 GAAP
violations in my sample, this analysis includes 224 GAAP violations. In Table 5, I find some
evidence that the SEC fine is greater for large firms (t = 1.72, 1.64). In addition, I find that the
SEC issues smaller penalties to firms that delist (DLST) from their exchange after the
restatement (t = -2.84, -2.88). I use DLST as a proxy for bankruptcy and interpret this as
indicating the SEC levies smaller penalties on firms that are less able to pay the SEC fine. This
result is consistent with Karpoff et al. (2007a). However, I find no evidence of a relationship
between rules-based standards and the penalty imposed on executives who managed earnings.
This non-result may be due to several factors. First, I focus on monetary penalties levied by the
SEC, but there are also non-monetary penalties, such as jail time, that I do not capture in my
analysis. Furthermore, I do not capture the non-regulatory penalties such as derivative and class
action lawsuits. Therefore, my results either indicate that there is no relationship between the
structure of a standard and the penalty imposed on firms or that I do not capture the full penalty
imposed on firms that manage earnings.
6.3 The effect of the structure of a standard on the amount of earnings management
Finally, I explore the association between the structure of a standard and the amount of
earnings management. I regress the magnitude of earnings management (i.e. the amount
executives overstated earnings during the manipulation period) scaled by total assets
(IS_AMT/TA) on the rules-based continuum (RBC) score, the economic determinants of
earnings management, year dummy variables, and SIC industry dummy variables.23 This
23 The earnings management amount is specific to the standard (j) violated and does not equal the cumulative restatement amount when multiple GAAP violations occur.
31
analysis incorporates all GAAP violations containing the requisite data for the above control
variables, resulting in a sample of 334 GAAP violations.
In Table 6, I find a positive association between the rules-based continuum scores (RBC1
(t = 2.19) and RBC2 (t = 2.39)) and the dollar amount of earnings management. This finding
supports H3b, indicating the more rule-based the standard violated, the greater the magnitude of
earnings management. In an untabulated calculation, I determine the marginal effect of an
increase in the value of RBC1 (RBC2) from its 25th percentile value to its 75th percentile value.
This increase in the value of RBC1 (RBC2) is associated with a 0.30 % (0.18 %) increase in the
dollar amount of earnings management relative to total assets. My results also suggest that large
firms (t = -2.42, -2.38) and firms with higher free cash flows (t = -5.07, -4.55) manage the dollar
amount of earnings less. Finally, I providence evidence that firms with high leverage (t = -3.14,
-3.35) manage the dollar amount of earnings less. This result may be mechanically driven by the
fact that I scale debt and IS_AMT by total assets. However, I perform a sensitivity analysis
(untabulated) where I scale IS_AMT by the firm’s market value of equity and my results are
unchanged. Therefore, my results do not appear to be driven by the scalar I chose. Overall, I
provide evidence that the more rules-based the violation the greater the dollar magnitude of
earnings management.
6.4 Sensitivity analyses
As noted in the hypothesis development section, executives likely consider the
probability of being penalized and the expected penalty for earnings management when deciding
whether and how much to manage earnings. This suggests that the amount executives manage
earnings, the probability of being penalized, and the penalty for managing earnings should be
modeled in a simultaneous regression framework. Therefore, in untabulated analyses, I employ a
32
two-stage least squares approach to control for the potential simultaneity of this decision. First, I
obtain predicted values for EA and FIRM_FINE/TA by regressing EA and FIRM_FINE/TA on
all the exogenous independent variables (all variables in Models 1 and 2 except IS_AMT/TA and
(IS_AMT/TA)2). I then include predicted EA and FIRM_FINE/TA variables as additional
independent variables in Model 3. I rerun the earnings management regression (i.e. Model 3)
and my results are not changed. I also employ a SUR model where I run Models 1, 2, and 3
simultaneously and my results are unchanged.
An additional concern that arises is whether my results are driven by extreme
observations or by the scale I chose. This is a concern because of the skewness of IS_AMT/TA.
To ensure that this skewness does not affect my results I use the natural log of IS_AMT/TA as
the dependent variable in Model 3. Using the natural log of IS_AMT/TA as my dependent
variable does not change my results. I also scale IS_AMT by the market value of equity
(measured as of the first year of the manipulation period) and lagged total assets (measured as of
the year before the first year of the manipulation period). My results are unchanged when I use
these alternative scales. Finally, I scale IS_AMT by the lagged market value of equity
(measured as of the year before the first year of the manipulation period). Using this scale
results in a 20 percent decrease in my sample due to the fact that the lagged market value of
equity is missing for many observations. In spite of this, RBC2 is significant and positive with a
t-statistic of 1.96, and RBC1 is positive, but not significant.
In addition to numeric bright line thresholds, I count the number of non-numeric bright
line thresholds. An example of a non-numeric bright-line threshold is the bargain purchase
option in FAS 13. I recalculate my RBC measures (RBC1 and RBC2) using the total number of
numeric and non-numeric bright line thresholds. I then rerun my analyses (untabulated) using
33
these refined RBC measures and my results are unchanged. I chose not to include these non-
numeric thresholds in my main analyses because identifying non-numeric thresholds involves
some subjective judgments whereas identifying numeric thresholds is more objective.
Finally, it is important to note that the distribution of SEC fines is truncated at zero.
Therefore, the coefficient estimates produced by OLS are biased. In an untabulated analysis, I
rerun the SEC fine analysis using a Heckman two stage model. The first stage models the SEC’s
decision to issue an enforcement action. In the second stage, I modify model 2 by including the
predicted value of an enforcement action as an additional independent variable and rerun the
SEC fine analysis. My conclusions are unchanged by this alternative specification.
7 Conclusion
This study provides the following contributions. First, I provide empirical evidence
about some potential effects of shifting away from standards containing rules-based
characteristics. Specifically, I provide evidence on whether the extent to which a standard
contains rules-based characteristics is associated with the dollar amount executives manage
earnings. Second, I develop a rules-based continuum instrument that measures the extent to
which a standard contains rules-based characteristics. Finally, I add to the earnings management
literature by documenting whether the extent to which a standard contains rules-based
characteristics is associated with the likelihood of an SEC enforcement action and the penalty
imposed by the SEC, which executives likely consider when deciding whether to manage
earnings.
I find that the SEC is less likely to issue an enforcement action when the executive
violates a standard containing rules-based characteristics. However, I find no evidence that the
structure of a standard is associated with the size of the SEC fine. If executives realize that the
34
likelihood of receiving an SEC enforcement action is lower when the violating a standard
containing rules-based characteristics, then I expect the dollar magnitude of earnings
management to be greater in a rules-based environment. Consistent with this expectation, my
findings suggest that the more rules-based characteristics a standard contains the greater the
dollar magnitude of earnings management.
This study has at least three limitations. First, I only investigate restatements that result
in an SEC investigation or are due to fraud. Therefore, my sample likely captures extreme cases
of earnings management. Thus, my results may not apply to more subtle cases of earnings
management. Second, I only investigate cases where earnings management was alleged or
detected. Therefore, my results may not apply to instances where earnings management is not
detected. Third, I only investigate penalties imposed by the SEC. I recognize that there are
many other penalties executives could receive for managing earnings including career concerns,
non-regulatory penalties, and non-monetary penalties. Therefore, my conclusions about the
association between the likelihood of being penalized and the penalty received cannot be readily
generalized to the other above noted penalties.
35
References
Bartov, E., P. Fairfield, E. Hirst, T. E. Iannaconi, L. Maines, R. Mallett, C. M. Schrand, D. Skinner, and L. Vincent. 2003. Evaluating concepts-based vs. rules-based approaches to standard setting. Accounting Horizons 17: 73-89. Beatty, A., and J. Weber. 2006. Accounting discretion in fair value estimates: An examination of SFAS 142 goodwill impairments. Journal of Accounting Research 44: 257-288. Becker, G. S. 1968. Crime and punishment: An economic approach. The Journal of Political Economy 76: 169-217. Bowen, R., S. Rajgopal, M. Venkatachalam. 2007. Accounting discretion, corporate governance and firm performance. Contemporary Accounting Research (Forthcoming). Carnachan, R. (2007). The case for competition between U.S. GAAP and IFRS in U.S. capital markets. Working paper, Harvard University, Cambridge, MA. Deloitte and Touche LLP. 2002. Comment letter no. 30 on the FASB proposal for a principles-based approach to U.S. standard setting. http://www.fasb.org/ocl/1125-001/13528.pdf. Dye, R. A. 2002. Classifications manipulation and Nash accounting standards. Journal of Accounting Research 40: 1125-1162. Erlich, I., R. A. Posner. 1974. An economic analysis of legal rulemaking. The Journal of Legal Studies 3: 257-286. Ernst & Young. 2002. Comment letter no. 129 on the FASB proposal for a principles-based approach to U.S. standard setting. http://www.fasb.org/ocl/1125-001/14506.pdf. Financial Accounting Standards Board. 2002. Principles-based approach to standard setting. http://www.fasb.org/project/principles-based_approach_project.shtml. Healy, P. M., Wahlen, J. M., 1999. A review of the earnings management literature and its implications for standard setting. Accounting Horizons 13: 365–383. Herz, R. 2003. A year of challenge and change for the FASB. Accounting Horizons 27: 247-255. IBM Corporation. 2002. Comment letter no. 15 on the FASB proposal for a principles-based approach to U.S. standard setting. http://www.fasb.org/ocl/1125-001/13449.pdf. Imhoff, E., and J. Thomas. 1988. Economic consequences of accounting standards: The lease disclosure rule change. Journal of Accounting and Economics 10: 277-310. Jopson, B. 2006. Auditors told to make courageous judgments. Financial Times, April 3, p. 16.
36
Kaplow, L. General characteristics of rules. Encyclopedia of Law and Economics, edited by B. Bouckaert, and G. De Geest, 502-528. Cheltenham, U.K. Karpoff, J. M., D. S. Lee, G. S. Martin. 2007a. The legal penalties for financial misrepresentation. Journal of Financial Economics (forthcoming). ------. 2007b. The cost to firms of cooking the books. Journal of Finance and Quantitative Analysis (forthcoming). Kothari, S.P., A. Leone, and C.Wasley. 2005. Performance matched discretionary accrual measures. Journal of Accounting and Economics 39: 163-197. KPMG. 2002. Comment letter no. 37 on the FASB proposal for a principles-based approach to U.S. standard setting. http://www.fasb.org/ocl/1125-001/13573.pdf. Kroeker, J. 2007. Remarks before the 2007 conference on principles-based accounting and the challenges of implementation. http://www.sec.gov/news/speech/2007/spch040407jlk.htm. Marquardt, C., and C. Weidman. 2005. Earnings management through transaction structuring: Contingent convertible debt and diluted earnings per share. Journal of Accounting Research 43: 205-243. Nelson, M. W., J. A. Elliott, and R. L. Tarpley. 2002. Evidence from auditors about managers’ and auditors’ earnings management decisions. The Accounting Review 77: 175-202. Nelson, M. W. 2003. Behavioral evidence on the effects of principles- and rules-based standards. Accounting Horizons 17: 91-104. Nelson, M. W., S. Clor-Proell. 2007. Accounting standards, implementation guidance, and example-based reasoning. Journal of Accounting Research 45: 699-730. PricewaterhouseCoopers. 2002. Comment letter no. 38a on the FASB proposal for a principles-based approach to U.S. standard setting. http://www.fasb.org/ocl/1125-001/14002.pdf. Riedl, E. 2004. An examination of long-lived asset impairments. The Accounting Review 79: 823-852. Securities and Exchange Commission. 2003. Study pursuant to Section 108(d) of the Sarbanes-Oxley Act of 2002 on the adoption by the United States Financial Reporting System of a principles-based accounting system. http://www.sec.gov/news/studies/principlesbasedstand.htm. Schipper, K. 2003. Principles-based accounting standards. Accounting Horizons 17: 61-72. Skinner, D., and R. Sloan. 2002. Earnings surprises, growth expectations, and stock returns or don't let an earnings torpedo sink your portfolio. Review of Accounting Studies 7: 289-312.
37
Tweedie, D. 2007. Can global standards be principle based? Journal of Applied Research in Accounting and Finance 2: 3-8. U.S. Chamber of Commerce. 2006. Fostering accuracy and transparency in financial reporting. http://www.uschamber.com/NR/rdonlyres/eif7f5jvdkp7wjesg3e2uzzpc6mklbhygxne6rwo4cmvw7s7c4dn6qd7uzlti6cx3bkoxp3i2o456phckw365e6wdrh/MicrosoftWordDHirschmann32906testimony.pdf.
38
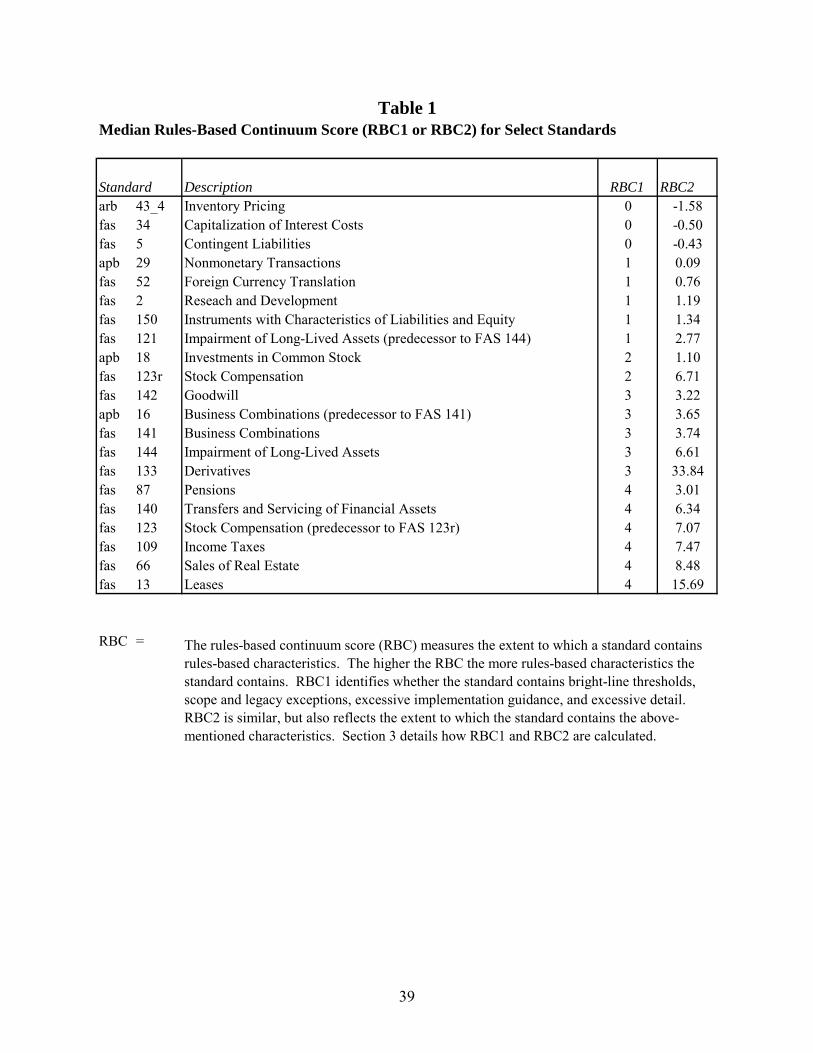
Description RBC1 RBC2arb 43_4 Inventory Pricing 0 -1.58fas 34 Capitalization of Interest Costs 0 -0.50fas 5 Contingent Liabilities 0 -0.43apb 29 Nonmonetary Transactions 1 0.09fas 52 Foreign Currency Translation 1 0.76fas 2 Reseach and Development 1 1.19fas 150 Instruments with Characteristics of Liabilities and Equity 1 1.34fas 121 Impairment of Long-Lived Assets (predecessor to FAS 144) 1 2.77apb 18 Investments in Common Stock 2 1.10fas 123r Stock Compensation 2 6.71fas 142 Goodwill 3 3.22apb 16 Business Combinations (predecessor to FAS 141) 3 3.65fas 141 Business Combinations 3 3.74fas 144 Impairment of Long-Lived Assets 3 6.61fas 133 Derivatives 3 33.84fas 87 Pensions 4 3.01fas 140 Transfers and Servicing of Financial Assets 4 6.34fas 123 Stock Compensation (predecessor to FAS 123r) 4 7.07fas 109 Income Taxes 4 7.47fas 66 Sales of Real Estate 4 8.48fas 13 Leases 4 15.69
RBC = The rules-based continuum score (RBC) measures the extent to which a standard contains rules-based characteristics. The higher the RBC the more rules-based characteristics the standard contains. RBC1 identifies whether the standard contains bright-line thresholds, scope and legacy exceptions, excessive implementation guidance, and excessive detail. RBC2 is similar, but also reflects the extent to which the standard contains the above-mentioned characteristics. Section 3 details how RBC1 and RBC2 are calculated.
Standard
Table 1Median Rules-Based Continuum Score (RBC1 or RBC2) for Select Standards
39
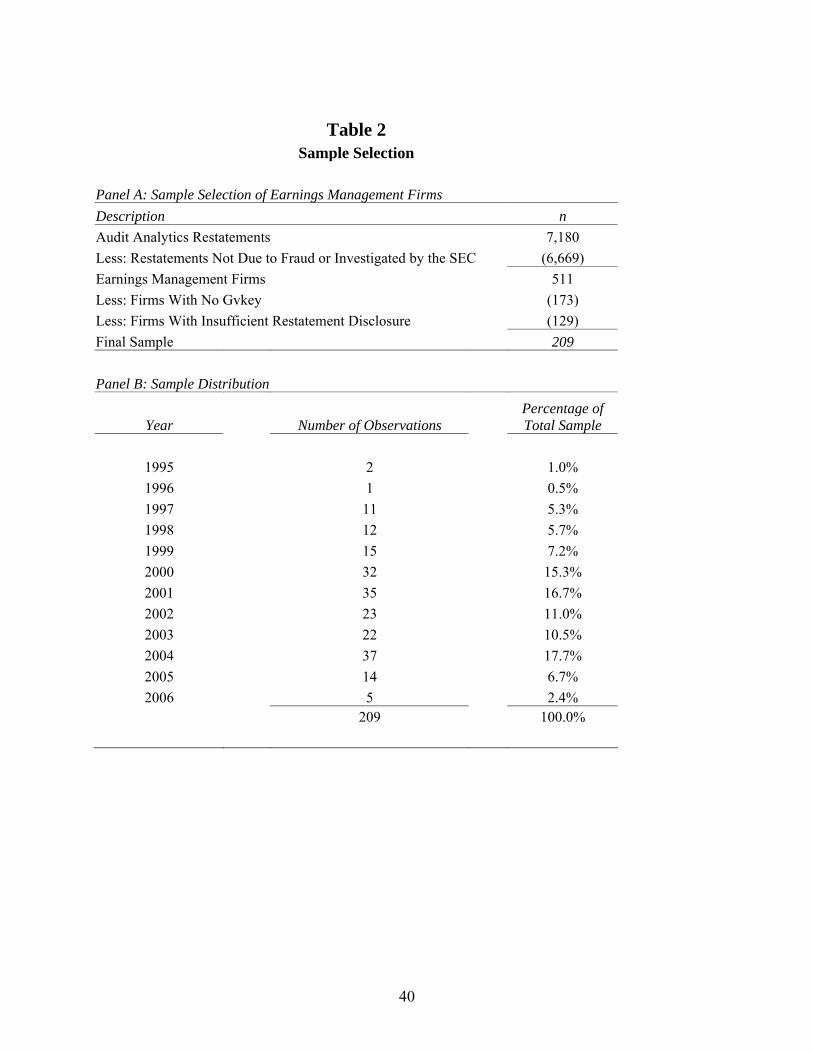
Table 2
Sample Selection Panel A: Sample Selection of Earnings Management Firms Description n Audit Analytics Restatements 7,180 Less: Restatements Not Due to Fraud or Investigated by the SEC (6,669) Earnings Management Firms 511 Less: Firms With No Gvkey (173) Less: Firms With Insufficient Restatement Disclosure (129) Final Sample 209 Panel B: Sample Distribution
Year Number of Observations Percentage of Total Sample
1995 2 1.0% 1996 1 0.5% 1997 11 5.3% 1998 12 5.7% 1999 15 7.2% 2000 32 15.3% 2001 35 16.7% 2002 23 11.0% 2003 22 10.5% 2004 37 17.7% 2005 14 6.7% 2006 5 2.4%
209 100.0%
40
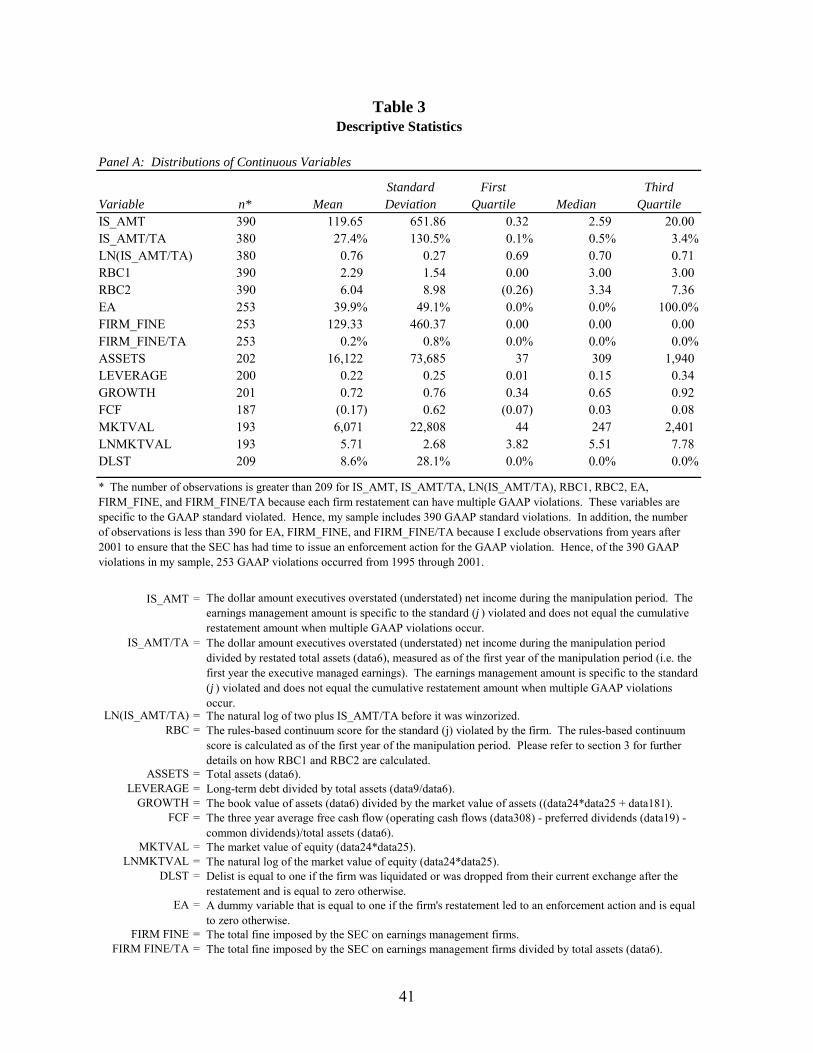
Panel A: Distributions of Continuous Variables
Standard First ThirdVariable n* Mean Deviation Quartile Median QuartileIS_AMT 390 119.65 651.86 0.32 2.59 20.00IS_AMT/TA 380 27.4% 130.5% 0.1% 0.5% 3.4%LN(IS_AMT/TA) 380 0.76 0.27 0.69 0.70 0.71RBC1 390 2.29 1.54 0.00 3.00 3.00RBC2 390 6.04 8.98 (0.26) 3.34 7.36EA 253 39.9% 49.1% 0.0% 0.0% 100.0%FIRM_FINE 253 129.33 460.37 0.00 0.00 0.00FIRM_FINE/TA 253 0.2% 0.8% 0.0% 0.0% 0.0%
Table 3Descriptive Statistics
ASSETS 202 16,122 73,685 37 309 1,940 LEVERAGE 200 0.22 0.25 0.01 0.15 0.34GROWTH 201 0.72 0.76 0.34 0.65 0.92FCF 187 (0.17) 0.62 (0.07) 0.03 0.08MKTVAL 193 6,071 22,808 44 247 2,401 LNMKTVAL 193 5.71 2.68 3.82 5.51 7.78DLST 209 8.6% 28.1% 0.0% 0.0% 0.0%
IS_AMT =
IS_AMT/TA =
LN(IS_AMT/TA) =RBC =
ASSETS =LEVERAGE =
GROWTH =FCF =
MKTVAL =LNMKTVAL =
DLST =
EA =
FIRM FINE =FIRM FINE/TA =
The dollar amount executives overstated (understated) net income during the manipulation period. The earnings management amount is specific to the standard (j ) violated and does not equal the cumulative restatement amount when multiple GAAP violations occur.
The natural log of two plus IS_AMT/TA before it was winzorized.
* The number of observations is greater than 209 for IS_AMT, IS_AMT/TA, LN(IS_AMT/TA), RBC1, RBC2, EA, FIRM_FINE, and FIRM_FINE/TA because each firm restatement can have multiple GAAP violations. These variables are specific to the GAAP standard violated. Hence, my sample includes 390 GAAP standard violations. In addition, the number of observations is less than 390 for EA, FIRM_FINE, and FIRM_FINE/TA because I exclude observations from years after 2001 to ensure that the SEC has had time to issue an enforcement action for the GAAP violation. Hence, of the 390 GAAP violations in my sample, 253 GAAP violations occurred from 1995 through 2001.
The total fine imposed by the SEC on earnings management firms.The total fine imposed by the SEC on earnings management firms divided by total assets (data6).
A dummy variable that is equal to one if the firm's restatement led to an enforcement action and is equal to zero otherwise.
Delist is equal to one if the firm was liquidated or was dropped from their current exchange after the restatement and is equal to zero otherwise.
The rules-based continuum score for the standard (j) violated by the firm. The rules-based continuum score is calculated as of the first year of the manipulation period. Please refer to section 3 for further details on how RBC1 and RBC2 are calculated.
The dollar amount executives overstated (understated) net income during the manipulation period divided by restated total assets (data6), measured as of the first year of the manipulation period (i.e. the first year the executive managed earnings). The earnings management amount is specific to the standard (j ) violated and does not equal the cumulative restatement amount when multiple GAAP violations occur.
The market value of equity (data24*data25).The natural log of the market value of equity (data24*data25).
The three year average free cash flow (operating cash flows (data308) - preferred dividends (data19) - common dividends)/total assets (data6).
The book value of assets (data6) divided by the market value of assets ((data24*data25 + data181).Long-term debt divided by total assets (data9/data6).Total assets (data6).
41
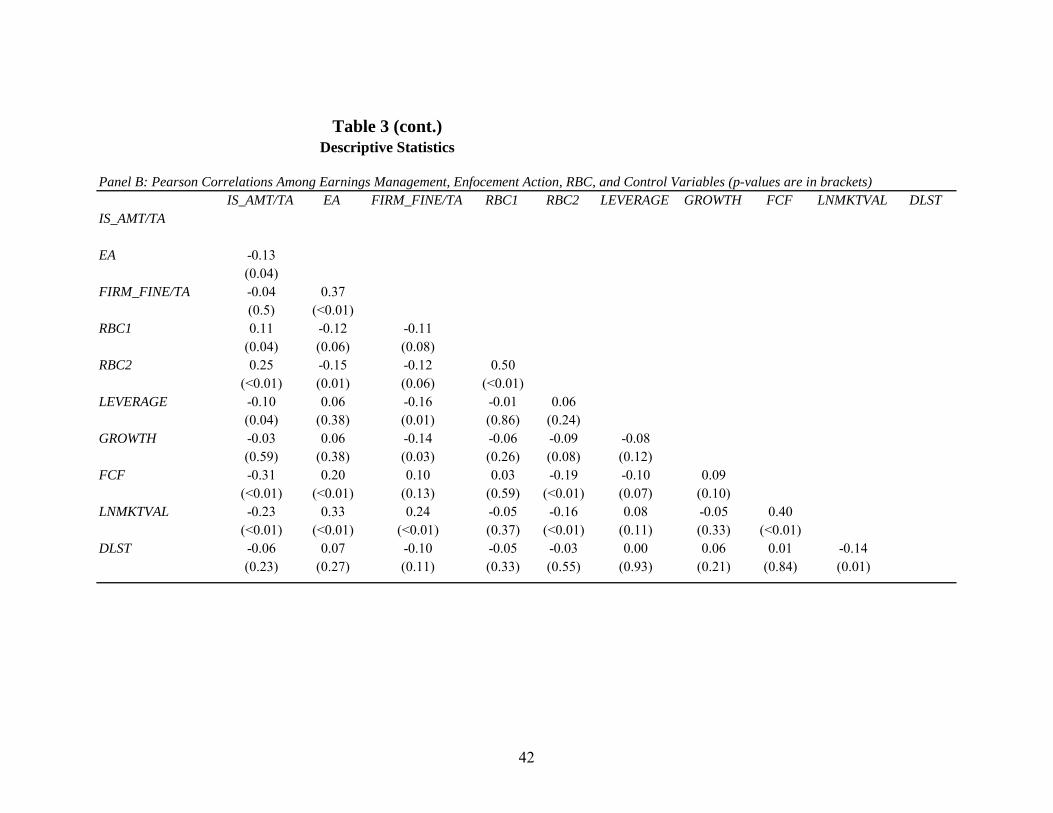
42
Panel B: Pearson Correlations Among Earnings Management, Enfocement Action, RBC, and Control Variables (p-values are in brackets)IS_AMT/TA EA FIRM_FINE/TA RBC1 RBC2 LEVERAGE GROWTH FCF LNMKTVAL DLST
IS_AMT/TA
EA -0.13(0.04)
FIRM_FINE/TA -0.04 0.37(0.5) (<0.01)
RBC1 0.11 -0.12 -0.11(0.04) (0.06) (0.08)
RBC2 0.25 -0.15 -0.12 0.50(<0.01) (0.01) (0.06) (<0.01)
LEVERAGE -0.10 0.06 -0.16 -0.01 0.06(0.04) (0.38) (0.01) (0.86) (0.24)
GROWTH -0.03 0.06 -0.14 -0.06 -0.09 -0.08(0.59) (0.38) (0.03) (0.26) (0.08) (0.12)
FCF -0.31 0.20 0.10 0.03 -0.19 -0.10 0.09(<0.01) (<0.01) (0.13) (0.59) (<0.01) (0.07) (0.10)
LNMKTVAL -0.23 0.33 0.24 -0.05 -0.16 0.08 -0.05 0.40(<0.01) (<0.01) (<0.01) (0.37) (<0.01) (0.11) (0.33) (<0.01)
DLST -0.06 0.07 -0.10 -0.05 -0.03 0.00 0.06 0.01 -0.14(0.23) (0.27) (0.11) (0.33) (0.55) (0.93) (0.21) (0.84) (0.01)
Table 3 (cont.)Descriptive Statistics
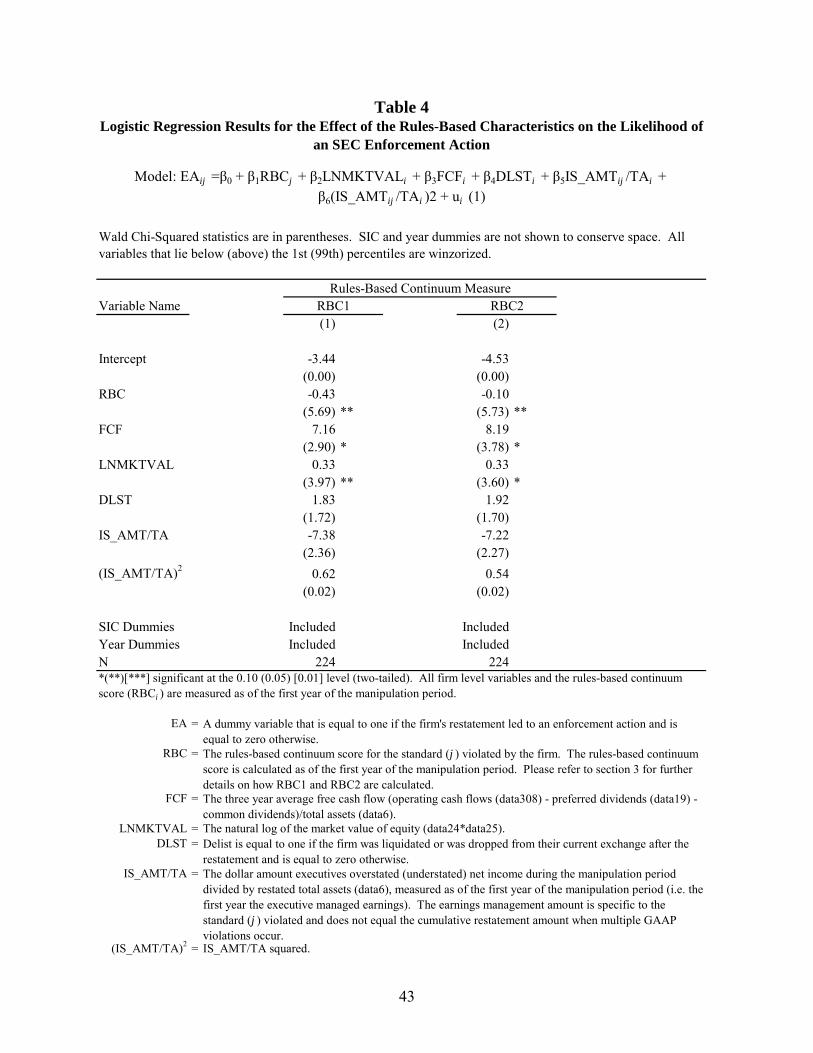
Variable Name(1) (2)
Intercept -3.44 -4.53(0.00) (0.00)
RBC -0.43 -0.10(5.69) ** (5.73) **
FCF 7.16 8.19(2.90) * (3.78) *
LNMKTVAL 0.33 0.33(3.97) ** (3.60) *
DLST 1.83 1.92(1.72) (1.70)
IS_AMT/TA -7.38 -7.22(2.36) (2.27)
(IS_AMT/TA)2 0.62 0.54(0.02) (0.02)
SIC Dummies Included IncludedYear Dummies Included IncludedN 224 224
EA =
RBC =
FCF =
LNMKTVAL =DLST =
IS_AMT/TA =
(IS_AMT/TA)2 = IS_AMT/TA squared.
Table 4
Delist is equal to one if the firm was liquidated or was dropped from their current exchange after the restatement and is equal to zero otherwise.
Rules-Based Continuum MeasureRBC1 RBC2
The three year average free cash flow (operating cash flows (data308) - preferred dividends (data19) - common dividends)/total assets (data6).
The rules-based continuum score for the standard (j ) violated by the firm. The rules-based continuum score is calculated as of the first year of the manipulation period. Please refer to section 3 for further details on how RBC1 and RBC2 are calculated.
A dummy variable that is equal to one if the firm's restatement led to an enforcement action and is equal to zero otherwise.
The dollar amount executives overstated (understated) net income during the manipulation period divided by restated total assets (data6), measured as of the first year of the manipulation period (i.e. the first year the executive managed earnings). The earnings management amount is specific to the standard (j ) violated and does not equal the cumulative restatement amount when multiple GAAP violations occur.
The natural log of the market value of equity (data24*data25).
Logistic Regression Results for the Effect of the Rules-Based Characteristics on the Likelihood of an SEC Enforcement Action
Model: EAij =β0 + β1RBCj + β2LNMKTVALi + β3FCFi + β4DLSTi + β5IS_AMTij /TAi + β6(IS_AMTij /TAi )2 + ui (1)
Wald Chi-Squared statistics are in parentheses. SIC and year dummies are not shown to conserve space. All variables that lie below (above) the 1st (99th) percentiles are winzorized.
*(**)[***] significant at the 0.10 (0.05) [0.01] level (two-tailed). All firm level variables and the rules-based continuum score (RBCj ) are measured as of the first year of the manipulation period.
43
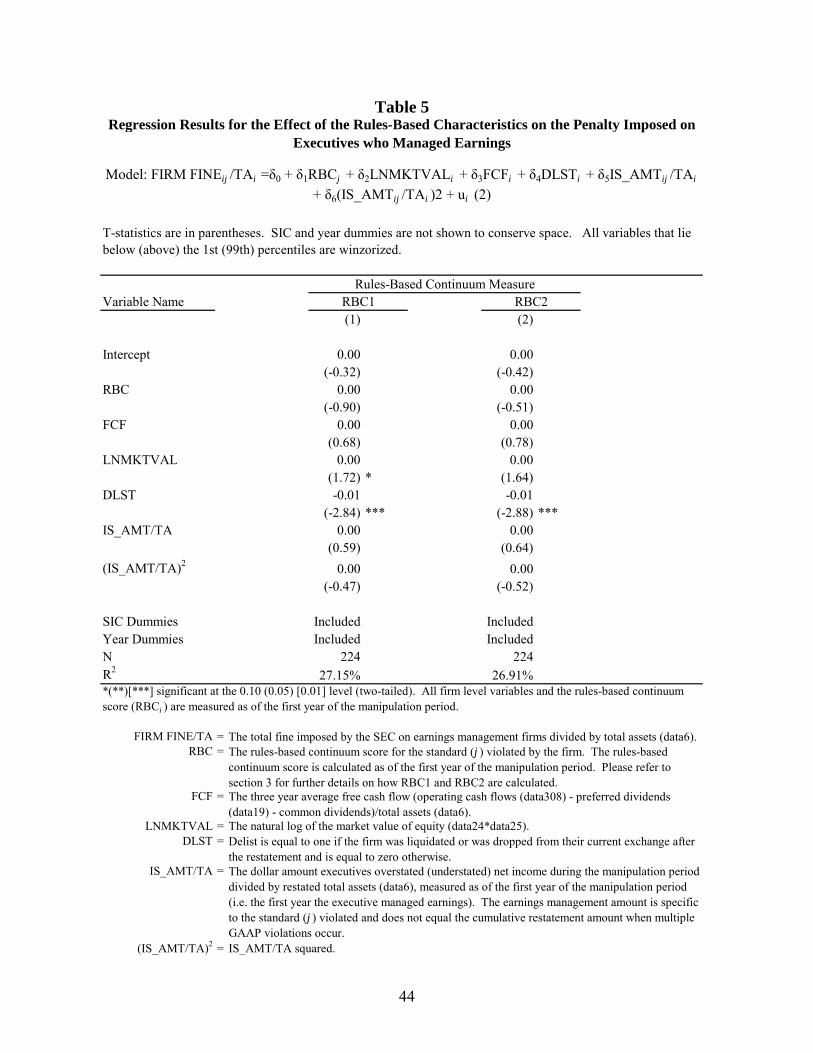
Variable Name(1) (2)
Intercept 0.00 0.00(-0.32) (-0.42)
RBC 0.00 0.00(-0.90) (-0.51)
FCF 0.00 0.00(0.68) (0.78)
LNMKTVAL 0.00 0.00(1.72) * (1.64)
DLST -0.01 -0.01(-2.84) *** (-2.88) ***
IS_AMT/TA 0.00 0.00(0.59) (0.64)
(IS_AMT/TA)2 0.00 0.00(-0.47) (-0.52)
SIC Dummies Included IncludedYear Dummies Included IncludedN 224 224R2 27.15% 26.91%
FIRM FINE/TA =RBC =
FCF =
LNMKTVAL = The natural log of the market value of equity (data24*data25).DLST =
IS_AMT/TA =
(IS_AMT/TA)2 = IS_AMT/TA squared.
Rules-Based Continuum MeasureRBC1 RBC2
The rules-based continuum score for the standard (j ) violated by the firm. The rules-based continuum score is calculated as of the first year of the manipulation period. Please refer to section 3 for further details on how RBC1 and RBC2 are calculated.
*(**)[***] significant at the 0.10 (0.05) [0.01] level (two-tailed). All firm level variables and the rules-based continuum score (RBCj ) are measured as of the first year of the manipulation period.
The three year average free cash flow (operating cash flows (data308) - preferred dividends (data19) - common dividends)/total assets (data6).
Delist is equal to one if the firm was liquidated or was dropped from their current exchange after the restatement and is equal to zero otherwise.
The total fine imposed by the SEC on earnings management firms divided by total assets (data6).
The dollar amount executives overstated (understated) net income during the manipulation period divided by restated total assets (data6), measured as of the first year of the manipulation period (i.e. the first year the executive managed earnings). The earnings management amount is specific to the standard (j ) violated and does not equal the cumulative restatement amount when multiple GAAP violations occur.
Regression Results for the Effect of the Rules-Based Characteristics on the Penalty Imposed on Executives who Managed Earnings
Model: FIRM FINEij /TAi =δ0 + δ1RBCj + δ2LNMKTVALi + δ3FCFi + δ4DLSTi + δ5IS_AMTij /TAi
+ δ6(IS_AMTij /TAi )2 + ui (2)
T-statistics are in parentheses. SIC and year dummies are not shown to conserve space. All variables that lie below (above) the 1st (99th) percentiles are winzorized.
Table 5
44
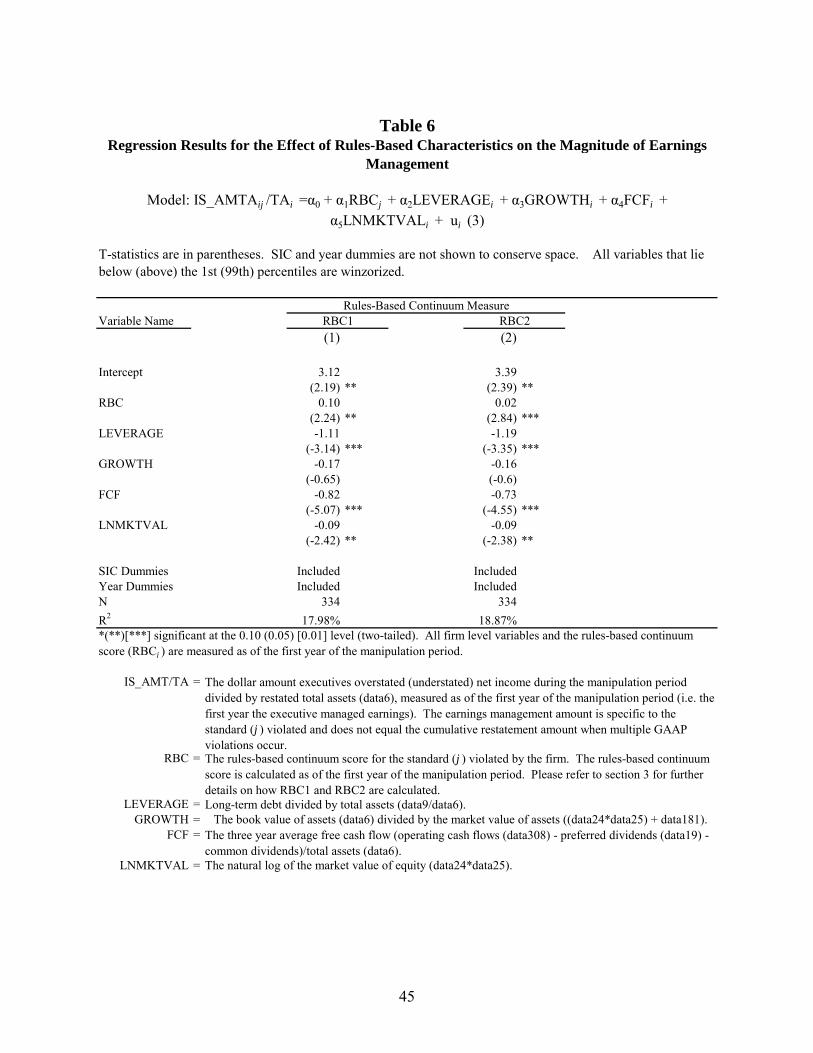
Variable Name(1) (2)
Intercept 3.12 3.39(2.19) ** (2.39) **
RBC 0.10 0.02(2.24) ** (2.84) ***
LEVERAGE -1.11 -1.19(-3.14) *** (-3.35) ***
GROWTH -0.17 -0.16(-0.65) (-0.6)
FCF -0.82 -0.73(-5.07) *** (-4.55) ***
LNMKTVAL -0.09 -0.09(-2.42) ** (-2.38) **
SIC Dummies Included IncludedYear Dummies Included IncludedN 334 334R2 17.98% 18.87%
IS_AMT/TA =
RBC =
LEVERAGE =GROWTH =
FCF =
LNMKTVAL = The natural log of the market value of equity (data24*data25).
The three year average free cash flow (operating cash flows (data308) - preferred dividends (data19) - common dividends)/total assets (data6).
Table 6Regression Results for the Effect of Rules-Based Characteristics on the Magnitude of Earnings
Management
Model: IS_AMTAij /TAi =α0 + α1RBCj + α2LEVERAGEi + α3GROWTHi + α4FCFi + α5LNMKTVALi + ui (3)
T-statistics are in parentheses. SIC and year dummies are not shown to conserve space. All variables that lie below (above) the 1st (99th) percentiles are winzorized.
Rules-Based Continuum MeasureRBC1 RBC2
*(**)[***] significant at the 0.10 (0.05) [0.01] level (two-tailed). All firm level variables and the rules-based continuum score (RBCj ) are measured as of the first year of the manipulation period.
The dollar amount executives overstated (understated) net income during the manipulation period divided by restated total assets (data6), measured as of the first year of the manipulation period (i.e. the first year the executive managed earnings). The earnings management amount is specific to the standard (j ) violated and does not equal the cumulative restatement amount when multiple GAAP violations occur.The rules-based continuum score for the standard (j ) violated by the firm. The rules-based continuum score is calculated as of the first year of the manipulation period. Please refer to section 3 for further details on how RBC1 and RBC2 are calculated.Long-term debt divided by total assets (data9/data6).
The book value of assets (data6) divided by the market value of assets ((data24*data25) + data181).
45
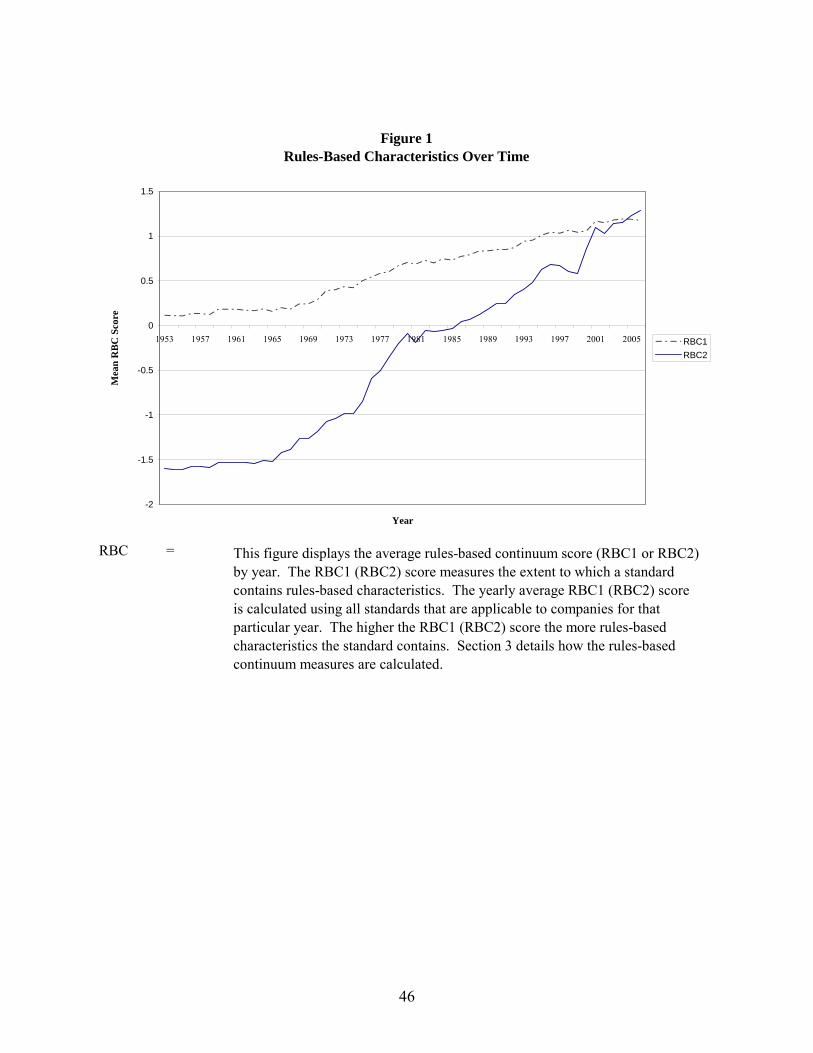
Figure 1 Rules-Based Characteristics Over Time
-2
-1.5
-1
-0.5
0
0.5
1
1.5
1953 1957 1961 1965 1969 1973 1977 1981 1985 1989 1993 1997 2001 2005
Year
Mea
n R
BC
Sco
re
RBC1RBC2
RBC = This figure displays the average rules-based continuum score (RBC1 or RBC2)
by year. The RBC1 (RBC2) score measures the extent to which a standard contains rules-based characteristics. The yearly average RBC1 (RBC2) score is calculated using all standards that are applicable to companies for that particular year. The higher the RBC1 (RBC2) score the more rules-based characteristics the standard contains. Section 3 details how the rules-based continuum measures are calculated.
46