primary genotoxicity in the liver following pulmonary
TRANSCRIPT
RESEARCH Open Access
Primary genotoxicity in the liver followingpulmonary exposure to carbon blacknanoparticles in miceJustyna Modrzynska1,2, Trine Berthing2, Gitte Ravn-Haren1, Nicklas Raun Jacobsen2, Ingrid Konow Weydahl2,Katrin Loeschner1, Alicja Mortensen2, Anne Thoustrup Saber2 and Ulla Vogel2,3*
Abstract
Background: Little is known about the mechanism underlying the genotoxicity observed in the liver followingpulmonary exposure to carbon black (CB) nanoparticles (NPs). The genotoxicity could be caused by the presence oftranslocated particles or by circulating inflammatory mediators released during pulmonary inflammation andacute-phase response. To address this, we evaluated induction of pulmonary inflammation, pulmonary andhepatic acute-phase response and genotoxicity following exposure to titanium dioxide (TiO2), cerium oxide(CeO2) or CB NPs. Female C57BL/6 mice were exposed by intratracheal instillation, intravenous injection ororal gavage to a single dose of 162 μg NPs/mouse and terminated 1, 28 or 180 days post-exposure alongsidevehicle control.
Results: Liver DNA damage assessed by the Comet Assay was observed after intravenous injection andintratracheal instillation of CB NPs but not after exposure to TiO2 or CeO2. Intratracheal exposure to NPsresulted in pulmonary inflammation in terms of increased neutrophils influx for all NPs 1 and 28 days post-exposure.Persistent pulmonary acute phase response was detected for all NPs at all three time points while only a transientinduction of hepatic acute phase response was observed. All 3 materials were detected in the liver by enhanceddarkfield microscopy up to 180 days post-exposure. In contrast to TiO2 and CeO2 NPs, CB NPs generated ROS in anacellular assay.
Conclusions: Our results suggest that the observed hepatic DNA damage following intravenous and intratrachealdosing with CB NPs was caused by the presence of translocated, ROS-generating, particles detected in the liverrather than by the secondary effects of pulmonary inflammation or hepatic acute phase response.
Keywords: Carbon black, Cerium oxide, Titanium dioxide, Nanoparticles, Liver, Intratracheal instillation, Intravenousinjection, Oral gavage, Genotoxicity, DNA strand breaks
BackgroundThe wide range of nanoparticles (NPs) applications leadsto increased risk of unintended human exposure forconsumers as well as for workers in the occupational en-vironment. Inhaled NPs constitute a potential health risk[1] and therefore, understanding the fate and toxicity
following pulmonary exposure to NPs has become animportant issue.Inhalation of particles leads to size dependent pulmonary
deposition [2, 3]. A large fraction of the pulmonary depos-ited particles is removed from the upper airways by themucociliary escalator and subsequently swallowed resultingin secondary exposure through the oral route [4–7]. Inaddition, a small fraction of the pulmonary deposited parti-cles undergo translocation and primarily accumulate in theliver but also in other secondary organs [7–12].Inhalation and intratracheal instillation of NPs induce
pulmonary inflammation which is accompanied by a
* Correspondence: [email protected]; [email protected] National Research Centre for the Working Environment, Lersø Parkallé105, DK-2100 Copenhagen Ø, Denmark3Department of Micro- and Nanotechnology, Technical University ofDenmark, Kongens Lyngby, DenmarkFull list of author information is available at the end of the article
© The Author(s). 2018 Open Access This article is distributed under the terms of the Creative Commons Attribution 4.0International License (http://creativecommons.org/licenses/by/4.0/), which permits unrestricted use, distribution, andreproduction in any medium, provided you give appropriate credit to the original author(s) and the source, provide a link tothe Creative Commons license, and indicate if changes were made. The Creative Commons Public Domain Dedication waiver(http://creativecommons.org/publicdomain/zero/1.0/) applies to the data made available in this article, unless otherwise stated.
Modrzynska et al. Particle and Fibre Toxicology (2018) 15:2 DOI 10.1186/s12989-017-0238-9
pulmonary acute phase response [13–15]. We have pre-viously shown that instillation and inhalation of CBPrintex 90 NPs induced hepatic genotoxicity in terms ofincreased DNA strand break levels and increased levelsof oxidative DNA damage [14, 16–18]. However, theunderlying mechanism is not clear. Exposure to particlescan cause primary or secondary genotoxicity. Primarygenotoxicity refers to DNA damage caused by directphysical interaction between particles and the genomicDNA and by ROS-mediated DNA damage in the ab-sence of inflammation. Secondary genotoxicity refers toDNA damage as a result of action of reactive oxygenspecies (ROS) and reactive nitrogen species (RNS) aswell as other secondary mediators (cytokines, chemo-kines) that are generated during particle-induced inflam-mation and acute phase response in the lungs that couldinitiate DNA damaging processes in the liver includinginduction of a hepatic acute phase response [19, 20].The NPs used in this work, i.e. titanium dioxide
(TiO2), cerium oxide (CeO2) and carbon black (CB) areall worldwide-used high-volume nanomaterials. More-over, CB is a well-known ROS generator [21] and hasbeen shown to be mutagenic [22]. TiO2-induced oxida-tive stress [23] and genotoxicity [24, 25] were also previ-ously reported. In addition, CeO2-mediated DNAdamages were confirmed in both in vivo [26] and invitro [27] studies. CB NPs were included in the study asthe DNA damaging test material in liver whereas TiO2
and CeO2 NPs were included as inflammogenic NPswith relatively low ROS generating abilities.The objective of the present study was to assess the
etiology of particle-induced genotoxicity in the liver. Wetherefore dosed mice with 3 different nanomaterials:TiO2, CeO2 and CB by pulmonary, oral and intravenousdosing to determine whether the observed hepatic DNAstrand breaks are caused by secondary genotoxicity frompulmonary or hepatic inflammatory and acute phase re-sponses or by direct genotoxicity from translocated NPs.Oral exposure was included to assess the contributionfrom the secondary oral exposure that accompanies par-ticle clearance by the mucociliary escalator. Intravenous(IV) exposure was included to assess the effect of par-ticle translocation and hepatic accumulation.
MethodsAnimal studyThree hundred twenty four young adult C57BL/6(B6JBOM-F) female mice were purchased from Taconic(Ry, Denmark) at 6 weeks of age and body weight of17.5 ± 0.9 g (mean ± SD) and allowed to acclimate for2 weeks before exposure. All animals were provided withthe standard pellet diet (Altromin No. 1324) and acid-ified water ad libitum and housed in polypropylene cageswith bedding and enrichment at controlled temperature
22 ± 1 °C and humidity of 55% ± 5 and with the reverse12 h light/12 h dark cycle. The study was conducted inthe agreement with the Danish Animal Experimental In-spectorate under the Ministry of Justice (Permission2012–15–2934-00089 C6) and the Technical Universityof Denmark’s animal welfare protocol.
Preparation of exposure stockTiO2 was provided by NanoAmor, CeO2 was provided byDegussa-Quimidroga and CB (Printex 90) was providedby Evonik Degussa. Physicochemical characteristics of par-ticles are presented in Table 1. All three materials weresuspended in 2% v/v mouse serum from C57BL/6 mice innanopure water to a final concentration of 3.24 mg/mland dispersed by sonication for 15 min using Microsonultrasonic cell disruptor (XL-2000, Microson™, Qsonica,LLC.) equipped with disruptor horn with a diameter of3.2 mm and maximum peak-to-peak amplitude of180 μm. Suspensions were cooled on ice during the sonic-ation procedure to prevent sample overheating. Controlvehicle, 2% serum in nanopure water, was also sonicatedprior to exposure as described above.Dynamic light scattering (Malvern Zetasizer Nano ZS,
Malvern Instruments, UK) was used to determine thehydrodynamic size distribution in the sonicated suspen-sions before administration. The suspensions were pre-pared as described above and measured in transparent1 ml disposable cuvettes at the temperature of 25 °C. Sixconsecutively repeated measurements were performed.Duration of each measurement as well as attenuatorindex and measurement position within the cuvette weredetermined automatically by the instrument. For the cal-culation of the number-based particle size distribution,refractive index and extinction coefficient (absorption)for the tested materials were as followed: 2.9 and 0.1, re-spectively, for TiO2, 2.2 and 0.1, respectively, for CeO2,2.02 and 2.0, respectively, for CB NPs.
Exposure of miceThe mice (n = 9 per group) were given a single dose of162 μg of TiO2, CeO2, or CB NPs suspension in a vol-ume of 50 μl by intratracheal instillation, intravenous in-jection and oral gavage. Control mice received 50 μl of2% serum (in nanopure water) that served as a vehiclefor the preparation of NPs suspension. The dose used inthe experiment was equal to the pulmonary depositionafter nine 8 h working days at the Danish occupationalexposure limit of 3.5 mg/m3 for CB [14]. Occupationalexposure concentrations of up to 15 mg/m3 CB havebeen reported and the current dose would correspond tothe pulmonary deposition during 2.2 work-days [28].Mice subjected to intratracheal instillation and intraven-ous injection were anaesthetized with 0.5 ml/100 g bodyweight of Hypnorm® (Fentanyl citrate 0.315 mg/ml and
Modrzynska et al. Particle and Fibre Toxicology (2018) 15:2 Page 2 of 12
Fluanisone 10 mg/ml, Nomeco) and Dormicum® (Mid-azolam 5 mg/ml, Roche) by subcutaneous injection inthe neck prior the NP administration. Orally gavagedmice were not anaesthetized before the administration.Pulmonary exposed mice were dosed by intratracheal in-stillation as described previously [29]. In short, the se-dated mice devoted for intratracheal instillation wereplaced on a 40° slope (upside down, with the head to-wards the floor) and a diode lamp was placed on the lar-ynx to assure better visualization of the airways. Thetongue was pressed down towards the lower jaw using asmall spatula. 22 GA BD Insyte catheter (Becton Dickin-son, Utah, USA) with a shortened needle used to intubatethe trachea. The proper position of each catheter was con-firmed by a highly sensitive pressure transducer. In a250 μl SGE glass syringe (250F–LT-GT, MicroLab, Aarhus,Denmark) a volume of 50 μl of NP suspension followed by200 μl air was instilled. Control groups received 50 μl of acontrol vehicle prepared as described above. After the re-moval of the catheter mice were placed back into verticalposition with the head up to assure that the NP suspensionremains in the lung and that the airways are unobstructed.We have previously shown the overall and even pulmonarydistribution of particles using this exposure technique [30,31]. Mice devoted for intravenous injection were restrainedin plexiglas restraining tubes with the tail hanging out ofthe tube. Injection was performed using 0.4 x 20 mm nee-dle (Terumo Europe, n.v. 3001, Leuven, Belgium). Afterthe exposure, sedated mice were placed back to their cages,heated with a heating lamp and/or warming blanket andmonitored until they fully recovered from anesthesia. Micedevoted for oral gavage were immobilized in a vertical pos-ition and the gavage needle was inserted into the esopha-gus and further toward the stomach to release thesuspension of particles. After the exposure, mice returnedto the cages and were closely monitored.
Necropsy and cells & tissues collectionOne, 28 and 180 days following administration of NPsmice were sedated by Hypnorm/Dormicum mixture (0.5–0.7 ml/100 g body weight) followed by the exsanguinationby withdrawing the heart blood. Abdomen and thorax ofmice were opened and macroscopic examination of all or-gans was performed. All observed abnormalities were
noted. After withdrawal of the heart blood in the intratra-cheally instilled mice bronchoalveolar lavage (BAL) wasperformed (N = 6 mice/group). Lungs were flushed twicethrough the trachea with 0.8 ml of 0.9% sterile saline(NaCl) as described [32]. Each flush consisted of 3 up anddown movements and was performed slowly (5–10 seach). The BAL was stored on ice until the centrifugationat 400 g for 10 min at 4 °C (Ole Dich centrifuge) was per-formed. The supernatant, BAL fluid (BALF), was collectedin 1.5 ml tubes, snap-frozen in liquid nitrogen and storedat −80 °C until used. The BAL cells were re-suspended in100 μl HAMS-F12 medium (HAMS-F12, GIBCO #21765,with 1% penicillin/streptomycin and 10% fetal bovineserum). BAL cells devoted for comet assay were preparedby the following procedure as described [32]: 40 μl of thecell suspension was mixed with 60 μl of cell culture freez-ing medium (HAMS-F12 with 1% penicillin/streptomycin,10% fetal bovine serum and 10% of DMSO), divided intotwo 50 μl aliquots and stored at −80 °C until used. Thetotal number of cells presented in the BAL fluid was de-termined using the Nucleo-Counter NC-100 with Nucleo-Cassette™ (Chemometec, Allerød, Denmark). 20 μl of thecell suspension was mixed with 180 μl HAMS F12medium, suspension was divided into 2 aliquots and live/dead cells were counted according to the manufacturer’sinstructions. For the estimation of cellular composition inBAL fluid rest of the cell suspension (approximately 40 μl)was deposited on the microscope slide by centrifugationat room temperature for 10 min. at 550 g in a Cytofuge® 2(StatSpin, TRIOLAB, Brønby, Denmark). The slides werefixed in 96% ethanol for 5 min and stained with May-Grünwald-Giemsa dye using standard staining protocol.The cellular composition was quantified on 200 cellsunder light microscope (100 x magnifications). The liver(N = 9/group) and lungs (from BAL flushed mice, N = 6/group) were divided into specific pieces, snap frozen in li-quid nitrogen in cryotubes (NUNC) and stored at −80 °Cfor later use. For all mice throughout the whole experi-ment samples were taken from the same parts of organs.Specimens from livers (N = 9/group) and lungs (from micethat had not been used for BALF collection, N = 3/group)were fixed in 4% neutral buffered formaldehyde, paraffin-embedded and 4 μm thick sections were stained withhematoxylin and eosin for microscopical examination.
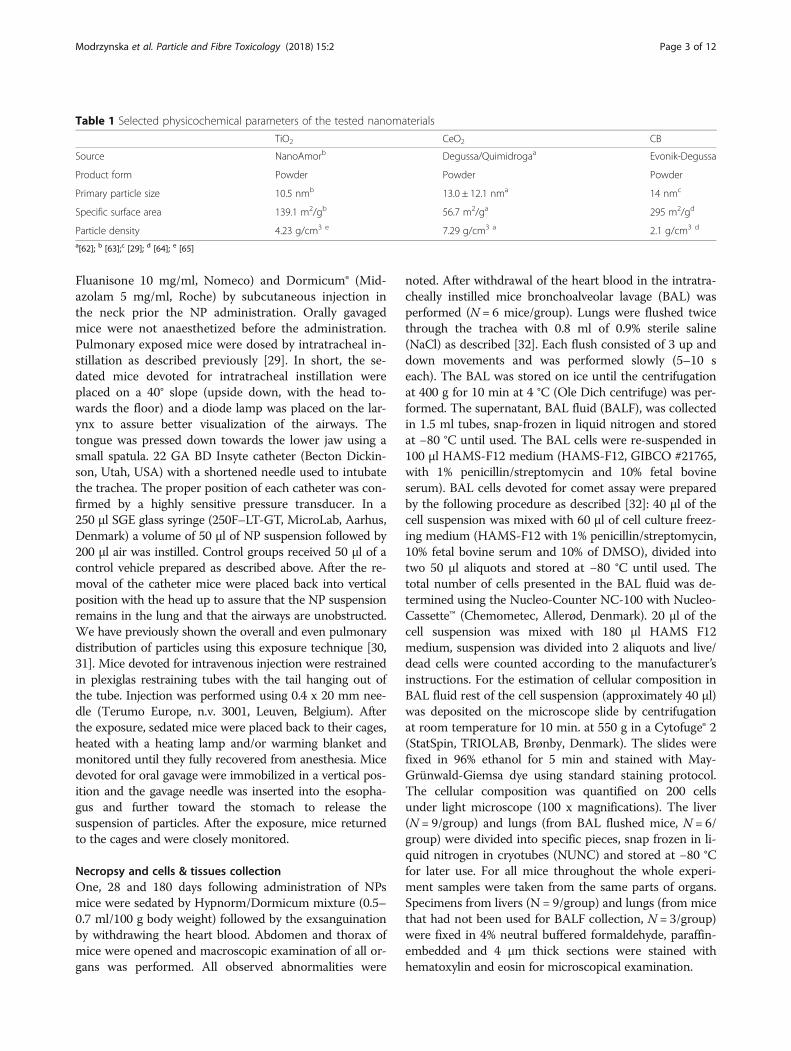
Table 1 Selected physicochemical parameters of the tested nanomaterials
TiO2 CeO2 CB
Source NanoAmorb Degussa/Quimidrogaa Evonik-Degussa
Product form Powder Powder Powder
Primary particle size 10.5 nmb 13.0 ± 12.1 nma 14 nmc
Specific surface area 139.1 m2/gb 56.7 m2/ga 295 m2/gd
Particle density 4.23 g/cm3 e 7.29 g/cm3 a 2.1 g/cm3 d
a[62]; b [63];c [29]; d [64]; e [65]
Modrzynska et al. Particle and Fibre Toxicology (2018) 15:2 Page 3 of 12
Brightfield and darkfield microscopyCytoviva enhanced darkfield hyperspectral system (Auburn,AL, USA) was used to detect particles in the liver tissue, byscanning histological sections at 40 x in enhanced darkfieldmode. Darkfield images were acquired at 40 x and bright-field images were acquired at 40× and 100 x on an Olym-pus BX 43 microscope with a Qimaging Retiga4000Rcamera. Uneven illumination in brightfield images was cor-rected using ImageJ [33] and the Calculator Plus plugin viathe formula: Corrected_image = (image / background) *255. The background image was a maximum projection of3 background brightfield images without tissue.
Preparation of mRNA and cDNA from the liver and lungtissueTotal RNA was isolated from the frozen liver andlung tissue (16–20 mg) on Maxwell ® 16 (Promega,USA) using Maxwell® 16 LEV simply RNA Tissue Kit(AS1280, Promega, USA) following the manufacturer’sprotocol. Tissue lysis was performed by vigorouslyshaking the samples using a Tissuelyser (Qiagen,Denmark) with a 5 mm stainless steel beads for 60 s.DEPC-treated nuclease-free water was used to elutethe mRNA. Complementary DNA (cDNA) was pre-pared using TaqMan® reverse transcription reagents(Applied Biosystem, USA) as stated in manufacturer’sprotocol. Concentration of total mRNA was deter-mined by NanoDrop 2000c (ThermoFisher, USA).
Real-time RT-PCRGene expression levels of Saa1 in the liver tissue andSaa3 in the lung tissue were assessed using quantitativePCR as described previously [25, 34]. 18S RNA served asa reference gene. Each of the analyzed samples was runin triplicates using ViiA7 Real-Time PCR detector (Ap-plied Biosystem, USA). TaqMan® predeveloped reagentswere used throughout the analysis. Target and referencegene expression was quantified in triplicates in separatewells. Target gene expression was determined by thecomparative method 2- ΔCt.
Comet assayDNA strand break levels were quantified by the cometassay in the liver and lung tissue and BAL cells as de-scribed in [35]. In brief, single-cell suspension of the liverand lung tissue was obtained by the homogenization ofthe deep frozen liver and lung piece in an ice-cold Mer-chant’s buffer through a stainless steel mesh (diameter0.5 cm, mesh size 0.4 mm) mounted on a syringe, to yieldindividual cells. The BAL fluid cells were thawed in a 37 °C water bath before diluting with the Mechant’s bufferwithout the filtration step. The cell suspension was em-bedded in a low melting point agarose (0.7%) and depos-ited on microscope Travigen 20-Well CometSlides™. The
slides were immersed in a lysing solution and stored over-night at 4 °C. Subsequently, samples were treated with analkaline buffer and alkaline electrophoresis with circulat-ing ice-cold electrophoresis buffer was performed(25 min, 38 V/cm, 0.700 A). Thereafter, slides were neu-tralized in neutralization buffer (0.4 M Tris, pH 7.5), fixedwith 96% ethanol and stained with a fluorescent DNAintercalating dye SYBRGreen®. DNA strand breaks deter-mined as the % of DNA in the comet tail (%TDNA) andas the comet tail length (TL) were scored by the fully au-tomated PatchFinder™ system (IMSTAR, France). In orderto control the day-to-day variation and to ensure equalelectrophoresis efficiency both negative (A549 humanlung epithelial cell line treated with PBS for 30 min at 4 °C) and positive (A549 human lung epithelial cell linetreated with 60 μM H2O2 for 30 min at 4 °C,) controlswere included. The high throughput comet assay analysisallowed analysis of all related sample on the same day de-creasing potential variation due to the different electro-phoresis or the duration of the incubation procedure.
Determination of ROS-generating ability of NPsAssessment of NPs ability to generate ROS was per-formed in vitro in a cell-free environment as describedpreviously [21, 36]. Briefly, 500 μl of 1 mM 2′,7′-dichlorodihydrofluorescein diacetate (DCFH2-DA) (Invi-trogen) was chemically hydrolyzed with 2 ml of 0.01 MNaOH for 30 min to 2′,7′-dichlorodihydrofluorescein(DCFH2). DCFH2-DA probe is light sensitive thereforethe experiment was conducted in a dark environment.The formed DCFH2 was further diluted with 10 ml of25 mM phosphate buffer (pH 7.4) to 0.04 mM. The NPs’ability to generate ROS production was determined inHank’s balanced saline solution (HBSS, without phenol)using a final DCFH2 concentration of 0.01 mM. Prior tothe assay, NPs were sonicated (Branson S-450D) for16 min without a pause and further diluted in HBSS.Generated ROS caused formation of 2′,7′-dichloro-fluorescein (DCF) from DCFH2 that was spectrofluor-imetrically measured following 3 h of incubation inthe dark (37 °C and 5% CO2). Excitation and emissionwavelengths were λex = 490 nm and λem = 520 nm,respectively (Victor Wallac-2 1420; PerkinElmer,Skovlunde, Denmark).
Statistical analysisAll presented values are expressed as mean ± standarddeviation (SD) unless differently stated. One-way or two-way analysis of variance (ANOVA) was used to analyzethe data sets. In order to fulfil the normality and vari-ance homogeneity criteria some variables were logarith-mically transformed. Non-normally distributed datawere ranked before applying nonparametric one-way ortwo-way ANOVA analysis. If the statistical significance
Modrzynska et al. Particle and Fibre Toxicology (2018) 15:2 Page 4 of 12
was reached in the ANOVA analysis, Tukey post-hocmultiple comparison test was used to test the differencesbetween the test groups. P-value ≤0.05 was consideredsignificant. All statistical analyses were calculated usingSAS 9.4 statistical software (SAS Institute Inc., Cary,NC, USA).
ResultsDLSDynamic light scattering (DLS) was used to determineparticle agglomerate size of TiO2, CeO2 and CB NPssuspensions. The both the hydrodynamic number-basedsize distribution revealed a narrow, unimodal peak withthe average diameter below 100 nm for all particle sus-pensions (Fig. 1). The intensity size distributions alsoshowed unimodal peaks (Fig. 1). The median particlediameter measured for TiO2, CeO2 and CB NPs was68 nm, 68 nm, and 51 nm, respectively. Z-average andpolydispersity index were 131.4 and 0.120, respectively,for TiO2, 148.8 and 0.174, respectively, for CeO2, 104.3and 0.157, respectively, for CB NPs.
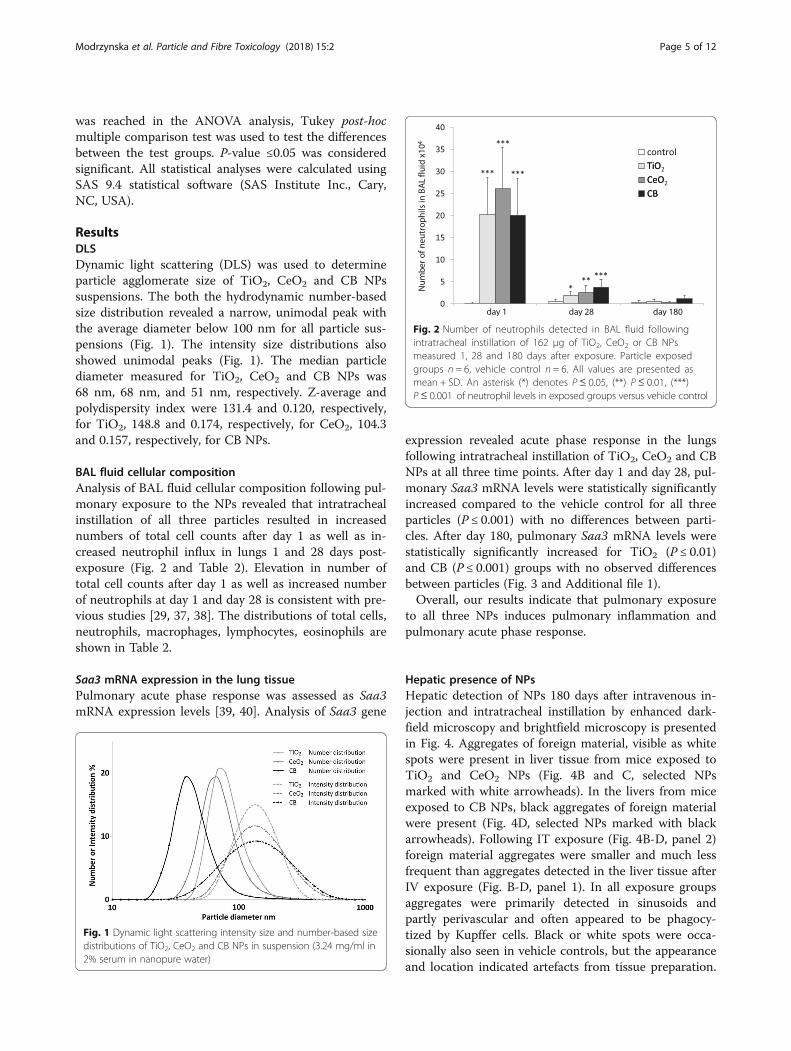
BAL fluid cellular compositionAnalysis of BAL fluid cellular composition following pul-monary exposure to the NPs revealed that intratrachealinstillation of all three particles resulted in increasednumbers of total cell counts after day 1 as well as in-creased neutrophil influx in lungs 1 and 28 days post-exposure (Fig. 2 and Table 2). Elevation in number oftotal cell counts after day 1 as well as increased numberof neutrophils at day 1 and day 28 is consistent with pre-vious studies [29, 37, 38]. The distributions of total cells,neutrophils, macrophages, lymphocytes, eosinophils areshown in Table 2.
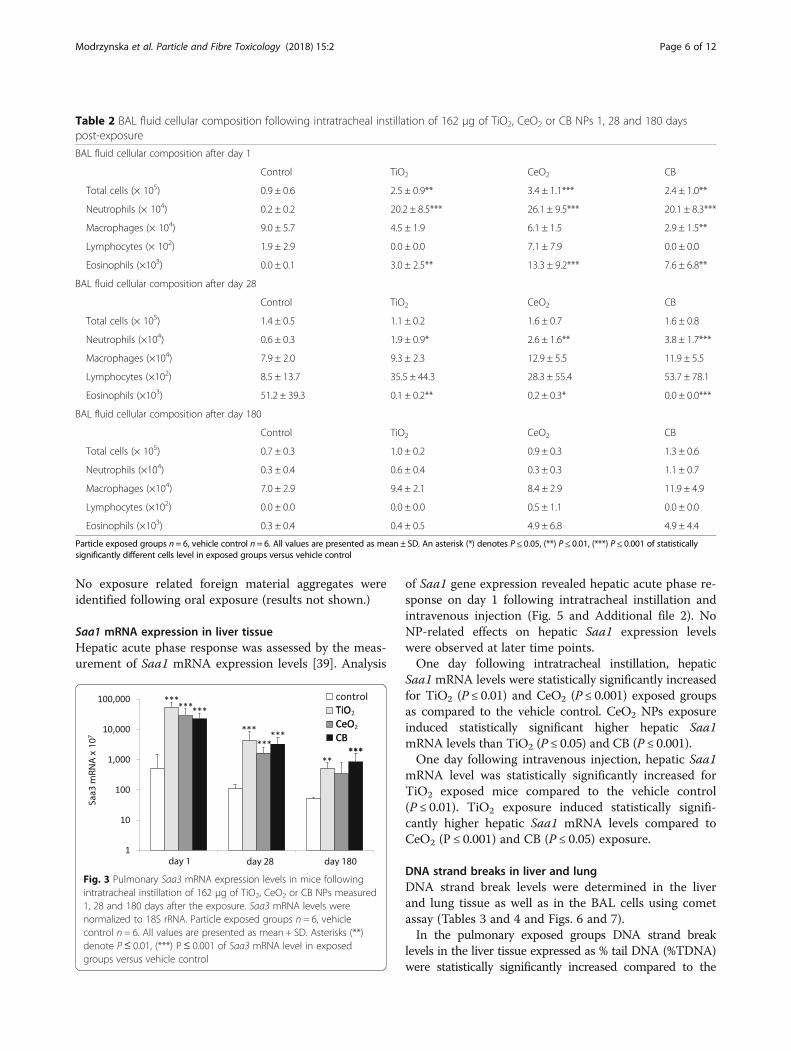
Saa3 mRNA expression in the lung tissuePulmonary acute phase response was assessed as Saa3mRNA expression levels [39, 40]. Analysis of Saa3 gene
expression revealed acute phase response in the lungsfollowing intratracheal instillation of TiO2, CeO2 and CBNPs at all three time points. After day 1 and day 28, pul-monary Saa3 mRNA levels were statistically significantlyincreased compared to the vehicle control for all threeparticles (P ≤ 0.001) with no differences between parti-cles. After day 180, pulmonary Saa3 mRNA levels werestatistically significantly increased for TiO2 (P ≤ 0.01)and CB (P ≤ 0.001) groups with no observed differencesbetween particles (Fig. 3 and Additional file 1).Overall, our results indicate that pulmonary exposure
to all three NPs induces pulmonary inflammation andpulmonary acute phase response.
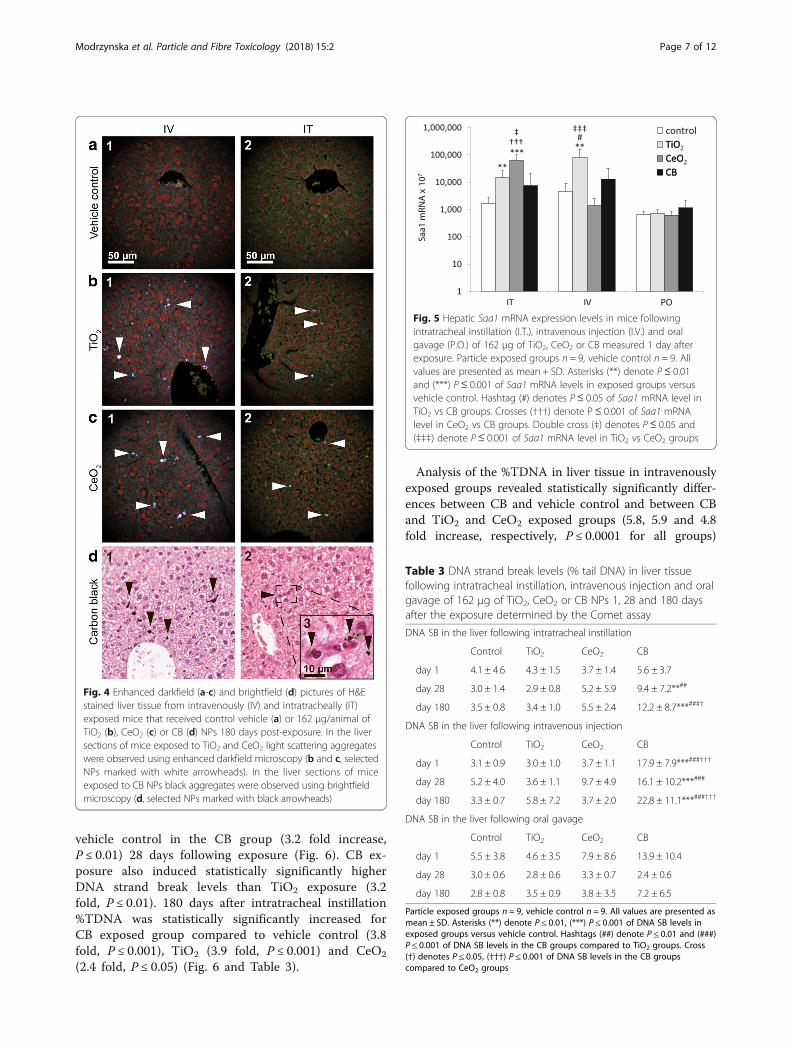
Hepatic presence of NPsHepatic detection of NPs 180 days after intravenous in-jection and intratracheal instillation by enhanced dark-field microscopy and brightfield microscopy is presentedin Fig. 4. Aggregates of foreign material, visible as whitespots were present in liver tissue from mice exposed toTiO2 and CeO2 NPs (Fig. 4B and C, selected NPsmarked with white arrowheads). In the livers from miceexposed to CB NPs, black aggregates of foreign materialwere present (Fig. 4D, selected NPs marked with blackarrowheads). Following IT exposure (Fig. 4B-D, panel 2)foreign material aggregates were smaller and much lessfrequent than aggregates detected in the liver tissue afterIV exposure (Fig. B-D, panel 1). In all exposure groupsaggregates were primarily detected in sinusoids andpartly perivascular and often appeared to be phagocy-tized by Kupffer cells. Black or white spots were occa-sionally also seen in vehicle controls, but the appearanceand location indicated artefacts from tissue preparation.
Fig. 1 Dynamic light scattering intensity size and number-based sizedistributions of TiO2, CeO2 and CB NPs in suspension (3.24 mg/ml in2% serum in nanopure water)
Fig. 2 Number of neutrophils detected in BAL fluid followingintratracheal instillation of 162 μg of TiO2, CeO2 or CB NPsmeasured 1, 28 and 180 days after exposure. Particle exposedgroups n = 6, vehicle control n = 6. All values are presented asmean + SD. An asterisk (*) denotes P ≤ 0.05, (**) P ≤ 0.01, (***)P ≤ 0.001 of neutrophil levels in exposed groups versus vehicle control
Modrzynska et al. Particle and Fibre Toxicology (2018) 15:2 Page 5 of 12
No exposure related foreign material aggregates wereidentified following oral exposure (results not shown.)
Saa1 mRNA expression in liver tissueHepatic acute phase response was assessed by the meas-urement of Saa1 mRNA expression levels [39]. Analysis
of Saa1 gene expression revealed hepatic acute phase re-sponse on day 1 following intratracheal instillation andintravenous injection (Fig. 5 and Additional file 2). NoNP-related effects on hepatic Saa1 expression levelswere observed at later time points.One day following intratracheal instillation, hepatic
Saa1 mRNA levels were statistically significantly increasedfor TiO2 (P ≤ 0.01) and CeO2 (P ≤ 0.001) exposed groupsas compared to the vehicle control. CeO2 NPs exposureinduced statistically significant higher hepatic Saa1mRNA levels than TiO2 (P ≤ 0.05) and CB (P ≤ 0.001).One day following intravenous injection, hepatic Saa1
mRNA level was statistically significantly increased forTiO2 exposed mice compared to the vehicle control(P ≤ 0.01). TiO2 exposure induced statistically signifi-cantly higher hepatic Saa1 mRNA levels compared toCeO2 (P ≤ 0.001) and CB (P ≤ 0.05) exposure.
DNA strand breaks in liver and lungDNA strand break levels were determined in the liverand lung tissue as well as in the BAL cells using cometassay (Tables 3 and 4 and Figs. 6 and 7).In the pulmonary exposed groups DNA strand break
levels in the liver tissue expressed as % tail DNA (%TDNA)were statistically significantly increased compared to the
Table 2 BAL fluid cellular composition following intratracheal instillation of 162 μg of TiO2, CeO2 or CB NPs 1, 28 and 180 dayspost-exposure
BAL fluid cellular composition after day 1
Control TiO2 CeO2 CB
Total cells (× 105) 0.9 ± 0.6 2.5 ± 0.9** 3.4 ± 1.1*** 2.4 ± 1.0**
Neutrophils (× 104) 0.2 ± 0.2 20.2 ± 8.5*** 26.1 ± 9.5*** 20.1 ± 8.3***
Macrophages (× 104) 9.0 ± 5.7 4.5 ± 1.9 6.1 ± 1.5 2.9 ± 1.5**
Lymphocytes (× 102) 1.9 ± 2.9 0.0 ± 0.0 7.1 ± 7.9 0.0 ± 0.0
Eosinophils (×103) 0.0 ± 0.1 3.0 ± 2.5** 13.3 ± 9.2*** 7.6 ± 6.8**
BAL fluid cellular composition after day 28
Control TiO2 CeO2 CB
Total cells (× 105) 1.4 ± 0.5 1.1 ± 0.2 1.6 ± 0.7 1.6 ± 0.8
Neutrophils (×104) 0.6 ± 0.3 1.9 ± 0.9* 2.6 ± 1.6** 3.8 ± 1.7***
Macrophages (×104) 7.9 ± 2.0 9.3 ± 2.3 12.9 ± 5.5 11.9 ± 5.5
Lymphocytes (×102) 8.5 ± 13.7 35.5 ± 44.3 28.3 ± 55.4 53.7 ± 78.1
Eosinophils (×103) 51.2 ± 39.3 0.1 ± 0.2** 0.2 ± 0.3* 0.0 ± 0.0***
BAL fluid cellular composition after day 180
Control TiO2 CeO2 CB
Total cells (× 105) 0.7 ± 0.3 1.0 ± 0.2 0.9 ± 0.3 1.3 ± 0.6
Neutrophils (×104) 0.3 ± 0.4 0.6 ± 0.4 0.3 ± 0.3 1.1 ± 0.7
Macrophages (×104) 7.0 ± 2.9 9.4 ± 2.1 8.4 ± 2.9 11.9 ± 4.9
Lymphocytes (×102) 0.0 ± 0.0 0.0 ± 0.0 0.5 ± 1.1 0.0 ± 0.0
Eosinophils (×103) 0.3 ± 0.4 0.4 ± 0.5 4.9 ± 6.8 4.9 ± 4.4
Particle exposed groups n = 6, vehicle control n = 6. All values are presented as mean ± SD. An asterisk (*) denotes P ≤ 0.05, (**) P ≤ 0.01, (***) P ≤ 0.001 of statisticallysignificantly different cells level in exposed groups versus vehicle control
Fig. 3 Pulmonary Saa3 mRNA expression levels in mice followingintratracheal instillation of 162 μg of TiO2, CeO2 or CB NPs measured1, 28 and 180 days after the exposure. Saa3 mRNA levels werenormalized to 18S rRNA. Particle exposed groups n = 6, vehiclecontrol n = 6. All values are presented as mean + SD. Asterisks (**)denote P ≤ 0.01, (***) P≤ 0.001 of Saa3 mRNA level in exposedgroups versus vehicle control
Modrzynska et al. Particle and Fibre Toxicology (2018) 15:2 Page 6 of 12
vehicle control in the CB group (3.2 fold increase,P ≤ 0.01) 28 days following exposure (Fig. 6). CB ex-posure also induced statistically significantly higherDNA strand break levels than TiO2 exposure (3.2fold, P ≤ 0.01). 180 days after intratracheal instillation%TDNA was statistically significantly increased forCB exposed group compared to vehicle control (3.8fold, P ≤ 0.001), TiO2 (3.9 fold, P ≤ 0.001) and CeO2
(2.4 fold, P ≤ 0.05) (Fig. 6 and Table 3).
Analysis of the %TDNA in liver tissue in intravenouslyexposed groups revealed statistically significantly differ-ences between CB and vehicle control and between CBand TiO2 and CeO2 exposed groups (5.8, 5.9 and 4.8fold increase, respectively, P ≤ 0.0001 for all groups)
Fig. 4 Enhanced darkfield (a-c) and brightfield (d) pictures of H&Estained liver tissue from intravenously (IV) and intratracheally (IT)exposed mice that received control vehicle (a) or 162 μg/animal ofTiO2 (b), CeO2 (c) or CB (d) NPs 180 days post-exposure. In the liversections of mice exposed to TiO2 and CeO2 light scattering aggregateswere observed using enhanced darkfield microscopy (b and c, selectedNPs marked with white arrowheads). In the liver sections of miceexposed to CB NPs black aggregates were observed using brightfieldmicroscopy (d, selected NPs marked with black arrowheads)
Fig. 5 Hepatic Saa1 mRNA expression levels in mice followingintratracheal instillation (I.T.), intravenous injection (I.V.) and oralgavage (P.O.) of 162 μg of TiO2, CeO2 or CB measured 1 day afterexposure. Particle exposed groups n = 9, vehicle control n = 9. Allvalues are presented as mean + SD. Asterisks (**) denote P ≤ 0.01and (***) P ≤ 0.001 of Saa1 mRNA levels in exposed groups versusvehicle control. Hashtag (#) denotes P ≤ 0.05 of Saa1 mRNA level inTiO2 vs CB groups. Crosses (†††) denote P≤ 0.001 of Saa1 mRNAlevel in CeO2 vs CB groups. Double cross (‡) denotes P ≤ 0.05 and(‡‡‡) denote P ≤ 0.001 of Saa1 mRNA level in TiO2 vs CeO2 groups
Table 3 DNA strand break levels (% tail DNA) in liver tissuefollowing intratracheal instillation, intravenous injection and oralgavage of 162 μg of TiO2, CeO2 or CB NPs 1, 28 and 180 daysafter the exposure determined by the Comet assay
DNA SB in the liver following intratracheal instillation
Control TiO2 CeO2 CB
day 1 4.1 ± 4.6 4.3 ± 1.5 3.7 ± 1.4 5.6 ± 3.7
day 28 3.0 ± 1.4 2.9 ± 0.8 5.2 ± 5.9 9.4 ± 7.2**##
day 180 3.5 ± 0.8 3.4 ± 1.0 5.5 ± 2.4 12.2 ± 8.7***###†
DNA SB in the liver following intravenous injection
Control TiO2 CeO2 CB
day 1 3.1 ± 0.9 3.0 ± 1.0 3.7 ± 1.1 17.9 ± 7.9***###†††
day 28 5.2 ± 4.0 3.6 ± 1.1 9.7 ± 4.9 16.1 ± 10.2***###
day 180 3.3 ± 0.7 5.8 ± 7.2 3.7 ± 2.0 22.8 ± 11.1***###†††
DNA SB in the liver following oral gavage
Control TiO2 CeO2 CB
day 1 5.5 ± 3.8 4.6 ± 3.5 7.9 ± 8.6 13.9 ± 10.4
day 28 3.0 ± 0.6 2.8 ± 0.6 3.3 ± 0.7 2.4 ± 0.6
day 180 2.8 ± 0.8 3.5 ± 0.9 3.8 ± 3.5 7.2 ± 6.5
Particle exposed groups n = 9, vehicle control n = 9. All values are presented asmean ± SD. Asterisks (**) denote P ≤ 0.01, (***) P ≤ 0.001 of DNA SB levels inexposed groups versus vehicle control. Hashtags (##) denote P ≤ 0.01 and (###)P ≤ 0.001 of DNA SB levels in the CB groups compared to TiO2 groups. Cross(†) denotes P ≤ 0.05, (†††) P ≤ 0.001 of DNA SB levels in the CB groupscompared to CeO2 groups
Modrzynska et al. Particle and Fibre Toxicology (2018) 15:2 Page 7 of 12
1 day following intravenous injection (Fig. 7). 28 dayspost-exposure, DNA strand break levels in liver tissue inthe CB group were statistically significantly increasedcompared to vehicle control (3.1 fold, P ≤ 0.001) andTiO2 exposed group (4.4 fold, P ≤ 0.0001). 180 daysfollowing exposure, DNA strand break levels in livertissue in the CB group were statistically significantlyincreased compared to vehicle control and TiO2 andCeO2 exposed groups (6.9, 4.0 and 6.2 fold, respectively,P ≤ 0.0001 for all groups) (Table 3 and Fig. 7).In the orally exposed groups %TDNA levels the liver
tissue were unaffected by exposure at all assessed timepoints (Table 3).
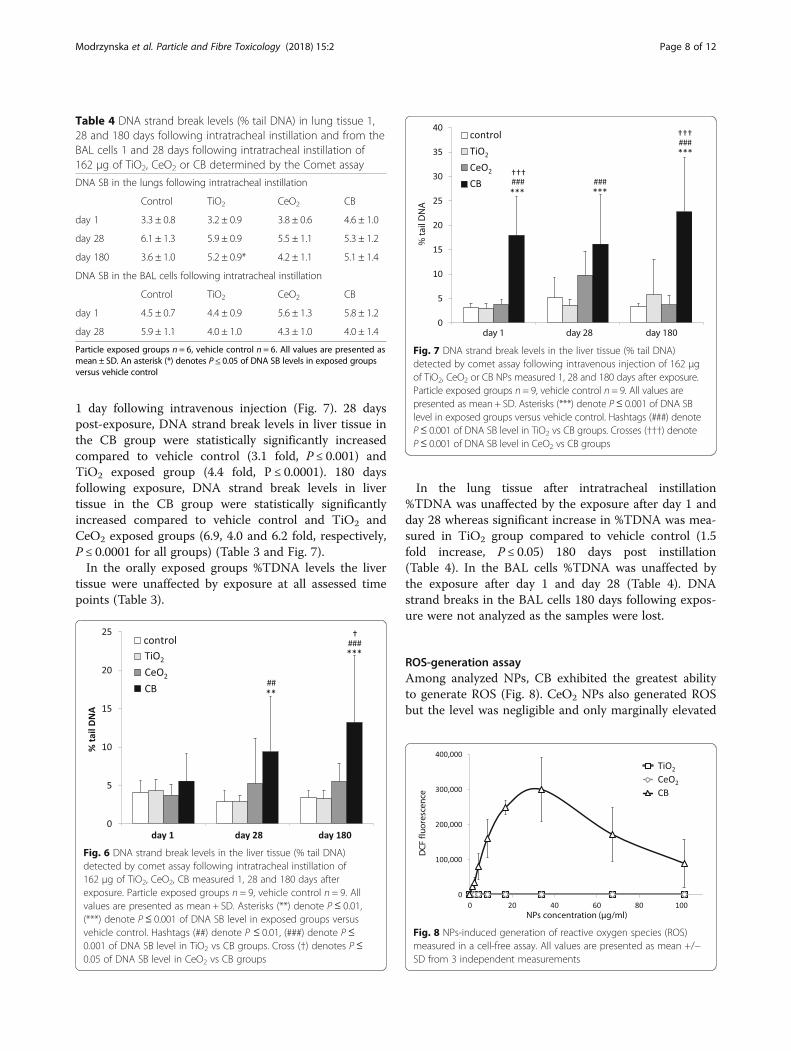
In the lung tissue after intratracheal instillation%TDNA was unaffected by the exposure after day 1 andday 28 whereas significant increase in %TDNA was mea-sured in TiO2 group compared to vehicle control (1.5fold increase, P ≤ 0.05) 180 days post instillation(Table 4). In the BAL cells %TDNA was unaffected bythe exposure after day 1 and day 28 (Table 4). DNAstrand breaks in the BAL cells 180 days following expos-ure were not analyzed as the samples were lost.
ROS-generation assayAmong analyzed NPs, CB exhibited the greatest abilityto generate ROS (Fig. 8). CeO2 NPs also generated ROSbut the level was negligible and only marginally elevated
Table 4 DNA strand break levels (% tail DNA) in lung tissue 1,28 and 180 days following intratracheal instillation and from theBAL cells 1 and 28 days following intratracheal instillation of162 μg of TiO2, CeO2 or CB determined by the Comet assay
DNA SB in the lungs following intratracheal instillation
Control TiO2 CeO2 CB
day 1 3.3 ± 0.8 3.2 ± 0.9 3.8 ± 0.6 4.6 ± 1.0
day 28 6.1 ± 1.3 5.9 ± 0.9 5.5 ± 1.1 5.3 ± 1.2
day 180 3.6 ± 1.0 5.2 ± 0.9* 4.2 ± 1.1 5.1 ± 1.4
DNA SB in the BAL cells following intratracheal instillation
Control TiO2 CeO2 CB
day 1 4.5 ± 0.7 4.4 ± 0.9 5.6 ± 1.3 5.8 ± 1.2
day 28 5.9 ± 1.1 4.0 ± 1.0 4.3 ± 1.0 4.0 ± 1.4
Particle exposed groups n = 6, vehicle control n = 6. All values are presented asmean ± SD. An asterisk (*) denotes P ≤ 0.05 of DNA SB levels in exposed groupsversus vehicle control
Fig. 6 DNA strand break levels in the liver tissue (% tail DNA)detected by comet assay following intratracheal instillation of162 μg of TiO2, CeO2, CB measured 1, 28 and 180 days afterexposure. Particle exposed groups n = 9, vehicle control n = 9. Allvalues are presented as mean + SD. Asterisks (**) denote P ≤ 0.01,(***) denote P ≤ 0.001 of DNA SB level in exposed groups versusvehicle control. Hashtags (##) denote P ≤ 0.01, (###) denote P ≤0.001 of DNA SB level in TiO2 vs CB groups. Cross (†) denotes P≤0.05 of DNA SB level in CeO2 vs CB groups
Fig. 7 DNA strand break levels in the liver tissue (% tail DNA)detected by comet assay following intravenous injection of 162 μgof TiO2, CeO2 or CB NPs measured 1, 28 and 180 days after exposure.Particle exposed groups n = 9, vehicle control n = 9. All values arepresented as mean + SD. Asterisks (***) denote P≤ 0.001 of DNA SBlevel in exposed groups versus vehicle control. Hashtags (###) denoteP≤ 0.001 of DNA SB level in TiO2 vs CB groups. Crosses (†††) denoteP≤ 0.001 of DNA SB level in CeO2 vs CB groups
Fig. 8 NPs-induced generation of reactive oxygen species (ROS)measured in a cell-free assay. All values are presented as mean +/−SD from 3 independent measurements
Modrzynska et al. Particle and Fibre Toxicology (2018) 15:2 Page 8 of 12
above background. There was no signal detected forTiO2 at any of the analyzed concentrations.
DiscussionWe have previously observed that pulmonary exposureto reactive NPs induced genotoxicity in the liver tissue[14, 17, 25, 41]. Therefore, in the present work, wewanted to determine whether the observed hepatic DNAstrand breaks following pulmonary exposure to CB NPswere caused by primary genotoxicity due to the directeffects of translocated particles and their ability to in-duce reactive oxygen species formation [21] or by sec-ondary genotoxicity caused by pulmonary inflammationand acute phase response triggering molecular signalingcascade (release of cytokines, chemokines and ROS/RNS) that, in turn, initiate downstream toxic effects inthe liver [41, 42].
Hepatic genotoxicity and possible mechanism for theadverse hepatic effectsWe found evidence of particle translocation from lungto liver for all three NPs using darkfield and brigthfieldmicroscopy. In relation to the current study, we havealso quantified the extrapulmonary translocation ofCeO2 and TiO2 NPs following intratracheal exposureusing inductively coupled plasma mass spectrometry(ICP-MS) and confirmed translocation of CeO2 andTiO2 to the liver (Modrzynska et al., submitted forpublication).In the present study, intravenous injection of CB NPs
resulted in increased DNA strand break (SB) levels inliver 1, 28 and 180 days post-exposure, whereas intratra-cheal instillation of CB induced DNA SBs in liver 28 and180 days post-exposure. Significant translocation ofTiO2 NPs from lung to liver was recently demonstratedusing radioactively labelled TiO2 NPs [7]. In agreementwith this, we also detected intratracheally instilled TiO2
and CeO2 NPs in the liver 180 days post-exposure bydarkfield microscopy. The fact that hepatic genotoxicitywas only observed at the later time points following pul-monary exposure might reflect the time needed for par-ticles to translocate in sufficient amounts from lungs tothe liver [7].It has been previously suggested by Jackson [41] that
the observed liver DNA SBs could be a result of gastro-intestinal tract exposure due to the whole-body inhal-ation and further fur grooming. Minute uptake of TiO2
NPs following oral exposure has been reported [7, 43,44] and it was recently estimated that up to 20% of TiO2
NPs accumulated in liver following pulmonary exposurehad reached the liver by the oral route [7]. However, wehave found no detectable translocation of CeO2 andTiO2 NPs in the liver after oral exposure. Overall, nohepatotoxic effects were observed following oral gavage
since the dosing did not elicit neither acute phase re-sponse nor genotoxicity in the liver. This indicates thatthe secondary oral exposure caused by swallowing a por-tion of lung-deposited particles did not contribute to theobserved adverse effects. In general, larger dose or re-peated oral exposure were needed to evoke the toxic ef-fect observed in the other studies [26, 45, 46].CB is a well characterized carbonaceous nanomaterial
and very potent ROS generator [22, 47, 48]. Exposure toCB NPs has been shown to induce oxidative DNA dam-age, increased levels of DNA strand breaks [21, 49] aswell as mutagenicity in vivo and in vitro [22, 50]. Themutation spectrum observed in vitro is consistent withbeing caused by oxidative DNA damage [47]. The afore-mentioned studies are in a good agreement with thepresent results, showing that CB is much more potent interms of generating ROS than TiO2 and CeO2 NPs.Moreover, CB NPs contain very low levels of organic im-purities [22, 51, 52] that excludes the hypothesis thatCB-induced genotoxicity is caused by polycyclicaromatic hydrocarbons (PAH) that are absorbed on par-ticles’ surface.
Pulmonary acute phase response but no hepatic acutephase responseIn our previous studies [13, 15, 40, 53, 54] we demon-strated that Saa3 was the most upregulated acute phasegene during pulmonary acute phase response and, fre-quently, the most differentially expressed gene. Saa1 wasthe most differentially expressed acute phase responsegene in the liver [39]. Therefore, Saa3 mRNA expressionlevels were used as a biomarker for pulmonary acutephase response whereas Saa1 expression was used as abiomarker for hepatic acute phase response [55].Pulmonary exposure to all three NPs induced similar
pulmonary inflammation in terms of neutrophil influxthat persisted up to day 28 and long-lasting pulmonaryacute phase response that sustained for 180 days. Thehighest induction of acute phase was observed after day1 and declined in a time-dependent manner remainingelevated for TiO2 and CB NPs 180 days following expos-ure. Pulmonary acute phase response was similar for allthree particles when compared to the control and no dif-ferences between particles were observed. Thus, if thehepatic genotoxicity was caused by systemic circulationof pulmonary inflammatory messengers, then all theassessed NPs would induce hepatic genotoxicity. Instead,hepatic genotoxicity was only observed in CB exposedgroups. Therefore, it is unlikely that circulating cytokinesreleased by pulmonary-mediated inflammation and acutephase response caused the DNA lesions. Moreover, a re-cent meta-analysis of global transcriptional pattern fol-lowing pulmonary exposure to CB and TiO2 NPsindicated that exposure to CB and TiO2 induced similar
Modrzynska et al. Particle and Fibre Toxicology (2018) 15:2 Page 9 of 12
changes in pulmonary transcription [56]. Both materialsevoked comparable neutrophilic-dominated lung inflam-mation and similarly altered expression level of manypro-inflammatory genes. In addition, our previous stud-ies indicated that CB [16] and TiO2 [53] NPs inducedsimilar alterations in the expression profile of selectedcytokines genes in the lung tissue. Demonstrated resem-blances in the elicited pulmonary response following ex-posure to CB and TiO2 should lead to the similarinduction level of different secondary mediators thatwould cause similar level of hepatic DNA SBs in bothexposure groups. Instead, we have only observed hepaticgenotoxicity in the CB NPs exposed mice, which is anadditional evidence of primary genotoxicity caused bythe deposited CB NPs rather than by the effects of circu-lating secondary mediators.In the present study, we found induction of hepatic
acute phase response following lung instillation of TiO2
NPs and CeO2 NPs and following intravenous injectionof TiO2 NPs that was present at day 1 but has alreadysubsided by the day 28. Induction of hepatic acute phaseresponse was much weaker and shorter than the pul-monary acute-phase response. Pulmonary exposure toTiO2 increased pulmonary Saa3 expression level 100-fold whereas 17.3 fold induction and 9.4 fold inductionof hepatic Saa1 was measured after intravenous injectionand intratracheal instillation, respectively. No acute phaseresponse was detected in the liver of orally gavaged ani-mals. In addition CB NPs exposure by IV or IT, in contrastto TiO2 and CeO2 did not induce hepatic acute phase re-sponse, therefore hepatic acute phase response is also nota likely cause of the observed genotoxicity.We have previously reported transient or no hepatic
acute phase response following pulmonary exposuremeasured by analysis of the transcriptional changes inliver mRNA of mice exposed to diesel exhaust particles(DEP), CB, multi walled carbon nanotubes [13, 39].Transient acute phase response in the liver tissue wasalso reported after pulmonary exposure to 162 μg/mouseof TiO2 as reported by [25]. Hepatic acute phase re-sponse induced by intravenous injection of gold particleshas been reported by Zhang and co-workers [57]. Theyused Saa reporter mouse model to detect transcriptionalactivation of hepatic Saa using bioluminescence im-aging. Their results demonstrated that among all of theassessed particles 50 nm Au nanospheres exhibited thehighest capacity to induce activation of hepatic Saa. Thehighest activation was detected 4 h following intraven-ous injection. The signal was transient and gradually de-clined. In the present study lack of detection of hepaticacute phase response after intravenous injection of CeO2
and CB at all three time points as well as temporary in-duction of acute phase response in the TiO2 group onday 1 could be explained by the brief and transient
nature of acute phase response induction in the liverthat causes difficulties in the measurement.Overall, our results suggest that the observed hepatic
DNA damage following IV and IT exposure to CB wascaused by the presence of translocated NPs in the liverand their ability to induce oxidative stress rather than bysecondary effects of pulmonary inflammation and acutephase response. Particles deposited in the liver are pri-mary accumulated in the Kupffer cells [58]. In thecurrent study, we observed foreign material in sinusoidsand in Kupffer cells. Only a small fraction of the livercells appeared to be directly exposed to the particle-generated ROS [41]. Apparently, this was sufficient toinduce hepatic genotoxicity.Our results may also imply that inhaled carbon nano-
particles could induce hepatic genotoxicity leading toliver carcinogenesis. It is supported by epidemiologicalstudies showing that exposure to traffic related air pollu-tion is associated with risk of liver cancer [59, 60]. TheInternational Agency for Research on Cancer (IARC)has classified CB NPs as possibly carcinogenic tohumans [61]. It can be speculated that the presence ofCB NPs in the liver may, in a long-time perspective,contribute to the onset of cancer.
ConclusionsPulmonary exposure to three different NPs, TiO2, CeO2
and CB induced long lasting pulmonary inflammationand acute phase response. Indications of translocation tothe liver were found for all three NPs. However, only CBdosed by IT and IV induced hepatic genotoxicity. There-fore, our findings indicate that hepatic DNA strandbreaks following pulmonary exposure to CB are likelycaused by direct effects of CB NPs that translocate fromlung to liver rather than being caused by inflammatoryor acute phase responses. Furthermore, the lack of par-ticle translocation, inflammation and acute phase re-sponse following oral exposure to NPs suggest that thesecondary oral exposure following pulmonary clearanceof inhaled particles does not contribute to the observedhepatic genotoxicity.
Additional files
Additional file 1: Pulmonary Saa3 mRNA expression level followingintratracheal instillation of 162 μg of TiO2, CeO2 or CB NPs 1, 28 and180 days post-exposure. (DOCX 14 kb)
Additional file 2: Hepatic Saa1 mRNA expression level followingintratracheal instillation, intravenous injection and oral gavage of 162 μgof TiO2, CeO2 or CB NPs 1, 28 and 180 days post-exposure. (DOCX 15 kb)
Abbreviations%TDNA: % of the DNA in the comet tail; BAL: Bronchoalveolar lavage;BFM: Brightfield microscopy; CB: Carbon clack; CeO2: Cerium oxide;DLS: Dynamic light scattering; DNA SBs: DNA strand breaks; EDFM: Enhanceddarkfield microscopy; ICP-MS: Inductively coupled plasma mass spectrometry;
Modrzynska et al. Particle and Fibre Toxicology (2018) 15:2 Page 10 of 12
IL-1: Interleukin 1; IL-6: Interleukin 6; IT: Intratracheal; IV: Intravenous;NPs: Nanoparticles; PO: Per oral; RNS: Reactive nitrogen species; ROS: Reactiveoxygen species; RT-PCR: Reverse transcription polymerase chain reaction;SAA: Serum amyloid A; TiO2: Titanium dioxide; TL: Tail length; TNFα: Tumornecrosis factor α
AcknowledgementsWe gratefully acknowledge Erik H. Larsen for his invaluable contribution inthe study designing. The authors would also like to thank Annette Landin,Maja Danielsen, Sarah G. Simonsen, Michael Guldbrandsen, Lourdes M.Pedersen, Elzbieta Christiansen, Anne-Karin Asp, Anne Abildtrup for excellenttechnical assistance.
FundingThe project was supported by the Danish Centre for Nanosafety (grant no.20110092173–3) from the Danish Working Environment Research Foundation.
Availability of data and materialsAll data generated or analyzed during this study are included in this publishedarticle (and its supplementary information files).
Authors’ contributionsJM, GRH, KL, AM, ATS, UV contributed to the project idea and design. JMcarried out exposures and animal study, real-time RT-PCR, comet assay andstatistical analysis of all data. TB provided BFM and EDFM images. NRJcontributed to the animal exposure. NRJ and IEKW carried out ROS assay.JM, TB, GRH, NRJ, IEKW, KL, AM, ATS, UV contributed to the writing of themanuscript, read and approved the final manuscript.
Ethics approvalThe mice study was conducted in the agreement with the Danish AnimalExperimental Inspectorate under the Ministry of Justice (Permission2012–15–2934-00089 C6) and the Technical University of Denmark’sanimal welfare protocol.
Consent for publicationNot applicable.
Competing interestsAll authors declare that they have no competing interests.
Publisher’s NoteSpringer Nature remains neutral with regard to jurisdictional claims in publishedmaps and institutional affiliations.
Author details1Technical University of Denmark, National Food Institute, Lyngby, Denmark.2The National Research Centre for the Working Environment, Lersø Parkallé105, DK-2100 Copenhagen Ø, Denmark. 3Department of Micro- andNanotechnology, Technical University of Denmark, Kongens Lyngby,Denmark.
Received: 16 August 2017 Accepted: 15 December 2017
References1. Stone V, Miller MR, Clift MJD, Elder A, Mills NL, Moller P, et al. Nanomaterials
vs ambient ultrafine particles: an opportunity to exchange toxicologyknowledge. Environ Health Perspect. 2017;125(10):106002.
2. Oberdörster G, Oberdörster E, Oberdörster J. Nanotoxicology: an emergingdiscipline evolving from studies of ultrafine particles. Environ HealthPerspect. 2005;113:823–39.
3. Geiser M, Kreyling WG. Deposition and biokinetics of inhaled nanoparticles.Part. Fibre Toxicol. 2010;7:2.
4. Kreyling WG, Semmler-Behnke M, Takenaka S, Möller W. Differences in thebiokinetics of inhaled nano-versus micrometer-sized particles. Acc ChemRes. 2013;46:714–22.
5. Fröhlich E, Salar-Behzadi S. Toxicological assessment of inhalednanoparticles: role of in vivo, ex vivo, in vitro, and in Silico studies. Int J MolSci. 2014;15:4795–822.
6. Paranjpe M, Muller-Goymann CC. Nanoparticle-mediated pulmonary drugdelivery: a review. Int J Mol Sci. 2014;15:5852–73.
7. Kreyling WG, Holzwarth U, Haberl N, Kozempel J, Wenk A, Hirn S, et al.Quantitative biokinetics of titanium dioxide nanoparticles after intratrachealinstillation in rats: part 3. Nanotoxicology. 2017;11(4):454–64.
8. Sadauskas E, Jacobsen NR, Danscher G, Stoltenberg M, Vogel U, Larsen A, etal. Biodistribution of gold nanoparticles in mouse lung followingintratracheal instillation. Chem Cent J. 2009;3:16.
9. Takenaka S, Karg E, Kreyling WG, Lentner B, Möller W, Behnke-Semmler M,et al. Distribution pattern of inhaled ultrafine gold particles in the rat lung.Inhal Toxicol. 2006;18:733–40.
10. Semmler M, Seitz J, Erbe F, Mayer P, Heyder J, Oberdörster G, et al. Long-term clearance kinetics of inhaled ultrafine insoluble iridium particles fromthe rat lung, including transient translocation into secondary organs. InhalToxicol. 2004;16:453–9.
11. Kreyling WG, Semmler M, Erbe F, Mayer P, Takenaka S, Schulz H, et al.Translocation of ultrafine insoluble iridium particles from lung epithelium toExtrapulmonary organs is size dependent but very low. J Toxicol EnvironHeal PartA. 2002;65:1513–30.
12. Oberdörster G, Sharp Z, Atudorei V, Elder A, Gelein R, Lunts A, et al.Extrapulmonary translocation of ultrafine carbon particles following whole-bodyinhalation exposure of rats. J Toxicol Environ Heal Part A. 2002;65:1531–43.
13. Saber AT, Lamson JS, Jacobsen NR, Ravn-Haren G, Hougaard KS, Nyendi AN,et al. Particle-induced pulmonary acute phase response correlates withNeutrophil influx linking inhaled particles and cardiovascular risk. PLoS One.2013;8:1–10.
14. Bourdon JA, Saber AT, Jacobsen NR, Jensen KA, Madsen AM, Lamson JS, etal. Carbon black nanoparticle instillation induces sustained inflammationand genotoxicity in mouse lung and liver. Part. Fibre Toxicol. 2012;9:5.
15. Halappanavar S, Jackson P, Williams A, Jensen KA, Hougaard KS, Vogel UB, et al.Pulmonary response to surface-CoatedNanotitanium dioxide particles includesinduction of acute phase response genes, inflammatory cascades, andchanges inMicroRNAs: AToxicogenomic study. Environ. Mol. 2011;52:425–39.
16. Jackson P, Hougaard KS, Vogel U, Wu D, Casavant L, Williams A, et al.Exposure of pregnant mice to carbon black by intratracheal instillation:Toxicogenomic effects in dams and offspring. Mutat Res - Genet ToxicolEnviron Mutagen. 2012;745:73–83.
17. Husain M, Kyjovska ZO, Bourdon-Lacombe J, Saber AT, Jensen KA, JacobsenNR, et al. Carbon black nanoparticles induce biphasic gene expressionchanges associated with inflammatory responses in the lungs of C57BL/6mice following a single intratracheal instillation. Toxicol Appl Pharmacol.2015;289:573–88.
18. Bengtson S, Knudsen KB, Kyjovska ZO, Berthing T, Skaug V, Levin M, et al.Differences in inflammation and acute phase response but similargenotoxicity in mice following pulmonary exposure to graphene oxide andreduced graphene oxide. PLoS One. 2017;12:1–25.
19. Schins RPF, Knaapen AM. Genotoxicity of poorly soluble particles. InhalToxicol. 2007;19(Suppl 1):189–98.
20. Saber AT, Mortensen A, Szarek J, Koponen IK, Levin M, Jacobsen NR, et al.Epoxy composite dusts with and without carbon nanotubes cause similarpulmonary responses, but differences in liver histology in mice followingpulmonary deposition. Part. Fibre Toxicol. 2016;13:37.
21. Jacobsen NR, Pojana G, White P, Moller P, Cohn CA, Korsholm KS, et al.Genotoxicity, Cytotoxicity, and reactive oxygen species induced by single-walled carbon Nanotubes and C60 fullerenes in the FE1-MutaTM mouselung epithelial cells. Environ Mol. 2008;49:476–87.
22. Jacobsen NR, Saber AT, White P, Moller P, POjana G, Vogel U, et al.Increased mutant frequency by carbon black, but not quartz, in the lacZand cII transgenes of muta mouse lung epithelial cells. Environ MolMutagen. 2007;48:451–61.
23. Shukla RK, Kumar A, Vallabani NVS, Pandey AK, Dhawan A. Titanium dioxidenanoparticle-induced oxidative stress triggers DNA damage and hepaticinjury in mice. Nanomedicine (Lond). 2014;9:1423–34.
24. Kermanizadeh A, Gaiser BK, Hutchison GR, Stone V. An in vitro liver model–assessing oxidative stress and genotoxicity following exposure ofhepatocytes to a panel of engineered nanomaterials. Part Fibre Toxicol.2012;9:28.
25. Wallin H, Kyjovska ZO, Poulsen SS, Jacobsen NR, Saber AT, Bengtson S, et al.Surface modification does not influence the genotoxic and inflammatoryeffects of TiO2 nanoparticles after pulmonary exposure by instillation inmice. Mutagenesis. 2017;32(1):47–57.
Modrzynska et al. Particle and Fibre Toxicology (2018) 15:2 Page 11 of 12
26. Kumari M, Kumari SI, Kamal SSK, Grover P. Genotoxicity assessment ofcerium oxide nanoparticles in female Wistar rats after acute oral exposure.Mutat Res - Genet Toxicol Environ Mutagen. 2014;775:7–19.
27. Auffan M, Rose J, Orsiere T, De Meo M, Thill A, Zeyons O, et al. CeO2nanoparticles induce DNA damage towards human dermal fibroblasts invitro. Nanotoxicology. 2009;3:161–71.
28. Zhang R, Dai Y, Zhang X, Niu Y, Meng T, Li Y, et al. Reduced pulmonaryfunction and increased pro-inflammatory cytokines in nanoscale carbonblack-exposed workers. Part Fibre Toxicol. 2014;11:73.
29. Saber AT, Jensen KA, Jacobsen NR, Birkedal R, Mikkelsen L, Møller P, et al.Inflammatory and genotoxic effects of nanoparticles designed for inclusionin paints and lacquers. Nanotoxicology. 2012;6:453–71.
30. Mikkelsen L, Sheykhzade M, Jensen KA, Saber AT, Jacobsen NR, Vogel U, et al.Modest effect on plaque progression and vasodilatory function in atherosclerosis-prone mice exposed to nanosized TiO2. Part. Fibre Toxicol. 2011;8:32.
31. Poulsen SS, Jackson P, Kling K, Knudsen KB, Skaug V, Kyjovska ZO, et al. Multi-walled carbon nanotube physicochemical properties predict pulmonaryinflammation and genotoxicity. Nanotoxicology. 2016;10:1263–75.
32. Kyjovska ZO, Jacobsen NR, Saber AT, Bengston S, Jackson P, Wallin H, et al. DNAdamage following pulmonary exposure by instillation to low doses of carbonblack (Printex 90) nanoparticles in mice. Environ Mol Mutagen. 2015;56:41–9.
33. Schneider CA, Rasband WS, Eliceiri KW. NIH image to ImageJ: 25 years ofimage analysis. Nat Methods. 2012;9:671–5.
34. Saber AT, Halappanavar S, Folkmann JK, Bornholdt J, Boisen AMZ, Møller P,et al. Lack of acute phase response in the livers of mice exposed to dieselexhaust particles or carbon black by inhalation. Part. Fibre Toxicol. 2009;6:12.
35. Jackson P, Pedersen LM, Kyjovska ZO, Jacobsen NR, Saber AT, Hougaard KS,et al. Validation of freezing tissues and cells for analysis of DNA strand breaklevels by comet assay. Mutagenesis. 2013;28:699–707.
36. Høgsberg T, Jacobsen NR, Clausen PA, Serup J. Black tattoo inks inducereactive oxygen species production correlating with aggregation ofpigment nanoparticles and product brand but not with the polycyclicaromatic hydrocarbon content. Exp Dermatol. 2013;22:464–9.
37. Bourdon JA, Saber AT, Halappanavar S, Jackson PA, Wu D, Hougaard KS, etal. Carbon black nanoparticle intratracheal installation results in large andsustained changes in the expression of miR-135b in mouse lung. EnvironMol Mutagen. 2012;53:462–8.
38. Saber AT, Jacobsen NR, Mortensen A, Szarek J, Jackson P, Madsen AM, et al.Nanotitanium dioxide toxicity in mouse lung is reduced in sanding dustfrom paint. Part. Fibre Toxicol. 2012;9:4.
39. Poulsen SS, Knudsen KB, Jackson P, Weydahl IEK, Saber AT, Wallin H, et al.Multi-walled carbon nanotube-physicochemical properties predict thesystemic acute phase response following pulmonary exposure in mice. PLoSOne. 2017;12:e0174167.
40. Saber AT, Jacobsen NR, Jackson P, Poulsen SS, Kyjovska ZO, Halappanavar S,et al. Particle-induced pulmonary acute phase response may be the causallink between particle inhalation and cardiovascular disease. Wiley InterdiscipRev Nanomed Nanobiotechnol. 2014;6:517–31.
41. Jackson P, Hougaard KS, Boisen AMZ, Jacobsen NR, Jensen KA, Møller P, etal. Pulmonary exposure to carbon black by inhalation or instillation inpregnant mice: effects on liver DNA strand breaks in dams and offspring.Nanotoxicology. 2012;6:486–500.
42. Knaapen AM, Borm PJA, Albrecht C, Schins RPF. Inhaled particles and lungcancer. Part a: mechanisms. Int J Cancer. 2004;109:799–809.
43. Kreyling WG, Holzwarth U, Haberl N, Kozempel J, Wenk A, Hirn S, et al.Quantitative biokinetics of titanium dioxide nanoparticles after oralapplication in rats: part 2. Nanotoxicology. 2017;11(4):443–53.
44. Geraets L, Oomen AG, Krystek P, Jacobsen NR, Wallin H, Laurentie M, et al.Tissue distribution and elimination after oral and intravenous administration ofdifferent titanium dioxide nanoparticles in rats. Part. Fibre Toxicol. 2014;11:30.
45. Sycheva LP, Zhurkov VS, Iurchenko VV, Daugel-Dauge NO, Kovalenko MA,Krivtsova EK, et al. Investigation of genotoxic and cytotoxic effects of micro-and nanosized titanium dioxide in six organs of mice in vivo. Mutat Res.2011;726:8–14.
46. Trouiller B, Reliene R, Westbrook A, Solaimani P, Schiestl RH. Titaniumdioxide nanoparticles induce DNA damage and genetic instability in vivo inmice. Cancer Res. 2009;69:8784–9.
47. Jacobsen NR, White PA, Gingerich J, Moller P, Saber AT, Douglas GR, et al.Mutation spectrum in FE1-MUTA(TM) mouse lung epithelial cells exposed tonanoparticulate carbon black. Environ Mol Mutagen. 2011;52(4):331–7.
48. Hussain S, Boland S, Baeza-Squiban A, Hamel R, Thomassen LCJ, Martens JA,et al. Oxidative stress and proinflammatory effects of carbon black andtitanium dioxide nanoparticles: role of particle surface area and internalizedamount. Toxicology. 2009;260:142–9.
49. Jacobsen NR, Møller P, Jensen KA, Vogel U, Ladefoged O, Loft S, et al. Lunginflammation and genotoxicity following pulmonary exposure tonanoparticles in ApoE−/− mice. Part. Fibre Toxicol. 2009;6:2.
50. Driscoll KE, Carter JM, Howard BW, Hassenbein DG, Pepelko W, Baggs RB, etal. Pulmonary inflammatory, Chemokine, and mutagenic responses in ratsafter subchronic inhalation of carbon black. Toxicol Appl Pharmacol. 1996;136:372–80.
51. Jackson P, Vogel U, Wallin H, Hougaard KS. Prenatal exposure to carbonblack (printex 90): effects on sexual development and neurofunction. BasicClin Pharmacol Toxicol. 2011;109:434–7.
52. Borm PJA, Robbins D, Haubold S, Kuhlbusch T, Fissan H, Donaldson K, et al.The potential risks of nanomaterials: a review carried out for ECETOC. Part.Fibre Toxicol. 2006;3:11
53. Husain M, Saber AT, Guo C, Jacobsen NR, Jensen KA, Yauk CL, et al.Pulmonary instillation of low doses of titanium dioxide nanoparticles inmice leads to particle retention and gene expression changes in theabsence of inflammation. Toxicol Appl Pharmacol. 2013;269:250–62.
54. Jackson P, Halappanavar S, Hougaard KS, Williams A, Madsen AM, LamsonJS, et al. Maternal inhalation of surface-coated nanosized titanium dioxide(UV-titan) in C57BL/6 mice: effects in prenatally exposed offspring onhepatic DNA damage and gene expression. Nanotoxicology. 2013;7:85–96.
55. Poulsen SS, Saber AT, Mortensen A, Szarek J, Wu D, Williams A, et al.Changes in cholesterol homeostasis and acute phase response linkpulmonary exposure to multi-walled carbon nanotubes to risk ofcardiovascular disease. Toxicol Appl Pharmacol. 2015;283:210–22.
56. Nikota J, Williams A, Yauk CL, Wallin H, Vogel U, Halappanavar S. Meta-analysisof transcriptomic responses as a means to identify pulmonary diseaseoutcomes for engineered nanomaterials. Part. Fibre Toxicol. 2016;13:25.
57. Zhang Y, Zhou Q, Yan S, Zhang N, Zhao M, Ma C, et al. Non-invasiveimaging serum Amyloid a activation through the NF-KB signal pathwayupon gold nanostructure exposure. Small 2016;3270–82.
58. Sadauskas E, Wallin H, Stoltenberg M, Vogel U, Doering P, Larsen A, et al.Kupffer cells are central in the removal of nanoparticles from the organism.Part Fibre Toxicol. 2007;4:10.
59. Soll-Johanning H, Bach E, Olsen JH, Tüchsen F. Cancer incidence in urbanbus drivers and tramway employees: a retrospective cohort study. OccupEnviron Med. 1998;55:594–8.
60. Raaschou-Nielsen O, Andersen ZJ, Hvidberg M, Jensen SS, Ketzel M,Sorensen M, et al. Air pollution from traffic and cancer incidence: a Danishcohort study. Env Heal. 2011;10:67.
61. Baan R, Straif K, Grosse Y, Secretan B, El Ghissassi F, Cogliano V, et al.Carcinogenicity of carbon black, titanium dioxide, and talc. Lancet Oncol.2006;7(4):295–6.
62. Levin M, Rojas E, Vanhala E, Vippola M, Liguori B, Kling K, et al. Influence ofrelative humidity and physical load during storage on dustiness of inorganicnanomaterials: implications for testing and risk assessment. J Nanopart Res.2015;17:337.
63. Halappanavar S, Saber AT, Decan N, Jensen KA, Wu D, Jacobsen NR, et al.Transcriptional profiling identifies physicochemical properties ofnanomaterials that are determinants of the in vivo pulmonary response.Environ Mol Mutagen. 2015;56:245–64.
64. Saber AT, Bornholdt J, Dybdahl M, Sharma AK, Loft S, Vogel U, et al. Tumornecrosis factor is not required for particle-induced genotoxicity andpulmonary inflammation. Arch Toxicol. 2005;79:177–82.
65. Lide DR. CRC handbook of chemistry and physics. 84th ed; 2004.
Modrzynska et al. Particle and Fibre Toxicology (2018) 15:2 Page 12 of 12