priest rapids hatchery monitoring and evaluation annual ... 2013 priest rapids hatchery... ·...
TRANSCRIPT

Priest Rapids Hatchery Monitoring and Evaluation Annual Report for 2012-13
Steven P. Richards
Paul A. Hoffarth
Washington Department of Fish & Wildlife
And
Todd N. Pearsons
Public Utility District Number 2 of Grant County, Washington
August 7, 2013

© 2013, PUBLIC UTILITY DISTRICT NO. 2 OF GRANT COUNTY, WASHINGTON. ALL RIGHTS RESERVED UNDER U.S. AND FOREIGN LAW, TREATIES AND CONVENTIONS.
i
Executive Summary This report is the third annual report dedicated to monitoring and evaluating the Priest Rapids Hatchery (PRH) production of fall Chinook salmon. The PRH is located below Priest Rapids Dam adjacent to the Columbia River and has been in operation since 1963. The Monitoring and Evaluation program associated with PRH consists of nine objectives and is intended to evaluate the performance of the program in meeting hatchery and natural production goals. This report is intended to be cumulative, but also focus attention on the most recent year of data collection and production (2012-2013).
The PRH was originally built to mitigate for the loss of fall Chinook salmon that occurred from inundation of spawning grounds caused by the Priest Rapids Project. The hatchery is operated as an integrated program for the purpose of increasing harvest. The hatchery produces 5 million subyearling fall Chinook salmon for mitigation of inundation of spawning grounds caused by the Priest Rapids and Wanapum dams and 1.7 million subyearling fall Chinook salmon under contract with the United States Army Corps of Engineers for mitigation for John Day Dam.
The fall Chinook salmon produced at the PRH continue to have high survival before and after release from the hatchery. These fish contribute significantly to a variety of fisheries, such as fisheries off the coasts of Alaska and Canada and fisheries in the Columbia River.
The 2012 returns to PRH for both jacks (9,152) and adult fall Chinook salmon (18,785) were the highest on record. A total of 7,677 fish that returned to the volunteer trap at PRH were ponded for broodstock and 4,946 were spawned to meet egg take goals for multiple hatchery programs. The mortality rate of ponded adult fish was 36% which is the highest on record. The cause for the elevated mortality is uncertain; however, high densities of fish in the PRH volunteer trap may have been a contributing factor.
All ages except age-6 PRH origin fall Chinook salmon returning in 2012 were otolith marked. We used a combination of marks (e.g., otoliths, adipose clips, and coded-wire tags), to determine origin which is likely more accurate than the expansion of coded-wire recoveries to determine origin. The hatchery origin fish return at a younger age than natural origin fish. PRH origin fish are larger than natural origin fish at age-2 and 3, but smaller at older ages.
Hatchery origin fish released from PRH spawn throughout the Hanford Reach, but in 2012 were concentrated in the river reach downstream of Island #2 (River km 605), approximately 56 kilometers downriver of Priest Rapids Dam. Stray rates into other populations appear to be low based upon coded-wire tag (CWT) recoveries.
PRH origin fish were estimated to make up 7% of the spawning population in the Hanford Reach during 2012. All hatchery fish combined (including fish released from Ringold Hatchery and strays from outside the Hanford Reach) comprised 13% of the fall Chinook salmon on the spawning grounds. Otolith recoveries at PRH indicate that a very high percentage of hatchery broodstock are of PRH origin. There appears to be a strong negative bias in coded-wire tag based estimates that were previously used to estimate this variable. The proportion of natural influence (PNI) for Hanford Reach fall Chinook salmon including all hatcheries is estimated at 48%. An alternative estimated PNI specific to the contribution of PRH origin fall Chinook salmon is 63%. Both estimates for PNI are lower than optimum for an integrated harvest program (i.e. > 0.67), however the PNI has increased dramatically during the past few years. Low numbers of natural origin broodstock at PRH contributes to difficulty reaching the PNI target. Additional natural origin broodstock for PRH was collected at the Priest Rapids Dam off ladder adult fish trap and

© 2013, PUBLIC UTILITY DISTRICT NO. 2 OF GRANT COUNTY, WASHINGTON. ALL RIGHTS RESERVED UNDER U.S. AND FOREIGN LAW, TREATIES AND CONVENTIONS.
ii
from a pilot project in which anglers fishing in the Hanford Reach captured fish by hook and line. These additional fish increased the natural origin component of the broodstock from 6% to 12%. An alternative estimate for the proportion natural origin broodstock (pNOB) was developed for return year 2012 to account for the genetic influence on pNOB resulting from the PRH spawning protocol of mating one male with two females. It is intended to represent actual gene flow to the progeny instead of just the origin and number of parents used in spawning. The alternative pNOB for return year 2012 resulted in an estimate of 14% which corresponded to a PRH origin fall Chinook salmon PNI of 67%.

© 2013, PUBLIC UTILITY DISTRICT NO. 2 OF GRANT COUNTY, WASHINGTON. ALL RIGHTS RESERVED UNDER U.S. AND FOREIGN LAW, TREATIES AND CONVENTIONS.
iii
Table of Contents 1.0 Introduction ......................................................................................................................... 1
2.0 Objectives ........................................................................................................................... 2
3.0 Current Operation of Priest Rapids Hatchery ..................................................................... 3
4.0 Tagging and Marking .......................................................................................................... 5
5.0 Life History – Hanford Reach Fall Chinook Salmon ......................................................... 7
6.0 Project Coordination ........................................................................................................... 7
7.0 Sample Size Considerations ................................................................................................ 7
8.0 Evaluation of Bias ............................................................................................................... 8
9.0 Origin of Adult Returns to Priest Rapids Hatchery ............................................................ 9
9.1 Origin Based on Otolith Recoveries ..................................................................... 10
9.2 Origin Based on Coded-Wire Tag Recoveries...................................................... 11
10.0 Broodstock Collection and Sampling ............................................................................... 12
10.1 Origin of Broodstock ............................................................................................ 12
10.2 Influence of Additional Otolith Samples on Origin .............................................. 13
10.3 Broodstock Age Composition ............................................................................... 14
10.4 Length by Age Class of Broodstock ..................................................................... 16
10.5 Gender Ratios........................................................................................................ 17
10.6 Fecundity............................................................................................................... 19
11.0 Hatchery Rearing .............................................................................................................. 20
11.1 Number of eggs taken ........................................................................................... 20
11.2 Number of acclimation days ................................................................................. 21
11.3 Number released ................................................................................................... 21
11.4 Fish Size and Condition at Release ....................................................................... 21
11.5 Survival Estimates ................................................................................................ 22
11.6 Juvenile PIT Tag Detections at the Priest Rapids Hatchery Array ....................... 23
12.0 Adult Fish Pathogen Monitoring ...................................................................................... 24
13.0 Juvenile Fish Health Inspections ...................................................................................... 25
14.0 Redd Surveys .................................................................................................................... 25
14.1 Hanford Reach Aerial Redd Counts ..................................................................... 26
14.2 Redd Distribution .................................................................................................. 26
14.3 Spawn Timing ....................................................................................................... 27
14.4 Spawning Escapement .......................................................................................... 28

© 2013, PUBLIC UTILITY DISTRICT NO. 2 OF GRANT COUNTY, WASHINGTON. ALL RIGHTS RESERVED UNDER U.S. AND FOREIGN LAW, TREATIES AND CONVENTIONS.
iv
14.5 Hatchery Discharge Channel Redd Counts........................................................... 29
15.0 Carcass Surveys ................................................................................................................ 29
15.1 Hanford Reach Carcass Survey: Section 1 – 5 ..................................................... 30
15.1.1 Numbers Sampled: Sections 1 – 5 ............................................................ 31
15.1.2 Proportion of Escapement Sampled: Section 1 – 5 ................................... 31
15.1.3 Carcass Distribution and Origin................................................................ 31
15.2 Priest Rapids Dam Pool Carcass Survey: Section 6 ............................................. 34
15.2.1 Number sampled: Section 6 ...................................................................... 34
15.2.2 Proportion of Escapement Sampled: Section 6 ......................................... 34
15.2.3 Carcass Distribution and Origin: Section 6 .............................................. 35
15.3 Hatchery Discharge Channel: Sections 7 and 8 Carcass Survey .......................... 35
15.3.1 Number sampled: Sections 7 and 8 ........................................................... 36
15.3.2 Proportion of Escapement Sampled: Sections 7 and 8 ............................. 36
15.3.3 Carcass Distribution and Origin: Sections 7 and 8 ................................... 36
15.4 Carcass Bias Assessment ...................................................................................... 37
16.0 Life History Monitoring .................................................................................................... 39
16.1 Migration Timing .................................................................................................. 40
16.2 Age at Maturity ..................................................................................................... 41
16.3 Size at Maturity ..................................................................................................... 43
16.4 Contribution to Fisheries....................................................................................... 45
17.0 Straying ............................................................................................................................. 46
18.0 Genetics............................................................................................................................. 49
19.0 Proportion of Natural Influence ........................................................................................ 49
19.1 Alternative pNOB and PNI ................................................................................... 52
20.0 Natural and Hatchery Replacement Rates ........................................................................ 53
21.0 Smolt-to-Adult Survivals .................................................................................................. 54
22.0 ESA/HCP Compliance ...................................................................................................... 56
22.1 Broodstock Collection .......................................................................................... 56
22.2 Hatchery Rearing and Release .............................................................................. 56
22.3 Hatchery Effluent Monitoring............................................................................... 56
22.4 Ecological Risk Assessment ................................................................................. 56
22.5 Methods and Next Steps ....................................................................................... 57
23.0 Acknowledgments............................................................................................................. 58

© 2013, PUBLIC UTILITY DISTRICT NO. 2 OF GRANT COUNTY, WASHINGTON. ALL RIGHTS RESERVED UNDER U.S. AND FOREIGN LAW, TREATIES AND CONVENTIONS.
v
Literature Cited ............................................................................................................................. 59
List of Figures Figure 1 Location of Priest Rapids and Ringold Springs hatcheries and the Hanford Reach.
................................................................................................................................. 1
Figure 2 Priest Rapids Hatchery facility and Priest Rapids Dam OLAFT. ........................... 2
Figure 3 Daily detections of unique PIT tagged adult Chinook salmon which last known detection was at the PIT tag array located in the Priest Rapids Hatchery discharge channel, 2012. ......................................................................................................... 4
Figure 4 Regression analysis of fecundity by fork length at Priest Rapids Hatchery, broodyears 2010 through 2012. ............................................................................ 20
Figure 5 Distribution of fall Chinook salmon redd counts by location for the 2012 aerial surveys in the Hanford Reach, Columbia River. (Data provided by Mission Support Alliance – Environmental Assessment Service) ..................................... 27
Figure 6 Locations of aerial redd index areas and river survey sections in the Hanford Reach..................................................................................................................... 30
Figure 7 Tagged fall Chinook salmon, carcass bias assessment. ........................................ 37
Figure 8 Age proportions of adult returns of natural and Priest Rapids Hatchery origin fall Chinook sampled at PRH and on spawning grounds in the Hanford Reach, Return Year 2012. ............................................................................................................. 43
List of Tables Table 1 Source and disposition of Chinook salmon collected for broodstock at Priest
Rapids Hatchery, return year 2012. ........................................................................ 3
Table 2 Numbers of marked and unmarked fall Chinook salmon smolts released from Priest Rapids Hatchery. ........................................................................................... 6
Table 3 Percentage of population sampled by survey and otoliths processed, Broodyear 2012......................................................................................................................... 8
Table 4 Estimate of coded-wire tags bias for Priest Rapids origin returns to the hatchery. 9
Table 5 Numbers of hatchery and natural origin Chinook salmon collected at Priest Rapids Hatchery, Priest Rapids Dam Off Ladder Adult Fish Trap, and angler broodstock collection fishery. Origin determined by otolith thermal marks specific to Priest Rapids Hatchery, the presence of coded-wire tags, or adipose clips. ..... 11
Table 6 Estimated proportion of hatchery and natural origin adult Chinook salmon returning to the Priest Rapids Hatchery volunteer trap based on coded-wire tag expansion. The entire collection was sampled for coded-wire tag. ...................... 12
Table 7 Proportion of hatchery and natural origin Chinook salmon spawned at Priest Rapids Hatchery. ................................................................................................... 13

© 2013, PUBLIC UTILITY DISTRICT NO. 2 OF GRANT COUNTY, WASHINGTON. ALL RIGHTS RESERVED UNDER U.S. AND FOREIGN LAW, TREATIES AND CONVENTIONS.
vi
Table 8 Proportion of Priest Rapids Hatchery origin by age of fall Chinook salmon surpluses from the Priest Rapids Hatchery volunteer trap based on otolith marks, broodyear 2012. .................................................................................................... 14
Table 9 Proportion of Priest Rapids Hatchery origin of fall Chinook salmon spawned at Priest Rapids Hatchery based on otolith marks, broodyear 2012. ........................ 14
Table 10 Proportion of age class for hatchery and natural origin fall Chinook salmon spawned at Priest Rapids Hatchery, 2007 – 2012. ................................................ 15
Table 11 Proportion of hatchery and natural origin fall Chinook salmon for each age class of broodstock collected from the PRH volunteer trap. (see file 2012 otolith sampling summary) ............................................................................................... 15
Table 12 Proportion of hatchery and natural origin fall Chinook salmon for each age class of broodstock collected at the Off Ladder Adult Fish Trap. ................................. 15
Table 13 Proportion of hatchery and natural origin fall Chinook salmon for each age of broodstock collected from the Angler Broodstock Collection. ............................ 16
Table 14 Mean fork length (cm) at age (total age) of fall Chinook salmon sampled from each source of broodstock spawned at Priest Rapids Hatchery, 2012. ................. 17
Table 15 Mean fork length (cm) at age (total age) of hatchery and natural origin fall Chinook salmon collected from volunteer broodstock for the Priest Rapids Hatchery program, N = sample size and SD = 1 standard deviation. ................... 17
Table 16 Numbers of male and female hatchery fall Chinook salmon broodstock at Priest Rapids Hatchery. Ratios of males to females are also provided. .......................... 18
Table 17 Numbers of male and female natural origin and Priest Rapids Hatchery origin fall Chinook salmon spawned at Priest Rapids Hatchery, 2012. (Otolith sample size = 14.63% for PRH volunteer returns in the broodstock and 100% for OLAFT and ABC Fishery) ........................................................................................................ 18
Table 18 Mean fecundity of fall Chinook salmon collected for broodstock at Priest Rapids Hatchery. ............................................................................................................... 19
Table 19 Fecundity at Age for fall Chinook salmon sampled the Priest Rapids Hatchery.. 19
Table 20 Numbers of eggs taken from fall Chinook salmon broodstock collected at Priest Rapids Hatchery for the Hanford Reach and lower Yakima River programs. ..... 21
Table 21 Number of days fall Chinook salmon fry were ponded at Priest Rapids Hatchery prior release. .......................................................................................................... 21
Table 22 Mean lengths (FL, mm), weight (g and fish/pound), and coefficient of variation (CV) of fall Chinook smolts released from Priest Rapids Hatchery during broodyears 1991 – 2010. Size targets are provided in the last row of the table. .. 22
Table 23 Hatchery life-stage survival rates (%) for fall Chinook salmon at Priest Rapids Hatchery, broodyears 1989 – 2012. Survival standards for unfertilized egg to release are provided in the last row of the table. The survival standards are the mean survivals for the most recent 10 year period. .............................................. 23

© 2013, PUBLIC UTILITY DISTRICT NO. 2 OF GRANT COUNTY, WASHINGTON. ALL RIGHTS RESERVED UNDER U.S. AND FOREIGN LAW, TREATIES AND CONVENTIONS.
vii
Table 24 Number of subyearlings PIT tagged, mark and release dates, and the number of unique tags detected at the array in the Priest Rapids discharge channel. ............ 24
Table 25 ELISA test results to determine risk of bacterial kidney disease of adult female fall Chinook salmon broodstock at Priest Rapids Hatchery, broodyears 2008 – 2012....................................................................................................................... 24
Table 26 Viral inspections of fall Chinook salmon broodstock at Priest Rapids Hatchery. 25
Table 27 Juvenile fish health inspections for Priest Rapids Hatchery fall Chinook salmon................................................................................................................................ 25
Table 28 Summary of fall Chinook salmon peak redd counts for the 1948 – 2012 aerial surveys in the Hanford Reach, Columbia River. .................................................. 26
Table 29 Number of fall Chinook salmon redds counted in different reaches on the Hanford Reach area of the Columbia River during the October 2012 through November 2012 aerial redd counts. (Data provided by Mission Support Alliance – Environmental Assessment Services) ................................................................... 27
Table 30 Calculation of escapement estimates for fall Chinook salmon in the Hanford Reach, 2012........................................................................................................... 28
Table 31 Spawning escapement for fall Chinook salmon in the Hanford Reach for broodyears 1964 – 2012. ....................................................................................... 29
Table 32 Numbers and Percentages of fall Chinook salmon carcasses sampled within each survey section on the Hanford Reach. .................................................................. 31
Table 33 Number of carcass surveys conducted by section in the Hanford Reach. ............ 31
Table 34 Number of redds and carcasses, total spawning escapement, and proportion of escapement sampled for fall Chinook salmon in Sections 1 through 5 of the Hanford Reach, 2012. ........................................................................................... 31
Table 35 Numbers of natural and hatchery origin fall Chinook salmon carcasses sampled within Sections 1 through 5 of Hanford Reach based on expansions of coded-wire tag recoveries. ....................................................................................................... 33
Table 36 Origin of Chinook salmon spawning in the Hanford Reach by section based on in-sample carcass recoveries, sample rate 1:4. n= 6,814........................................... 34
Table 37 Number of fall Chinook salmon carcasses sampled within Section 6 (Priest Rapids Dam Pool). ................................................................................................ 34
Table 38 Carcasses sampled, total spawning escapement and proportion of escapement sampled for fall Chinook salmon in Section 6 (Priest Rapids Dam pool). ........... 35
Table 39 Origin of fall Chinook salmon spawning in Section 6 (Priest Rapids Dam Pool).35
Table 40 The number of fall Chinook salmon carcass surveys within Section 7 (Priest Rapids Hatchery Discharge Channel) and Section 8 (Columbia River at the confluence of the hatchery discharge channel). .................................................... 36
Table 41 Number of carcasses sampled, total spawning escapement and proportion of escapement sampled for fall Chinook salmon within Section 7 (Priest Rapids

© 2013, PUBLIC UTILITY DISTRICT NO. 2 OF GRANT COUNTY, WASHINGTON. ALL RIGHTS RESERVED UNDER U.S. AND FOREIGN LAW, TREATIES AND CONVENTIONS.
viii
Hatchery Discharge Channel) and Section 8 (Columbia River at the confluence of the hatchery discharge channel). ........................................................................... 36
Table 42 The origin of Chinook salmon carcasses recovered within Section 7 (Priest Rapids Hatchery Discharge Channel) and Section 8 (Columbia River at the confluence of the hatchery discharge channel). ........................................................................... 37
Table 43 Summary of mark recapture of post-spawn fall Chinook salmon in the Hanford Reach, 2012........................................................................................................... 38
Table 44 Summary of mark recapture of post-spawn fall Chinook salmon in the Hanford Reach, 2011........................................................................................................... 39
Table 45 The week that 10%, 50% (median), and 90% of the natural (unclipped) and hatchery (clipped) origin fall Chinook salmon passed Priest Rapids Dam, 2009 – 2012. The average week is also provided. Migration timing is based on collection of run of the river Chinook salmon collected and sampled in the Off Ladder Adult Fish Trap at Priest Rapids Dam. ........................................................................... 40
Table 46 The week that 10%, 50% (median), and 90% of the natural and hatchery origin fall Chinook salmon passed McNary Dam, 2010 – 2012. Migration timing is based on PIT tag passage of Hanford wild and Priest Rapids Hatchery in the adult fish ladder at McNary Dam................................................................................... 41
Table 47 Age compositions of natural origin and Priest Rapids Hatchery adult fall Chinook salmon sampled on spawning grounds in the Hanford Reach and at the Hatchery................................................................................................................................ 42
Table 48 Mean fork length (cm) at age (total age) of Priest Rapids Hatchery origin fall Chinook salmon sampled at Priest Rapids Hatchery and natural origin fall Chinook salmon sampled in the Hanford Reach that spawned naturally. The mean is based on a ten-year period (2002 – 2011); n = sample size and SD = 1 standard deviation. ............................................................................................................... 44
Table 49 Mean fork length (cm) at age (total age) of Priest Rapids Hatchery origin fall Chinook salmon sampled at Priest Rapids Hatchery and natural origin fall Chinook salmon sampled in the Hanford Reach that spawned naturally. n = sample size and SD = standard deviation. ............................................................ 45
Table 50 Hatchery fall Chinook salmon contributions to harvest in the Hanford Reach fall Chinook salmon fishery. Coded-wire tag recoveries from RMIS database expanded by sample rate and tag rate. .................................................................. 46
Table 51 Coded-wire tag recoveries from the RMIS database by broodyear and harvest type expanded by tag rate and sample rate. .................................................................. 46
Table 52 Estimated number and proportions of Priest Rapids Hatchery fall Chinook salmon spawning escapement to Priest Rapids Hatchery and streams within and outside of the presumptive target stream by broodyear. Coded-wire tag recoveries are expanded by mark rate and sample rate for each broodyear. ................................ 48
Table 53 Proportion of fall/summer Chinook spawning populations by return year comprised of Priest Rapids Hatchery fall Chinook from 1990 – 2006 brood releases. ................................................................................................................. 49

© 2013, PUBLIC UTILITY DISTRICT NO. 2 OF GRANT COUNTY, WASHINGTON. ALL RIGHTS RESERVED UNDER U.S. AND FOREIGN LAW, TREATIES AND CONVENTIONS.
ix
Table 54 Proportion of naturally produced Chinook salmon in the Priest Rapids Hatchery broodstock (pNOB) based on otolith marks, in-sample coded-wire tags and adipose clips. ......................................................................................................... 50
Table 55 Proportion of hatchery Chinook salmon on the spawning grounds (pHOS) in the Hanford Reach using a combination of an otolith, coded-wire tags, and adipose clip marks. ............................................................................................................. 50
Table 56 Proportionate Natural Influence (PNI) of the Hanford Reach fall Chinook salmon supplementation program based on expanded coded-wire tag recoveries of all fish surveyed and sub-sampling for otoliths marks. .................................................... 51
Table 57 Conventional and alternative calculations of pNOB and PNI for the Priest Rapids 2012 Broodstock. .................................................................................................. 52
Table 58 Broodstock collected, spawning escapement, natural and hatchery-origin recruits (NOR and HOR), and natural and hatchery replacement rates (NRR and HRR, with and without harvest) for natural origin fall Chinook salmon in the Hanford Reach..................................................................................................................... 54
Table 59 Smolt-to-adult ratios (SARs) for Priest Rapids Hatchery fall Chinook salmon. .. 55
Table 60 Smolt-to-adult ratios (SARs) for Hanford Reach natural origin fall Chinook salmon. .................................................................................................................. 55
List of Appendices A Summary of Monitoring and Evaluation of Performance Indicators .............. A-1 Appendix A
Recovery of coded-wire tags collected from Chinook salmon spawned at Priest Appendix BRapids Hatchery during return year 2012. .......................................................... B-1
Recovery of coded-wire tags collected from adult Chinook salmon surplused from Appendix CPriest Rapids Hatchery during return year 2012. ................................................ C-1
Letter from Fish Passage Center providing an update for in-river travel times for Appendix DPriest Rapids Hatchery origin subyearlings fall Chinook salmon smolts form the 2002 – 2012 releases. .......................................................................................... D-1
Juvenile fish health inspections for Priest Rapids Hatchery fall Chinook salmon. .. Appendix E.............................................................................................................................. E-1
Summary of fall Chinook salmon redd counts for the 2012 aerial surveys in the Appendix FHanford Reach, Columbia River.......................................................................... F-1
Historical numbers of Chinook salmon carcasses recovered during the annual Appendix GHanford Reach fall Chinook salmon carcass survey. ......................................... G-1
Historical proportion of hatchery and wild origin Chinook salmon estimated by Appendix Hexpanded coded-wire tag recoveries collected during fall Chinook salmon carcass surveys in the Hanford Reach. ............................................................................ H-1
Estimated escapement for fall Chinook spawning in the Priest Rapids Dam pool. .. Appendix I............................................................................................................................... I-1

© 2013, PUBLIC UTILITY DISTRICT NO. 2 OF GRANT COUNTY, WASHINGTON. ALL RIGHTS RESERVED UNDER U.S. AND FOREIGN LAW, TREATIES AND CONVENTIONS.
1
1.0 Introduction The Public Utility District No. 2 of Grant County, Washington (Grant PUD) produces and releases 5 million subyearling fall Chinook salmon from Priest Rapids Hatchery (PRH) as part of its mitigation for inundating habitat caused by the construction and operation of Priest Rapids and Wanapum Dams. The PRH is located on the east bank of the Columbia River immediately downstream of Priest Rapids Dam (Figure 1and 2). The Washington Department of Fish & Wildlife (WDFW) operates PRH which is owned, maintained, and funded by the Grant PUD. This report describes the monitoring and evaluation of Grant PUD’s PRH program.
PRH also produces and releases 1.7 million sub-yearling smolts on-site for the U.S. Army Corps of Engineers (USACE) John Day Mitigation. PRH also serves as a broodstock collection location for other hatcheries in the region. PRH provides approximately 3.7 million eyed eggs for the USACE John Day Mitigation at Ringold Springs Hatchery (RSH). These eggs are transferred to Bonneville Hatchery and ultimately about 3.5 million sub-yearling smolts are transported to, acclimated, and released from RSH. During previous years, PRH has accommodated egg takes and/or incubated eggs for the Yakama Nation (YN) upper river bright (URB) fall Chinook salmon releases in the lower Yakima River at their Prosser facility. Additional eggs have also been taken for other programs such as WDFW’s Salmon in the Classroom program and to support various research projects.
Grant PUD has developed guiding principles and approaches for the monitoring and evaluation (M&E) of all of its hatchery programs that are provided in an overarching M&E plan that encompasses all of its programs (Pearsons and Langshaw 2009). The M&E Plan for PRH is included in Section 11 and Attachment 5 of the Priest Rapids Hatchery and Genetic Management Plan (HGMP). This plan was reviewed and approved by the Priest Rapids Coordinating Committee’s (PRCC) Hatchery Subcommittee (HSC).
Figure 1 Location of Priest Rapids and Ringold Springs hatcheries and the Hanford Reach.

© 2013, PUBLIC UTILITY DISTRICT NO. 2 OF GRANT COUNTY, WASHINGTON. ALL RIGHTS RESERVED UNDER U.S. AND FOREIGN LAW, TREATIES AND CONVENTIONS.
2
Figure 2 Priest Rapids Hatchery facility and Priest Rapids Dam OLAFT. This report of the Grant PUD Priest Rapids Hatchery M&E program encompasses data collected during fiscal year (FY) 2012 - 13 as well as earlier years where data were available. The data presented in this report are preliminary and subject to change as new data and analyses become available. Please consult the most recent annual report in order to obtain the most current and accurate information. Objectives, hypotheses, measured and derived variables, and field methods that will be used to collect data are listed in Appendix A of this report.
2.0 Objectives The objective of the PRH M&E plan is to evaluate the performance of the PRH program relative to the goals and objectives of the PRH program. The overarching goal of the PRH program is to meet Grant PUDs hatchery mitigation by producing fish for harvest while keeping genetic and ecological impacts within acceptable limits.
• Objective 1: Determine if the Priest Rapids Hatchery program has affected abundance and productivity of the Hanford Reach Population.
• Objective 2: Determine if the run timing, spawn timing, and spawning distribution of both the natural and Priest Rapids Hatchery components of the Hanford Reach population are similar.
• Objective 3: Determine if genetic diversity, population structure, and effective population size have changed in natural spawning populations as a result of the Priest Rapids Hatchery program. Additionally, determine if Priest Rapids Hatchery programs have caused changes in phenotypic characteristics of the Hanford Reach population.
• Objective 4: Determine if the Priest Rapids Hatchery adult-to-adult survival (i.e., hatchery replacement rate) is greater than the Hanford Reach adult-to-adult survival (i.e.,

© 2013, PUBLIC UTILITY DISTRICT NO. 2 OF GRANT COUNTY, WASHINGTON. ALL RIGHTS RESERVED UNDER U.S. AND FOREIGN LAW, TREATIES AND CONVENTIONS.
3
natural replacement rate) and equal to or greater than the program specific hatchery replacement rate (HRR) expected value based on survival rates listed in the BAMP (1998).
• Objective 5: Determine if the stray rate of Priest Rapids Hatchery fish is below the acceptable levels to maintain genetic variation between stocks.
• Objective 6: Determine if Priest Rapids Hatchery fish were released at the programmed size and number.
• Objective 7: Determine if harvest opportunities have been provided using Priest Rapids Hatchery returning adults.
• Objective 8: Determine if the Priest Rapids Hatchery has increased pathogen type and/or prevalence in the Hanford Reach population.
• Objective 9: Determine if ecological interactions attributed to Priest Rapids Hatchery fish affect the distribution, abundance, and/or size of non-target taxa of concern that were deemed to be at sufficient risk.
3.0 Current Operation of Priest Rapids Hatchery In 2012, 28,039 adult fall Chinook salmon returned to PRH (Table 1). The 2012 broodstock for PRH were collected at the hatchery volunteer trap, the Priest Rapids Dam Off Ladder Adult Fish Trap (OLAFT), and from the angler broodstock collection (ABC) fishery. The majority of the broodstock were collected from the PRH volunteer trap. The volunteer trap was operated from September 4 through December 3, 2012.
Table 1 Source and disposition of Chinook salmon collected for broodstock at Priest Rapids Hatchery, return year 2012.
Collection Location Gender Collected
Trap Surplused
Trap Mortalities Ponded Spawned
Pond Surplused
Pond Mortalities
Volunteer Trap
Males 13,163 11,005 138 2,020 1,355 185 480
Females 5,724 534 124 5,066 3,052 148 1,866
Jacks 9,152 9,093 56 3 1 0 2
Total 28,039 20,632 318 7,089 4,408 333 2,348
OLAFT
Males 321 0 0 321 293 28 0
Females 149 0 0 149 146 0 3
Jacks 50 0 0 50 32 0 18
Total 520 0 0 520 471 28 21
ABC Fishery
Males 41 0 0 41 40 0 1
Females 26 0 0 26 26 0 0
Jacks 1 0 0 1 1 0 0
Total 68 0 0 68 67 0 1
Facility Total 28,627 20,632 318 7,677 4,946 361 2,370
The PRH staff removed fish from the volunteer trap two to five days per week as needed to collect broodstock and surplus excess fish. Male fall Chinook salmon, both adult and jack,

© 2013, PUBLIC UTILITY DISTRICT NO. 2 OF GRANT COUNTY, WASHINGTON. ALL RIGHTS RESERVED UNDER U.S. AND FOREIGN LAW, TREATIES AND CONVENTIONS.
4
typically comprise the majority of the fish surplused at the trap. The first and last trapping days occurred on September 9 and December 3, respectively. Daily detections of PIT tagged adult Chinook salmon passing the array in the PRH discharge channel suggest that returns to the volunteer trap peaked around October 16 (Figure 3). These dates coincided with peak collection days at the volunteer trap.
Figure 3 Daily detections of unique PIT tagged adult Chinook salmon which last
known detection was at the PIT tag array located in the Priest Rapids Hatchery discharge channel, 2012.
The egg take goal for PRH is 11,819,000. The egg take of 13,583,159 eggs for the 2012 brood exceeded the goal by 1,764,159 eggs. Spawning (egg takes) at PRH occurred on eight days between October 22 and December 3, 2012. During the first spawn day, the eggs from a single female were stripped into a five gallon bucket and then the sperm from a single male were mixed with the eggs. Fertilized eggs are then transferred to an incubation room and placed in vertical incubation trays. The mating ratio changed to two females and one male for subsequent spawn days.
Eight batches of fry were moved from the vertical trays in the incubation building to outdoor vinyl raceways between January 23 and March 16. The fry are reared for approximately two weeks in the vinyl raceways so that they can be trained to feed and then transferred into the larger concrete ponds. All the fry are typically moved to the concrete holding ponds by early April. During the second to third week of June the sub-yearlings are released, one pond at a time, starting with the most downstream pond. These fish migrate down a one mile long channel
0
5
10
15
20
25
30
35
40
45
50
Num
ber
of P
IT D
etec
tions
Daily Dectections n=1,170

© 2013, PUBLIC UTILITY DISTRICT NO. 2 OF GRANT COUNTY, WASHINGTON. ALL RIGHTS RESERVED UNDER U.S. AND FOREIGN LAW, TREATIES AND CONVENTIONS.
5
(formerly the spawning channel) and then down the hatchery discharge channel and into the Columbia River.
4.0 Tagging and Marking Roughly 6.7 million fall Chinook salmon are released annually from PRH of which 1.7 million are produced for the USACE mitigation obligations for the installation and operation of John Day Dam. Various mark types and rates have occurred at PRH over the years for both the Grant PUD and USACE mitigation fish (Table 2).
In 1977, PRH began adipose fin clipping and coded-wire tagging a portion of the juvenile fall Chinook released to determine PRH contributions to ocean and river fisheries. All broods of the John Day mitigation fish fall Chinook salmon released in 2007, 2009, 2010, 2011, and 2012 from PRH for the USACE were adipose clipped. Poor returns for broodyear 2007 precluded the production of USACE’s John Day mitigation fish for the 2008 release.
Beginning with the 1993 broodyear, PRH began PIT (Passive Integrated Transponder) tagging a small portion of the release for the purpose of evaluating migration timing at mainstem dams. The USACE production at PRH does not have a coded-wire tag or PIT tagged group specific to this mitigation program.
During later winter of 2012, a PIT tag detection array was installed in the PRH discharge channel. Prior to 2012, PIT tagged Chinook salmon released from PRH could only be detected at the mainstem hydroelectric facilities (fish ladders and juvenile bypasses) or by manually scanning individual fish. The number of fish PIT tagged at PRH was substantially increased in 2012 to be able to evaluate survival and straying. Approximately 43,000 of the 6.7 million fall Chinook salmon released in both 2012 and 2013 were PIT tagged.
All PRH releases for both mitigation programs were 100% otolith marked beginning with the 2008 release. All annual releases from PRH have the same annual otolith pattern, but the pattern differs between years. Beginning with broodyear 2010, the fry transferred from PRH to Ringold Spring Hatchery have received a unique otolith mark. Otolith sampling at the hatchery and in the Hanford Reach provides increased precision in the determination of PRH origin returns to the hatchery and to estimate PRH origin fall Chinook contributions to the terminal sport fishery and the naturally spawning population of the Hanford Reach.
Since 1987, the U.S. Section of the Pacific Salmon Commission (PSC) has supported a coordinated project which seeks to capture and coded-wire tag 200,000 naturally produced juvenile fall Chinook salmon in the Hanford Reach. Fish are collected with seines over a ten day period between late May and early June. Fish are approximately 40-80 mm long at the time of capture. Recoveries from these tagged fish are used to estimate exploitation rates and interception rates for Hanford Reach natural origin fall Chinook salmon. These data have also been used to determine natural origin contributions to hatchery broodstock and more recently to estimate the number of natural origin juveniles produced in the Hanford Reach (Harnish et al. 2012).

© 2013, PUBLIC UTILITY DISTRICT NO. 2 OF GRANT COUNTY, WASHINGTON. ALL RIGHTS RESERVED UNDER U.S. AND FOREIGN LAW, TREATIES AND CONVENTIONS.
6
Table 2 Numbers of marked and unmarked fall Chinook salmon smolts released from Priest Rapids Hatchery.
Broodyear Total
Released Non Ad-Clip
Released AD/CWT CWT Only AD Only Otolith Marked PIT
1979 2,383,690 2,272,862 110,828 1980 4,832,591 4,581,054 251,537 1981 5,509,241 5,198,365 310,876 1982 10,296,70 9,888,989 407,711 1983 9,742,700 9,517,263 222,055 3,382 1984 6,363,000 6,253,240 106,960 2,800 1985 6,048,000 5,843,176 203,534 1,290 1986 7,709,000 7,506,142 201,843 1,015 1987 7,709,000 7,501,578 196,221 11,201 1988 5,404,550 5,200,080 201,608 2,862 1989 6,431,100 6,224,770 194,530 11,800 1990 5,333,500 5,134,031 199,469 1991 7,000,100 6,798,453 201,647 1992 7,134,159 6,939,537 194,622 1993 6,705,836 6,520,153 185,683 1994 6,702,000 6,526,120 175,880 6,702,000 1,500 1995 6,700,000 6,503,811 196,189 6,700,000 3,000 1996 6,644,100 6,450,885 193,215 3,000 1997 6,737,600 6,541,351 196,249 3,000 1998 6,504,800 6,311,140 193,660 3,000 1999 6,856,000 6,651,664 204,336 3,000 2000 6,862,550 6,661,771 200,779 3,000 2001 6,779,035 6,559,109 219,926 3,000 2002 6,777,605 6,422,232 355,373 3,000 2003 6,814,560 6,415,444 399,116 3,000 2004 6,599,838 6,399,766 200,072 3,000 2005 6,876,290 6,676,845 199,445 3,000 2006 6,743,101 4,912,487 202,000 1,628,614 3,000 2007 4,548,306 4,345,738 202,568 813 4,548,306 3,000 2008 6,788,314 4,850,844 218,082 1,719,388 6,788,314 2,994 2009 6,776,651 4,438,953 605,000 1,026,605 1,696,451 6,776,651 1,995 2010 6,798,390 4,476,184 605,000 1,110,000 1,717,206 6,798,390 3,000 2011 7,056,948 3,651,655 605,293 605,295 2,785,701 7,056,948 42,844 2012 6,822,361 3,471,236 606,020 606,020 2,745,105 6,823,361 44,083
10yr (03-12) mean 6,582,476 4,963,915 384,260 836,980 2,048,744 6,465,328 10,992
WDFW operates the OLAFT at Priest Rapids Dam three days per week beginning in July and continuing through mid to late October. This project began in 1986 and was designed to sample steelhead to (1) determine upriver population size, (2) estimate hatchery to natural (wild) fish ratios, (3) determine age class distribution, and (4) evaluate the need for managing returning hatchery steelhead consistent with ESA recovery objectives. In 2009, WDFW began sampling fall Chinook salmon at the trap for run composition assessment. A study was initiated in 2010 to determine the efficacy of using the OLAFT to increase natural origin broodstock for the Priest Rapids Hatchery. In 2010, 2011, and 2012, adipose fin present and coded-wire tag (CWT) absent adult fall Chinook salmon were PIT tagged and released at the OLAFT to assess migration and spawning distribution. In addition, the OLAFT was used to collect potential natural origin fall

© 2013, PUBLIC UTILITY DISTRICT NO. 2 OF GRANT COUNTY, WASHINGTON. ALL RIGHTS RESERVED UNDER U.S. AND FOREIGN LAW, TREATIES AND CONVENTIONS.
7
Chinook salmon for incorporation into the broodstock at PRH. This work is presented in Tonseth et al. (in preparation).
5.0 Life History – Hanford Reach Fall Chinook Salmon The fall Chinook salmon population that spawns in the Hanford Reach is one of the largest and most productive in the United States (Harnish et al. 2012). The Hanford Reach is one of the last non-impounded reaches of the Columbia River. The Hanford Reach extends 51 miles from the city of Richland to the base of Priest Rapids Dam. Natural origin fall Chinook salmon emerge from the substrate in the spring and rear in the Hanford Reach until migration in the summer. Egg-to-fry survival has been estimated to be about 71% in the Hanford Reach (Oldenburg et al. 2012) and egg-to-presmolt has been estimated to be about 40.2% (Harnish et al. 2012). Both of these estimates are high when compared to other Chinook salmon populations (Harnish et al. 2012). Fall Chinook salmon interact with a variety of species in the Hanford Reach (Naiman et al. 2012). The age at maturity for naturally produced fish in the Hanford Reach varies between 2 and 6 years. The age of fish reported in this document begins with a birthday of the year that the parents spawned. The abundance of minijacks which mature at age-1 males is currently not known. Jacks, which are age-2 males, return to the Hanford Reach after spending roughly one year in the ocean. The majority of the natural origin adults return after having spent three to four years in the ocean (age-4 and 5). A small portion, typically less than 2%, will spend up to five years in the ocean and return as age-6.
6.0 Project Coordination WDFW M&E staff dedicated to PRH worked in conjunction with PRH fish culture staff, the Columbia River Coded Wire Tag Recovery Program (CRCWTP), Region 3 Fish Management, the WDFW District 4 Fish Biologist, Upper Columbia River Steelhead Monitoring and Evaluation Team, and the Grant PUD biological science staff to complete all tasks included in the M&E Plan. In addition, samples collected at the hatchery and in the field were transported and analyzed by WDFW laboratories including the WDFW Scale Reading Lab and WDFW Genetics Lab, and the WDFW Otolith Lab. Coded-wire tags are processed at the WDFW District 4 office. Data and analysis collected in association with the PRH M&E and Hanford Reach population monitoring is incorporated into the Columbia River upper river brights (URB) fall Chinook salmon database for use in forecasting and managing fall Chinook salmon populations in the Columbia and Snake rivers and tributaries. WDFW secured and held all environmental permits necessary for the work.
7.0 Sample Size Considerations We attempted to strike an appropriate balance between technical rigor, logistics, and financial investment when setting sample size targets. We used a phased approach to collect samples with sufficient accuracy and precision. In general, we attempted to oversample the raw samples such as carcasses and trap recoveries and then use post season analysis to determine if sub-sampling was necessary. The sample size target of systematic field sampling is 10% of carcasses in the Hanford Reach, 10% at the hatchery trap, and 25% of the broodstock.
Representative sample of otoliths by survey type were selected for processing to estimate origin by age class (Table 3). In most cases all otolith samples for a survey were processed if the sampling rate provided relatively low numbers of otolith sample or if there was a desire for higher accuracy. Subsamples of otoliths collected from the PRH volunteer trap and PRH broodstock were submitted for processing. The sizes of the otolith subsamples were determined for otolith analysis after the ages of the fish were determined by scale aging. After determining

© 2013, PUBLIC UTILITY DISTRICT NO. 2 OF GRANT COUNTY, WASHINGTON. ALL RIGHTS RESERVED UNDER U.S. AND FOREIGN LAW, TREATIES AND CONVENTIONS.
8
the ages of the fish sampled, subsample sizes were apportioned by age based on number of samples collected and the relationship between subsample size and deviation of the subsample size from the cumulative estimate of a variable.
Table 3 Percentage of population sampled by survey and otoliths processed, Broodyear 2012.
Hatchery Surveys Stream Surveys
PRH Trap
PRH Pond Mortality
PRH Pond
Surplus PRH
Spawn OLAFT spawn
ABC spawn
HR Sport Fishery
HR Stream
Priest Pool
Hatchery Discharge Channel
Population 20,950 2,348 333 4,408 520 68 18,854 57,631 72 207
Sampled 2,024 224 31 1,095 520 68 3,615 6,810 72 207
Population Sampled 9.7% 9.5% 9.3% 24.8% 100.0% 100.0% 19.2% 11.8% 100.0% 100.0%
Otolith (n=) 1,707 188 27 986 501 65 476 1,590 63 42
Otoliths Submitted 611 0 0 704 501 65 476 1,590 63 42
Population Submitted 2.9% 0.0% 0.0% 16.0% 96% 96% 2.5% 2.8% 87.5% 20.3%
8.0 Evaluation of Bias There are at least two sources of bias that we attempted to evaluate during 2012. First was the bias associated with estimates generated using coded-wire tags. The second type of bias that was evaluated during 2012 was size and gender bias during carcass recovery.
Results from sampling the fall Chinook returns for 2010, 2011, and 2012 indicated that estimates of hatchery contributions to broodstock, the terminal sport fishery, and to escapement of the Hanford Reach calculated from otoliths were substantially different from estimates generated using coded-wire tags. It is likely that the estimates produced from the otoliths are unbiased (Hoffarth and Pearsons 2012).
This was of significant concern because many estimates such as stray rate, survival, origin, and harvest are dependent upon estimates generated from coded-wire tags. To assess the level of coded-wire tag recovery bias, comparisons of the proportion of PRH origin coded-wire tag returns to the coded-wire mark rate for individual ages by broodyear were made using the following equation:
CWT Recovery Bias = # of PRH Origin CWT
Fish Recovered / # of PRH Origin Fish Collected
CWT Mark Rate for Broodyear
Where as:
# of PRH origin fish collected = Estimate of the number of PRH origin fish for a specific age/broodyear as determined by otoliths, scale aging, and expansion of age samples
# of PRH Origin CWT Fish Recovered = Number of PRH origin CWT fish for a specific age/brood recovered at the hatchery (100% sample)
CWT Mark Rate = CWT marking rate for the specific broodyear.

© 2013, PUBLIC UTILITY DISTRICT NO. 2 OF GRANT COUNTY, WASHINGTON. ALL RIGHTS RESERVED UNDER U.S. AND FOREIGN LAW, TREATIES AND CONVENTIONS.
9
If a coded-wire tag bias did not exist, the proportion of PRH coded-wire tag returns to the PRH coded-wire tag mark rate should equal 1. As shown in Table 4, the estimated bias ranged from 0.57 to 1.16 for the different age/broods examined.
Table 4 Estimate of coded-wire tags bias for Priest Rapids origin returns to the hatchery.
Brood Age
Proportion CWT
Marked
# of PRH Origin CWT Fish Recovered
Estimated # of PRH
origin Fish Collected
Proportion of PRH Origin
Brood Return CWT
Proportion of PRH CWT Returns to the
PRH CWT Mark Rate (CWT Recovery Bias)
2007 5 0.0445 48 928 0.052 1.16 2007 4 0.0445 280 10,977 0.026 0.57 2007 3 0.0445 410 14,078 0.029 0.65 2007 2 No otolith data collected during return year 2009 2008 4 0.0318 81 2,982 0.027 0.85 2008 3 0.0318 127 5,606 0.023 0.71 2008 2 0.0318 57 2,578 0.022 0.69 2009 3 0.2429 2,309 13,545 0.170 0.70 2009 2 0.2429 628 3,082 0.204 0.84 2010 2 0.2371 1,497 8,896 0.168 0.71
It is unclear whether coded-wire tag estimates are biased because of 1) tag loss, 2) less than 100% detection of tags when scanned, 3) inappropriate expansion estimates, 4) differential survival or homing of tagged fish, or 5) incorrect estimates of the total number of fish released from PRH. In addition, the precision of coded-wire tag estimates for some broodyears is likely influenced by the low number of CWT recoveries.
Preliminary assessment of coded-wire tag wand detection efficiency was conducted at PRH during the 2010, 2011, and 2012 returns. During 2012, M&E staff randomly selected 110 adipose clipped fall Chinook salmon that were not coded-wire tagged as determine by scanning them with a coded-wire tag wand during routine sampling of fish from the PRH volunteer trap. The snouts were removed from each fish to increase the likelihood of detection and then passed through a V-detector.
Similar to test results for previous years, there was no additional coded-wire tag detections observed from the 110 fish sampled. Similar results were observed in 2010 and 2011 with fifty fish samples for each year.
In general, carcasses of smaller female and male fish are recovered at lower rates than older, larger, female fish (Murdoch et al. 2010). This can result in underestimates of smaller male fish and overestimates of larger female fish. This is particularly a problem when comparing samples collected at the PRH trap with samples collected in the Hanford Reach. Samples collected at the trap are more likely to represent the population in terms of size and age structure than carcasses collected in the Hanford Reach. Differences between samples could be the result of true biological differences or because of bias. We attempted to evaluate carcass recovery bias in the Hanford Reach, and the results of this evaluation are presented in section 5.0.
9.0 Origin of Adult Returns to Priest Rapids Hatchery There were three sources for collection of adult Chinook salmon broodstock for PRH during the 2012 return: PRH volunteer trap, OLAFT, and angler broodstock collection fishery (ABC). The

© 2013, PUBLIC UTILITY DISTRICT NO. 2 OF GRANT COUNTY, WASHINGTON. ALL RIGHTS RESERVED UNDER U.S. AND FOREIGN LAW, TREATIES AND CONVENTIONS.
10
origin of fish collected at these locations was determined by examination of otoliths for the presence of a thermal mark unique to PRH. The otolith samples that did not possess a PRH thermal mark were classified as unknown. The very low recovery (<1%) of coded-wire tagged strays at PRH suggests that a high percentage of the unknown fish are of natural origin (See Section 1.9). Thus, in some sections of the report, we make a simplifying assumption that fish without a thermal mark are of natural origin. Similar to that observed in previous years, there is a large discrepancy between estimates of origin based on coded-wire tag and otoliths. Origin based on otolith sampling provides the most accurate data under the current marking regime at PRH. According to Jeff Grimm, WDFW Otolith Lab (personal communication, July 15, 2013) the error rate associated with determination of origin by otoliths is very low. Each otolith is independently read by two experienced lab staff. Upon completion of the second read, any discrepancies are read a third time to resolve the conflict. If the marks are poor quality, three staff independently read the otoliths. PRH staff does a fantastic job at creating the marks. They are high quality so require only two readers. Most discrepancies are clerical in nature (data entry). Discrepancies associated with the data for the Hanford fish were clerical and easy to resolve.
We present estimates based on CWT and otoliths to illustrate differences in the estimates as well as the potential for creating a correction to the historical database that was generated using CWTs.
All Chinook collected or transported to PRH regardless of source were sampled for the presence of a coded-wire tag. Broodstock collected at the OLAFT and angler broodstock collection (ABC) fishery were sampled for otoliths, scales (aging), gender, and length in addition to scanning for CWTs. All otolith samples for both groups were submitted to the WDFW Otolith Lab for examination to determine origin. Broodstock originating from the PRH volunteer trap were sampled at a rate of 1:4 for otoliths, scales (aging), gender, and length. Fish mortalities and surplus at the PRH volunteer trap and holding ponds were sampled at a 1:10 rate for otoliths, scales (aging), gender, and length.
Current sample rates at PRH are in excess of need to accurately assess origin of the returns to the hatchery. The number of samples submitted to the otolith lab is reduced based on the number of samples needed by age. Post spawn, the otoliths for broodstock were sub-sampled at a rate of 2:3. The fish mortalities and surplus from the volunteer trap and ponds were sub sampled for otoliths at a rate of 1:3, but only the samples collected for the volunteer trap were sent to the WDFW Otolith Lab for examination of origin. The origin of the PRH volunteer returns were estimated based on the results of the otolith sub sample. Otoliths from fish that died in the ponds and for fish in excess to spawning need were not examined for origin. These fish were assumed to be represented by fish of the same age collected at the trap. Therefore we assumed that hatchery and natural origin fish had similar mortality rates.
9.1 Origin Based on Otolith Recoveries The proportion of PRH origin and natural origin adult returns to the PRH volunteer trap was estimated by combining the expanded samples for broodstock and fish surplused from the volunteer trap. The origin for all fish ponded for broodstock was assigned using the proportion of origin by age for the broodstock. The age composition for the ponded mortalities and surplus fish and the broodstock is similar.

© 2013, PUBLIC UTILITY DISTRICT NO. 2 OF GRANT COUNTY, WASHINGTON. ALL RIGHTS RESERVED UNDER U.S. AND FOREIGN LAW, TREATIES AND CONVENTIONS.
11
The origin of fall Chinook salmon ponded and surplused from the volunteer trap were very similar, both were roughly 94% PRH origin and 6% Natural (Table 5). The percentage of PRH origin fish collected at the OLAFT and ABC fishery was 44% and 9%, respectively.
Table 5 Numbers of hatchery and natural origin Chinook salmon collected at Priest Rapids Hatchery, Priest Rapids Dam Off Ladder Adult Fish Trap, and angler broodstock collection fishery. Origin determined by otolith thermal marks specific to Priest Rapids Hatchery, the presence of coded-wire tags, or adipose clips.
Brood Priest Rapids Hatchery Ponded
Volunteer Returns 1 Percent Origin
Hatchery Origin Natural Origin 2 2012 7,677 n = 651 93.6 6.4
Brood Priest Rapids Hatchery Surplused
from Trap 3 Percent Origin
Hatchery Origin Natural Origin 2 2012 20,950 n = 557 94.4 5.6
Brood
Priest Rapids Hatchery Volunteer Return Total
Percent Origin Hatchery Origin Natural Origin 2
2012 28,627 94.2 5.8
Brood
Priest Rapids Off Ladder Fish Trap Collection
Percent Origin Hatchery Origin Natural Origin 2
2012 520 n = 500 43.8 56.2
Brood Angler Broodstock Collection
Fishery Percent Origin
Hatchery Origin Natural Origin 2 2012 68 n = 65 9.2 90.7
1 Includes PRH volunteer ponded returns that were either spawned, surplused or mortalities. 2 Origin based on the absence of otolith marks, coded-wire tags, or adipose clips.
9.2 Origin Based on Coded-Wire Tag Recoveries All Chinook salmon returning to PRH, and broodstock collected from the OLAFT and ABC fishery were sampled for the presence of coded-wire tags. No coded-wire tags were recovered from fish collected at the OLAFT and ABC fishery. This was because efforts were made to exclude coded-wire tagged fish from the collections. The lack of coded-wire tag detections in these collections also supports the earlier finding that coded-wire tag detections in the field appear to be accurate.
A total of 4,015 coded-wire tags were collected at PRH in 2012 of which 583 coded-wire tags were collected from the broodstock (Appendix B and Appendix C). Similar to previous years, expansions of coded-wire tag recoveries at PRH in 2012 accounted for 69% of the volunteer returns to the hatchery (Table 6). Assuming that these coded-wire tag expansion accurately reflect the proportion of hatchery origin fall Chinook salmon to PRH, 69% of the Chinook salmon in were hatchery origin leaving 31% of the origin unknown and potentially natural origin. PRH origin tags accounted for 98% of the hatchery origin tags recovered which is similar to historic coded-wire tag recovery rates.
Historically, roughly 70% of the fall Chinook salmon returning to PRH were hatchery origin based on coded-wire tag expansions (Hoffarth and Pearsons, 2012). However, this estimate of PRH origin fish based on coded-wire tags has averaged 58% from return year 2005 to 2012.
There were three natural origin Hanford Reach fall Chinook salmon coded-wire tags recovered at the hatchery in 2012. These fish were surplused from the volunteer trap. There is not an

© 2013, PUBLIC UTILITY DISTRICT NO. 2 OF GRANT COUNTY, WASHINGTON. ALL RIGHTS RESERVED UNDER U.S. AND FOREIGN LAW, TREATIES AND CONVENTIONS.
12
expansion factor for the natural origin coded-wire tag fish so there was no attempt to estimate the proportion of natural origin fish based on these three coded-wire tag recoveries.
In an effort to increase natural origin broodstock in return years 2011 and 2012, the majority of the adipose clipped Chinook salmon returning to the PRH trap were surplused. In 2012, this method of surplusing adipose clipped fish removed 86% of the coded-wire fish from the broodstock.
Table 6 Estimated proportion of hatchery and natural origin adult Chinook salmon returning to the Priest Rapids Hatchery volunteer trap based on coded-wire tag expansion. The entire collection was sampled for coded-wire tag.
Brood
Returns to Priest Rapids Hatchery Volunteer Trap
Origin based on Coded-Wire Tag expansions
Natural Origin 1 Priest Rapids Hatchery Other Hatchery 2005 10,616 0.622 0.006 0.329 2006 8,223 0.490 0.006 0.436 2007 6,000 0.671 0.004 0.525 2008 19,586 0.491 0.008 0.409 2009 12,778 0.428 0.003 0.540 2010 19,169 0.602 0.003 0.486 2011 20,823 0.613 0.006 0.381 2012 28,039 0.692 0.004 0.304 Mean 15,654 0.576 0.005 0.427
1 The proportion not accounted for by coded-wire tag expansion is assumed to be of natural origin.
10.0 Broodstock Collection and Sampling The fish collected from the OLAFT and ABC fishery were placed in separate ponds from the fish collected at the PRH volunteer trap to allow separate data collection and analysis of each group. Only a portion of the fall Chinook salmon released from PRH are externally marked (adipose clipped) to identify them as hatchery origin Chinook salmon. The determination of origin is reliant on a combination of coded-wire tags recoveries, otolith marks, and adipose clips. In 2012, the adult returns for age-2, 3, 4 and 5 fish were otolith marked. This allowed for two methods for estimating the origin of PRH broodstock: Coded-wire expansions and otolith sampling.
The broodstock collected at the PRH volunteer trap were systematically sampled at a 1:4 rate for otoliths, scales (aging), gender, and length. Post spawn, the otoliths for this group were randomly sub sampled for otoliths at a 2:3 rate and sent to the WDFW Otolith Lab for examination of origin. The origin of the PRH volunteer broodstock was estimated based on the results of the otolith sub sample. All broodstock were sampled for the presence of coded-wire tag. The coded-wire tag recoveries were categorized as in-sample and out-of-sample fish to facilitate the analysis of biological data associated with the in-sample coded-wire tag recoveries. All the broodstock collected at the OLAFT and ABC fishery were sampled for otoliths, scales (aging), gender, and length. The otolith samples for both groups were submitted to the WDFW Otolith Lab for examination to determine origin.
10.1 Origin of Broodstock In an effort to increase natural origin broodstock in 2012, the majority of the adipose clipped Chinook salmon returning to the PRH trap were surplused. This method of surplusing adipose clipped fish removed 85.5% of the coded-wire tagged Chinook salmon from the broodstock; potentially reducing the ability to discern hatchery origin contributions to the broodstock via coded-wire tag analysis. Assuming that the fish ponded for broodstock were similar in origin as

© 2013, PUBLIC UTILITY DISTRICT NO. 2 OF GRANT COUNTY, WASHINGTON. ALL RIGHTS RESERVED UNDER U.S. AND FOREIGN LAW, TREATIES AND CONVENTIONS.
13
the entire PRH volunteer collection, all coded-wire tag returns were used for the determination of origin of the broodstock. This estimate of origin also makes the assumption that all fish that could not be identified to origin by coded-wire tags at PRH are of natural origin. Beginning in return year 2010, the examination of otolith marks from spawned fish was also used to determine origin. For this comparison, the assumption is made that fish not possessing an otolith mark, adipose clip, or coded-wire tag are natural origin fish. Chinook salmon in the broodstock subsample that did not possess an otolith mark but were marked with an adipose clip and/or coded-wire tag were classified as strays from other hatcheries.
In the otolith subsample for PRH volunteer broodstock, there were three non-otolith marked fish that were also adipose clipped, roughly 0.46% of the subsample. When expanded to the total broodstock, it is estimated that there were 20 non-otolith marked/adipose clipped fish in the broodstock that should be classified as fish from other hatcheries.
An estimated 30.4% of the broodstock originating from the volunteer trap was comprised of natural origin fish based on coded-wire tag recoveries. An estimated 12.0% of the broodstock originating from the volunteer trap was comprised of natural origin fish based on otolith marks (Table 7).
Table 7 Proportion of hatchery and natural origin Chinook salmon spawned at Priest Rapids Hatchery.
Brood Broodstock Spawned
Origin based on CWT expansions Origin Based on Otolith Mark
PRH Other Hatchery Natural Origin 1 Other Hatchery PRH Natural
Origin 2 2005 5,288 0.622 0.006 0.372 N/A N/A 2006 5,099 0.490 0.006 0.504 N/A N/A 2007 2,096 0.671 0.004 0.325 N/A N/A 2008 4,897 0.491 0.008 0.501 N/A N/A 2009 4,389 0.428 0.003 0.569 N/A N/A 2010 5,256 0.602 0.003 0.395 0.957 0.043 3 2011 5,444 0.613 0.006 0.381 0.966 0.034 4 2012 4,974 0.692 0.004 0.304 0.0045 0.882 0.119
1 Natural origin estimated from the remaining fish not accounted for by expansions of CWT recoveries 2 Natural origin estimated from the remaining fish not accounted for by otolith marks 3 PRH origin determined based on otolith sub sampling of age-2 and 3 Chinook salmon in the broodstock. 4 PRH origin determined based on otolith sub sampling of age-2, 3, and 4 Chinook salmon in the broodstock. 5 Other hatchery fish based on otolith subsample that were adipose clipped fish without an otolith mark.
10.2 Influence of Additional Otolith Samples on Origin To reduce labor costs, otoliths collected for both the Chinook salmon surplused and spawned were sub sampled prior to submission to the WDFW Otolith Lab for examination. The otoliths collected from fish surplused from the volunteer trap were submitted at a rate of 1:3. The otoliths collected from the spawned fish were submitted at a rate of 2:3. The age composition of fall Chinook salmon surplused from the volunteer trap was largely comprised of age-2 and 3 fish and the fish spawned were primarily age-3 and 4. There were relatively low numbers of otolith samples of age-4 and 5 for fish surplused from the volunteer trap as well as for the age-5 fish spawned. To improve the accuracy of the determination of origin by age for the fish surplused from the volunteer trap as well as for the fish spawned, the remaining otolith samples collected for age-4 and 5 fish were submitted for analysis. A comparison was completed to determine the effect of the additional otoliths on the age composition.

© 2013, PUBLIC UTILITY DISTRICT NO. 2 OF GRANT COUNTY, WASHINGTON. ALL RIGHTS RESERVED UNDER U.S. AND FOREIGN LAW, TREATIES AND CONVENTIONS.
14
For the fish surplused from the volunteer trap, the addition of age-4 and 5 otolith samples reduced the estimated proportion of PRH origin age-4 fish from 100% to 87%. The estimated proportion of PRH origin age-5 fish did not change (Table 8).
Table 8 Proportion of Priest Rapids Hatchery origin by age of fall Chinook salmon surpluses from the Priest Rapids Hatchery volunteer trap based on otolith marks, broodyear 2012.
Sample
PRH Origin Otoliths Non PRH Origin Otoliths Proportion PRH Origin
Age-2 Age-3 Age-4 Age-5 Age-2 Age-3 Age-4 Age-5 Age-2 Age-3 Age-4 Age-5 n1 242 275 8 1 7 24 0 0 0.972 0.920 1.000 1.000
n+2 0 0 37 3 0 0 7 0 N/A N/A 0.841 1.00 Total 242 275 45 4 7 24 7 0 0.972 0.920 0.865 1.000
1 includes subsample (1:3) of otoliths taken from broodstock. 2 Includes remaining otolith samples taken from broodstock to improve the accuracy of the determination of origin by age.
N/A = No additional samples submitted.
For the fish the spawned at PRH, the addition of the age-4 and 5 otolith samples reduced the estimated proportion of PRH origin age-5 fish from roughly 95% to 93%. The estimated proportion of PRH origin age-4 fish did not change (Table 9).
Table 9 Proportion of Priest Rapids Hatchery origin of fall Chinook salmon spawned at Priest Rapids Hatchery based on otolith marks, broodyear 2012.
Sample
PRH Origin Otoliths Non PRH Origin Otoliths Proportion PRH Origin
Age-2 Age-3 Age-4 Age-5 Age-2 Age-3 Age-4 Age-5 Age-2 Age-3 Age-4 Age-5 n1 0 265 253 91 0 12 25 5 0.000 0.957 0.910 0.948
n+2 0 0 0 41 0 0 0 5 N/A N/A N/A 0.891 Total 0 265 253 132 0 12 25 10 0.000 0.957 0.910 0.930
1 includes subsample (2:3 rate) of otoliths taken from broodstock. 2 Includes remaining otolith samples taken from broodstock to improve the accuracy of the determination of origin by age.
N/A = No additional samples submitted.
10.3 Broodstock Age Composition Natural origin fall Chinook salmon were identified through systematic otolith sampling of the broodstock in 2012. The 2012 return was the first year that age composition for natural origin broodstock could be assessed with otoliths for the majority of the return (ages 2 - 5). Only one age-6 Chinook salmon, recovered from OLAFT, was sampled in the broodstock. Historically, attempts to use coded-wire tag recoveries to identify natural origin fall Chinook salmon in the broodstock proved inadequate. Coded-wire tag recoveries are too few to provide an accurate age composition or length frequency distribution. During the most recent seven years, natural origin fall Chinook salmon in the PRH broodstock have only been detected by coded-wire recoveries during one year, 2007. Sampling data for PRH prior to 2005 is not segregated between those Chinook salmon used for surplused and those fish ponded for broodstock. Additional inquires for data prior to 2006 need to be completed when time allows. The age composition for the entire broodstock (volunteers, OLAFT, and ABC fishery) for natural and hatchery origin spawners was generated after expanding the sample to account for differing sample rates. The historical broodstock age compositions are not directly comparable to 2012 broodstock age composition due to inconsistent methodology for assigning origin.

© 2013, PUBLIC UTILITY DISTRICT NO. 2 OF GRANT COUNTY, WASHINGTON. ALL RIGHTS RESERVED UNDER U.S. AND FOREIGN LAW, TREATIES AND CONVENTIONS.
15
Hatchery origin age-3 and 4 fall Chinook salmon comprised 76% of the PRH broodstock in 2012. Both the hatchery and natural component of the broodstock consisted primarily of age-3 fish (Table 10). By design, few age-2 hatchery origin males are included in the broodstock. There were 19 natural origin and 27 PRH origin age-2 males recovered at the OLAFT added to the broodstock. There was only one age-6 fish sampled in the broodstock. This fish was a natural origin female and recovered from the OLAFT.
Table 10 Proportion of age class for hatchery and natural origin fall Chinook salmon spawned at Priest Rapids Hatchery, 2007 – 2012.
Brood Origin
Age Composition n = Age-2 Age-3 Age-4 Age-5 Age-6
2007 Natural1 1 0.000 1.000 0.000 0.000 0.000
Hatchery1 61 0.081 0.274 0.486 0.138 0.020
2008 Natural1 0 -- -- -- -- --
Hatchery1 95 0.011 0.848 0.100 0.039 0.002
2009 Natural1 0 -- -- -- -- --
Hatchery1 61 0.012 0.086 0.883 0.019 0.000
2010 Natural1 0 -- -- -- -- -- Hatchery 133 0.016 0.755 0.111 0.118 0.000
2011 Natural1 0 -- -- -- -- --
Hatchery1 22 0.010 0.229 0.753 0.008 0.000
2012 Natural2 379 0.032 0.435 0.400 0.131 0.002
Hatchery2 871 0.006 0.487 0.376 0.130 0.000
Mean Natural 63 0.024 0.595 0.256 0.125 0.001
Hatchery 207 0.023 0.447 0.452 0.075 0.004 1 Origin determined from coded-wire tag expansions 2 Origin determined from coded-wire and otolith samples
A total of 4,408 Chinook salmon from the PRH volunteer trap were spawned. The PRH origin fish were mostly age-3. The natural origin broodstock consisted mostly of age-4 fish (Table 11). There were no age-2 or age-6 fish spawned from the volunteer trap group.
Table 11 Proportion of hatchery and natural origin fall Chinook salmon for each age class of broodstock collected from the PRH volunteer trap. (See file 2012 otolith sampling summary)
Brood Origin
Age Composition
n = Age-2 Age-3 Age-4 Age-5 Age-6
2012 Natural1 39 0.000 0.295 0.585 0.121 0.000 Hatchery1 646 0.000 0.477 0.389 0.134 0.000
1 Origin determined from “in-sample” otoliths, adipose clips and/or coded-wire tags.
A total of 519 Chinook salmon collected at the OLAFT were spawned to supplement 2012 broodstock. The collection consisted of 56% natural origin fish. The PRH origin and natural origin recovered at the OLAFT and spawned were primarily age-3 (Table 12). There were 19 natural origin and 27 PRH origin age-2 males and one age-6 natural origin female recovered at the OLAFT added to the broodstock.
Table 12 Proportion of hatchery and natural origin fall Chinook salmon for each age class of broodstock collected at the Off Ladder Adult Fish Trap.

© 2013, PUBLIC UTILITY DISTRICT NO. 2 OF GRANT COUNTY, WASHINGTON. ALL RIGHTS RESERVED UNDER U.S. AND FOREIGN LAW, TREATIES AND CONVENTIONS.
16
Brood Origin
Age Composition
n = Age-2 Age-3 Age-4 Age-5 Age-6
2012 Natural1 281 0.048 0.540 0.257 0.151 0.004 Hatchery1 219 0.106 0.687 0.136 0.071 0.000
1 Origin determined from “in-sample” otoliths, adipose clips and/or coded-wire tags. 2 One age-6 female assigned to natural origin based on the absence of marks or tags. The 2006 broodyear was not otolith marked.
A total of 68 fall Chinook salmon collected from the ABC fishery were spawned to supplement the 2012 broodstock. The collection consisted of 91% natural origin fish. Similar to other sources of broodstock, the PRH origin and natural origin recovered and spawned were mostly age-3 (Table 13).
Table 13 Proportion of hatchery and natural origin fall Chinook salmon for each age of broodstock collected from the Angler Broodstock Collection.
Brood Origin
Age Composition
n = Age-2 Age-3 Age-4 Age-5 Age-6
2012 Natural1 59 0.000 0.542 0.339 0.119 0.000 Hatchery1 6 0.000 0.667 0.333 0.000 0.000
1 Origin determined from “in-sample” otoliths, adipose clips and/or coded-wire tags.
10.4 Length by Age Class of Broodstock The 2012 broodstock collected at the PRH volunteer trap and the OLAFT were high graded for gender, size, and/or origin. For example, fish that had an adipose clip or coded-wire tag were excluded from OLAFT collections.
Age-2 and 3 males were also generally excluded from the PRH volunteer trap and when broodstock abundance was sufficient, hatchery marked fish were excluded as well. The broodstock collected from the ABC fishery were not intentionally selected for gender, size, or origin.
Hatchery and natural origin 2012 broodstock were similar in size for age-3 and 4 fish. For the age-2 broodstock the hatchery origin fish were larger than the natural origin fish. At age-5, the natural origin was larger than the hatchery origin broodstock (Table 14). Similar to historic observations at PRH and the Hanford Reach, hatchery origin fall Chinook salmon tend to be a little larger at ages-2 and 3 and smaller at ages-4 and 5 than the natural origin fish (Table 15).

© 2013, PUBLIC UTILITY DISTRICT NO. 2 OF GRANT COUNTY, WASHINGTON. ALL RIGHTS RESERVED UNDER U.S. AND FOREIGN LAW, TREATIES AND CONVENTIONS.
17
Table 14 Mean fork length (cm) at age (total age) of fall Chinook salmon sampled from each source of broodstock spawned at Priest Rapids Hatchery, 2012.
Return Year Origin
Fall Chinook Fork Length (cm) Age-2 Age-3 Age-4 Age-5 Age-6
N Mean SD N Mean SD N Mean SD N Mean SD N Mean SD
Volunteer Returns
Natural 12 71 4 25 82 4 5 86 4 Hatchery 298 70 4 253 81 5 91 88 7
OLAFT Natural 19 43 4 151 67 6 70 83 6 40 91 5 1 91 0 Hatchery 27 50 5 150 68 5 27 81 4 15 84 4
ABC Fishery
Natural 32 66 6 20 85 6 7 90 6 Hatchery 4 68 6 2 85 0
It is assumed for this analysis that all fish collected in the Hanford Reach, except for those that were of known hatchery origin (e.g., ad-clipped or CWT), were natural origin. N = sample size and SD = 1 standard deviation. Table 15 Mean fork length (cm) at age (total age) of hatchery and natural origin fall
Chinook salmon collected from volunteer broodstock for the Priest Rapids Hatchery program, N = sample size and SD = 1 standard deviation.
Return year Origin
Fall Chinook Fork Length (cm) Age-2 Age-3 Age-4 Age-5 Age-6
N Mean SD N Mean SD N Mean SD N Mean SD N Mean SD
2007 Natural 0 1 76 0 0 0 0 Hatchery 31 55 3 114 70 4 216 83 6 61 91 6 9 94 9
2008 Natural 0 0 0 0 0 Hatchery 3 45 3 429 73 4 51 84 5 20 91 4 1 73 0
2009 Natural 0 0 0 0 0 Hatchery 5 50 4 42 71 4 428 84 6 9 95 7 0
2010 Natural 0 0 0 0 0 Hatchery 20 51 5 1,044 72 4 164 84 6 173 91 6 0
2011 Natural 2 43 3 36 67 5 100 82 6 19 89 4 0 Hatchery 7 49 6 249 70 4 837 80 5 9 91 7 0
2012 Natural 0 12 71 4 25 82 4 5 86 4 0 Hatchery 0 298 70 4 253 81 5 91 88 7 0
10.5 Gender Ratios PRH staff sort and select broodstock from the trap to meet their egg take goals and male-to-female spawner ratio. Additional broodstock was collected from the OLAFT and ABC fishery. Females comprised 63% of the 2012 broodstock collection, resulting in an overall male to female ratio of 0.58:1.00 which slightly higher than the historic mean ratio of 0.55:1.00 (Table 16).

© 2013, PUBLIC UTILITY DISTRICT NO. 2 OF GRANT COUNTY, WASHINGTON. ALL RIGHTS RESERVED UNDER U.S. AND FOREIGN LAW, TREATIES AND CONVENTIONS.
18
Table 16 Numbers of male and female hatchery fall Chinook salmon broodstock at Priest Rapids Hatchery. Ratios of males to females are also provided.
Return Year Males (M) Females (F) M/F Ratio 2001 1,697 3,289 0.52:1.00 2002 1,936 3,628 0.53:1.00 2003 1,667 3,176 0.52:1.00 2004 1,688 3,099 0.54:1.00 2005 1,962 3,326 0.59:1.00 2006 1,777 3,322 0.53:1.00 2007 850 1,301 0.65:1.00 2008 1,823 3,195 0.57:1.00 2009 1,531 3,000 0.51:1.00 2010 1,809 3,447 0.52:1.00 2011 1,858 3,000 0.62:1.00 2012 1,749 3,225 0.58:1.00 Mean 1,696 3,084 0.55:1.00
Extremely low numbers of coded-wire tagged natural origin fall Chinook salmon are recovered in the broodstock at PRH. Therefore, there is insufficient data to determine historical male-to female-ratios by origin (natural vs. hatchery) using coded-wire tag recoveries. Unique for return year 2012, the age-2 through 5 PRH origin broodstock were otolith marked which provides data to determine male to female ratios by origin (natural origin vs. PRH origin). For this comparison, we assume that fish not possessing both an otolith mark and an adipose clip are natural origin fish. Prior to combining the samples from the three sources of broodstock, the volunteer broodstock sample was expanded to account for the 2:3 subsample rate for otoliths and a 2:3 subsample for in-sample coded-wire tags. The OLAFT and ABC fishery groups were 100% sampled for otolith and therefore did not need expanding.
In the volunteer broodstock otolith sample, there were three out of 42 non-otolith marked fish that were adipose clipped. Expanded to account for the 2:3 sample rate, there were 20 (0.46%) non otolith marked/adipose clipped fish in the broodstock that should be classified as fish from other hatcheries.
The addition of broodstock from OLAFT and ABC fishery more than doubled the natural origin spawners in the PRH broodstock. It also increased the male to female ratio for natural origin brood stock from 0.70:100 to 1.12:1.00. The addition of the OLAFT and ABC fishery broodstock slightly increased the male to female ratio for PRH origin broodstock (Table 17).
Table 17 Numbers of male and female natural origin and Priest Rapids Hatchery origin fall Chinook salmon spawned at Priest Rapids Hatchery, 2012. (Otolith sample size = 14.63% for PRH volunteer returns in the broodstock and 100% for OLAFT and ABC Fishery)
Broodstock Source Natural Origin Fall Chinook Hatchery Origin Fall Chinook
Total M/F ratio Males Females M/F Males Females M/F PRH Volunteer Returns 105 147 0.70:1.00 1,251 2,905a 0.42:1.00 0.44:1.00 OLAFT 185 96 1.93:1.00 168 52 3.23:1.00 2.39:1.00 ABC Fishery 36 23 1.57:1.00 4 2 2.00:1.00 1.60:1.00 Total 326 266 1.23:1.00 1,423 2,959 0.48:1.00 0.54:1.00
a Included an estimated 20 stray Chinook salmon from other hatcheries.

© 2013, PUBLIC UTILITY DISTRICT NO. 2 OF GRANT COUNTY, WASHINGTON. ALL RIGHTS RESERVED UNDER U.S. AND FOREIGN LAW, TREATIES AND CONVENTIONS.
19
10.6 Fecundity The annual average fecundity for PRH was calculated as the proportion of the total number of females spawned to the total egg take. Fecundity for the 2012 broodstock sampled averaged 3,834 eggs per viable female which is less than the historic mean of 4,019 (Table 18). The lower facility fecundity is likely the result of higher than normal proportion of age-3 females spawned in broodyear 2102.
Table 18 Mean fecundity of fall Chinook salmon collected for broodstock at Priest Rapids Hatchery.
Return year Egg Take Viable Females Fecundity/Female
2001 10,750,000 3,161 3,401 2002 12,180,000 3,489 3,491 2003 12,814,000 3,078 4,163 2004 12,753,500 3,019 4,224 2005 14,085,000 3,211 4,386 2006 13,511,200 3,217 4,200 20071 5,067,319 1,249 4,057 2008 12,643,600 3,074 4,113 2009 13,074,798 2,858 4,575 2010 11,903,407 3,304 3,603 2011 12,693,000 3,038 4,178 2012 12,398,389 3,234 3,834
Mean 11,989,518 2,994 4,019 1 Did not reach egg take goal.
Fecundity samples were taken from individual females at PRH during the 2010, 2011, and 2012 spawn. Lots of 60 egg samples were weighed to estimate fecundity for each female sampled. Fecundity samples were not identified as to the origin of the mothers. The average fecundity by age is given in Table 19. This information is useful for forecasting potential egg takes based on the numbers and age composition of the forecasted return.
Table 19 Fecundity at Age for fall Chinook salmon sampled the Priest Rapids Hatchery.
Age at Spawn
Brood Year
2010 2011 2012 Mean by Age Age-3 3,698 3,538 3,638 3,680 Age-4 4,379 4,276 4,034 4,288 Age-5 4,652 4,380 3,600 4,632
Annual Mean 3,986 4,183 3,932 4,051 n= 441 242 15 695
The origin of fish sampled is not known.
The fecundity data was pooled for broodyears 2010, 2011, and 2012 to provide a regression formula to estimate fecundity based on length (Figure 4). The r2 value for this regression is low at 0.275 but the regression formula may be useful for coarse predictions of egg production for different size fish.

© 2013, PUBLIC UTILITY DISTRICT NO. 2 OF GRANT COUNTY, WASHINGTON. ALL RIGHTS RESERVED UNDER U.S. AND FOREIGN LAW, TREATIES AND CONVENTIONS.
20
Figure 4 Regression analysis of fecundity by fork length at Priest Rapids Hatchery,
broodyears 2010 through 2012. 11.0 Hatchery Rearing
11.1 Number of eggs taken In 2012, 12,398,389 eggs were collected at the PRH facility. The egg take goal at PRH is calculated annually based on current program needs. In 2012 the egg take goal was 11,819,000 eggs. This goal is established to meet the fall Chinook salmon production goals at both PRH and RSH as well as provide eggs for the Salmon in the Classroom Program.
PRH incubates 7.7 million eyed eggs to produce a 6.7 million smolt release at the hatchery. An additional 3.7 million eyed eggs are needed to meet the program goal of eyed egg delivery to Bonneville Hatchery for the Ringold Springs Hatchery fall Chinook salmon production (USACE - John Day mitigation). Egg takes at PRH were sufficient to meet all hatchery production goals from 1984 through 2012, with the exception of 2007 (Table 20).
0
1,000
2,000
3,000
4,000
5,000
6,000
7,000
8,000
9,000
10,000
60 65 70 75 80 85 90 95 100 105
Fecu
ndity
Fork Length (cm)
Y
Linear (Y)
y = 69.712x - 1396.597 r2 = 0.275

© 2013, PUBLIC UTILITY DISTRICT NO. 2 OF GRANT COUNTY, WASHINGTON. ALL RIGHTS RESERVED UNDER U.S. AND FOREIGN LAW, TREATIES AND CONVENTIONS.
21
Table 20 Numbers of eggs taken from fall Chinook salmon broodstock collected at Priest Rapids Hatchery for the Hanford Reach and lower Yakima River programs.
Return Year Number of Eggs Taken
Return Year Number of Eggs Taken 1984 10,342,000 1999 16,089,600 1985 10,632,000 2000 15,359,500 1986 22,126,100 2001 10,750,000 1987 24,123,000 2002 12,180,000 1988 16,682,000 2003 12,814,000 1989 13,856,500 2004 12,753,500 1990 9,605,000 2005 14,085,000 1991 6,338,000 2006 13,511,200 1992 11,156,400 2007 5,067,319 1993 14,785,000 2008 12,643,600 1994 16,074,600 2009 13,074,798 1995 17,345,900 2010 11,903,407 1996 14,533,500 2011 12,693,000 1997 17,007,000 2012 12,398,389 1998 13,981,300 10 year (03-12) Mean 12,094,421
11.2 Number of acclimation days Rearing of the 2012 brood fall Chinook salmon at PRH was similar to previous years with fish being incubated on well water before being transferred to intermediate vinyl raceways and then transferred to the concrete holding ponds for final acclimation before release into the Columbia River in June 2013. The egg takes from the 2012 brood were distributed into eight batches associated with the dates in which fish were spawned. The number of acclimation days ranged from 90 for the later egg takes to 143 for the earlier egg takes (Table 21).
Table 21 Number of days fall Chinook salmon fry were ponded at Priest Rapids Hatchery prior release.
Broodyear Batch Transfer Date Release Date Number of Days 2012 1 1/23/2013 6/16/2013 143 2012 2 2/2/2013 6/16/2013 134 2012 3 2/13/2013 6/12/2013 119 2012 4 2/13/2013 6/12/2013 119 2012 5 2/22/2013 6/13/2013 111 2012 6 3/9/2013 6/14/2013 97 2012 7 3/12/2013 6/14/2013 94 2012 8 3/16/2013 6/14/2013 90
11.3 Number released In 2013, PRH released 6,822,361 subyearling fall Chinook salmon. The PRH release target goal is 6.7 million subyearlings with 1.7 million of these fish accounting for the USACE John Day Mitigation contribution. Fish were released between June 14 and June 16. During the previous ten year, PRH has averaged 6,578,000 smolts at release, with a range of 4,548,306 to 7,056,946 (Table 2).
11.4 Fish Size and Condition at Release The goal for PRH is to release fall Chinook salmon smolts at 50 fish per pound. In 2013, the smolts were released at an average 47 fish per pound and 95 mm in fork length. The coefficient of variation of the fork length was 7.6. Past smolt releases from PRH have averaged 47 fish per pound (96 mm) with a CV of 7.4 over the most recent 22 years (Table 22).

© 2013, PUBLIC UTILITY DISTRICT NO. 2 OF GRANT COUNTY, WASHINGTON. ALL RIGHTS RESERVED UNDER U.S. AND FOREIGN LAW, TREATIES AND CONVENTIONS.
22
Table 22 Mean lengths (FL, mm), weight (g and fish/pound), and coefficient of variation (CV) of fall Chinook smolts released from Priest Rapids Hatchery during broodyears 1991 – 2010. Size targets are provided in the last row of the table.
Broodyear Release
Year Fork Length (mm) Mean Weight
n= Mean CV Grams (g) Fish/pound
1991 1992 93 8.7 8.3 55 1,500 1992 1993 92 8.6 8.3 54 1,500 1993 1994 95 6.9 9.3 49 1,500 1994 1995 96 6.7 9.7 47 1,500 1995 1996 97 6.6 10.0 45 1,500 1996 1997 95 11.0 8.7 52 1,500 1997 1998 103 8.9 10.1 45 1,500 1998 1999 95 6.5 9.6 48 1,500 1999 2000 93 6.6 8.9 51 1,500 2000 2001 97 6.3 10.2 45 1,500 2001 2002 96 6.9 10.1 45 1,500 2002 2003 95 6.9 9.5 48 1,500 2003 2004 96 6.8 9.6 48 1,500 2004 2005 95 5.9 9.4 48 1,500 2005 2006 98 6.3 10.1 45 1,500 2006 2007 98 7.0 9.9 46 1,500 2007 2008 101 8.3 10.2 45 1,200 2008 2009 94 6.7 9.3 49 1,500 2009 2010 94 7.3 9.2 49 1,500 2010 2011 92 9.1 9.7 47 1,500 2011 2012 94 7.1 9.2 49 1,500 2012 2013 95 7.6 9.7 47 1,500
Mean 96 7.4 9.5 47 1,486
Targets 9.1 50 1,500
11.5 Survival Estimates The survival rate for unfertilized egg to juvenile release for broodyear 2012 was 96% which is highest recorded since broodyear 2002 and notably higher than the historic mean of 86% (Table 23). Survival has ranged from a low of 74% in 2007 to a high of 96% in 2012. The unfertilized egg to eyed egg stage is the most critical life stage at PRH during incubation/juvenile rearing. The survival rate for broodyear 2012 during this stage was 87%, slightly lower than the historic mean.
Pre-spawn survival of adult Chinook salmon ponded at PRH for broodstock has averaged 89% since broodyear 2002. In 2012, survival of fish ponded for broodstock was only 69%. This was the second lowest survival rate on record. Survival of fish ponded for broodstock in broodyear 2011 was roughly 68% which was the lowest on recorded since broodyear 2002. The cause of the elevated mortality in unknown; however, in-season observations of high fish holding

© 2013, PUBLIC UTILITY DISTRICT NO. 2 OF GRANT COUNTY, WASHINGTON. ALL RIGHTS RESERVED UNDER U.S. AND FOREIGN LAW, TREATIES AND CONVENTIONS.
23
densities in the volunteer trap on clean-out days may suggest that the fish were stressed prior to ponding.
Table 23 Hatchery life-stage survival rates (%) for fall Chinook salmon at Priest Rapids Hatchery, broodyears 1989 – 2012. Survival standards for unfertilized egg to release are provided in the last row of the table. The survival standards are the mean survivals for the most recent 10 year period.
Broodyear
Ponded to Spawned
Unfertilized to Eyed Egg
Eyed egg to Ponding
Ponding to
Release
Unfertilized Egg to Release
Standard Unfertilized
Egg to Release1 Female Male Jack Total
2002 0.835 0.829 0.705 0.828 0.880 0.995 0.979 0.858 0.875 2003 0.893 0.817 0.698 0.858 0.882 0.989 0.989 0.868 0.870 2004 0.958 0.915 0.646 0.845 0.881 0.975 0.985 0.846 0.867 2005 0.890 0.890 0.782 0.886 0.914 0.976 0.991 0.884 0.864 2006 0.918 0.924 0.695 0.913 0.897 0.975 0.981 0.859 0.866 2007 0.967 0.748 0.642 0.861 0.858 0.996 0.981 0.737 0.862 2008 0.943 0.896 0.877 0.924 0.902 0.973 0.877 0.877 0.857 2009 0.848 0.901 0.916 0.864 0.912 0.977 0.891 0.891 0.856 2010 0.803 0.831 0.803 0.809 0.913 0.985 0.977 0.841 0.856 2011 0.611 0.847 0.737 0.679 0.903 0.985 0.985 0.875 0.853 2012 0.6433
98 0.786 0.630 0.688 0.872 0.985 0.979 0.964 0.863
Mean 0.846 0.853 0.739 0.832 0.892 0.983 0.965 0.864 N/A 1 Standard Unfertilized Egg to Release equals the mean for the previous ten-year’s unfertilized egg to release survival rate.
11.6 Juvenile PIT Tag Detections at the Priest Rapids Hatchery Array Historically, roughly 3,000 subyearlings at PRH were annually PIT tagged to assess timing, migration speed, and juvenile survival from PRH to McNary Dam. The analysis for these measures is reported annually by the Fish Passage Center (Appendix D). Approximately 40,000 additional juveniles were marked for the 2012 release to bolster the data collected for estimation of juvenile abundance at release, adult straying, adult migration timing, conversion rates from Bonneville Dam to McNary Dam to PRH, and smolt to adult survival rates, as well as fallback and re-ascension estimates at McNary, Ice Harbor, and Priest Rapids dams. Prior to the 2012 release, a PIT array consisting of six antennas was installed in the hatchery discharge channel to detected both juvenile out-migrants and adult returns.
The mean detection rate for the seven subyearling tag groups release in 2012 combined is 70% (Table 24). The detection rates by group varied from 50% to 81%. The last two groups released showed the lowest detection rates. The lower detection rate may have resulted from the inundation of the array caused by high river elevations during the release. The total discharge out of Priest Rapids Dam ranged between 238 kcfs and 251 kcfs between June 12 and June 16. The decrease in detection rates coincides with a spike in river flows which were 295 kcfs on June 20.

© 2013, PUBLIC UTILITY DISTRICT NO. 2 OF GRANT COUNTY, WASHINGTON. ALL RIGHTS RESERVED UNDER U.S. AND FOREIGN LAW, TREATIES AND CONVENTIONS.
24
Table 24 Number of subyearlings PIT tagged, mark and release dates, and the number of unique tags detected at the array in the Priest Rapids discharge channel.
Broodyear Coordinator ID Tag File Tagging
Date Release
Date Number Tagged
Number of Unique Detections
Percent Detected
2012 SMP SMP12152.PR3 05/31/2012 06/12/2012 996 810 81% 2012 SMP SMP12151.PR2 05/30/2012 06/16/2012 998 806 81% 2012 SMP SMP12151.PR1 05/30/2012 06/20/2012 1,000 499 50% 2012 CSM CSM12114.A03 04/23/2012 06/14/2012 9,948 6,673 67% 2012 CSM CSM12114.A04 04/23/2012 06/15/2012 9,997 6,962 70% 2012 CSM CSM12115.A02a 04/24/2012 06/16/2012 9,968 8,115 81% 2012 CSM CSM12114.A01 04/23/2012 06/20/2012 9,937 6,276 63%
Totals
42,844 30,141 70% a Includes one fish from Tag File CSM12115.BO2
12.0 Adult Fish Pathogen Monitoring At spawning, adult fall Chinook are sampled for viral pathogens and Renibacterium salmoninarum the causative agent for bacterial kidney disease (BKD). The risk of BKD was assayed using the ELISA. Results of adult broodstock BKD monitoring in 2012 indicated that nearly all females had ELISA values less than an optical density of 0.10 (Table 25). Viral inspections included sampling the ovarian fluid and kidney/spleen for pathogens. All results of viral testing in 2012 were negative (Table 25).
Table 25 ELISA test results to determine risk of bacterial kidney disease of adult female fall Chinook salmon broodstock at Priest Rapids Hatchery, broodyears 2008 – 2012.
Year Stock Number %Below-Low
% Low
% Mod
% High 2008 Priest Rapids 60 100.0% 0.0% 0.0% 0.0%
2009 Priest Rapids 60 100.0% 0.0% 0.0% 0.0% 2010 Priest Rapids 60 100.0% 0.0% 0.0% 0.0% 2011 Priest Rapids 135 100.0% 0.0% 0.0% 0.0% 2012 Priest Rapids 60 98.3% 0.0% 1.7% 0.0%

© 2013, PUBLIC UTILITY DISTRICT NO. 2 OF GRANT COUNTY, WASHINGTON. ALL RIGHTS RESERVED UNDER U.S. AND FOREIGN LAW, TREATIES AND CONVENTIONS.
25
Table 26 Viral inspections of fall Chinook salmon broodstock at Priest Rapids Hatchery.
Year Date(s) Stock Life stage Ovarian Fluid Kidney/Spleen Results 1991 28-Oct, 4, 13-Nov Priest Rapids Adult 150 60 Negative 1992 2,9-Nov Priest Rapids Adult 150 60 Negative 1993 25-Oct, 1-Nov Priest Rapids Adult 150 60 Negative 1994 7-Nov Priest Rapids Adult 60 60 Negative 1995 9,13,19,21-Nov Priest Rapids Adult 160 160 Negative 1996 17-Nov Priest Rapids Adult 60 60 Negative 1997 17-Nov Priest Rapids Adult 60 60 Negative 1998 16-Nov Priest Rapids Adult 60 60 Negative 1999 8-Nov Priest Rapids Adult 60 60 Negative 2000 13-Nov Priest Rapids Adult 60 60 Negative 2001 13-Nov Priest Rapids Adult 60 60 Negative 2002 13-Nov Priest Rapids Adult 60 60 Negative 2003 17-Nov Priest Rapids Adult 60 60 Negative 2004 8-Nov Priest Rapids Adult 60 60 Negative 2005 14-Nov Priest Rapids Adult 60 60 Negative 2006 6-Nov Priest Rapids Adult 60 60 Negative 2007 5-Nov Priest Rapids Adult 60 60 Negative 2008 3-Nov Priest Rapids Adult 60 60 Negative 2009 2-Nov Priest Rapids Adult 60 60 Negative 2010 15-Nov Priest Rapids Adult 60 60 Negative 2011 7,14, 21-Nov Priest Rapids Adult 180 180 Negative 2012 5-Nov Priest Rapids Adult 60 60 Negative
13.0 Juvenile Fish Health Inspections Juvenile fish are visually inspected on a monthly basis following ponding. The 2012 broodyear juveniles were healthy throughout the rearing period (Table 27). Historical inspection results are provided in Appendix E.
Table 27 Juvenile fish health inspections for Priest Rapids Hatchery fall Chinook salmon.
Hatchery Date Species/Run Stock Broodyear Condition Priest Rapids 25-Mar-11 CHF Priest Rapids 2010 Healthy Priest Rapids 18-Apr-11 CHF Priest Rapids 2010 Healthy Priest Rapids 06-Jun-11 CHF Priest Rapids 2010 Healthy Priest Rapids 01-Mar-12 CHF Priest Rapids 2011 Healthy Priest Rapids 26-Apr-12 CHF Priest Rapids 2011 Healthy Priest Rapids 24-May-12 CHF Priest Rapids 2011 Healthy Priest Rapids 11-Feb-13 CHF Priest Rapids 2012 Healthy Priest Rapids 3-Mar-13 CHF Priest Rapids 2012 Healthy Priest Rapids 29-Apr-13 CHF Priest Rapids 2012 Healthy Priest Rapids 28-May-13 CHF Priest Rapids 2012 Healthy
14.0 Redd Surveys Redd surveys were performed in the Hanford Reach during 2012 by biologists with Environmental Assessment Services LLC under contract with Mission Support Alliance LLC. WDFW M&E staff did not successfully perform redd counts in the PRH discharge channel as done in previous years.

© 2013, PUBLIC UTILITY DISTRICT NO. 2 OF GRANT COUNTY, WASHINGTON. ALL RIGHTS RESERVED UNDER U.S. AND FOREIGN LAW, TREATIES AND CONVENTIONS.
26
14.1 Hanford Reach Aerial Redd Counts Aerial redd counts in the Hanford Reach were performed by Environmental Assessment Services, LLC on October 21 and 30, and November 18, 2012 (Appendix F). Two of the three flights occurred on the weekends when outflows at Priest Rapids Dam were lowered to near 50 kcfs in conjunction with ground-based redd surveys by Grant PUD and the WDFW at the Vernita Bar. Cloud cover and moderate wind resulted in less than optimal viewing conditions during the final flight on November 18. The peak redd count for the Hanford Reach area of the Columbia River in 2012 was 8,368 (Table 28). The peak spawning was estimated to occur near the time of the November 18 survey. The count for 2012 was the eighth highest since the surveys were conducted beginning in 1948 and higher than the ten-year mean (2003 to 2012) of 7,306 redds. Redd counts should be considered an index of the total number of redds in the Hanford Reach. Redds may not be visible during flights due to wind, turbidity, ambient light, and depth.
Table 28 Summary of fall Chinook salmon peak redd counts for the 1948 – 2012 aerial surveys in the Hanford Reach, Columbia River.
Year Redds Year Redds Year Redds Year Redds 1948 787 1965 1,789 1982 4,988 1999 6,068 1949 313 1966 3,101 1983 5,290 2000 5,507 1950 265 1967 3,267 1984 7,310 2001 6,248 1951 297 1968 3,560 1985 7,645 2002 8,083 1952 528 1969 4,508 1986 8,291 2003 9,465 1953 139 1970 3,813 1987 8,616 2004 8,468 1954 160 1971 3,600 1988 8,475 2005 7,891 1955 60 1972 876 1989 8,834 2006 6,508 1956 75 1973 2,965 1990 6,506 2007 4,018 1957 525 1974 728 1991 4,939 2008 5,618 1958 798 1975 2,683 1992 4,926 2009 4,996 1959 281 1976 1,951 1993 2,863 2010 8,817 1960 258 1977 3,240 1994 5,619 2011 8,915 1961 828 1978 3,028 1995 3,136 2012 8,368 1962 1,051 1979 2,983 1996 7,618 10-year
(2003-12) Mean
7,306 1963 1,254 1980 1,487 1997 7,600 1964 1,477 1981 4,866 1998 5,368
14.2 Redd Distribution The main spawning areas observed during the 2012 counts were located near Vernita Bar and among Islands 4-6 (Table 29 & Figure 5). Historical redd counts by location from 2001 through 2012 are included in Appendix F of this report.

© 2013, PUBLIC UTILITY DISTRICT NO. 2 OF GRANT COUNTY, WASHINGTON. ALL RIGHTS RESERVED UNDER U.S. AND FOREIGN LAW, TREATIES AND CONVENTIONS.
27
Table 29 Number of fall Chinook salmon redds counted in different reaches on the Hanford Reach area of the Columbia River during the October 2012 through November 2012 aerial redd counts. (Data provided by Mission Support Alliance – Environmental Assessment Services)
General Location Approximate River (KM) 10/16 10/30 11/18 Peak
Islands 17-21 553 0 0 0 0 Islands 11-16 566 3 147 533 533 Islands 8-10 590 4 353 807 807 Near Island 7 593 12 425 700 700 Island 6 (lower half) 597 14 553 1,375 1,375 Island 4, 5 and upper 6 600 9 947 1,195 1,195 Near Island 3 603 1 225 475 475 Near Island 2 605 6 301 528 528 Near Island 1 607 4 160 340 340 Near Coyote Rapids 617 1 19 29 29 Midway (China Bar) 628 0 25 68 68 Near Vernita Bar 632 28 1,180 2,315 2,315 Near Priest Rapids Dam 638 0 0 3 3 Total 82 4,335 8,368 8,368
Figure 5 Distribution of fall Chinook salmon redd counts by location for the 2012
aerial surveys in the Hanford Reach, Columbia River. (Data provided by Mission Support Alliance – Environmental Assessment Service)
14.3 Spawn Timing Based on aerial redd counts and Vernita Bar ground surveys, fall Chinook salmon spawning in the Hanford Reach during 2012 began in mid-October and ended after the third week of November. Flights were not conducted weekly during 2012. The last flight occurred on November 18 which was the last day of the Vernita Bar ground survey. Very minimal active
0%
5%
10%
15%
20%
25%
30%
% o
f Tot
al R
edds

© 2013, PUBLIC UTILITY DISTRICT NO. 2 OF GRANT COUNTY, WASHINGTON. ALL RIGHTS RESERVED UNDER U.S. AND FOREIGN LAW, TREATIES AND CONVENTIONS.
28
spawning was observed during the Vernita Bar ground survey conducted on November 18. River temperatures in the Columbia River below Priest Rapids Dam, when spawning began, varied from 15°C (October 21) to 11.7°C (November 18).
14.4 Spawning Escapement The estimated total escapement of fall Chinook salmon to the Hanford Reach for 2012 returns was 57,631 fish; 51,774 adults and 5,857 jacks (Table 28 Summary of fall Chinook salmon peak redd counts for the 1948 – 2012 aerial surveys in the Hanford Reach, Columbia River.). The estimated 2012 adult spawning escapement was lower than that of previous two years and the ten-year mean of 54,173 fish (Table 30 and 31).
Table 30 Calculation of escapement estimates for fall Chinook salmon in the Hanford Reach, 2012.
Count Source Return Year 2012 Adult Jack Total
Priest Rapids Adult Passage 54,283 10,389 64,672 Fallback Adj1 14,281 2,733 17,0141 Ice Harbor Adult Passage 38,546 21,554 60,100 Prosser Adult Passage 3,807 733 4,540 Priest Rapids Hatchery 18,878 9,153 28,031 PRH discharge channel 191 16 207 Wanapum Tribal Fishery 7 1 8 Ringold Springs Hatchery 5,324 2,067 7,391 Yakima River Escapement (Below Prosser) 1,098 211 1,309 Yakima River Sport Harvest 704 294 998 Hanford Sport Harvest 13,141 5,713 18,854 Total 121,698 47,398 169,096 McNary Ladder Counts 173,472 53,255 226,727 Hanford Reach Escapement 51,774 5,857 57,631
1 The Priest Rapids adult fish counts were reduced by 17,014 Chinook salmon based on the proportion of unique upstream PIT-tag detections of fall Chinook salmon at Priest Rapids Dam which were last observed in the Priest Rapids Hatchery discharge channel. These Chinook salmon were assumed to fallback over the dam and into the Hanford Reach.
The estimated adult Chinook salmon per redd is calculated by dividing the adult escapement to the Hanford Reach by peak number of redds reported in the redd survey. The estimated annual escapements to the Hanford Reach were not adjusted for prespawn mortality. For 2012, the estimated 6.2 per redd fish was slightly below the 10-year average of 6.9 fish per redd. (Table 31). Despite the lower than average escapement estimate for return year 2012, the aerial count of 8,368 redds was greater than the 10-year mean of 7,306 redds.

© 2013, PUBLIC UTILITY DISTRICT NO. 2 OF GRANT COUNTY, WASHINGTON. ALL RIGHTS RESERVED UNDER U.S. AND FOREIGN LAW, TREATIES AND CONVENTIONS.
29
Table 31 Spawning escapement for fall Chinook salmon in the Hanford Reach for broodyears 1964 – 2012.
Return Year
Fish per Redd # Redds
Total Spawning
Escapement
Return Year
Fish per Redd # Redds
Total Adult
Spawning Escapement
1964 16.3 1,477 24,048 1989 7.5 8,834 65,913 1965 13.6 1,789 24,360 1990 6.2 6,506 40,117 1966 9.1 3,101 28,079 1991 6.5 4,939 31,971 1967 7.1 3,267 23,188 1992 6.0 4,926 29,449 1968 6.8 3,560 24,067 1993 10.7 2,863 30,650 1969 7.8 4,508 34,939 1994 8.7 5,619 48,857 1970 7.0 3,813 26,730 1995 12.2 3,136 38,381 1971 8.7 3,600 31,398 1996 4.9 7,618 37,548 1972 30.5 876 26,749 1997 4.5 7,600 34,007 1973 11.1 2,965 33,044 1998 5.5 5,368 29,410 1974 35.5 728 25,847 1999 4.5 6,068 27,012 1975 8.3 2,683 22,242 2000 6.5 5,507 36,027 1976 10.8 1,951 21,140 2001 7.1 6,248 44,140 1977 9.7 3,240 31,527 2002 8.6 8,083 69,342 1978 6.8 3,028 20,578 2003 9.4 9,465 89,312 1979 7.9 2,983 23,558 2004 9.4 8,468 79,464 1980 14.7 1,487 21,861 2005 8.2 7,891 64,355 1981 3.1 4,866 15,115 2006 7.2 6,508 47,095 1982 4.1 4,988 20,543 2007 2.1 4,018 13,887 1983 6.8 5,290 36,022 2008 4.2 5,618 23,361 1984 5.7 7,310 41,982 2009 5.3 4,996 26,346 1985 8.6 7,645 65,796 2010 9.1 8,817 80,408 1986 8.8 8,291 72,559 2011 7.4 8,915 65,724 1987 10.3 8,616 88,762 2012 6.2 8,368 51,774 1988 8.7 8,475 74,034 Ten Year (03-12) Mean 6.9 7,306 54,173
14.5 Hatchery Discharge Channel Redd Counts The M&E staff attempted to perform weekly redd counts in the PRH discharge channel between November 3 and November 29. These surveys were attempted on November 3, 9, and 16. Staff was unable to identify specific redds due to high levels of superimposition in all areas with suitable spawning substrate. The majority of spawning activity was located in a 150m section of the discharge channel downstream of the volunteer trap.
15.0 Carcass Surveys Stream (carcass) surveys were performed from November 2 through December 10, 2012. With support of the PRH M&E Program, the number of crews was increased from the typical two boats with a two person crew operating seven days a week to three boats with a three-person crew operating seven days per week. All recovered carcasses were sampled for the presence of a coded-wire tag and at a 1:4 rate for scales (age), otoliths, gender, length, and egg retention. All carcasses recovered were chopped in half after sampling to prevent the chance of double sampling.
Similar to methods for the 2010 and 2011 carcass surveys, the 2012 stream survey crews recorded the sections in which carcasses were recovered in the Hanford Reach and adjacent areas. The Hanford Reach survey is divided into Sections 1 through 5 (Figure 6). The Priest

© 2013, PUBLIC UTILITY DISTRICT NO. 2 OF GRANT COUNTY, WASHINGTON. ALL RIGHTS RESERVED UNDER U.S. AND FOREIGN LAW, TREATIES AND CONVENTIONS.
30
Rapids Pool is designated as Section 6. The PRH discharge channel and the area of the Columbia River immediately below the discharge channel are designated as Sections 7 and 8, respectively. The fall Chinook salmon carcasses recovered in Section8 are likely wash outs from the hatchery discharge channel.
• Section 1. Priest Rapids Dam to Vernita Bridge (14 km)
• Section 2. Vernita Bridge to Island 2 (19 km)
• Section 3. Island 2 to Power line Towers at Hanford town site (21 km)
• Section 4. Power line Towers to Wooded Island (21 km)
• Section 5. Wooded Island to Interstate 182 Bridge (19 km)
• Section 6. Priest Rapids Pool (34 km)
• Section 7. Priest Rapids Hatchery discharge channel (0.5 km)
• Section 8. Columbia River at the mouth of the Hatchery discharge channel (0.5 km)
Figure 6 Locations of aerial redd index areas and river survey sections in the Hanford
Reach. 15.1 Hanford Reach Carcass Survey: Section 1 – 5
Crews surveyed the river and shorelines by boat and by foot. The majority of the carcasses were collected in Sections 3 and 4 within and immediately downstream of large spawning areas (Table 26). It’s apparent that carcasses from post spawn fall Chinook salmon in the Hanford Reach tend to be displaced downstream from the spawning areas and collect in eddies created by the island complexes within the Hanford Reach. Section 2 is largely comprised of relatively steep symmetrical shorelines with marginal spawning habitat. Historically, few carcasses are observed in Section 2.

© 2013, PUBLIC UTILITY DISTRICT NO. 2 OF GRANT COUNTY, WASHINGTON. ALL RIGHTS RESERVED UNDER U.S. AND FOREIGN LAW, TREATIES AND CONVENTIONS.
31
15.1.1 Numbers Sampled: Sections 1 – 5 Staff sampled 6,814 Chinook salmon in the Hanford Reach in 2012, 12% of the estimated fall Chinook salmon escapement (Table 32). For the period of 1990 through 2012, river survey crews sampled an average of 6,145 fall Chinook salmon per year (Appendix G).
Table 32 Numbers and Percentages of fall Chinook salmon carcasses sampled within each survey section on the Hanford Reach.
Return Year # 1 # 2 # 3 # 4 # 5 Total 2010 1,832 (18.7%) 519 (5.3%) 3,129 (32.0%) 3,362 (34.4%) 937 (9.6%) 9,779
2011 1,581 (18.8%) 160 (1.9%) 2,606 (31.1%) 2,622 (31.2%) 1,422 (16.9%) 8,391
2012 1,091 (16.0%) 149 (2.2%) 1,685 (24.7%) 2,213 (32.5%) 1,676 (24.6%) 6,814
Mean 1,501 (18.0%) 276 (3.3%) 2,473 (29.7%) 2,732 (32.8%) 1,345 (16.2%) 8,328
The survey effort was not equal for each section. The lower sections, 3, 4 and 5 were surveyed the most (Table 33). As the season progressed, crews focused their effort in the lower sections which provided higher chances to recover carcasses.
Table 33 Number of carcass surveys conducted by section in the Hanford Reach. Return Year # 1 # 2 # 3 # 4 # 5 Total
2010 21 6 26 26 11 90 2011 33 5 38 29 13 118 2012 19 4 26 28 24 101
15.1.2 Proportion of Escapement Sampled: Section 1 – 5 The spawning escapement for sections 1 through 5 was estimated by the proportion of redds counted in aerial surveys to the estimated escapement of natural spawners to the Hanford Reach (see Section 1.14 Redd Surveys).
Overall, 12% of the total spawning escapement of fall Chinook salmon in the Hanford Reach were sampled in 2012 (Table 34). The percentages of the escapement sampled among sections varied from 0% to 60%. The high sample rate in Section 4 is due to a combination of low numbers of redds identified in the section and a high amount carcass drift from redds located upstream.
Table 34 Number of redds and carcasses, total spawning escapement, and proportion of escapement sampled for fall Chinook salmon in Sections 1 through 5 of the Hanford Reach, 2012.
Survey Section
Total Number of Redds
Total Number of Carcasses
Spawning Escapement1 Escapement Sampled
HR-1 2,318 1,091 15,964 0.068 HR-2 965 149 6,646 0.022 HR-3 4,552 1,685 31,350 0.054 HR-4 533 2,213 3,671 0.602 HR-5 0 1676 0 0.000 Total 8,368 6,814 57,631 0.118
1 Calculated based on percent of redds
15.1.3 Carcass Distribution and Origin Two methods were used to estimate the origin of carcasses recovered in the sections 1 through 5. Historically, the assumption was made that all Chinook salmon unaccounted for from hatchery

© 2013, PUBLIC UTILITY DISTRICT NO. 2 OF GRANT COUNTY, WASHINGTON. ALL RIGHTS RESERVED UNDER U.S. AND FOREIGN LAW, TREATIES AND CONVENTIONS.
32
Chinook salmon coded-wire tag expansions were assumed to be natural origin fall Chinook salmon. The origins based on this assumption were calculated for the 2012 carcass recoveries. In addition, origins of carcasses were determined by otoliths sub-sampled from the 2012 carcass recoveries.
PRH has annually otolith marked their entire juvenile releases beginning with progeny of broodyear 2007. For the 2012 returns, age-1 through 5 PRH origin fall Chinook salmon recovered during the carcass surveys were otolith marked. The age-6 PRH origin fall Chinook salmon were not otolith marked. However, since there were no age-6 fish recovered in the carcass surveys nor did any age-6 fish return to the PRH, it is assumed that few, if any, PRH origin age-6 fish spawned in the Hanford Reach.
Based on expansions of coded-wire tag recoveries, hatchery origin fish comprised 7% of the naturally spawning fall Chinook salmon in the Hanford Reach during return year 2012, similar to the historic mean (Table 35). Over the past 15 years (return years 1997-2011), hatchery origin Chinook salmon comprised 10% of the fall Chinook salmon spawning naturally in the Hanford Reach (Appendix H). During return year 2012, the percentage of hatchery origin fish estimated from expanded coded-wire tag recoveries consists of roughly 5% from PRH, 2% from RSH and <1% for other hatcheries.

© 2013, PUBLIC UTILITY DISTRICT NO. 2 OF GRANT COUNTY, WASHINGTON. ALL RIGHTS RESERVED UNDER U.S. AND FOREIGN LAW, TREATIES AND CONVENTIONS.
33
Table 35 Numbers of natural and hatchery origin fall Chinook salmon carcasses sampled within Sections 1 through 5 of Hanford Reach based on expansions of coded-wire tag recoveries.
Return Year
Hanford Reach Sections Proportion Hatchery
Origin Origin # 1 # 2 # 3 # 4 # 5 Total
2002 Natural 7,704 Hatchery 698 0.083
2003 Natural 12,278 Hatchery 1,246 0.092
2004 Natural 9,935 Hatchery 907 0.084
2005 Natural 7,606 Hatchery 885 0.104
2006 Natural 5,627 Hatchery 345 0.058
2007 Natural 3,186 Hatchery 129 0.039
2008 Natural 5,202 Hatchery 253 0.046
2009 Natural 4,907 Hatchery 411 0.077
2010 Natural 1,751 473 3,020 3,242 909 9,395 Hatchery 81 46 116 125 28 396 0.040
2011 Natural 1,350 155 2,520 2,475 1,347 7,847 Hatchery 231 5 86 147 75 544 0.065
2012 Natural 1,142 149 1,526 2,081 1,510 6,308 Hatchery 49 0 159 132 166 506 0.074
Mean Natural 1,414 259 2,355 2,599 1,255 7,272 Hatchery 120 17 120 135 90 575 0.073
The second estimate of origin of carcass recoveries is based on a combination of otolith recoveries in the carcass survey, in-sample coded-wire tag recoveries, and recovery of in-sample adipose clipped fish without a coded-wire tag or otolith mark. PRH origin fall Chinook salmon were identified by either the presence of an otolith specific to PRH or by the presence of a PRH origin coded-wire tag. Non adipose Chinook salmon without a coded-wire tag and without a thermal otolith mark were classified as strays from other hatcheries. The natural origin fish were identified by either a Hanford Reach origin coded-wire tag or by the presence of an adipose fin and the absence of an otolith mark.
It is estimated that overall 13.1% of fall Chinook salmon spawning in the Hanford Reach were hatchery origin (Table 36). The recovery of PRH origin spawners is estimated at roughly 7%. The recovery of strays from other hatcheries is estimated at roughly 6%. The majority of carcasses for both hatchery and natural origin were recovered in the lower three sections of the survey.
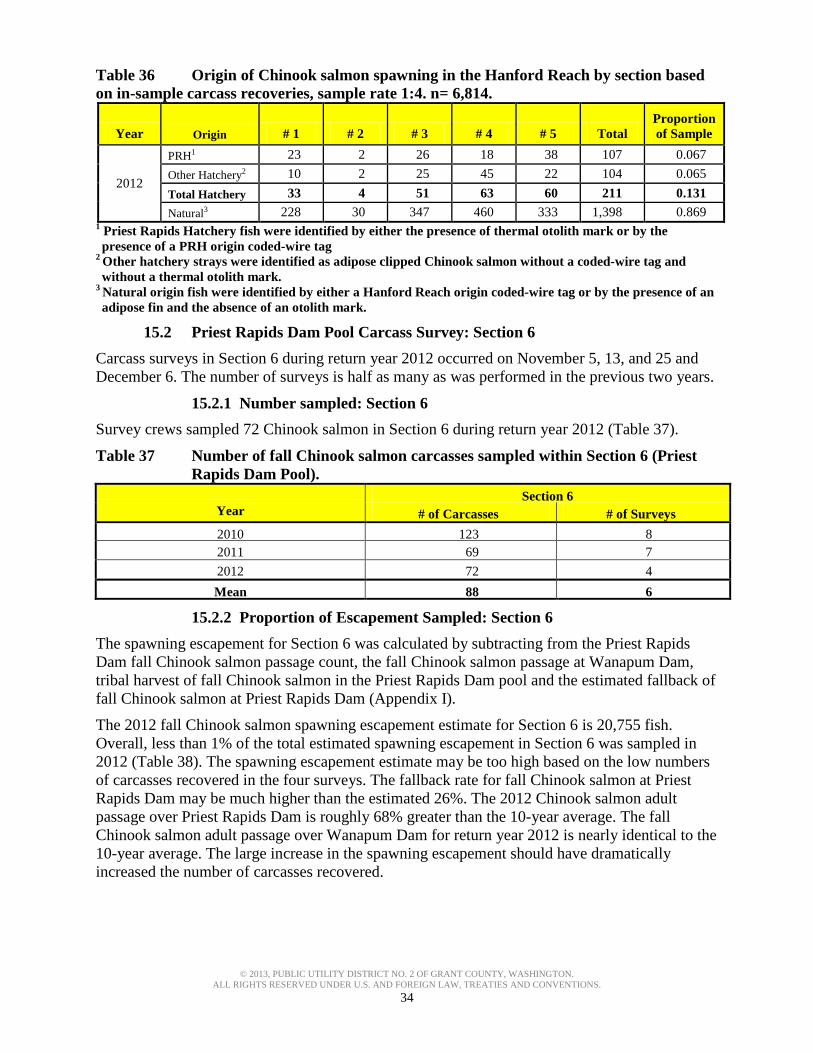
© 2013, PUBLIC UTILITY DISTRICT NO. 2 OF GRANT COUNTY, WASHINGTON. ALL RIGHTS RESERVED UNDER U.S. AND FOREIGN LAW, TREATIES AND CONVENTIONS.
34
Table 36 Origin of Chinook salmon spawning in the Hanford Reach by section based on in-sample carcass recoveries, sample rate 1:4. n= 6,814.
Year Origin # 1 # 2 # 3 # 4 # 5 Total Proportion of Sample
2012
PRH1 23 2 26 18 38 107 0.067 Other Hatchery2 10 2 25 45 22 104 0.065 Total Hatchery 33 4 51 63 60 211 0.131 Natural3 228 30 347 460 333 1,398 0.869
1 Priest Rapids Hatchery fish were identified by either the presence of thermal otolith mark or by the presence of a PRH origin coded-wire tag
2 Other hatchery strays were identified as adipose clipped Chinook salmon without a coded-wire tag and without a thermal otolith mark.
3 Natural origin fish were identified by either a Hanford Reach origin coded-wire tag or by the presence of an adipose fin and the absence of an otolith mark.
15.2 Priest Rapids Dam Pool Carcass Survey: Section 6 Carcass surveys in Section 6 during return year 2012 occurred on November 5, 13, and 25 and December 6. The number of surveys is half as many as was performed in the previous two years.
15.2.1 Number sampled: Section 6 Survey crews sampled 72 Chinook salmon in Section 6 during return year 2012 (Table 37).
Table 37 Number of fall Chinook salmon carcasses sampled within Section 6 (Priest Rapids Dam Pool).
Year Section 6
# of Carcasses # of Surveys 2010 123 8 2011 69 7 2012 72 4 Mean 88 6
15.2.2 Proportion of Escapement Sampled: Section 6 The spawning escapement for Section 6 was calculated by subtracting from the Priest Rapids Dam fall Chinook salmon passage count, the fall Chinook salmon passage at Wanapum Dam, tribal harvest of fall Chinook salmon in the Priest Rapids Dam pool and the estimated fallback of fall Chinook salmon at Priest Rapids Dam (Appendix I).
The 2012 fall Chinook salmon spawning escapement estimate for Section 6 is 20,755 fish. Overall, less than 1% of the total estimated spawning escapement in Section 6 was sampled in 2012 (Table 38). The spawning escapement estimate may be too high based on the low numbers of carcasses recovered in the four surveys. The fallback rate for fall Chinook salmon at Priest Rapids Dam may be much higher than the estimated 26%. The 2012 Chinook salmon adult passage over Priest Rapids Dam is roughly 68% greater than the 10-year average. The fall Chinook salmon adult passage over Wanapum Dam for return year 2012 is nearly identical to the 10-year average. The large increase in the spawning escapement should have dramatically increased the number of carcasses recovered.

© 2013, PUBLIC UTILITY DISTRICT NO. 2 OF GRANT COUNTY, WASHINGTON. ALL RIGHTS RESERVED UNDER U.S. AND FOREIGN LAW, TREATIES AND CONVENTIONS.
35
Table 38 Carcasses sampled, total spawning escapement and proportion of escapement sampled for fall Chinook salmon in Section 6 (Priest Rapids Dam pool).
Survey Year # of Surveys # of
Carcasses Spawning Escapement Escapement Sampled 2010 8 123 11,121 0.011 2011 7 69 11,362 0.006 2012 4 72 21,919 0.003 Mean 6 88 14,801 0.006
15.2.3 Carcass Distribution and Origin: Section 6 The origin of carcass recoveries is based on a combination of otolith recoveries in the carcass survey, in-sample coded-wire tag recoveries, and recovery of in-sample adipose clipped fish without a coded-wire tag or otolith mark. PRH origin fall Chinook salmon were identified by either the presence of an otolith mark specific to PRH or by the presence of a PRH origin coded-wire tag. Adipose clipped Chinook salmon without a coded-wire tag and without a thermal otolith mark were classified as strays from other hatcheries. The natural origin fish were identified by either a Hanford Reach origin coded-wire tag or by the presence of an adipose fin and the absence of an otolith mark.
It’s estimated that roughly 29% of fall Chinook salmon spawning in the section-6 were hatchery origin (Table 39). Of the hatchery stray carcasses recovered, 26% were PRH origin and 3% were strays from other hatcheries. Natural origin fish composed 71% of the total carcass recovered.
Table 39 Origin of fall Chinook salmon spawning in Section 6 (Priest Rapids Dam Pool).
Year Origin Total Proportion
2012
PRH1 18 0.257 Other Hatchery2 2 0.029 Total Hatchery 20 0.286 Natural3 50 0.714
1 Priest Rapids Hatchery fish were identified by either the presence of thermal otolith mark or by the presence of a PRH origin coded-wire tag
2 Other hatchery strays were identified as adipose clipped Chinook salmon without a coded-wire tag and without a thermal otolith mark.
3 Natural origin fish were identified by either a Hanford Reach origin coded-wire tag or by the presence of an adipose fin and the absence of an otolith mark.
15.3 Hatchery Discharge Channel: Sections 7 and 8 Carcass Survey During return year 2012, crews performed eight carcass surveys in Section 7, the confluence of the discharge channel and river. Only two carcass surveys occurred in Section 8. It is assumed that most carcasses drift out of the discharge channel under full flow conditions. Attempts to survey those carcasses result in numerous surveys in Section 7. Performing carcass surveys in the discharge channel when it is at full flow is very difficult and dangerous. One survey was performed during full flow conditions. The last survey in Section 8 occurred after the PRH discharge was shut off and the channel reduced to very low levels of ground water flow.

© 2013, PUBLIC UTILITY DISTRICT NO. 2 OF GRANT COUNTY, WASHINGTON. ALL RIGHTS RESERVED UNDER U.S. AND FOREIGN LAW, TREATIES AND CONVENTIONS.
36
15.3.1 Number sampled: Sections 7 and 8 Survey crews recovered and sampled 99 carcasses in the discharge channel (Table 40). An additional 108 carcasses were recovered and sampled in the Columbia River immediately downstream of the discharge channel. Crews conducted three surveys in Section 7 and ten surveys in Section 8.
Table 40 The number of fall Chinook salmon carcass surveys within Section 7 (Priest Rapids Hatchery Discharge Channel) and Section 8 (Columbia River at the confluence of the hatchery discharge channel).
Year
Section 7 Section 8 Total
# of Carcasses
# of Surveys
# of Carcasses
# of Surveys
# of Carcasses
# of Surveys
2010 87 1 123 9 210 10
2011 123 2 80 8 203 10
2012 99 3 108 10 207 13
2 Yr (2010 – 2011) Mean 105 2 102 9 207 10
15.3.2 Proportion of Escapement Sampled: Sections 7 and 8 The 2012 fall Chinook salmon spawning escapement estimate for Sections 7 and 8 is 207 fish (Table 41). The spawning escapement for these Sections was estimated based on the total number of carcasses recovered in the surveys. Crews were unable to successfully perform redd counts in the PRH discharge channel due to very high level of redd superimposition.
Table 41 Number of carcasses sampled, total spawning escapement and proportion of escapement sampled for fall Chinook salmon within Section 7 (Priest Rapids Hatchery Discharge Channel) and Section 8 (Columbia River at the confluence of the hatchery discharge channel).
Section Total Number of Carcasses Spawning Escapement Escapement Sampled # 7 99 207 0.478 # 8 108 0 0.000
Total 207 207 1.000
15.3.3 Carcass Distribution and Origin: Sections 7 and 8 Origin of carcass recoveries is based on a combination of otolith recoveries in the carcass survey, in-sample coded-wire tag recoveries, and recovery of in-sample adipose clipped fish without a coded-wire tag or otolith mark. PRH origin fall Chinook salmon were identified by either the presence of an otolith mark specific to PRH or by the presence of a PRH origin coded-wire tag. Adipose clipped Chinook salmon without a coded-wire tag and without a thermal otolith mark were classified as strays from other hatcheries. Natural origin fish were identified by either a Hanford Reach origin coded-wire tag or by the presence of an adipose fin and the absence of an otolith mark. It is estimated that 58% of fall Chinook salmon recovered in the Sections 7 and 8 were hatchery origin (Table 42). Of the hatchery stray carcasses recovered 47% were PRH origin and 11% were strays from other hatcheries. Natural origin fish comprised 42% of the total carcasses recovered.

© 2013, PUBLIC UTILITY DISTRICT NO. 2 OF GRANT COUNTY, WASHINGTON. ALL RIGHTS RESERVED UNDER U.S. AND FOREIGN LAW, TREATIES AND CONVENTIONS.
37
Table 42 The origin of Chinook salmon carcasses recovered within Section 7 (Priest Rapids Hatchery Discharge Channel) and Section 8 (Columbia River at the confluence of the hatchery discharge channel).
Return Year Origin Total Proportion
2012
PRH1 21 0.467 Other Hatchery2 5 0.111 Total Hatchery 26 0.578 Natural3 19 0.422
1 Priest Rapids Hatchery fish were identified by either the presence of thermal otolith mark or by the presence of a PRH origin coded-wire tag
2 Other hatchery strays were identified as Non adipose Chinook salmon without a coded-wire tag and without a thermal otolith mark were.
3 Natural origin fish were identified by either a Hanford Reach origin coded-wire tag or by the presence of an adipose fin and the absence of an otolith mark.
15.4 Carcass Bias Assessment In 2012, crews tagged and released 989 of the carcasses collected during the river surveys to evaluate potential age (size) and gender bias that might be associated with the collection of post-spawn fall Chinook carcasses in the Hanford Reach. Carcasses collected and used for age composition were tagged with a 3” x 2 ½” numbered cow ear tag and released either near shore or mid river (Figure 7).
Figure 7 Tagged fall Chinook salmon, carcass bias assessment. Those carcasses released near shore had the highest proportion of recaptures at 21% whereas only roughly 7% of those fish marked and released mid channel were recaptured (Table 43). Overall, roughly 14% of the marked fish were recaptured. Age and gender composition of the

© 2013, PUBLIC UTILITY DISTRICT NO. 2 OF GRANT COUNTY, WASHINGTON. ALL RIGHTS RESERVED UNDER U.S. AND FOREIGN LAW, TREATIES AND CONVENTIONS.
38
carcasses recaptured differed slightly from the composition at release for the age-2 and 3 males and age-5 females. The recovery rate is higher for larger fish. This was the second year that a carcass bias study was performed in conjunction with the Hanford Reach stream survey. Results provided in Table 44 for the 2011 carcass bias study show less recovery bias for small fish than that of the 2012 study; however, the percentage of age-2 and 3 fish marked during 2011 was lower than during 2012. Perhaps the higher percentage of larger fish marked in 2011 compared to 2012 contributed to the higher total carcass recovery rate (17%) in 2011.
Table 43 Summary of mark recapture of post-spawn fall Chinook salmon in the Hanford Reach, 2012.
Release Location Total Bank Mid-Channel Released
Released 491 498 989 Recaptured 103 34 137 Recapture (%) 21.0 6.8 13.9
Mark Release Fall Chinook Salmon
Gender Age 2 Age 3 Age 4 Age 5 Age 6 Total # % # % # % # % # % # %
Male 43 4.3 225 22.8 155 15.7 99 10.0 0 0.0 522 52.8 Female 0 0.0 45 4.6 237 24.0 185 18.7 0 0.0 467 47.9 Total 43 4.3 270 27.3 392 49.6 284 28.7 0 0.0 989 100.0
Recaptures
Gender Age 2 Age 3 Age 4 Age 5 Age 6 Total # % # % # % # % # % # %
Male 0 0.0 22 31.4 11 15.7 7 10.0 0 0.0 40 57.1 Female 0 0.0 2 2.9 17 24.3 11 15.7 0 0.0 30 42.9 Total 0 0.0 24 34.3 28 40.0 18 25.7 0 0.0 70 100.0
Bias (%) Gender Age 2 Age 3 Age 4 Age 5 Age 6 Total Male 4.3 -8.7 0.0 0.0 0.0 -4.4 Female 0.0 1.7 0.0 3.0 0.0 4.4 Total 4.3 -7.0 0.0 3.0 0.0 0.0

© 2013, PUBLIC UTILITY DISTRICT NO. 2 OF GRANT COUNTY, WASHINGTON. ALL RIGHTS RESERVED UNDER U.S. AND FOREIGN LAW, TREATIES AND CONVENTIONS.
39
Table 44 Summary of mark recapture of post-spawn fall Chinook salmon in the Hanford Reach, 2011.
Release Location Total Bank Mid-River Unknown Released
Released 495 487 11 993 Recaptured 108 59 4 167 Recapture (%) 21.8 12.1 36.4 16.8
Mark Release Fall Chinook Salmon
Gender Age 2 Age 3 Age 4 Age 5 Age 6 Total # % # % # % # % # % # %
Male 26 2.6 82 8.3 230 23.2 63 6.3 0.0 401 40.4 Female 0.0 24 2.4 469 47.2 97 9.8 2 0.0 592 59.6 Total 26 2.6 106 10.7 699 70.4 160 16.1 2 0.0 993
Recaptures
Gender Age 2 Age 3 Age 4 Age 5 Age 6 Total # % # % # % # % # % # %
Male 3 1.8 15 8.8 45 26.3 10 5.8 0.0 73 42.7 Female 0.0 3 1.8 74 43.3 21 12.3 0.0 98 57.3 Total 3 1.8 18 10.5 119 69.6 31 18.1 0 0.0 171
Bias (%) Gender Age 2 Age 3 Age 4 Age 5 Age 6 Total Male 0.9 -0.5 -3.2 0.5 0.0 -2.3 Female 0.0 0.7 4.0 -2.5 0.0 2.3 Total 0.9 0.1 0.8 -2.0 0.0 0.0
16.0 Life History Monitoring Life history characteristics of Hanford Reach fall Chinook salmon were assessed by examining carcasses on spawning grounds, fish collected or examined at broodstock collection sites, and by reviewing tagging data and fisheries statistics.
For the 2012 returns, the origin of fall Chinook salmon for the comparison of age and length at maturity is based on a combination of otolith recoveries, in-sample coded-wire tag recoveries, and recovery of in-sample adipose clipped fish without a coded-wire tag or otolith mark. PRH origin fall Chinook salmon were identified by either the presence of an otolith mark specific to PRH or by the presence of a PRH origin coded-wire tag. Non adipose Chinook salmon without a coded-wire tag and without an otolith mark were classified as strays from other hatcheries. The natural origin fish were identified by either a Hanford Reach origin coded-wire tag or by the presence of an adipose fin and the absence of an otolith mark and hatchery CWT.
The age composition for the natural origin fall Chinook salmon is assembled from the carcass recoveries in sections 1-5 of the Hanford Reach. The age composition for the PRH origin fall Chinook salmon is assembled from the volunteer returns to PRH. Prior to return year 2012, the determination of origin employed the assumption that all fish collected in the Hanford Reach, except for those that were of known hatchery origin (e.g., ad-clipped or coded-wire tagged), were natural origin.
The samples collected at PRH and in the Hanford Reach carcass surveys is expanded to account for different sample rates and then pooled by origin to provide larger sample sizes for both length and age by origin analysis. Despite pooling the samples, the sample size for natural origin age-2 Chinook salmon is small in comparison to the other age classes sampled.

© 2013, PUBLIC UTILITY DISTRICT NO. 2 OF GRANT COUNTY, WASHINGTON. ALL RIGHTS RESERVED UNDER U.S. AND FOREIGN LAW, TREATIES AND CONVENTIONS.
40
Migration timing of hatchery and natural origin Hanford Reach fall Chinook salmon is determined from data collected at the Off Ladder Adult Fish Trap at Priest Rapids Dam. Fall Chinook salmon were sampled at the OLAFT from September 5 through November 14 in return year 2012. In addition, arrival timing to McNary Dam based on PIT tag observations at the adult fish ladder for both PRH and Hanford Reach origin fall Chinook salmon is provided; however, the PIT tag groups were relatively small (<100 fish).
16.1 Migration Timing Adipose clipped and non-adipose clipped fall Chinook salmon sampled at the OLAFT were used as imperfect surrogates for hatchery and natural origin fall Chinook salmon. There is no hatchery production of fall Chinook salmon above Priest Rapids Dam and no marking programs for natural origin fall Chinook salmon above the dam. The estimated numbers for hatchery fish are likely to be accurate, but the estimated numbers of natural origin fish are likely to be muddled by a large number of unclipped PRH fish. For purposes of this analysis it is assumed that fall Chinook salmon migrating into the Hanford Reach have similar timing as those migrating above Priest Rapids Dam. There does appear to be sufficient numbers of adipose clipped Chinook salmon, presumably PRH origin, to estimate migration timing. Fall Chinook salmon are considered to begin passing Priest Rapids Dam on August 14. These estimates may be biased by late migrating summer Chinook that have a large component of adipose clipped hatchery production. The OLAFT studies (Tonseth et al. in preparation) and the return of adults from 40,000 PIT tagged juveniles will provide better estimates of migration timing in the future.
Based on sampling at the OLAFT during return year 2012, the arrival timing to Priest Rapids Dam for both hatchery and natural fall Chinook salmon was similar (Table 45).
Table 45 The week that 10%, 50% (median), and 90% of the natural (unclipped) and hatchery (clipped) origin fall Chinook salmon passed Priest Rapids Dam, 2009 – 2012. The average week is also provided. Migration timing is based on collection of run of the river Chinook salmon collected and sampled in the Off Ladder Adult Fish Trap at Priest Rapids Dam.
Survey year Origin
Hanford Reach Fall Chinook Migration Time (week)
10 Percentile 50 Percentile 90 Percentile Sample size
2009 Natural 34 37 41 1,269 Hatchery 33 35 38 418
2010 Natural 37 39 41 1,988 Hatchery 34 36 41 387
2011 Natural 34 38 42 2,732 Hatchery 33 34 39 668
2012 Natural 36 39 43 844 Hatchery 37 39 43 476
Mean Natural 35 38 42 1,708 Hatchery 34 36 40 487
We reviewed the PIT tag observations for both PRH and Hanford Reach natural origin fall Chinook salmon at the PIT tag arrays in the McNary Dam adult fish ladders to assess arrival timing. The sample size is relatively small due to the low numbers of both hatchery and natural origin fall Chinook salmon PIT tagged in the Hanford Reach. The adult PIT tag detections at McNary Dam are useful to compare migration timing then PIT tag detections at Priest Rapids Dam because very few Hanford Reach natural origin PIT tagged fall Chinook salmon pass

© 2013, PUBLIC UTILITY DISTRICT NO. 2 OF GRANT COUNTY, WASHINGTON. ALL RIGHTS RESERVED UNDER U.S. AND FOREIGN LAW, TREATIES AND CONVENTIONS.
41
upstream of Priest Rapids Dam; Hence, are not represented in the Priest Rapids Dam PIT tag observations. Similar to observations at the OLAFT, the PIT tag observations at McNary showed that arrival timing is similar between hatchery and natural origin fish (Table 46).
Table 46 The week that 10%, 50% (median), and 90% of the natural and hatchery origin fall Chinook salmon passed McNary Dam, 2010 – 2012. Migration timing is based on PIT tag passage of Hanford wild and Priest Rapids Hatchery in the adult fish ladder at McNary Dam.
Return Year Origin
Hanford Reach Fall Chinook Migration Time (week) 10 Percentile 50 Percentile 90 Percentile Sample size
2010 Natural 38 39 41 43 Hatchery 36 39 40 24
2011 Natural 36 37 41 45 Hatchery 36 38 39 17
2012 Natural 35 38 40 40 Hatchery 36 37 39 23
Mean Natural 36 38 41 43 Hatchery 36 38 39 21
16.2 Age at Maturity Historically, the age composition for hatchery origin returns to PRH was generated by pooling all of the sub samples for the volunteer trap and ponded fish after expanding for differing sample rates. The origin was assigned by location of survey due to the lack of identifiable hatchery marks and low coded-wire tag recoveries that were not representative for natural origin fish recovered at PRH. The age composition for natural origin returns was generated from all the samples collected within the carcass survey. Similar to the assignment origin for the hatchery survey, the origin was assigned by location of survey due to the lack of identifiable hatchery marks and low coded-wire tag recoveries that were non representative for natural origin fish recovered in the carcass survey. For the 2012 returns, the origin of fish for the age at maturity is based on otolith sampling.
The age composition of return year 2012 natural origin fall Chinook salmon spawning escapement in the Hanford Reach consists of primarily age-4 and 5 (Table 47). The smaller age-2 and 3 Chinook salmon may be under represented due to a size bias in the carcass survey. There was no age-6 Chinook salmon recovered during the Hanford Reach carcass survey.
The age composition of PRH origin volunteer fall Chinook salmon returning to the hatchery in return year 2012 is comprised of mainly of age-3 and 4 fish. There was no age-6 Chinook salmon sampled among the hatchery volunteer returns.

© 2013, PUBLIC UTILITY DISTRICT NO. 2 OF GRANT COUNTY, WASHINGTON. ALL RIGHTS RESERVED UNDER U.S. AND FOREIGN LAW, TREATIES AND CONVENTIONS.
42
Table 47 Age compositions of natural origin and Priest Rapids Hatchery adult fall Chinook salmon sampled on spawning grounds in the Hanford Reach and at the Hatchery.
Survey Year Origin
Age Composition (%)
2 3 4 5 6
1998 Natural 0.169 0.157 0.111 0.554 0.009 Hatchery 0.104 0.647 0.114 0.135 0.001
1999 Natural 0.094 0.115 0.615 0.164 0.012 Hatchery 0.003 0.261 0.717 0.018 0.001
2000 Natural 0.250 0.058 0.279 0.413 0.000 Hatchery 0.082 0.085 0.429 0.404 0.000
2001 Natural 0.262 0.164 0.398 0.164 0.010 Hatchery 0.060 0.685 0.195 0.057 0.004
2002 Natural 0.179 0.135 0.502 0.183 0.001 Hatchery 0.023 0.434 0.512 0.031 0.000
2003 Natural 0.111 0.047 0.494 0.348 0.001 Hatchery 0.138 0.128 0.663 0.071 0.000
2004 Natural 0.094 0.125 0.191 0.570 0.021 Hatchery 0.051 0.697 0.120 0.131 0.000
2005 Natural 0.106 0.099 0.498 0.288 0.009 Hatchery 0.013 0.287 0.639 0.059 0.002
2006 Natural 0.089 0.100 0.507 0.293 0.010 Hatchery 0.039 0.184 0.447 0.326 0.004
2007 Natural 0.376 0.061 0.341 0.206 0.016 Hatchery 0.573 0.161 0.202 0.057 0.008
2008 Natural 0.196 0.156 0.298 0.348 0.002 Hatchery 0.058 0.864 0.050 0.028 0.001
2009 Natural 0.283 0.074 0.463 0.181 0.000 Hatchery 0.244 0.087 0.657 0.012 0.000
2010 Natural 0.076 0.252 0.378 0.292 0.001 Hatchery 0.139 0.762 0.056 0.043 0.000
2011 Natural 0.127 0.107 0.622 0.143 0.002 Hatchery 0.155 0.288 0.552 0.005 0.000
2012 Natural 0.022 0.240 0.403 0.334 0.000 Hatchery 0.335 0.515 0.114 0.036 0.000
Mean Natural 0.162 0.126 0.407 0.299 0.006 Hatchery 0.134 0.406 0.364 0.094 0.001
For 1998 – 1999, hatchery origin fish include all fish sampled at the hatchery regardless of true origin. Similarly, natural origin fish for the same years include all fish sampled in the stream surveys regardless of true origin. The hatchery origin fish reported for 2012 include only fish possessing hatchery marks or tags sampled at Priest Rapids Hatchery. Similarly, the natural origin fish reported for 2012 include only fish sampled in the stream surveys that did not possess any hatchery markings or tags.
For the 2012 adult returns, natural origin fall Chinook salmon from the Hanford Reach typically return at older ages than PRH origin fish (Figure 8). Age-4 and 5 fall Chinook salmon comprise the majority of natural origin returns to the Hanford Reach for return year 2012 and is similar to the age composition for the ten-year mean. Historically, PRH returns have been largely age-3 and 4 fish. The high number of hatchery origin age-2 returns in 2012 altered the age composition such that age-3 and 2 fish made up the majority of the PRH returns. There are very few recoveries of either natural or hatchery origin age-6 fall Chinook salmon in the stream and hatchery surveys.

© 2013, PUBLIC UTILITY DISTRICT NO. 2 OF GRANT COUNTY, WASHINGTON. ALL RIGHTS RESERVED UNDER U.S. AND FOREIGN LAW, TREATIES AND CONVENTIONS.
43
Figure 8 Age proportions of adult returns of natural and Priest Rapids Hatchery
origin fall Chinook sampled at PRH and on spawning grounds in the Hanford Reach, Return Year 2012.
16.3 Size at Maturity Historically, the length by age comparisons for hatchery origin returns to PRH were generated by combining all of the samples collected from the volunteer trap and ponded fish without previously expanding each sample group to account for differing sampling rates. The origin was assigned by location of survey due to the lack of identifiable hatchery marks and low coded-wire tag recoveries that were not representative for natural origin fish recovered at PRH. The age composition for natural origin returns was generated from the samples collected from the carcass survey. Similar to the assignment origin for the hatchery survey, the origin was assigned by location of survey due to the lack of identifiable hatchery marks and low coded-wire tag recoveries that were non representative for natural origin fish recovered in the carcass survey.
For the 2012 returns, the origin for the size at maturity comparison was determined by otolith marks. Natural origin fish sampled at PRH are not included this data nor are hatchery origin fish sampled in the stream surveys due to differing sampling methods. The length by age class for PRH origin fall Chinook salmon returning to PRH in 2012 was generated by combining non-expanded samples at PRH for volunteer trap (rate 1:10) and broodstock (rate 1:4). Otolith specimens for the mortalities and surplus of ponded fish (N=2,680) were not submitted for examination of origin. Hence, the data from this group is not included in the length by age comparison.
For the 2012 returns, there are some differences in length-at-age between natural and hatchery origin fall Chinook salmon (Table 48 and 49). Mean fork length of age-2 hatchery origin fall Chinook salmon is slightly larger than age-2 natural origin fall Chinook salmon. Mean lengths for age-3 fish of both groups are similar.
Mean length for natural origin age-4 and 5 fish are slightly larger than the hatchery origin fish. This trend is mirrored in the ten-year means for lengths by age.
0.000
0.100
0.200
0.300
0.400
0.500
0.600
Age 2 Age 3 Age 4 Age 5 Age 6
Prop
ortio
n by
Age
Natural
Hatchery

© 2013, PUBLIC UTILITY DISTRICT NO. 2 OF GRANT COUNTY, WASHINGTON. ALL RIGHTS RESERVED UNDER U.S. AND FOREIGN LAW, TREATIES AND CONVENTIONS.
44
Table 48 Mean fork length (cm) at age (total age) of Priest Rapids Hatchery origin fall Chinook salmon sampled at Priest Rapids Hatchery and natural origin fall Chinook salmon sampled in the Hanford Reach that spawned naturally. The mean is based on a ten-year period (2002 – 2011); n = sample size and SD = 1 standard deviation.
Return Year Origin
Fall Chinook fork length (cm)
Age-2 Age-3 Age-4 Age-5 Age-6
Mean n SD Mean n SD Mean n SD Mean n SD Mean n SD
2001 Natural 44 83 4 70 293 6 86 748 6 96 320 8 99 17 10
Hatchery 46 85 5 71 973 5 85 272 7 94 81 7 99 5 6
2002 Wild 44 17 4 70 227 6 86 860 7 98 309 8 97 1 0
Hatchery 44 25 5 70 488 5 85 547 6 99 33 8 0
2003 Wild 44 32 5 65 118 7 86 1,423 7 95 819 8 111 2 21
Hatchery 0 0 0 0 0
2004 Wild 46 31 4 69 251 6 82 428 6 93 1,085 7 96 12 9
Hatchery 52 80 4 69 1,040 5 82 196 6 92 170 6 0
2005 Wild 48 19 5 70 229 6 84 1,157 6 94 669 8 103 22 10
Hatchery 49 12 6 70 281 5 81 628 6 93 58 7 94 2 11
2006 Wild 47 34 4 69 42 7 86 194 8 93 288 7 96 6 9
Hatchery 55 19 4 70 93 6 84 246 6 91 183 6 103 2 10
2007 Wild 50 25 5 68 71 6 85 395 6 95 239 8 97 18 5
Hatchery 49 31 4 69 115 5 83 215 6 91 61 6 94 9 9
2008 Wild 48 20 4 70 202 6 84 386 6 96 450 8 99 2 6
Hatchery 45 3 3 73 429 4 84 51 5 91 20 4 73 1 0
2009 Wild 46 24 5 69 85 6 84 532 7 94 208 8 0
Hatchery 50 5 4 71 42 4 84 428 6 95 9 7 0
2010 Wild 50 34 4 72 642 6 86 962 6 96 744 8 91 2 1
Hatchery 52 22 5 71 1,149 4 84 170 6 91 180 6 0
2011 Wild 48 50 4 70 243 5 84 1,468 7 92 340 7 96 5 6
Hatchery 48 308 4 69 652 4 80 1,419 5 92 13 7 0
2012 Wild 45 33 4 68 372 6 84 604 7 92 481 7 0
Hatchery 48 281 3 68 636 5 81 268 9 87 93 7 0
Mean Wild 47 4 70 6 85 7 95 8 98 8
Hatchery 49 4 70 5 83 6 93 6 91 10

© 2013, PUBLIC UTILITY DISTRICT NO. 2 OF GRANT COUNTY, WASHINGTON. ALL RIGHTS RESERVED UNDER U.S. AND FOREIGN LAW, TREATIES AND CONVENTIONS.
45
Table 49 Mean fork length (cm) at age (total age) of Priest Rapids Hatchery origin fall Chinook salmon sampled at Priest Rapids Hatchery and natural origin fall Chinook salmon sampled in the Hanford Reach that spawned naturally. n = sample size and SD = standard deviation.
Return Year Origin
Male fall Chinook salmon fork lengths (cm)
Age-2 Age-3 Age-4 Age-5 Age-6
Mean N SD Mean N SD Mean N SD Mean N SD Mean N SD
2012 Wild 45 33 4 68 328 6 85 260 8 98 154 8 0 Hatchery 48 281 3 67 453 5 83 59 6 93 22 9 0
Return Year Origin
Female fall Chinook salmon fork lengths (cm)
Age-2 Age-3 Age-4 Age-5 Age-6
Mean N SD Mean N SD Mean N SD Mean N SD Mean N SD
2012 Wild 0 71 44 5 83 344 5 89 327 5 0 Hatchery 0 71 183 4 81 209 4 86 71 5 0
The origins of fish were determined by examination of otolith.
16.4 Contribution to Fisheries Coded-wire tag data from fisheries, spawning grounds, or from hatcheries in the Pacific Region are stored in the Regional Mark Processing Center (RMPC) database. The RMPC is the central repository for all coded-wire tagged and otherwise associated release, catch, sample, and recovery data regarding anadromous salmonids in the greater Pacific Coast Region of the United States of America (RMPC Strategic Plan 2006-2009). The Regional Mark Information System database (RMIS) within the RMPC provides specific recovery data for individual tag codes, along with the sample rate used to derive the total number of recoveries by fishery type. The RMIS database is the primary tool for estimating the survival and extraction rate of adipose fin-clipped and coded-wire tag hatchery releases. The RMIS database was queried for tag recoveries on May 2, 2013 to provide recoveries of coded-wire tagged PRH origin fish. The database for the 2006 brood may not be complete until January 1, 2014.
Beginning with the 2010 release year, a portion of the non-adipose clipped smolts release from PRH was coded-wire tagged as part of a double index tag study to evaluate the effect of mark selective fisheries. We are currently reviewing the data collected in the RMPC database to evaluate the results of the double index tagging for the PRH origin fish.
Fall Chinook salmon released from PRH supplement Pacific Ocean harvest for both commercial and sport fisheries from Washington to Southeast Alaska as well as Columbia River commercial, sport, and treaty tribal harvest. The Hanford Reach sport fishery for fall Chinook salmon is an extremely popular fishery. The fishery runs from August 1 to October 22 annually. In 2012, 18,854 fall Chinook salmon were harvested during this fishery, 13,141 adults and 5,713 jacks. Based on coded-wire tag expansions from tags recovered from the Hanford Reach sport fishery, 21% of the sport harvest in the Hanford Reach was comprised of PRH origin fall Chinook salmon (Table 50). Adult returns from Ringold Springs Hatchery comprised 10.5% of the sport fishery. All other hatcheries combined represent 1.3% of the harvest. Recent data from otolith samples indicates that coded-wire tag expansions may underestimate the number of PRH origin Chinook salmon returns at the hatchery and this is likely the situation when evaluating hatchery contributions to the sport fishery and the natural spawn. Otoliths were collected to determine origin in the sport fishery in 2012 in addition to coded-wire tags. The results from the otolith data

© 2013, PUBLIC UTILITY DISTRICT NO. 2 OF GRANT COUNTY, WASHINGTON. ALL RIGHTS RESERVED UNDER U.S. AND FOREIGN LAW, TREATIES AND CONVENTIONS.
46
for the 2012 Hanford Reach fall Chinook salmon sport fishery suggests that 35% were PRH origin fish, 2,621 more fish than estimated by coded-wire tags.
Table 50 Hatchery fall Chinook salmon contributions to harvest in the Hanford Reach fall Chinook salmon fishery. Coded-wire tag recoveries from RMIS database expanded by sample rate and tag rate.
Year Harvest & Sampling CWT Expansions % of Harvest
Harvest Sampled % Sampled PRH RSH Other PRH RSH Other 2003 7,190 1,848 25.7 510 424 43 7.1 5.9 0.6 2004 8,787 2,255 25.7 276 62 23 3.1 0.7 0.3 2005 7,974 1,834 23.0 1,200 265 35 15.0 3.3 0.4 2006 4,508 1,296 28.7 683 66 10 15.1 1.5 0.2 2007 6,466 1,812 28.0 929 50 89 14.4 0.8 1.4 2008 7,013 1,593 22.7 304 66 22 4.3 0.9 0.3 2009 8,806 1,741 19.8 520 0 10 5.9 0.0 0.1 2010 12,499 2,475 19.8 1,157 399 10 9.3 3.2 0.1 2011 14,262 2,715 19.0 1,558 663 121 10.9 4.6 0.8 2012 18,854 3,615 19.0 3,974 1,974 237 21.1 10.5 1.3
Mean 9,636 2,118 23.1 1,111 397 60 10.6 3.1 0.6
Coded-wire tag data for PRH origin fall Chinook salmon that possessed an adipose clip were reviewed to assess contributions to ocean, commercial, tribal, and sport fisheries. The largest proportion of the harvest of PRH origin fall Chinook salmon occurred in ocean fisheries followed by Zone-6 tribal harvest. For broodyears 1997 through 2006, 51% of the reported harvest was taken in ocean fisheries (Table 51).
Table 51 Coded-wire tag recoveries from the RMIS database by broodyear and harvest type expanded by tag rate and sample rate.
Brood Year
Ocean Fisheries
Columbia River Fisheries
Recoveries (N)
Tribal Commercial Recreational # % # % # % # %
1997 1,100 37% 1,506 50% 304 10% 91 3% 3,001 1998 6,580 48% 3,956 29% 1,066 8% 1,981 15% 13,583 1999 14,190 55% 5,908 23% 2,410 9% 3,458 13% 25,966 2000 4,938 61% 1,583 20% 1,099 14% 412 5% 8,032 2001 17,758 57% 6,612 21% 1,554 5% 5,484 17% 31,410 2002 3,779 51% 1,240 17% 576 8% 1,869 25% 7,463 2003 1,871 55% 570 17% 226 7% 757 22% 3,424 2004 562 49% 364 32% 214 19% 0 0% 1,140 2005 10,699 52% 5,975 29% 998 5% 2,871 14% 20,543 2006 1,023 44% 713 31% 288 12% 298 13% 2,322
Mean 6,250 51% 2,843 27% 874 10% 1,722 13% 12,729
17.0 Straying It has not been determined by fishery co-managers what constitutes independent populations for the purpose of evaluating straying of PRH fall Chinook salmon. However, distribution of PRH origin fish spawning in areas outside of the target stream is presented. The presumptive target spawning location for PRH origin fall Chinook salmon includes the section of Columbia River from McNary Dam to Wanapum Dam.

© 2013, PUBLIC UTILITY DISTRICT NO. 2 OF GRANT COUNTY, WASHINGTON. ALL RIGHTS RESERVED UNDER U.S. AND FOREIGN LAW, TREATIES AND CONVENTIONS.
47
The spawning escapement of PRH origin fall Chinook salmon by brood year is determined from coded-wire tag recoveries collected during spawning surveys. The coded-wire tag recoveries are expanded for mark rate and sampling rate to estimate total spawning escapement. The overall rate for fish from each brood year that spawned outside of the presumptive target area was calculated from the estimated recoveries of PRH origin fish from spawning grounds within and outside of the presumptive target area. Coded-wire tag recoveries at non-target hatcheries and adult fish traps are not included. These fish are not considered strays because the fish were not able to leave the facilities on their own volition.
Coded-wire tag data reported to RMIS is expanded by a sample rate generated by the agency reporting the data. In some cases, the estimated number of tags reported is less than the number actually observed. This typically occurs when the sample rate is unknown, not reported, or biased (Gilbert Lensegrav, WDFW, personal communication). In these instances, the observed number was used instead of the estimated number to calculate the numbers of PRH origin fall Chinook salmon recovered by location.
There are three target rates for straying given in the 2010 version of the PRH Hatchery Genetics Management Plan:
1). Stray rate for PRH origin fall Chinook salmon should be less than 5% of total brood return.
2). Stray rate for PRH origin fall Chinook salmon should be less than 5% of the spawning escapement for other independent populations based on run year.
3). Stray rate for PRH origin fall Chinook salmon should be less than 10% of the spawning escapement of any non-target streams within the independent population based on run year.
Except for the 2006 brood year, less than 5% of the PRH fall Chinook salmon were estimated to spawn outside of the presumptive target spawning area (Table 52). The 2006 brood is the only brood year found at rates greater than 5% outside of the presumptive target area. Roughly 37% of the estimated recoveries for the 2006 brood occurred in the Chelan River. For the 2006 brood there were a total of 19 estimated coded-wire tag recoveries at PRH and 11 estimated coded-wire tag recoveries in the Chelan River.

© 2013, PUBLIC UTILITY DISTRICT NO. 2 OF GRANT COUNTY, WASHINGTON. ALL RIGHTS RESERVED UNDER U.S. AND FOREIGN LAW, TREATIES AND CONVENTIONS.
48
Table 52 Estimated number and proportions of Priest Rapids Hatchery fall Chinook salmon spawning escapement to Priest Rapids Hatchery and streams within and outside of the presumptive target stream by broodyear. Coded-wire tag recoveries are expanded by mark rate and sample rate for each broodyear.
Brood Year
Number of PRH Origin Recoveries
Homing Outside of Target Stream Target Hatchery Target Stream1
Number Proportion Number Proportion Number Proportion 1992 9,037 7,630 0.844 1,037 0.115 370 0.041 1993 25,966 21,144 0.814 4,821 0.186 0 0.000 1994 1,692 1,385 0.818 308 0.182 0 0.000 1995 30,655 23,414 0.764 7,207 0.235 34 0.001 1996 13,552 10,034 0.740 3,517 0.260 0 0.000 1997 3,172 2,690 0.848 483 0.152 0 0.000 1998 18,167 11,833 0.651 5,867 0.323 467 0.026 1999 27,333 15,467 0.566 11,867 0.434 0 0.000 2000 4,759 3,690 0.775 1,069 0.225 0 0.000 2001 25,375 15,875 0.626 9,469 0.373 31 0.001 2002 5,288 3,769 0.713 1,519 0.287 0 0.000 2003 3,034 2,034 0.670 949 0.313 51 0.017 2004 1,133 1,133 1.000 0 0.000 0 0.000 2005 21,379 17,103 0.800 4,241 0.198 34 0.002 2006 1,000 633 0.633 0 0.000 367 0.367 Mean 12,769 9,189 0.751 3,490 0.219 90 0.030
1 Target stream includes the Columbia River between McNary and Wanapum dams as well as the Yakima River below Prosser Dam.
Examination of coded-wire tag recoveries by return year for presumptive non-target streams or areas show that PRH fall Chinook salmon seldom exceed more than 5% of the spawning escapement. However, for multiple return years, greater than 5% of the spawning escapement for the Chelan River consisted of PRH origin fall Chinook salmon (Table 53). The percentage of PRH origin spawners into presumptive non-target streams is not currently being determined for many of the recovery sites, but recent PIT tagging efforts will result in this capacity in the future.

© 2013, PUBLIC UTILITY DISTRICT NO. 2 OF GRANT COUNTY, WASHINGTON. ALL RIGHTS RESERVED UNDER U.S. AND FOREIGN LAW, TREATIES AND CONVENTIONS.
49
Table 53 Proportion of fall/summer Chinook spawning populations by return year comprised of Priest Rapids Hatchery fall Chinook from 1990 – 2006 brood releases.
Return Year Presumptive Non-Target Stream
Okanogan Summer Chinook White Salmon fall Chinook Chelan River1 1996 0.000 0.209 0.000 1997 0.000 0.000 0.000 1998 0.000 0.000 0.000 1999 0.000 0.000 0.000 2000 0.000 0.000 0.000 2001 0.000 0.000 0.339 2002 0.000 0.000 0.229 2003 0.000 0.000 0.000 2004 0.000 0.000 0.000 2005 0.000 0.000 0.000 2006 0.000 0.000 0.000 2007 0.000 0.000 0.000 2008 0.015 0.000 0.000 2009 0.000 0.000 0.066 2010 0.000 0.000 0.328 2011 0.000 0.000 0.000 2012 0.000 0.000 0.000
1The Chelan River spawning population is a mix of both summer and fall Chinook salmon strays and is not considered an independent population. This location was included to show contributions of PRH strays to this group of fish.
18.0 Genetics Genetic tissue was collected from each Chinook salmon spawned at PRH during 2012. Staff from the Columbia River Inter-Tribal Fish Commission (CRITFC) obtained a tissue sample after each fish was spawned. In total, 4,946 specimens were collected to support their work associated with genetic stock identification and parentage based tagging. The data collected is currently being archived by CRITFC. During 2010, WDFW staff collected 100 genetic tissue samples from both the Priest Rapids Hatchery broodstock and then naturally spawning broodstock from the Hanford Reach. WDFW did not collect genetic samples during 2011 or 2012.
19.0 Proportion of Natural Influence A method for indexing the domesticating risk of a supplementation program is to determine the influence of the hatchery and natural environmental selection on the adaptation of the composite population. This is estimated by the proportion of natural-origin fish in the hatchery broodstock (pNOB) and the proportion of hatchery-origin fish in the natural spawning escapement (pHOS). The ratio pNOB/(pHOS+pNOB) is termed the Proportionate Natural Influence (PNI). The larger the PNI ratio, the greater the estimated strength of selection of the natural environment relative to that of the hatchery environment. In order for the natural environment to dominate selection, PNI should be > 0.5 and for integrated hatchery programs the HSRG recommends a PNI ≥ 0.67 (HSRG/WDFW/NWIFC 2004).
Unique for the 2012 returns, age-2 through 5 PRH origin fall Chinook salmon were otolith marked. Estimates for (pNOB) and (pHOS) were calculated from the proportion of fish sampled possessing an otolith mark to fish sampled not possessing an otolith mark. In-sample recoveries

© 2013, PUBLIC UTILITY DISTRICT NO. 2 OF GRANT COUNTY, WASHINGTON. ALL RIGHTS RESERVED UNDER U.S. AND FOREIGN LAW, TREATIES AND CONVENTIONS.
50
of coded-wire tags and non-otolith marked fish possessing an adipose clip are included in the analysis to account for other hatchery origin strays. The Columbia River Coded-Wire Tag Recovery Program has been conducting stream surveys in the Hanford Reach for many years to collect data for run reconstruction and to recover coded-wire tags from the naturally spawning fall Chinook salmon population of the Hanford Reach. Prior to return year 2010, only estimates from coded-wire tag recoveries could be used to determine hatchery influence on the naturally spawning population.
In addition to establishing goals for the proportion of natural origin Chinook salmon to be incorporated into the hatchery broodstock (pNOB), the HSRG (Hatchery Scientific Review Group) set targets for the maximum proportion of hatchery origin Chinook that should be allowed to contribute to natural origin fall Chinook salmon spawning in the Hanford Reach (pHOS) for an integrated hatchery program. The HSRG recommends a maximum proportion of hatchery influence on the spawning grounds of 0.30 for the Hanford Reach if it is to be managed as an integrated hatchery program.
The pNOB calculated from the combination of in-sample otolith marks, coded-wire tags, and adipose clips for the 2012 broodstock is 12% (Table 54). The 2012 broodstock was comprised of 4,408 fish from the volunteer trap, 501 from the OLAFT and 65 from the ABC fishery. The pNOB for return years 2010 and 2011 is based on otolith marked broodstock for a limited number of age classes.
Table 54 Proportion of naturally produced Chinook salmon in the Priest Rapids Hatchery broodstock (pNOB) based on otolith marks, in-sample coded-wire tags and adipose clips.
Return Year PRH Origin Non-PRH
pNOB Other Hatchery4 Natural 20101 713 9 28 0.037 20112 955 5 32 0.032 20123 4362 20 592 0.119
1 pHOS calculated for Ages 2 through 3 2 pHOS calculated for Ages 2 through 4 3 pHOS calculated for Ages 2 through 5 4 Includes fish from other hatcheries and adipose clipped fish without otolith marks
The pHOS for the Hanford Reach was calculated from the proportion of in-sample fall Chinook salmon that possessed an otolith mark, coded-wire tag, or adipose clip to the total number of in-sample fish. For the 2012 returns, we estimate a pHOS of 13% (Table 55). The pHOS specific to the presence of PRH origin fish, based on in-sample otolith data, is 7% for the 2012 returns.
Table 55 Proportion of hatchery Chinook salmon on the spawning grounds (pHOS) in the Hanford Reach using a combination of an otolith, coded-wire tags, and adipose clip marks.
Return Year
Natural Origin
Hatchery Origin Spawners PRH pHOS
Total pHOS PRH Other4 Total
20101 482 124 8 132 0.205 0.215 20112 814 59 30 89 0.068 0.099 20123 1398 107 104 211 0.071 0.131
1 pHOS calculated for Ages 2 through 3 2 pHOS calculated for Ages 2 through 4 3 pHOS calculated for Ages 2 through 5 4. Includes fish from other hatcheries and adipose clipped fish without otolith marks

© 2013, PUBLIC UTILITY DISTRICT NO. 2 OF GRANT COUNTY, WASHINGTON. ALL RIGHTS RESERVED UNDER U.S. AND FOREIGN LAW, TREATIES AND CONVENTIONS.
51
The PNI for the Hanford Reach includes all hatchery origin fish that pass on their genetics to the natural production. The influence of PRH origin fish on PNI is given to show the contribution by the PRH program.
For return year 2012, the contribution of all hatchery origin fish to the natural spawn provides an estimated PNI of 48%. The PNI for return years 2010 and 2011 represents only age classes otolith marked (Table 56). For return year 2012, the PNI specific to PRH’s contribution to pHOS is estimated at 63%.
Historically, pHOS, pNOB and PNI were estimated from expansions of coded-wire tag recoveries in the hatchery and stream surveys. The pNOB estimated from coded-wire tags requires the assumption that fish unaccounted for by the code-wire tag expansions are natural origin fish. As discussed in section 1.8 and section 1.9 of this report, this assumption significantly over estimates pNOB and PNI and under estimates pHOS. Estimates of pNOB, pHOS, and PNI based on code-wire tags expansions are presented in Table 56. In future years we hope to establish a relationship between pNOB and pHOS estimates generated by coded-wire tags and otolith marks in order to adjust the historical PNI estimates generated by coded-wire tags.
Table 56 Proportionate Natural Influence (PNI) of the Hanford Reach fall Chinook salmon supplementation program based on expanded coded-wire tag recoveries of all fish surveyed and sub-sampling for otoliths marks.
Return Year
pNOB based on All Non CWT are Natural Origin
pHOS PNI
2001 0.155 0.094 0.622 2002 0.145 0.101 0.589 2003 0.132 0.099 0.571 2004 0.229 0.081 0.739 2005 0.370 0.106 0.777 2006 0.507 0.057 0.899 2007 0.326 0.041 0.888 2008 0.501 0.046 0.916 2009 0.568 0.077 0.881 2010 0.392 0.040 0.907 2011 0.381 0.075 0.836 2012 0.304 0.045 0.871 Mean 0.334 0.074 0.791
PNI derived from otoliths
Return Year pNOB PRH origin pHOS
All Hatchery Combined
pHOS4
PRH origin PNI
All Hatchery Combined
PNI 20101 0.037 0.205 0.215 0.153 0.147 20112 0.032 0.068 0.099 0.320 0.244 20123 0.119 0.071 0.131 0.626 0.476
1 pHOS calculated for Ages 2 through 3 2 pHOS calculated for Ages 2 through 4 3. pHOS calculated for Ages 2 through 5 4. Includes fish from other hatcheries and adipose clipped fish without otolith marks

© 2013, PUBLIC UTILITY DISTRICT NO. 2 OF GRANT COUNTY, WASHINGTON. ALL RIGHTS RESERVED UNDER U.S. AND FOREIGN LAW, TREATIES AND CONVENTIONS.
52
19.1 Alternative pNOB and PNI An alternative pNOB was developed to account for the genetic influence on pNOB resulting from the PRH spawning protocol of spawning one male x two females. It is intended to represent actual gene flow to the progeny instead of the origin and number of parents. However, it should be noted that although PNI was intended to index gene flow, the alternative method of estimating pNOB as described below has not been peer-reviewed or used elsewhere. The alternative pNOB is calculated by assigning scores to the estimated matings of males and females based on origin during the spawning of the 2012 broodstock. For example, hatchery x hatchery matings = 0.0 points, hatchery x wild matings equal = 0.5 points, and natural x natural matings = 1.0 points. The scores of all of matings were averaged to generate the overall alternative pNOB. The origins of fish spawned were based primarily on otolith marks as done for the conventional pNOB calculation previously discussed. The matings were assigned assuming there were no natural x natural crosses since there was a low proportion (<0.07) of natural origin fish in the PRH volunteer broodstock.
In addition, the fish from the OLAFT and ABC fishery were spawned with fish from the PRH volunteer broodstock. Hence, there is a low chance that natural origin fish from the OLAFT and ABC fishery were mated with the relatively few natural origin fish from the PRH volunteer broodstock.
The PNI generated from the alternative pNOB calculation is slightly higher than the PNI calculated from the conventional pNOB calculation from the matings of one natural origin male x two hatchery origin females. For example, the alternative pNOB calculation for the mating of one natural origin male x two hatchery origin females is (0.5 + 0.5 / 2 females) = 0.5, whereas the conventional pNOB calculation for this mating equals (1 natural / (1 natural + 2 hatchery) = 0.33. The alternative and conventional pNOB values are given in Table 57 for each source of broodstock and the total broodstock spawned at PRH during brood year 2012.
The alternative pNOB of 0.141 increased PNI to 0.518 which is slightly higher than the PNI of 0.476 based the on conventional pNOB of 0.119. It should be noted that both the conventional and alternative pNOB values are nearly the same if the fish from OLAFT and ABC fishery are removed from the PRH broodstock. This similarity in pNOB is primarily due to the low numbers of natural origin fish in the PRH volunteer broodstock. In addition, during the first spawn for the 2012 brood year, the matings were one male x one female crosses which eliminates the power of the alternative pNOB to increase PNI. It is estimated that nine natural origin females and nine natural origin males were spawned along with 386 hatchery origin fish during the first spawn.
Table 57 Conventional and alternative calculations of pNOB and PNI for the Priest Rapids 2012 Broodstock.
Conventional pNOB = pNOB/(NOB + HOB) PRH Broodstock Return Year 2012 HOB NOB pNOB PRH Volunteer Broodstock Only 4,156 252 0.057 OLAFT, ABC, & PRH Volunteers Combined 4,382 592 0.119
PNI (pHOS of 0.131 and pNOB of 0.119) = 0.476 Alternative pNOB = Total Score / Total Females in Broodstock
PRH Broodstock Return Year 2012 Total Score Total Female pNOB PRH Volunteer Returns 174.0 3,052 0.057 OLAFT, ABC, & PRH Volunteers Combined 454.5 3,225 0.141
PNI (pHOS of 0.131 and pNOB of 0.141) = 0.518

© 2013, PUBLIC UTILITY DISTRICT NO. 2 OF GRANT COUNTY, WASHINGTON. ALL RIGHTS RESERVED UNDER U.S. AND FOREIGN LAW, TREATIES AND CONVENTIONS.
53
20.0 Natural and Hatchery Replacement Rates The numbers of hatchery-origin recruits (HOR) were estimated from expanded coded-wire tag recoveries for brood year returns to the Priest Rapids Hatchery and the Hanford Reach of the Columbia River. Coded-wire tag expansion rates for natural origin fall Chinook salmon have not been calculated for the Hanford Reach. Therefore, the assumption was made that returns not accounted for by HOR coded-wire tag recoveries are natural-origin recruits (NOR). Recent data indicates that that coded-wire tag data likely underestimates the true number of HOR recruits. Hence, our assumption overestimates the number of NOR recruits.
In years following 2006, using otolith marks to estimate origin will improve the HOR and NOR estimates. Currently, we only have complete otolith data for the 2007 brood year.
Hatchery replacement rates (HRR) were calculated as the ratio of HOR to the parent broodstock at PRH. This broodstock is an estimate of the number of fish spawned at PRH to produce the target release of 6.7 million subyearling fall Chinook salmon. Similarly, natural replacement rates (NRR) for the Hanford Reach URB fall Chinook salmon were calculated as the ratio of NOR recruits to the parent population spawning naturally in the Hanford Reach stream.
Harvest estimates for HOR recruits were calculated from the proportion of the expanded coded-wire tag recoveries in the fisheries to the total number expanded coded-wire tags recovered. Since there is not a coded-wire tag mark rate for NOR recruits, the harvest rates for HOR recruits were used as an indicator for similar brood years of NOR recruits.
For brood years 1996 through 2006, HRR without harvest for Priest Rapids Hatchery fall Chinook salmon averaged 3.92 and NRR for fall Chinook salmon in the Hanford Reach without harvest averaged 1.24 (Table 58).
Based on coded-wire tag recoveries, an average of 56% of the PRH adult recruits and 69% of the natural origin adult recruits for brood years 1996 through 2006 were harvested in ocean and freshwater fisheries. For brood years 1996 through 2006, HRR with harvest included averaged 8.59 and NRR averaged 4.09. The HRR should be greater than or equal to 5.30 (the target value in Murdoch and Peven 2005).

© 2013, PUBLIC UTILITY DISTRICT NO. 2 OF GRANT COUNTY, WASHINGTON. ALL RIGHTS RESERVED UNDER U.S. AND FOREIGN LAW, TREATIES AND CONVENTIONS.
54
Table 58 Broodstock collected, spawning escapement, natural and hatchery-origin recruits (NOR and HOR), and natural and hatchery replacement rates (NRR and HRR, with and without harvest) for natural origin fall Chinook salmon in the Hanford Reach.
Brood Year
Broodstock Spawned
Natural Spawning
Escapement
Harvest not included Harvest included1
HOR NOR HRR NRR HOR NOR HRR NRR 1996 2,859 43,249 13,584 28,849 4.75 0.67 26,205 59,899 9.17 1.38 1997 2,726 43,493 3,002 44,416 1.10 1.02 6,037 88,349 2.21 2.03 1998 3,027 35,393 18,464 93,999 6.10 2.66 31,932 222,865 10.55 6.30 1999 2,619 29,812 27,093 114,867 10.34 3.85 52,099 239,319 19.89 8.03 2000 2,619 48,020 4,665 56,422 1.78 1.17 12,508 89,983 4.78 1.87 2001 2,908 59,848 25,059 71,359 8.62 1.19 55,789 129,548 19.19 2.16 2002 3,160 84,509 5,277 47,813 1.67 0.57 12,744 81,600 4.03 0.97 2003 2,781 100,508 3,021 31,605 1.09 0.31 5,974 63,937 2.15 0.64 2004 3,002 87,696 1,109 22,747 0.37 0.26 3,262 34,465 1.09 0.39 2005 3,023 71,967 21,107 64,011 6.98 0.89 61,122 97,777 20.22 1.36 2006 2,729 51,701 998 54,288 0.37 1.05 3,347 77,344 1.23 1.50 Mean 2,859 59,654 11,216 57,307 3.92 1.24 24,638 107,735 8.59 2.42
1 Harvest rates for NORs was estimated using the HRRs harvest rates for similar brood years as an indicator stock.
21.0 Smolt-to-Adult Survivals Smolt-to-adult survival ratios (SARs) are calculated as the expanded number of adult coded-wire tags recovered divided by the number of coded-wire tagged smolts released.
The SARs for hatchery fall Chinook salmon released from PRH for brood years 1992 through 2005, have averaged 0.0037 (Table 59). The SARs for the PRH origin 2006 brood is 0.0005; one of the lowest on record and notably less than the historic mean. Hatchery fall Chinook salmon are annually released as subyearling smolts.

© 2013, PUBLIC UTILITY DISTRICT NO. 2 OF GRANT COUNTY, WASHINGTON. ALL RIGHTS RESERVED UNDER U.S. AND FOREIGN LAW, TREATIES AND CONVENTIONS.
55
Table 59 Smolt-to-adult ratios (SARs) for Priest Rapids Hatchery fall Chinook salmon.
Brood Year Tag Code Number of Tagged
Smolts Released Estimated Adult
Captures SAR 1992 635010 194,622 448 0.0023 1993 635540 185,683 1,479 0.0080 1994 635711 175,880 108 0.0006 1995 636001 196,189 1,786 0.0091 1996 636328 193,215 762 0.0040 1997 630517 196,249 183 0.0009 1998 631030 193,660 946 0.0049 1999 631333 204,346 1,573 0.0077 2000 630672 200,779 370 0.0018 2001 631382 219,926 1,810 0.0082
2002a 631392 101,020 124 0.0012 2002a 631768 254,353 545 0.0021 2003a 632575 225,989 264 0.0012 2003a 632574 173,127 88 0.0005 2004 633076 200,072 100 0.0005 2005 633173 199,445 1,718 0.0086 2006 633894 202,000 100 0.0005
Mean 195,091 730 0.0037 a Brood years with multiple coded-wire tag groups.
The SARs for Hanford Reach natural origin fall Chinook salmon for brood years 1992 through 2006 have averaged 0.0029 (Table 60). The SAR for the Hanford Reach natural origin 2006 brood is 0.0007; one of the lowest on record and notably less than the historic mean. The SARs for both the PRH and natural origin broods were similarly low.
Table 60 Smolt-to-adult ratios (SARs) for Hanford Reach natural origin fall Chinook salmon.
Brood Year Number of Tagged
Smolts Released Estimated Adult Captures SAR
1992 203,591 829 0.0041 1993 95,897 485 0.0051 1994 148,585 74 0.0005 1995 146,887 340 0.0023 1996 92,262 111 0.0012 1997 199,896 365 0.0018 1998 129,850 784 0.0060 1999 213,259 2,378 0.0112 2000 204,925 362 0.0018 2001 127,758 519 0.0041 2002 203,557 338 0.0017 2003 207,168 199 0.0010 2004 163,884 147 0.0009 2005 203,929 301 0.0015 2006 263,478 356 0.0007
Mean 173,662 506 0.0029

© 2013, PUBLIC UTILITY DISTRICT NO. 2 OF GRANT COUNTY, WASHINGTON. ALL RIGHTS RESERVED UNDER U.S. AND FOREIGN LAW, TREATIES AND CONVENTIONS.
56
22.0 ESA/HCP Compliance 22.1 Broodstock Collection
Unclipped and untagged fall Chinook salmon adults were collected at the OLAFT at Priest Rapids Dam and the ABC fishery in the Hanford Reach to be used as brood stock at PRH. Per the 2012 Priest Rapids OLAFT study plan and consistent with the 2012 broodstock collection protocols, up to 734 natural-origin (adipose fin present, non-coded-wire tagged) adults were targeted for collection between 1 September and 15 November at the OLAFT. Actual collections occurred between 5 September and 14 November and totaled 570 fall Chinook. ESA Permit 1347 provides authorization to conduct fall Chinook broodstock collection activities at Priest Rapids Dam with an indirect take of steelhead (hatchery and/or wild) not to exceed 10 fish.
During 2012, broodstock collection activities were concurrent with the Priest Rapids steelhead run composition sampling covered under Section Permit # 1395. As such no steelhead take occurred from fall Chinook broodstock activities. Chinook not collected for broodstock were sampled as described in 2012 OLAFT Study plan and released upstream. All other fish encountered were passed at the trap site and were not physically handled.
22.2 Hatchery Rearing and Release The juvenile fall Chinook salmon from the 2012 brood year reared throughout their life-stages at PRH without incident. The 2013 smolt release totaled 6,822,361 URB fall Chinook salmon, representing 102% of the production objective and was compliant with the 10% overage allowable in ESA Section 10 Permit 1347.
22.3 Hatchery Effluent Monitoring Per ESA Permits 1196, 1347, and 1395, permit holders shall monitor and report hatchery effluents in compliance with applicable National Pollution Discharge Elimination Systems (NPDES) (EPA 1999) permit limitations. There were no NPDES violations reported at Grant PUD Hatchery facilities during the September 2012 through June 2013 collection and rearing periods.
22.4 Ecological Risk Assessment One of the regional objectives in the GPUD M&E plan is to conduct an ecological risk assessment on non-target taxa of concern to determine if additional M&E is necessary (Pearsons and Langshaw 2009). The methodology that is being used to assess risks is presented in Pearsons et al. 2012 and Pearsons and Busack 2012. A copy of the Abstract and Next Steps are reprinted here, however limited activity on this task has been completed during the past year.
Abstract Ecological risks of Pacific salmon (spring, summer, and fall run Chinook, coho, and sockeye salmon) and steelhead trout hatchery programs operated between 2013 and 2023 in the Upper Columbia Watershed will be assessed using Delphi and modeling approaches. Committees composed of resource managers and public utility districts identified non-target taxa of concern (i.e., taxa that are not the target of supplementation), and acceptable hatchery impacts (i.e., change in population status) to those taxa. Biologists assembled information about hatchery programs, non-target taxa, and

© 2013, PUBLIC UTILITY DISTRICT NO. 2 OF GRANT COUNTY, WASHINGTON. ALL RIGHTS RESERVED UNDER U.S. AND FOREIGN LAW, TREATIES AND CONVENTIONS.
57
ecological interactions and this information will be provided to expert panelists in the Delphi process to facilitate assessment of risks and also used to populate the Predation, Competition, and Disease (PCD) Risk 1 model. Delphi panelists will independently estimate the proportion of a non-target taxa population that will be affected by each individual hatchery program. Estimates from each of the two approaches will be independently averaged, a measure of dispersion calculated (e.g., standard deviation), and subsequently compared to the acceptable hatchery impact levels that were determined previously by committees of resource managers and public utility districts. Measures of dispersion will be used to estimate the scientific uncertainty associated with risk estimates. Delphi and model results will be compared to evaluate the qualities of the two approaches. Furthermore, estimates of impacts from each hatchery program will be combined together to generate an estimate of cumulative impact to each non-target taxa.
22.5 Methods and Next Steps Experts that have been identified by the resource committees will be invited to participate in a Delphi approach to assess risks (Figure 2). These Delphi panelists will be provided with the information templates populated by the local experts so that all of the panelists in the Delphi process have access to the same, most relevant information. In addition, the opportunity to ask clarifying questions will be provided. Delphi panelists will independently estimate the proportion of a non-target taxa population that will be affected by each individual hatchery program (Pearsons and Hopley 1999). Impacts will be described as the impact to abundance, size at age, and spatial distribution of an NTTOC.
These estimates will be averaged, a measure of dispersion calculated, and subsequently compared to the acceptable hatchery impact levels that were determined previously by resource committees. Measures of dispersion will be used to estimate the scientific uncertainty associated with risk estimates. It is expected that pairings of hatchery target fish and NTTOC for which little data exist will produce high levels of dispersion. Furthermore, estimates of impacts from each hatchery program will be combined together to generate an estimate of cumulative impact to each non-target taxa.
The PCD Risk 1 model will also be populated with the same information templates that will be provided to the Delphi panelists. Modeled results will provide the opportunity to compare risk assessments between expert opinion and the model such as has been described by McCarthy et al. (2004). If results are correlated, then future changes to programs or improvement in data templates could be assessed using the model instead of reconvening Delphi panelists. In addition, risks could also be compared to PCD Risk 1 model results that have been conducted on hatcheries in western Washington and perhaps evaluate bias associated with expert opinion (McCarthy et al. 2004). Furthermore, the model allows for opportunities to assess various risk reduction strategies by conducting multiple model runs with different inputs (Pearsons and Busack, 2012).
The data templates have been completed and have been stored in a database. Data templates were distributed to organizations responsible for hatchery programs in the middle Columbia region so that they could complete PCD Risk 1 model runs. The plan was to complete all model runs before the Delphi panel was convened. This plan was intended to identify any gross errors or missing data from the templates.

© 2013, PUBLIC UTILITY DISTRICT NO. 2 OF GRANT COUNTY, WASHINGTON. ALL RIGHTS RESERVED UNDER U.S. AND FOREIGN LAW, TREATIES AND CONVENTIONS.
58
Grant PUD has completed 36 of its 46 PCD Risk 1 model runs and has organized the outputs of the model runs into a spreadsheet. Ten of the model runs would not run to completion and it appears that there may need to be an adjustment of the model before the model runs can be completed. Other organizations such as Douglas County Public Utility District, Yakama Nation, and United States Fish and Wildlife Service have also made progress in completing model runs. It is anticipated that the risk assessment will be completed after other organizations have completed their portions of the risk assessment.
After the risk assessment is complete, results will be used by managers to reduce risks if necessary, modify monitoring and evaluation plans, and adaptively manage programs. For example, if risks are unacceptably high and the scientific uncertainty is acceptable; then modification of the hatchery program might occur (Pearsons and Hopley 1999; Ham and Pearsons 2001). Alternatively, if risks appear sufficiently high, but scientific uncertainty is high, then additional monitoring and evaluation or studies may be necessary to assess risk at the desired level of certainty.
23.0 Acknowledgments We thank the many individuals and organizations that helped collect the data or provided data for inclusion in this report. Robert Granger and Shawnaly Meehan from the WDFW monitoring and evaluation team for Priest Rapids and Ringold Springs Hatcheries sorted and sampled over 36,000 fall Chinook salmon, along with entering and reviewing all the data collected from the hatcheries in 2012. Mike Tonseth (WDFW) supervised the OLAFT sampling and natural origin broodstock collection. I would like to thank the hatchery staff at Priest Rapids and Ringold Springs Hatcheries: Mike Lewis, Glen Pearson, Mike Erickson, Jeff Benjamin, Richard French, Kyle Huwe, Renee Shaw, Cory Keller, Nathan Roberts, James Ayers, and Jaccob Plank. They were instrumental in the coordination between hatchery operation and sampling in addition to providing data and background information on hatchery operations over the past 30 years. Pacific Northwest National Laboratory (PNNL) and Environmental Assessment Services provided the Hanford Reach aerial redd count data. Russell Langshaw was instrumental in initiating otolith marking for the hatchery fish. John Easterbrooks and Andrew Murdoch provided helpful suggestions for the improvement of this report. This work was primarily funded by Grant County Public Utility District, Washington Department of Fish and Wildlife, and the Army Corps of Engineers.

© 2013, PUBLIC UTILITY DISTRICT NO. 2 OF GRANT COUNTY, WASHINGTON. ALL RIGHTS RESERVED UNDER U.S. AND FOREIGN LAW, TREATIES AND CONVENTIONS.
59
Literature Cited Ham, K. D., and T. N. Pearsons. 2001. A practical approach for containing ecological risks
associated with fish stocking programs. Fisheries 25(4):15-23.
Harnish, R.A., R. Sharma, G. A. McMichael, R.B. Langshaw, T.N. Pearsons, and D.A. Bernard. 2012. Effects of Priest Rapids Dam Operations on Hanford Reach Fall Chinook Salmon Productivity and Estimation of Maximum Sustainable Yield, 1975-2004. Prepared for: Public Utility District No. 2 of Grant County, Ephrata, WA. Contract Number 430-2464.
Hoffarth, P. A. and T. N. Pearsons. 2012. Priest Rapids Hatchery Monitoring and Evaluation: Annual Report for 2010. Grant County Public Utility District, Ephrata, Washington.
Hoffarth, P. A. and T. N. Pearsons. 2012. Priest Rapids Hatchery Monitoring and Evaluation: Annual Report for 2011. Grant County Public Utility District, Ephrata, Washington.
McCarthy, M. A., D. Keith, J. Tietjen, M. A. Burgman, M. Maunder, L. Master, B. W. Brook, G. Mace, H. P. Possingham, R. Medellin, S. Andelman, H. Regan, T. Regan, and M. Ruckelshaus. 2004. Comparing predictions of extinction risk using models and subjective judgement. Acta Oecologica 26(2004):67-74. doi10.1016/actao.2004.01.008.
Murdoch, A., and C. Peven. 2005. Conceptual approach to monitoring and evaluating the Chelan County Public Utility District Hatchery Programs. Final report to the Chelan PUD Habitat Conservation Plan’s Hatchery Committee.
Murdoch, A. R., T. N. Pearsons, and T. W. Maitland. 2010. Estimating the spawning escapement of hatchery- and natural-origin spring Chinook salmon using redd and carcass data. North American Journal of Fisheries Management 30:361-375.
Naiman, R. J., J. R. Alldredge, D. A. Beauchamp, P. A. Bisson, J. Congleton, C. J. Henny,
N. Huntly, R. Lamberson, C. Levings, E. N. Merrill, W. G. Pearcy, B. E. Riemann,,
G. T. Ruggerone, D. Scarnecchia, P. E. Smouse, and C. C. Wood. 2012. Developing a broader scientific foundation for river restoration: Columbia River food webs. PNAS 1-7. www.pnas.org/cgi/doi/10.1073/pnas.1213408109
Oldenburg, E.W., B.J. Goodman, G.A. McMichael, and R.B. Langshaw. 2012. Forms of Production Loss During the Early Life History of Fall Chinook Salmon in the Hanford Reach of the Columbia River. Prepared for: Public Utility District No. 2 of Grant County, Ephrata, WA. Contract Number 430-2464.
Pearsons, T. N., A. R. Murdoch, G. Mackey, K. G. Murdoch, T. W. Hillman, M. R. Cooper,
and J. L. Miller. 2012. Ecological risk assessment of multiple hatchery programs in the upper Columbia watershed using Delphi and modeling approaches. Environmental Biology of Fishes 94:87-100. DOI 10.1007/s10641-011-9884-1.
Pearsons, T. N. and C. A. Busack. 2012. PCD Risk 1: A tool for assessing and reducing ecological risks of hatchery operations in freshwater. Environmental Biology of Fishes 94:45-65. DOI:10.1007/s10641-011-9926-8.
Pearsons, T. N., and C. W. Hopley. 1999. A practical approach for assessing ecological risks associated with fish stocking programs. Fisheries 24(9):16-23.
Pearsons, T. N., and R. B. Langshaw. 2009. Monitoring and evaluation plan for Grant PUDs salmon and steelhead supplementation Programs. Grant PUD, Ephrata, Washington.
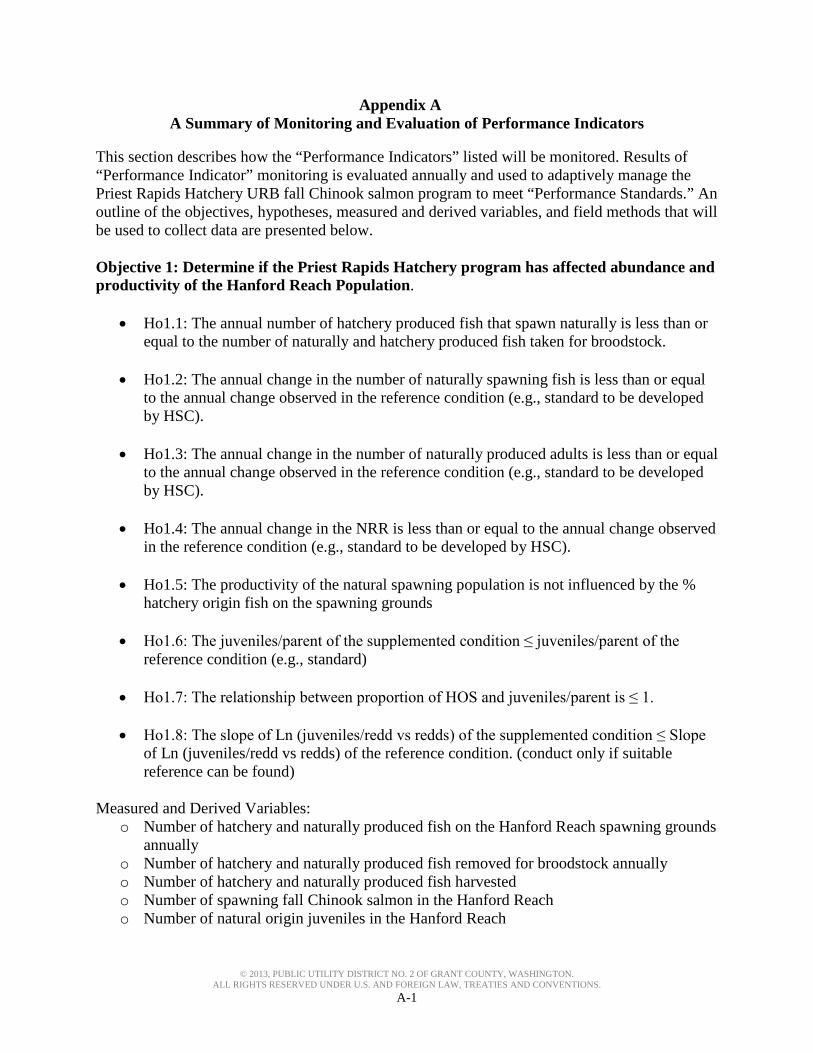
© 2013, PUBLIC UTILITY DISTRICT NO. 2 OF GRANT COUNTY, WASHINGTON. ALL RIGHTS RESERVED UNDER U.S. AND FOREIGN LAW, TREATIES AND CONVENTIONS.
A-1
Appendix AA Summary of Monitoring and Evaluation of Performance Indicators
This section describes how the “Performance Indicators” listed will be monitored. Results of “Performance Indicator” monitoring is evaluated annually and used to adaptively manage the Priest Rapids Hatchery URB fall Chinook salmon program to meet “Performance Standards.” An outline of the objectives, hypotheses, measured and derived variables, and field methods that will be used to collect data are presented below. Objective 1: Determine if the Priest Rapids Hatchery program has affected abundance and productivity of the Hanford Reach Population.
• Ho1.1: The annual number of hatchery produced fish that spawn naturally is less than or equal to the number of naturally and hatchery produced fish taken for broodstock.
• Ho1.2: The annual change in the number of naturally spawning fish is less than or equal
to the annual change observed in the reference condition (e.g., standard to be developed by HSC).
• Ho1.3: The annual change in the number of naturally produced adults is less than or equal
to the annual change observed in the reference condition (e.g., standard to be developed by HSC).
• Ho1.4: The annual change in the NRR is less than or equal to the annual change observed
in the reference condition (e.g., standard to be developed by HSC).
• Ho1.5: The productivity of the natural spawning population is not influenced by the % hatchery origin fish on the spawning grounds
• Ho1.6: The juveniles/parent of the supplemented condition ≤ juveniles/parent of the
reference condition (e.g., standard)
• Ho1.7: The relationship between proportion of HOS and juveniles/parent is ≤ 1.
• Ho1.8: The slope of Ln (juveniles/redd vs redds) of the supplemented condition ≤ Slope of Ln (juveniles/redd vs redds) of the reference condition. (conduct only if suitable reference can be found)
Measured and Derived Variables:
o Number of hatchery and naturally produced fish on the Hanford Reach spawning grounds annually
o Number of hatchery and naturally produced fish removed for broodstock annually o Number of hatchery and naturally produced fish harvested o Number of spawning fall Chinook salmon in the Hanford Reach o Number of natural origin juveniles in the Hanford Reach

© 2013, PUBLIC UTILITY DISTRICT NO. 2 OF GRANT COUNTY, WASHINGTON. ALL RIGHTS RESERVED UNDER U.S. AND FOREIGN LAW, TREATIES AND CONVENTIONS.
A-2
Methods that will be used to collect data • Redd surveys, adult counts at dams, carcass surveys, Priest Rapids Hatchery trap
sampling, hatchery spawning sampling, harvest sampling, juvenile marking and tagging
Objective 2: Determine if the run timing, spawn timing, and spawning distribution of both the natural and Priest Rapids Hatchery components of the Hanford Reach population are similar.
• Ho2.1: Migration timing Hatchery = Migration timing Naturally produced
• Ho2.2: Spawn timing Hatchery = Spawn timing Naturally produced
• Ho2.3: Spawner distribution Hatchery = Spawner distribution Naturally produced Measured and Derived Variables:
o Ages of PR Hatchery and Hanford Reach produced fish sampled via pit tags or stock assessment monitoring
o Time (ordinal date) of arrival at Bonneville, The Dalles, John Day, McNary and Priest Rapids Dams
o Time (ordinal date) of PR Hatchery and Hanford Reach produced female salmon carcasses observed on spawning grounds within defined reaches
o Time (ordinal date) of ripeness of fall Chinook salmon captured for broodstock o Average daily temperature of fish holding water o Location (GPS coordinate) of female salmon carcasses observed on spawning grounds.
(The distribution of hatchery and naturally produced redds may be evaluated if marking or tagging efforts provide reasonable results)
Methods that will be used to collect data:
• Adult counts at dams, carcass surveys, Priest Rapids Hatchery trap sampling, hatchery spawning sampling, harvest sampling, juvenile marking and tagging
Objective 3: Determine if genetic diversity, population structure, and effective population size have changed in natural spawning populations as a result of the Priest Rapids Hatchery program. Additionally, determine if Priest Rapids Hatchery programs have caused changes in phenotypic characteristics of the Hanford Reach population.
• Ho3.1: Allele frequency Hatchery = Allele frequency Naturally produced = Allele frequency Donor pop
• Ho3.2: Age at Maturity Hatchery = Age at Maturity Naturally produced
• Ho3.3: Size at Maturity Hatchery = Size at Maturity Naturally produced
• Ho3.4: Effective population size time x = Effective population size time y

© 2013, PUBLIC UTILITY DISTRICT NO. 2 OF GRANT COUNTY, WASHINGTON. ALL RIGHTS RESERVED UNDER U.S. AND FOREIGN LAW, TREATIES AND CONVENTIONS.
A-3
Measured and Derived Variables:
o Microsatellite genotypes o Size (length), age, and gender of PR Hatchery and Hanford Reach produced salmon
carcasses collected on spawning grounds o Size (length), age, and gender of PR Hatchery broodstock o Size (length), age, and gender of fish at stock assessment locations (e.g., Priest Rapids
Dam) Methods that will be used to collect data:
• Adult counts at dams, carcass surveys, Priest Rapids Hatchery trap sampling, hatchery spawning sampling, juvenile marking and tagging
Objective 4: Determine if the Priest Rapids Hatchery adult-to-adult survival (i.e., hatchery replacement rate) is greater than the Hanford Reach adult-to-adult survival (i.e., natural replacement rate) and equal to or greater than the program specific hatchery replacement rate (HRR) expected value based on survival rates listed in the BAMP (1998).
• Ho4.1: HRR Year x ≤ NRR Year x
• Ho4.2: HRR ≤ Expected value per assumptions in BAMP Measured and Derived Variables:
o Number of PR Hatchery and Hanford Reach fish on spawning grounds o Number of PR Hatchery and Hanford Reach fish harvested o Number of PR Hatchery and Hanford Reach fish collected for broodstock o Number of broodstock used by brood year (PR Hatchery and Hanford Reach fish)
Methods that will be used to collect data:
• Redd surveys, adult counts at dams, carcass surveys, Priest Rapids Hatchery trap sampling, hatchery spawning sampling, harvest sampling, juvenile marking and tagging
Objective 5: Determine if the stray rate of Priest Rapids Hatchery fish is below the acceptable levels to maintain genetic variation between stocks.
• Ho5.1: Stray rate Hatchery fish < 5% of total brood return
• Ho5.2: Stray hatchery fish < 5% of spawning escapement of other independent populations1
• Ho5.3: Stray hatchery fish < 10% of spawning escapement of any non-target streams
within independent population1 1 This stray rate is suggested based on a literature review and recommendations by the ICBTRT. It can be re-evaluated as more information on naturally-produced Upper Columbia salmonids becomes available. This will be evaluated on a species and program-specific basis and decisions made by the PRCC HSC. It is important to understand the actual spawner composition of the population to determine the potential effect of straying.

© 2013, PUBLIC UTILITY DISTRICT NO. 2 OF GRANT COUNTY, WASHINGTON. ALL RIGHTS RESERVED UNDER U.S. AND FOREIGN LAW, TREATIES AND CONVENTIONS.
A-4
Measured and Derived Variables:
o Number and percent of PR Hatchery carcasses found in non-target and target spawning areas
o Number and percent of PR Hatchery fish collected for broodstock. o Number and percent of PR Hatchery fish taken in fishery. o Number and percent of PR Hatchery carcasses found in non-target and target spawning
aggregates. Methods that will be used to collect data:
• Carcass surveys, Priest Rapids Hatchery trap sampling, hatchery spawning sampling, harvest sampling, juvenile marking and tagging, sampling at fish ladder trap
Objective 6: Determine if Priest Rapids Hatchery fish were released at the programmed size and number.
• Ho6.1: Hatchery fish Size = Programmed Size
• Ho6.2: Hatchery fish Number = Programmed Number Measured and Derived Variables:
o Length and weights of random samples of hatchery smolts. o Numbers of smolts released from the PR Hatchery.
Methods that will be used to collect data
• Sampling of juveniles in hatchery, juvenile marking and tagging Objective 7: Determine if harvest opportunities have been provided using Priest Rapids Hatchery returning adults.
• Ho 7.1: Number of harvested Priest Rapids Hatchery fish > 0 Measured and Derived Variables:
o Numbers of PR Hatchery fish sampled in all sport and commercial harvest. o Total harvest by fishery estimated from expansion analysis.
Methods that will be used to collect data:
• Harvest sampling (CWT collection from harvest, analysis of PRH Chinook from ocean and lower Columbia commercial and tribal harvest), juvenile marking and tagging
Objective 8: Determine if the Priest Rapids Hatchery has increased pathogen type and/or prevalence in the Hanford Reach population.
• Ho8.1: Pathogen index z supplemented population Time x = Pathogen index supplemented population Time y

© 2013, PUBLIC UTILITY DISTRICT NO. 2 OF GRANT COUNTY, WASHINGTON. ALL RIGHTS RESERVED UNDER U.S. AND FOREIGN LAW, TREATIES AND CONVENTIONS.
A-5
• Ho8.2: Hatchery disease Year x = Hatchery disease Year y Measured and Derived Variables:
o Incidence of disease in PR Hatchery juveniles and adults. o Incidence of disease in Hanford Reach produced juveniles and adults. o Evaluation of impacts to incidence of disease may require use of a reference population
and/or controlled experiments. The above parameters would also be required for reference populations used to evaluate impacts from disease.
Methods that will be used to collect data:
• Sampling of adults and juveniles at Priest Rapids Hatchery Objective 9: Determine if ecological interactions attributed to Priest Rapids Hatchery fish affect the distribution, abundance, and/or size of non target taxa of concern that were deemed to be at sufficient risk
• Ho9.1: NTTOC abundance Year x through y = NTTOC abundance Year y through z
• Ho9.2: NTTOC distribution Year x through y = NTTOC distribution Year y through z
• Ho9.3: NTTOC size Year x through y = NTTOC size Year y through z Measured and Derived Variables:
o Ecological risk assessment for Hanford Reach NTTOC o Containment objectives o Distribution, abundance, and/or size of NTTOC

© 2013, PUBLIC UTILITY DISTRICT NO. 2 OF GRANT COUNTY, WASHINGTON. ALL RIGHTS RESERVED UNDER U.S. AND FOREIGN LAW, TREATIES AND CONVENTIONS.
B-1
Appendix BRecovery of coded-wire tags collected from Chinook salmon spawned at Priest Rapids
Hatchery during return year 2012.
Coded-wire tag recoveries from fish spawned at Priest Rapids Hatchery, 2012
Code Tags Brood Run Stock Release Location CWT Release Exp factor
Total Return Date #
090224 1 2008 Fall Umatilla Hatchery Umatilla R. 2009 157,305 1.0 1
090227 1 2008 Fall Priest Rapids CR@Ringold 2009 137,509 25.5 26
090246 3 2008 Fall Umatilla Hatchery Umatilla R. 2010 300,737 1.0 3
094508 1 2008 Fall Umatilla R. Umatilla R. 2009 26,324 8.7 9
220310 1 2009 Fall Lyons Ferry Snake R@Pittsburg L 2010 100,619 2.0 2
612760 1 2008 Fall Lyons Ferry Magrudor Corridor 2009 100,761 1.0 1
634391 26 2007 Fall Priest Rapids CR@Priest Rapids 2008 202,568 22.5 584
634799 38 2008 Fall Priest Rapids CR@Priest Rapids 2009 216,137 31.4 1,193
635290 87 2009 Fall Priest Rapids CR@Priest Rapids 2010 207,185 4.1 358
635294 96 2009 Fall Priest Rapids CR@Priest Rapids 2010 205,892 4.1 395
635484 39 2009 Fall Priest Rapids CR@Priest Rapids 2010 207,184 4.1 161
635485 26 2009 Fall Priest Rapids CR@Priest Rapids 2010 207,314 4.1 107
635486 72 2009 Fall Priest Rapids CR@Priest Rapids 2010 206,523 4.1 296
635487 79 2009 Fall Priest Rapids CR@Priest Rapids 2010 221,057 4.1 325
635488 34 2009 Fall Priest Rapids CR@Priest Rapids 2010 205,096 4.1 140
635489 77 2009 Fall Priest Rapids CR@Priest Rapids 2010 185,948 4.1 317
635974 1 2010 Fall Priest Rapids CR@Priest Rapids 2011 99,800 4.0 4
Total Wire Recovered 583 Estimated Total spawned 3,922

© 2013, PUBLIC UTILITY DISTRICT NO. 2 OF GRANT COUNTY, WASHINGTON. ALL RIGHTS RESERVED UNDER U.S. AND FOREIGN LAW, TREATIES AND CONVENTIONS.
C-1
Appendix CRecovery of coded-wire tags collected from adult Chinook salmon surplused from Priest
Rapids Hatchery during return year 2012.
Coded-wire tag recoveries from fish surplused (includes mortalities)
Code Tags Brood Run Stock Release Location CWT Release Exp
factor Total in Return Date #
090134 1 2007 Fall Umatilla Hatchery Umatilla R. 2008 134,400 1.0 1
090226 2 2008 Fall Umatilla Hatchery Umatilla R. 2009 146,802 1.0 2
090227 4 2008 Fall Priest Rapids CR@Ringold 2009 137,509 25.5 102
090245 4 2008 Fall Umatilla Hatchery Umatilla R. 2010 181,452 1 4
090324 9 2009 Fall Priest Rapids CR@Ringold 2010 205,935 17 149
090327 6 2008 Fall Umatilla Hatchery Umatilla R. 2010 161,815 1.0 6
090328 2 2008 Fall Umatilla Hatchery Umatilla R. 2010 157,373 1.0 2
090329 5 2008 Fall Umatilla Hatchery Umatilla R. 2010 159,167 1.0 5
090330 3 2008 Fall Umatilla Hatchery Umatilla R. 2010 160,612 1.0 3
090331 1 2009 Fall Umatilla Hatchery Snake R@Hells Canyon 2010 213,949 3.2 3
090355 1 2009 Fall Umatilla R. Umatilla R. 2011 261,953 1.005 1
090433 1 2010 Fall Umatilla Hatchery Umatilla R. 2011 138,055 1.0 1
090434 4 2010 Fall Umatilla Hatchery Umatilla R. 2011 138,007 1.0 4
090435 2 2010 Fall Umatilla Hatchery Umatilla R. 2011 141,332 1.0 2
090436 1 2010 Fall Umatilla Hatchery Umatilla R. 2011 140,958 1.0 1
090488 3 2010 Fall Priest Rapids CR@Ringold 2011 222,916 15.6 47
090492 1 2010 Fall Umatilla R. Umatilla R. 2012 90,390 1.0 1
106482 1 2009 Fall Snake River Snake R@Hells Canyon D. 2010 61,977 1.1 1
220121 1 2010 Fall Lyons Ferry Snake R@Pittsburg L 2011 100,987 2.0 2
220205 1 2010 Fall Lyons Ferry Magrudor Corridor 2011 103,007 1.0 1
220207 1 2010 Fall Lyons Ferry Luke's Gulch 2011 99,115 1.0 1
220208 1 2010 Fall Lyons Ferry Luke's Gulch 2011 101,688 1.0 1
220305 1 2008 Fall Lyons Ferry Snake R@Capn Johns 2010 70,925 1.0 1
220307 1 2009 Fall Lyons Ferry Clearwater R@Big Canyon 2010 100,461 2.5 3
220309 2 2009 Fall Lyons Ferry Snake R@Capn Johns 2010 100,778 2.606 5
220310 2 2009 Fall Lyons Ferry Snake R@Pittsburg L 2010 100,619 2.014 4
220313 1 2009 Fall Lyons Ferry Snake R@Pittsburg L 2011 93,103 1.0 1
220320 1 2010 Fall Lyons Ferry Snake R@Capn Johns 2012 81,042 1.0 1
610424 1 2008 Fall Hanford URB Wild Hanford Reach 2009 53,804 0
610437 1 2010 Fall Hanford URB Wild Hanford Reach 2011 37,116 0
610440 1 2010 Fall Hanford URB Wild Hanford Reach 2011 18,874 0
634391 22 2007 Fall Priest Rapids CR@Priest Rapids 2008 202,568 22.5 494
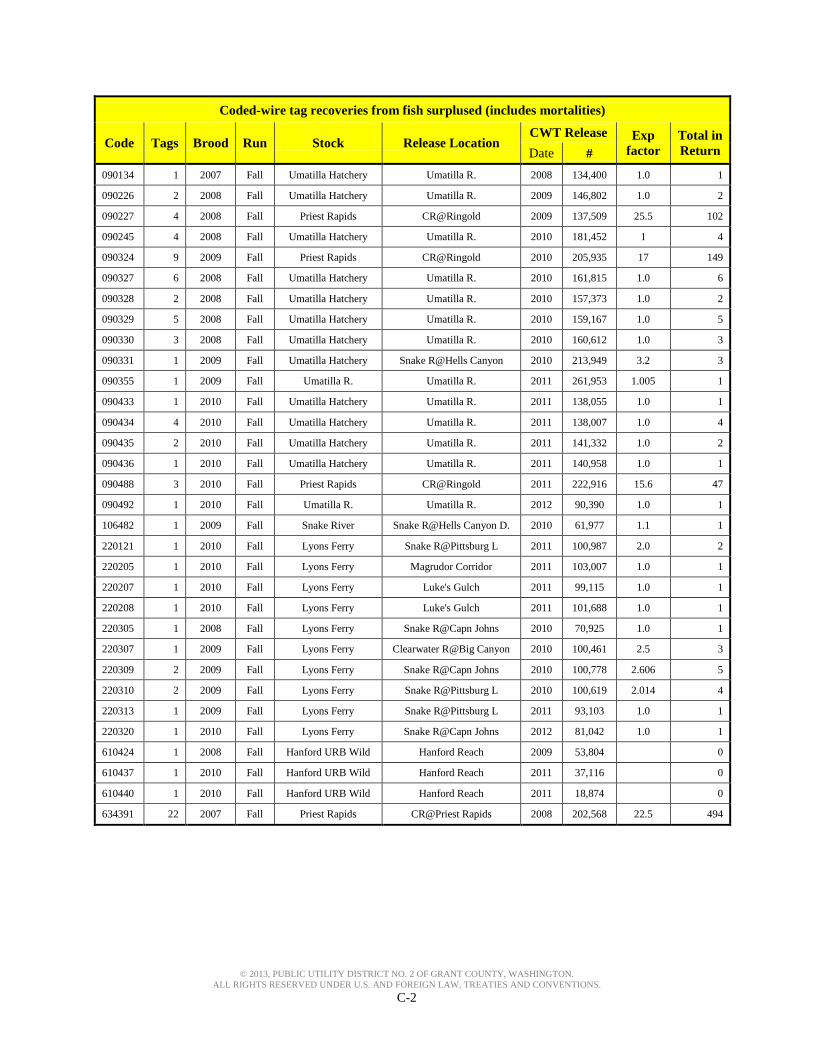
© 2013, PUBLIC UTILITY DISTRICT NO. 2 OF GRANT COUNTY, WASHINGTON. ALL RIGHTS RESERVED UNDER U.S. AND FOREIGN LAW, TREATIES AND CONVENTIONS.
C-2
Coded-wire tag recoveries from fish surplused (includes mortalities)
Code Tags Brood Run Stock Release Location CWT Release Exp
factor Total in Return Date #
090134 1 2007 Fall Umatilla Hatchery Umatilla R. 2008 134,400 1.0 1
090226 2 2008 Fall Umatilla Hatchery Umatilla R. 2009 146,802 1.0 2
090227 4 2008 Fall Priest Rapids CR@Ringold 2009 137,509 25.5 102
090245 4 2008 Fall Umatilla Hatchery Umatilla R. 2010 181,452 1 4
090324 9 2009 Fall Priest Rapids CR@Ringold 2010 205,935 17 149
090327 6 2008 Fall Umatilla Hatchery Umatilla R. 2010 161,815 1.0 6
090328 2 2008 Fall Umatilla Hatchery Umatilla R. 2010 157,373 1.0 2
090329 5 2008 Fall Umatilla Hatchery Umatilla R. 2010 159,167 1.0 5
090330 3 2008 Fall Umatilla Hatchery Umatilla R. 2010 160,612 1.0 3
090331 1 2009 Fall Umatilla Hatchery Snake R@Hells Canyon 2010 213,949 3.2 3
090355 1 2009 Fall Umatilla R. Umatilla R. 2011 261,953 1.005 1
090433 1 2010 Fall Umatilla Hatchery Umatilla R. 2011 138,055 1.0 1
090434 4 2010 Fall Umatilla Hatchery Umatilla R. 2011 138,007 1.0 4
090435 2 2010 Fall Umatilla Hatchery Umatilla R. 2011 141,332 1.0 2
090436 1 2010 Fall Umatilla Hatchery Umatilla R. 2011 140,958 1.0 1
090488 3 2010 Fall Priest Rapids CR@Ringold 2011 222,916 15.6 47
090492 1 2010 Fall Umatilla R. Umatilla R. 2012 90,390 1.0 1
106482 1 2009 Fall Snake River Snake R@Hells Canyon D. 2010 61,977 1.1 1
220121 1 2010 Fall Lyons Ferry Snake R@Pittsburg L 2011 100,987 2.0 2
220205 1 2010 Fall Lyons Ferry Magrudor Corridor 2011 103,007 1.0 1
220207 1 2010 Fall Lyons Ferry Luke's Gulch 2011 99,115 1.0 1
220208 1 2010 Fall Lyons Ferry Luke's Gulch 2011 101,688 1.0 1
220305 1 2008 Fall Lyons Ferry Snake R@Capn Johns 2010 70,925 1.0 1
220307 1 2009 Fall Lyons Ferry Clearwater R@Big Canyon 2010 100,461 2.5 3
220309 2 2009 Fall Lyons Ferry Snake R@Capn Johns 2010 100,778 2.606 5
220310 2 2009 Fall Lyons Ferry Snake R@Pittsburg L 2010 100,619 2.014 4
220313 1 2009 Fall Lyons Ferry Snake R@Pittsburg L 2011 93,103 1.0 1
220320 1 2010 Fall Lyons Ferry Snake R@Capn Johns 2012 81,042 1.0 1
610424 1 2008 Fall Hanford URB Wild Hanford Reach 2009 53,804 0
610437 1 2010 Fall Hanford URB Wild Hanford Reach 2011 37,116 0
610440 1 2010 Fall Hanford URB Wild Hanford Reach 2011 18,874 0
634391 22 2007 Fall Priest Rapids CR@Priest Rapids 2008 202,568 22.5 494

© 2013, PUBLIC UTILITY DISTRICT NO. 2 OF GRANT COUNTY, WASHINGTON. ALL RIGHTS RESERVED UNDER U.S. AND FOREIGN LAW, TREATIES AND CONVENTIONS.
C-3
Coded-wire tag recoveries from fish surplused (includes mortalities)
Code Tags Brood Run Stock Release Location CWT Release Exp
factor Total in Return Date #
634799 43 2008 Fall Priest Rapids CR@Priest Rapids 2009 216,137 31.4 1,351
635181 1 2009 Fall Lyons Ferry Lyons Ferry 2010 199,629 1.0 1
635182 3 2009 Fall Irrigon Hatchery Grande Rhonde 2010 197,251 2.0 6
635274 86 2010 Fall Priest Rapids CR@Priest Rapids 2011 99,800 4.0 342
635290 214 2009 Fall Priest Rapids CR@Priest Rapids 2010 207,185 4.1 881
635294 209 2009 Fall Priest Rapids CR@Priest Rapids 2010 205,892 4.1 860
635299 1 2009 Spring Methow River Methow River 2011 222,120 1.0 1
635484 247 2009 Fall Priest Rapids CR@Priest Rapids 2010 207,184 4.1 1,017
635485 240 2009 Fall Priest Rapids CR@Priest Rapids 2010 207,314 4.1 988
635486 204 2009 Fall Priest Rapids CR@Priest Rapids 2010 206,523 4.1 840
635487 228 2009 Fall Priest Rapids CR@Priest Rapids 2010 221,057 4.1 939
635488 267 2009 Fall Priest Rapids CR@Priest Rapids 2010 205,096 4.1 1,099
635489 190 2009 Fall Priest Rapids CR@Priest Rapids 2010 185,948 4.1 782
635699 231 2010 Fall Priest Rapids CR@Priest Rapids 2011 204,091 4.0 918
635764 176 2010 Fall Priest Rapids CR@Priest Rapids 2011 200,099 4.0 699
635766 269 2010 Fall Priest Rapids CR@Priest Rapids 2011 204,091 4.0 1,068
635970 113 2010 Fall Priest Rapids CR@Priest Rapids 2011 199,600 4.0 449
635971 154 2010 Fall Priest Rapids CR@Priest Rapids 2011 204,590 4.0 612
635972 183 2010 Fall Priest Rapids CR@Priest Rapids 2011 199,600 4.0 727
635973 184 2010 Fall Priest Rapids CR@Priest Rapids 2011 200,099 4.0 731
635974 101 2010 Fall Priest Rapids CR@Priest Rapids 2011 99,800 4.0 401
Total Wire Recovered 3,432 Estimated Total Return 15,560

© 2013, PUBLIC UTILITY DISTRICT NO. 2 OF GRANT COUNTY, WASHINGTON. ALL RIGHTS RESERVED UNDER U.S. AND FOREIGN LAW, TREATIES AND CONVENTIONS.
D-1
Appendix DLetter from Fish Passage Center providing an update for in-river travel times for Priest Rapids Hatchery origin subyearlings fall Chinook salmon smolts form the 2002 – 2012
releases.

© 2013, PUBLIC UTILITY DISTRICT NO. 2 OF GRANT COUNTY, WASHINGTON. ALL RIGHTS RESERVED UNDER U.S. AND FOREIGN LAW, TREATIES AND CONVENTIONS.
D-2
December 28. 20 12
~1r. Glen Pearson Priest Rapids Hatchery P.O. Box 937 Mattawa. WA 99349
Dear Glen-
FISH PASSAGE CENTER 1821 llo'E 44'" Aw ., Snit• 240, Portland, OR 97213
Phone: (503) 230-4099 Fax: (503) 230-7559 hrro://www Ji>c.011P
e-mail us at fix'Saff@fpc orp
The Fish Passage Center has been marking fish from the Pries t Rapids Hatchery facility o\·er the last se\·eral years as pru1 of the Smolt Mouitorin!' Pro~ (S~1P). For purposes of tllis program. data are collected on both 1he ju,·eo.ile and a dull life slages. The Si:\·iP provides information for in-season maua~emetu of the hydros)'-stem and post-season analyses to tl1e federal. state. and lribal fishery agencies. We would like 10 share with you an update of some o f the infommtion we developed tutder the Si\lP program for the fish used from the Priest Rapids Hatchery facility in 201 2 and past years.
U nder the Smolt ~1onitoring Program. information is collected on the timing. uligratiou speed. and sun 'ivai from the hatchery to ~1cKary Dam. Priest Rapids Hatchery di\ides the release of PIT-tags oYer three release dates. Table 1 below proYides estimates of mininmUL median. and maxhnun1 tra\·el times to Mc~ary Dam from each of the year's releases . Also pro, ·ided are estimates of tbe 95% confidence limits around the estimated median tra\·el time.
In addition. we are proYiding a table that presents the estimated 1 ~'o. SO%. and 90% passa!'e dates of Priest Rapids fall Chiuookj u\'eniles at Mc:"aty Dan1 for each of the years of ragged release groups: early (Table 2). nliddle (Table 3). and late (Table 4). A.lso. Figures 1-3 are pro\ided as illustrations of how the arrh-a) tinting of the 2012 smolt releases relate to last year's releases. as well as the 10-year a,·erage an·h ·aJ timlltg for the three releases (2002-2011).

© 2013, PUBLIC UTILITY DISTRICT NO. 2 OF GRANT COUNTY, WASHINGTON. ALL RIGHTS RESERVED UNDER U.S. AND FOREIGN LAW, TREATIES AND CONVENTIONS.
D-3
Table 1. Priest Rapids HatcheJY subyearling Fall Chinook Trnvel Times to McNnry Dam Coufidenct Li.mil·s Pri~t R.-.pids
Rf'le:1se :vfig1-arloo Tl·a•·el Time (Dnys) 95% Flow Dntt Y(':H' :\fin Mtd ~lax L OW('I' Gpper (Kef<)
16-Jun 1997 4.3 2 1.2 65.4 18.5 2 1.9 182.2 20-Jun 1997 L3 11.9 54.4 11.4 12.6 153.7 24-Jun 1997 4.3 10.6 38.9 9.7 ILl IID.4 13-Jun 1998 2.6 7.4 39.1 7.03 8.01 25-Jun 1998 2.5 9.6 27.4 9.2 9.9 14-Juo 1999 3.8 13 39.6 12 13.6 184.7 18-Jtu) 1999 3.2 10.5 34.3 9.7 11.2 185.6 23-JtUl 1999 2 .2 11.7 5?.2 11 12.2 196.3 15-Jun 2000 5.1 12.1 49.9 11.5 13.1 136.5 19-Jun 2000 4.4 13.4 37.4 12.3 14.2 138.1 27-Jun 2000 4.3 11.5 43 11.2 13.1 13?.6 11-Jun 2001 4.9 14 46.8 13.6 14.6 93.6 15-Jtm 2001 7.2 13.2 60 12.8 14 94.2 19-Jtm 2001 6.8 13.9 5?.8 13.7 14.1 95.1 11-Jun 2002 5.2 14.1 41.8 13.7 14.9 222.3 15-Joo 2002 5.9 11.4 39.9 11.1 13.2 223.6 19-Jtm 2002 3.9 11.3 38.9 10.2 13.1 234.2 12-Jun 2003 3.9 11.1 41.7 10.6 11.4 148.0 16-Jun 2003 4.2 9.3 34 8.9 9.8 143.3 20-Jun 2003 4.5 11.1 35.8 10.9 11.4 138.1 14-Jun 2004 3 .9 6.2 19.6 6.1 6.6 150.3 18-Jun 2004 3.2 6.8 21.6 6.5 7.0 139.1 22-Juo 2004 2.7 5.9 27.2 5.6 6.0 129.8 9-JUJl 2005 3.4 ? .8 28.2 7.2 8.4 13-Jun 2005 3.2 5.5 22.9 5.4 6.1 17-Juo 2005 0.2 7.0 19.4 6.7 7.3 12-Jun 2006 3 10.8 27.5 8.3 12.3 16-Jun 2006 3.4 12.1 25 11.1 12.4 20-Jun 2006 3.2 9.9 22.3 9.3 10.5 13-J•••• 2007 5.3 15.6 35.8 13.8 17.6 15?.9 17-June 200? 3.9 ll .8 31.4 11.0 12.8 151.7 21-June 2007 4.8 10.0 23.5 9.0 ILl 148.0 12-Jtu>e 2008 3.8 17.0 39.3 15.4 19.4 211.4 16-June 2008 4.4 17.2 33.8 16.0 19.5 207.4
15-Jtu>e 2009 4.8 14.2 36.7 12.4 15.7 147 19-June 2009 6 16.5 31 14.6 1?.7 134.3 9-Juue 2010 2.8 13.6 29.3 12.7 15.7 203.5 13-J•••• 2010 5.2 16.8 33.1 15.8 18.3 216.8 17-June 2010 2.5 13.9 30.7 12.8 15.2 224.4 15-Jwle 2011 2.8 10.0 34.0 85 12.0 297.7 19-J<u>e 2011 3.0 14.0 36.0 11.0 16.0 272.0 23-JUJte 20ll 2 .8 12.2 31.9 9.8 14.5 264.2 12-Jooe 2012 6.9 25.6 40.1 24.1 26.4 286.6 16-Jooe 2012 5.5 22.9 36.9 2LI 26.1 293.1 20-Jooe 2012 8.9 19.9 38.8 18.5 23.4 301.2
G:\STAFf\DOctJMEN'l\2012 Do~~:s\2012 Filts\160·12.&x

© 2013, PUBLIC UTILITY DISTRICT NO. 2 OF GRANT COUNTY, WASHINGTON. ALL RIGHTS RESERVED UNDER U.S. AND FOREIGN LAW, TREATIES AND CONVENTIONS.
D-4
Table!·. Estim.ated 10%, 50%~ .md 90% passage dates o f Pt ie-rt Rapids Hatchey .subye arling faU Chinook at M0:.~a:y Da!ll (Early releases).
i:\fio~tion Release 10% P assage EO~~ Pu$age 90" P ass:age Yen D-ate Date D ate- Date
199/ 16-Jun 23-Jun 5-Jul 19-Jul 1998 13-Jun 18-Jun 20-Jun 28-.luo 1999 14-Jun 20-Jun 17-Jun 11-Jul 2000 15-Jun 22-Jun 26-Jun 6-/ul 2001 11-Jun 21-Jun 2S-Jun 2-Jul 2002 11-Jun 19-Jun 25-Jun 6-/u1 2003 12-Jun 18-Jun 23-Jun 29-Ju· 2004 1<!-Jun 19-Jun 20-Jun 25-.luo 2005 19-Jun 14-Jun 17-Joo 17-.luo 2006 12.-Jun 17-Jun 23-Jun l -Jul 2007 13-Jun 22-Jun 28-Juo 9-Jul 2008 12-Jun 23-Jun 2.9-J\lll S-Jul 2009 1!-Juo 20-Juu 28-Jun 7-Jul 2010 9-J\tD 16-Jun 23-Juo 4-Jul 2011 15--June 20-Jun 25-Juo 11-Jul 2012 12-June 24-Juu i-Jul B-Jul
T llblt 3. ~~~N 10~ ~·: md 90% pa~-.a~t dMt: orP1i~t R.3p~ &tcbflY ~byud.iQJ f>!l Cbinook >t Mc.'I!!I D>m (Middlt •·tluoeo).
t\li&r:ltioza Rtlu~t 100/o Pa-.~!\lt $0°4 P-:t .s.~ :\Ct 90\, p~~::.:ct
Vt:.r D:ut Datt Dntt D'ltt 1997 20-Jun 25-Juu 2-Jul 12-Jul 1998 N/A N/A NIA NIA 1999 IS·JUD 24-Jun 28-Juo 10-Jul 2000 19-Jun '26-Jml 1-Jul 11-Jul 2001 I S-Jun '24-Jun 28-Juo 4-/u1 1002 I S.Jun 23-Juu 26-/un 9-Jul 2003 16,Jun 23-Jun 25-Jtan 2-Jul 2004 1S-Jun 23-Jun 25-Jun 27-J-..~.o
1005 13-Jun 17-Jun 18-J= 23-Juo 2006 16-Jun 22-Juu 28-Jun 4-/u1 200? 17-Jun 23-Jun 29-Jun 9-Jul 1008 16-Jun 23-Jun 3-Jul 10-Jul 2009 15-Jun 23-Jun 29-Jun S-/u1 2010 13-Juo. 22-Jun 30-Jun 7-Jul 2011 19-June 25-Jun 3-Jul 12-Jul 2012 16-June 30-Jun 9-Jul 17-Jul

© 2013, PUBLIC UTILITY DISTRICT NO. 2 OF GRANT COUNTY, WASHINGTON. ALL RIGHTS RESERVED UNDER U.S. AND FOREIGN LAW, TREATIES AND CONVENTIONS.
D-5
Table 4. Es6mafed 10%> 500.4~ and 90% pass3.ge dates o f Priest Rapids H.ab±ezy subyearliDg: fall Chinook a.t Me:.~ary Dam (Late releases).
Mign.tion R~lea.s~ 10% P:1.ssage so•...o P:~u:age 90~ Pa-ss.3ge Ye:tr D-at~ Dat~ D:a.te Date
1m 24-Jun 30-Jun 4-Jul 10-Jul 199S 25-Jun 1-Jul 4-Jul 10-Jul 1999 13-Jun 28-Jun 4-Jul 17-Jul 2000 27-Jun 5-Ju1 S-Jul 22-Jul 2001 19-Jtm 30-Jun 3-Jul 20-Jul 2002 19-Jun 25-Jun 29-Jun 11-Jul 2003 20-Jun 2 7-Jun 1-Jul 9-Jul 2004 22-Jtm 27-Jun 2S-Jun 30-Jun 2005 17-J\m 22-Jun 24-Jan 27-Jun 2006 20-Jun 26-Jun 30-Jun 5-Jul 2007 2 1-Jtm 27-Jun 1-Jul 9-Jul 200S 20-Jtm 29-Jun 7-Jul 16-Jul 2009 19-Jun 2 7-Jun 5-Jul 11-Jul 2010 17-J\Ul 24-Jun 1-Jul 9-Jul 2011 23-Juut 29-Jun S-Jul 14-Jul 2012 20-Ju.ne 2 -Jul 10-Ju] 19-Jul
~ 0.& ' z ~ 08 0 • OJ ~ .. 011 ' ~ ~ OS · io £ 0,4
• 03 ' •• -10.Y1~ ~2-1 1)
g 0~
E 0.1 0 u
- 20t$
- 2012
0 6.>10 6!17 M• l 11 718 ?lt5 7122
Figure l. E:u-ly Rel.u s:t- C roup - Cumulative passage timing of Priest Rapids Hatehery subye~ fall Chin~ Co Mc...~at)' Dam.

© 2013, PUBLIC UTILITY DISTRICT NO. 2 OF GRANT COUNTY, WASHINGTON. ALL RIGHTS RESERVED UNDER U.S. AND FOREIGN LAW, TREATIES AND CONVENTIONS.
D-6
E c3 0~ .
~ 08
i 07
i 06
.. Ob <
t OA
0~ - IO.'r'rAverq (02.11) .. 02 --2011 •
I 0' --WlZ
0 <> 611S <m .,.,. ,,. '1113' 7120 rt27 8/J
! 09
i oe 07
·~ 0.0
l 0~
i 0'
03 - Hl.Yr lw~"SI'I {02.11)
02 -tO! \ : j 0 ' --2'.012
• 0 <'! 6120 6!17 71< Jilt 7l18_ 7t>S 8/1 .,,.
Figur. 3. L:ue Relu te Croup - Cumulalit-e p:ltY;p til::i:ng of :Priest Rlpids· H.uchery ruby•:u!ing fill C1Unook 10 M<.'la!y Ihm.
Finally, Table 5 provides estimateS of survival from roi;,a;e at the hatchery to McNary Dan~ along with the upper and lower confidence li.wits on these estin•1tes. These yearly " uv-ival estimates aro for all releases of subyearling fall Chinook within a given uligration year.

© 2013, PUBLIC UTILITY DISTRICT NO. 2 OF GRANT COUNTY, WASHINGTON. ALL RIGHTS RESERVED UNDER U.S. AND FOREIGN LAW, TREATIES AND CONVENTIONS.
D-7
J ... 13-25 199S 0.840 0.639 0.940 J ... 14-23 1999 0.157 0.619 0.836 J ... 15-Z7 2000 0.666 0517 0.155 J ... 11-19 2001 0.146 0.610 0.7511 hwe 11-19 2002 0.691 0.627 0.16i J ... 12-20 2<Xn 0.633 0590 0.677 hwe 14-22 2004 0.175 0.689 0.861 hwe 09-11 2005 0.655 0573 0.129 hwe 12-20 2006 0.671 0517 0.165 hwe 13-21 2007 0.636 0564 o.sos hwe 12-20 200S 0.646 0.485 0.801 J..,. H-19 2009 0.626 0.510 0.742 .... 9-17 2010 0.647 0.514 0.780 hwe 15-23 20H 0.820 0561 1.073 hwe 12-20 2012 0500 0.358 0.642
We hope tbat the information we ba•-e pro\~ded regarding lhe use and application of infonuotiou fromlhe groups that ba\-e beeo mazh<lat the hatchery over the last several years is of son>.< \L1< to you. Ifyou would lil:.e any addiliooal infouuation regarding these relea10s pleose feel free to contact \1$.
Sincerely,
Jl,fichele DeH;ut Fi<l> Pa,.age Center M.10ager
Cc,: ~N H.m-u .. II>!' &G Bill 1'11.Yi::, WDTW J1y H•uo, Nu Ptirc~ Touy Nig:o, ODFU' F?AC

© 2013, PUBLIC UTILITY DISTRICT NO. 2 OF GRANT COUNTY, WASHINGTON. ALL RIGHTS RESERVED UNDER U.S. AND FOREIGN LAW, TREATIES AND CONVENTIONS.
E-1
Appendix EJuvenile fish health inspections for Priest Rapids Hatchery fall Chinook salmon.
Hatchery Date Species Stock Brood Year Condition
Priest Rapids 02-Mar-95 CHF Priest Rapids 1994 Healthy Priest Rapids 31-Mar-95 CHF Priest Rapids 1994 Digestive System Dysfunction Priest Rapids 08-May-95 CHF Priest Rapids 1994 Healthy Priest Rapids 08-Jun-95 CHF Priest Rapids 1994 Healthy
Priest Rapids 04-Mar-96 CHF Priest Rapids 1995 Healthy Priest Rapids 15-Apr-96 CHF Priest Rapids 1995 Healthy Priest Rapids 20-May-96 CHF Priest Rapids 1995 Healthy Priest Rapids 10-Jun-96 CHF Priest Rapids 1995 Healthy
Priest Rapids 25-Feb-97 CHF Priest Rapids 1996 Healthy Priest Rapids 28-Mar-97 CHF Priest Rapids 1996 Healthy Priest Rapids 25-Apr-97 CHF Priest Rapids 1996 Healthy Priest Rapids 28-Jun-97 CHF Priest Rapids 1996 Healthy
Priest Rapids 27-Feb-98 CHF Priest Rapids 1997 Healthy Priest Rapids 01-Apr-98 CHF Priest Rapids 1997 Healthy Priest Rapids 06-May-98 CHF Priest Rapids 1997 Healthy Priest Rapids 03-Jun-98 CHF Priest Rapids 1997 Healthy
Priest Rapids 23-Feb-99 CHF Priest Rapids 1998 Healthy Priest Rapids 22-Mar-99 CHF Priest Rapids 1998 Healthy Priest Rapids 23-Apr-99 CHF Priest Rapids 1998 Healthy Priest Rapids 25-May-99 CHF Priest Rapids 1998 Dropout Syndrome & Bacterial
Priest Rapids 08-Sep-99 CHF Priest Rapids 1998 Bacterial Kidney Disease Priest Rapids 06-Mar-00 CHF Priest Rapids 1999 Healthy
Priest Rapids 14-Apr-00 CHF Priest Rapids 1999 Healthy Priest Rapids 16-May-00 CHF Priest Rapids 1999 Healthy Priest Rapids 12-Jun-00 CHF Priest Rapids 1999 Healthy
Priest Rapids 23-Feb-01 CHF Priest Rapids 2000 Healthy Priest Rapids 05-Apr-01 CHF Priest Rapids 2000 Healthy Priest Rapids 07-May-01 CHF Priest Rapids 2000 Healthy Priest Rapids 06-Jun-01 CHF Priest Rapids 2000 Healthy
Priest Rapids 13-Feb-02 CHF Priest Rapids 2001 Healthy Priest Rapids 01-Mar-02 CHF Priest Rapids 2001 Coagulated Yolk Syndrome Priest Rapids 22-Apr-02 CHF Priest Rapids 2001 Healthy Priest Rapids 10-Jun-02 CHF Priest Rapids 2001 Healthy
Priest Rapids 07-Mar-03 CHF Priest Rapids 2002 Healthy Priest Rapids 15-Apr-03 CHF Priest Rapids 2002 Healthy Priest Rapids 02-Jun-03 CHF Priest Rapids 2002 Healthy
Priest Rapids 01-Apr-04 CHF Priest Rapids 2003 Healthy Priest Rapids 06-May-04 CHF Priest Rapids 2003 Healthy Priest Rapids 07-Jun-04 CHF Priest Rapids 2003 Healthy
Priest Rapids 11-Mar-05 CHF Priest Rapids 2004 Healthy Priest Rapids 14-Apr-05 CHF Priest Rapids 2004 Healthy
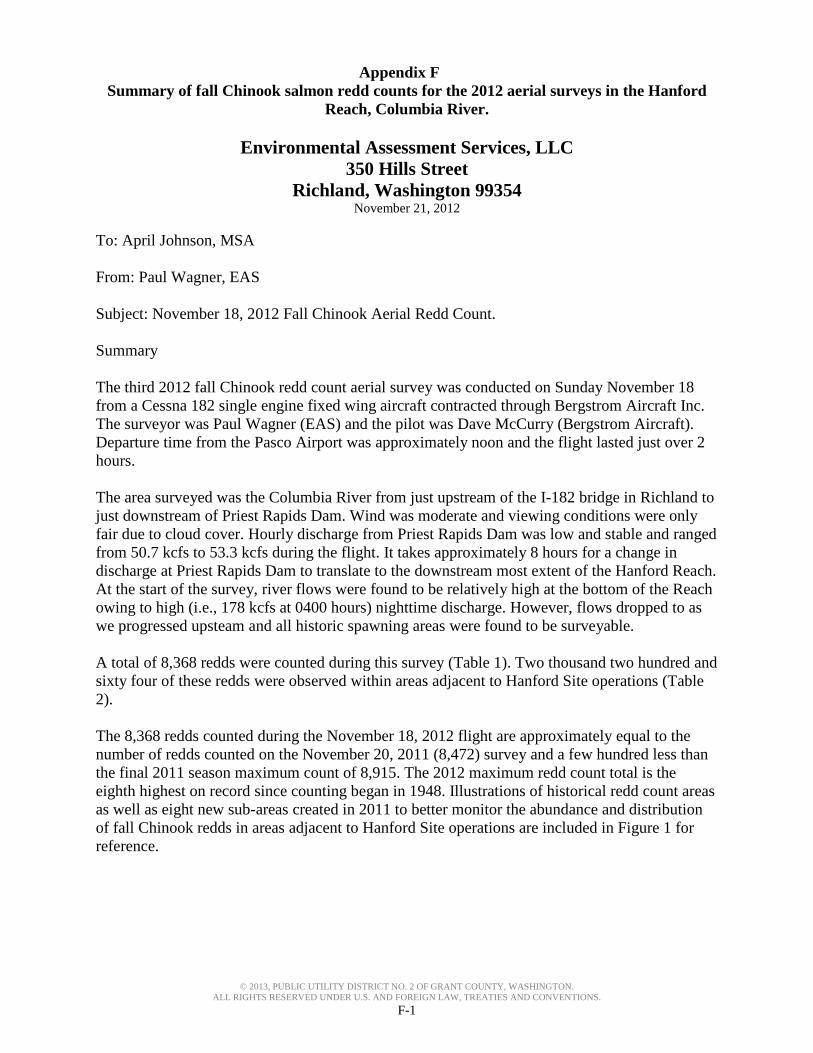
© 2013, PUBLIC UTILITY DISTRICT NO. 2 OF GRANT COUNTY, WASHINGTON. ALL RIGHTS RESERVED UNDER U.S. AND FOREIGN LAW, TREATIES AND CONVENTIONS.
F-1
Appendix FSummary of fall Chinook salmon redd counts for the 2012 aerial surveys in the Hanford
Reach, Columbia River.
Environmental Assessment Services, LLC 350 Hills Street
Richland, Washington 99354 November 21, 2012
To: April Johnson, MSA From: Paul Wagner, EAS Subject: November 18, 2012 Fall Chinook Aerial Redd Count. Summary The third 2012 fall Chinook redd count aerial survey was conducted on Sunday November 18 from a Cessna 182 single engine fixed wing aircraft contracted through Bergstrom Aircraft Inc. The surveyor was Paul Wagner (EAS) and the pilot was Dave McCurry (Bergstrom Aircraft). Departure time from the Pasco Airport was approximately noon and the flight lasted just over 2 hours. The area surveyed was the Columbia River from just upstream of the I-182 bridge in Richland to just downstream of Priest Rapids Dam. Wind was moderate and viewing conditions were only fair due to cloud cover. Hourly discharge from Priest Rapids Dam was low and stable and ranged from 50.7 kcfs to 53.3 kcfs during the flight. It takes approximately 8 hours for a change in discharge at Priest Rapids Dam to translate to the downstream most extent of the Hanford Reach. At the start of the survey, river flows were found to be relatively high at the bottom of the Reach owing to high (i.e., 178 kcfs at 0400 hours) nighttime discharge. However, flows dropped to as we progressed upsteam and all historic spawning areas were found to be surveyable. A total of 8,368 redds were counted during this survey (Table 1). Two thousand two hundred and sixty four of these redds were observed within areas adjacent to Hanford Site operations (Table 2). The 8,368 redds counted during the November 18, 2012 flight are approximately equal to the number of redds counted on the November 20, 2011 (8,472) survey and a few hundred less than the final 2011 season maximum count of 8,915. The 2012 maximum redd count total is the eighth highest on record since counting began in 1948. Illustrations of historical redd count areas as well as eight new sub-areas created in 2011 to better monitor the abundance and distribution of fall Chinook redds in areas adjacent to Hanford Site operations are included in Figure 1 for reference.

© 2013, PUBLIC UTILITY DISTRICT NO. 2 OF GRANT COUNTY, WASHINGTON. ALL RIGHTS RESERVED UNDER U.S. AND FOREIGN LAW, TREATIES AND CONVENTIONS.
F-2
Table 1. Summary of fall Chinook salmon redd counts for the 2012 aerial surveys in the Hanford Reach, Columbia River.
Maximum
Area Description 10/21/2012 10/30/2012 11/11/2012 11/18/2012 Count
0 Islands 17-21 (Richland) 0 0 NA 0 0
1 Islands 11-16 3 147 NA 533 533 2 Islands 8-10 4 353 NA 807 807 3 Near Island 7 12 425 NA 700 700
4 Island 6 (lower half) 14 553 NA 1,375 1,375
5 Island 4, 5 and upper 6 9 947 NA 1,195 1,195
6 Near Island 3 1 225 NA 475 475 7 Near Island 2 6 301 NA 528 528 8 Near Island 1 4 160 NA 340 340
9 Near Coyote Rapids 1 19 NA 29 29
Midway (China Bar) 0 25 NA 68 68
10 Near Vernita Bar 28 1,180 NA 2,315 2,315
11 Near Priest Rapids Dam 0 0 NA 3 3
TOTAL 82 4,335 NA 8,368 8,368 Table 2. 2012 summary of fall Chinook aerial redd counts by Hanford Site sub-sections. Hanford Site
Maximum
Sub-area
10/21/2012
10/30/2012
11/11/2012
11/18/2012 Count
300 Area 0 0 NA 0 0 Dunes 0 0 NA 0 0 100F 12 425 NA 700 700 100H 9 947 NA 1,195 1,195 100D 4 160 NA 340 340 100N 0 0 NA 0 0 100K 0 0 NA 0 0 100BC 1 19 NA 29 29 TOTAL 26 1,551 NA 2,264 2,264

© 2013, PUBLIC UTILITY DISTRICT NO. 2 OF GRANT COUNTY, WASHINGTON. ALL RIGHTS RESERVED UNDER U.S. AND FOREIGN LAW, TREATIES AND CONVENTIONS.
F-3
Figure 1. Illustrations of the Hanford Reach of the Columbia River and Historic Fall Chinook Aerial Survey Redd Count Areas (Top) and Sub-Areas Specific to the Hanford Site (Bottom).
8••••c:===o•••••••lll8 Miles N
A
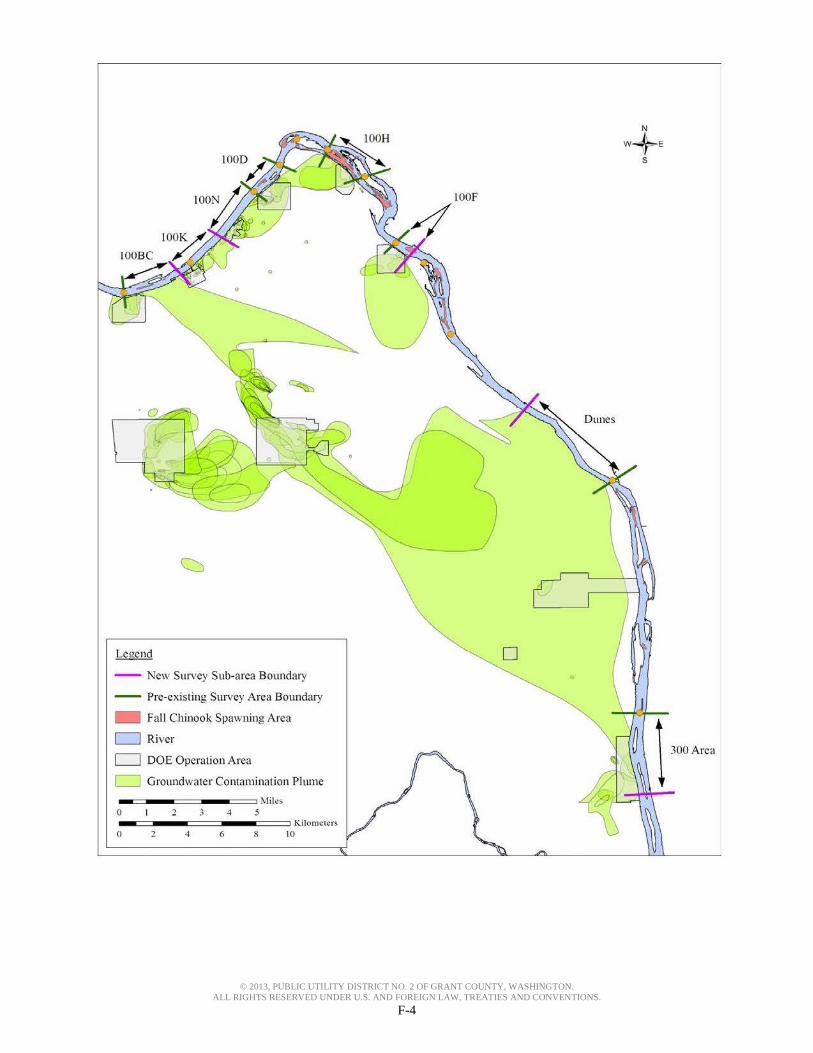
© 2013, PUBLIC UTILITY DISTRICT NO. 2 OF GRANT COUNTY, WASHINGTON. ALL RIGHTS RESERVED UNDER U.S. AND FOREIGN LAW, TREATIES AND CONVENTIONS.
F-4
Legend
- New Swvcy Sub-area Bounda•y
- Pre-existing Survey Area Boundary
- fall Chinook Spawning Area
D River
D DOE Operation Area
D Groundwater Contamination Plume
MHes 0 2 3 4 5
Kilome1ers 0 2 4 6 8 10

© 2013, PUBLIC UTILITY DISTRICT NO. 2 OF GRANT COUNTY, WASHINGTON. ALL RIGHTS RESERVED UNDER U.S. AND FOREIGN LAW, TREATIES AND CONVENTIONS.
F-5
Number and percent of fall Chinook salmon redds counted in different reaches of the Columbia River, 2001-2012. Data for years 2001-2010 was provided by Pacific Northwest National Laboratory. Data for years 2011 – 2012 was provided by Environmental Assessment Services, LLC. Location 2001 2002 2003 2004 2005 2006 2007 2008 2009 2010 Islands
297 509 554 337 708 36 302 371 176 562
Islands
480 865 1,133 867 1,067 435 338 416 722 870 Near
350 280 455 415 500 873 311 360 380 457
Island 6
750 940 1,241 1,084 1,229 289 615 753 878 1,135 Island 4,
1,130 1,165 1,242 1,655 1,130 934 655 960 796 1,562
Near
460 249 475 325 345 1,305 152 230 285 244 Near
780 955 850 960 895 523 455 555 459 657
Near
35 235 270 330 255 253 47 148 160 324 Coyote
16 63 354 180 304 150 10 29 34 49
China
20 25 85 75 28 52 3 35 1,090 299 Vernita
1,930 2,755 2,806 2,240 1,430 1,658 1,135 1,731 16 2,658
Total 6,248 8,041 9,465 8,468 7,891 6,508 4,023 5,588 4,996 8,817 Location 2001 2002 2003 2004 2005 2006 2007 2008 2009 2010 Islands
5% 6% 6% 4% 9% 1% 8% 7% 4% 6%
Islands
8% 11% 12% 10% 14% 7% 8% 7% 14% 10% Near
6% 3% 5% 5% 6% 13% 8% 6% 8% 5%
Island 6
12% 12% 13% 13% 16% 4% 15% 13% 18% 13% Island 4,
18% 14% 13% 20% 14% 14% 16% 17% 16% 18%
Near
7% 3% 5% 4% 4% 20% 4% 4% 6% 3% Near
12% 12% 9% 11% 11% 8% 11% 10% 9% 7%
Near
1% 3% 3% 4% 3% 4% 1% 3% 3% 4% Coyote
>1% 1% 4% 2% 4% 2% >1% 1% 1% 1%
China
>1% >1% 1% 1% >1% 1% >1% 1% 22% 3% Vernita
31% 34% 30% 26% 18% 25% 28% 31% >1% 30%
Location 2011 2012 Ten-Yr (2002-11) Islands
676 533 423
Islands
814 807 753 Near
670 700 470
Island 6
1,181 1,375 935 Island 4,
1,524 1,195 1,162
Near
525 475 414 Near
653 528 696
Near
295 340 232 Coyote
44 29 122
China
67 68 176 Vernita
2,466 2,318 1,890
Total 8,915 8,368 7,271 Location 2011 2012 Ten-Yr (2002-11)
Islands
8% 6% 6% Islands
9% 10% 10%
Near
8% 8% 6% Island 6
13% 16% 13%
Island 4,
17% 14% 16% Near
6% 6% 6%
Near
7% 6% 10% Near
3% 4% 3%
Coyote
>1% >1% 2% China
1% 1% 2%
Vernita
28% 28% 26%

© 2013, PUBLIC UTILITY DISTRICT NO. 2 OF GRANT COUNTY, WASHINGTON. ALL RIGHTS RESERVED UNDER U.S. AND FOREIGN LAW, TREATIES AND CONVENTIONS.
G-1
Appendix GHistorical numbers of Chinook salmon carcasses recovered during the annual Hanford
Reach fall Chinook salmon carcass survey.
Return Year Total
1990 2,194
1991 2,519
1992 2,221
1993 3,340
1994 5,739
1995 3,914
1996 4,529
1997 5,053
1998 4,456
1999 4,412
2000 10,556
2001 6,072
2002 8,402
2003 13,573
2004 11,030
2005 8,491
2006 5,972
2007 3,115
2008 5,455
2009 5,318
2010 9,779
2011 8,391
2012 6,814
Mean 6,145

© 2013, PUBLIC UTILITY DISTRICT NO. 2 OF GRANT COUNTY, WASHINGTON. ALL RIGHTS RESERVED UNDER U.S. AND FOREIGN LAW, TREATIES AND CONVENTIONS.
H-1
Appendix HHistorical proportion of hatchery and wild origin Chinook salmon estimated by expanded
coded-wire tag recoveries collected during fall Chinook salmon carcass surveys in the Hanford Reach.
Return Year Origin Total Hatchery Origin (%)
1997 Natural 4,377
Hatchery 676 13.4%
1998 Natural 4,210
Hatchery 246 5.5%
1999 Natural 3,645
Hatchery 767 17.4%
2000 Natural 7,947
Hatchery 2,609 24.7%
2001 Natural 5,697
Hatchery 375 6.2%
2002 Natural 7,704 Hatchery 698 8.3%
2003 Natural 12,278 Hatchery 1,246 9.2%
2004 Natural 9,935 Hatchery 907 8.4%
2005 Natural 7,606 Hatchery 885 10.4%
2006 Natural 5,627 Hatchery 345 5.8%
2007 Natural 3,186 Hatchery 129 3.9%
2008 Natural 5,202 Hatchery 253 4.6%
2009 Natural 4,907 Hatchery 411 7.7%
2010 Natural 9,395 Hatchery 396 4.0%
2011 Natural 7,847 Hatchery 544 6.5%
2012 Natural 6,308 Hatchery 506 7.4%
15 yr (97 – 11) Mean Natural 6,638 Hatchery 669 9.5%

© 2013, PUBLIC UTILITY DISTRICT NO. 2 OF GRANT COUNTY, WASHINGTON. ALL RIGHTS RESERVED UNDER U.S. AND FOREIGN LAW, TREATIES AND CONVENTIONS.
I-1
Appendix IEstimated escapement for fall Chinook spawning in the Priest Rapids Dam pool.
Priest Rapids Pool Escapement
Count Source
2012 Adult Jack Total
Wanapum Adult Passage1 21,290 5,125 26,415
Wanapum Dam Fallback Adjustment Unknown Unknown
Priest Rapids Fallback Adjustment2 14,255 2,728 16,983 Wanapum Tribal Fishery Above PRD 209 OLAFT 492 27 519
Priest Rapids Pool Sport Fishery 685 0 685
Total 36,931 7,880 43,917
Priest Rapids Adult Passage3 54,283 10,389 64,672
Priest Rapids Dam Pool Escapement 17,352 2,509 20,755 1 Wanapum Dam passage for fall Chinook based on counts from August 15 through November 15. 2 Fallback estimate based on fallback rate for 3 ROR PIT groups (BO AFF, OLAFT, COLR3) 3 Priest Rapids passage for fall Chinook based on counts from August 18 through November 15.