priest rapids dam, 1986 - national oceanic and · pdf file/ brand positions abreviations are:...
TRANSCRIPT

TRANSPORTATION STUDIES AT
PRIEST RAPIDS DAM, 1986
by Steve Achord
and Donn L. Park
Annual Report of Research Financed by
Public Utility District No. 2 of Grant County
(Contract 430-260)
and
Coastal Zone and Estuarine Studies Division Northwest and Alaska Fisheries Center
National Marine Fisheries Service National Oceanic and Atmospheric Administration
2725 Montlake Boulevard East Seattle, Washington 98112
January 1987

CONTENTS
Page
INTRODUCTION ••••••••••••••••••••••••••••••••••••••••••••••••••••••••••••••• 1
METHODS •••••••••••••••••••••••••••••••••••••••••••••••••••••••••••••••••••• 2
Fish Collection, Handling, and Marking ••••••••••••••••••••••••••••••••••• 2
Seawater Challenge Stress Studies •••••••••••••••••••••••••••••••••••••••• 6
Collection of Adults from Transportation Tests in 1984-1985 •••••••••••••• 7
RESULTS AND DISCUSSION ••••••.•••••••••••••••••••••••.•••••••••••••••••••••• 7
Fish Handling and Marking •••••••••••••••••••••••••••••••••••••••••••••••• 7
Seawater Challenge Stress Studies ••••••••••••••••••••••••••••••••••••••• 10
Collection of Adults from Transportation Tests in 1984-1985 ••••••••••••• 13
SUMlfARY AND CONCLUSIONS ••••••••••••••••••••••••••••••••••••••••••••••••••• 18
RECOMMENDATIONS ••••••••••••••••••••••••••••••••••••••••••••••••••••••••••• 19
LITERATURE CITED •••••••••••••••••••••••••••••••••••••••••••••••••••••••••• 20
APPENDIX •••••••••••••••••••••••••••••••••••••••••••••••••••••••••••••••••• 21
1
INTRODUCTION
Previous research by the National Marine Fisheries Service (NMFS) on the
Snake River indicated that transportation of juvenile salmonids from upriver
collector dams to a release site below Bonneville Dam can substantially
increase the survival of smolts and subsequent numbers of returning adults
compared with smolts not transported (Ebel 1980; Park 1980; Park 1985). If
transportation of smolts can be proven to be also beneficial at Priest Rapids
Dam, managers will be provided with an option for protecting valuable stocks
of salmonids from the Mid-Columbia region.
Since 1984, the NMFS has participated in a program with the Grant County
Public Utility District (PUD) to determine the benefit of transporting
juvenile smolting chinook and sockeye salmon collected at Priest Rapids Dam to
a release site downstream from Bonneville Dam. This year (1986) was the third
year of a 3-year study for marking juvenile chinook and sockeye salmon at
Priest Rapids Dam (one of three related studies conducted under guidelines
established by the Mid-Columbia River Studies Committee).
In 1986, NMFS did the following: (1) sorted juvenile salmonids collected
at Priest Rapids and Wanapum Dams; (2) marked juvenile chinook and sockeye
salmon for the transport study; (3) measured, through seawater challenge, the
relative stress induced in spring chinook and sockeye salmon by
handling/marking; and (4) monitored the return of adults in the fisheries and
at Columbia River trapping facilities from juveniles tagged at Priest Rapids
Dam in 1984 and 1985.

2
METHODS
Fish Collection, Handling, and Marking
Fish handling and marking facilities at Priest Rapids Dam were in
operation on 21 April 1986. The same sorting and marking complex, which
included two mobile fish marking units and a mobile sorting unit, was used in
1986 as in the two previous years. The facilities, smolt collection gear,
methods, and fish transport apparatus were described by Dell et al. (1985).
Grant County PUD personnel collected fish to be used for the study. Most
were sampled from the turbine intake gatewells at Priest Rapids Dam, as in
1984 and 1985. As in 1985, supplemental fish were used from Wanapum Dam.
Smolt collection gear and methods used at Wanapum Dam were described by Achord
et al. (1985).
Limited seawater challenge data from experiments in 1985 indicated that
sockeye salmon may be stressed during handling/marking. In an effort to
reduce stress to sockeye salmon in 1986, we increased concentrations of MS-222
in the transfer container from the Priest Rapids' gatewells and in the
circular tanks used at Wanapum Dam from 37.5 to 50 ppm. To maintain complete
anesthesia of the sockeye salmon during the sorting and marking process, we
increased the MS-222 concentration in our anesthetic system from 35 to 40 ppm.
Fish entering the sorting unit were identified by species and examined
for prior marks. Brands were recorded for fish collected from Priest Rapids
Dam for the Fish Passage Center (FPC). All previously marked fish together
with all coho salmon and steelhead were passed via a freshwater line to the
circular tank where they were held until nighttime and then released into the
Columbia River. Chinook and sockeye salmon to be marked were passed via

3
anesthetic water lines to the tagging units after receiving an adipose fin
clip at the sorting station. All smolt sized fish were marked unless they
showed obvious signs ··of injury or gross descaling. One marking unit was set
up for marking transported fish, the other for marking controls for release
into the river below the dam. To assure random and equal distribution of
species and fish numbers between the two marking units, personnel clipping the
adipose fins alternately distributed the fish to each marking unit. In each
marking unit, fish were freeze branded with a tool cooled by liquid nitrogen,
tagged with a magnetic coded wire tag (CWT), passed through a detection
system, and accepted or rejected to ensure the presence of a magnetized tag.
Fish markers were rotated periodically between the sorting and marking units
to ensure equal marking treatment of transport and control marked groups.
Following marking, the fish passed through a pipe via fresh water to either a
fish holding tank for release into the river at night (control) or to a
transport tank for transportation by truck to the release site in the Columbia
River near Corbett Station below Bonneville Dam. During fish marking
operations, fish were periodically taken from the marking lines and held for a
5-day observation period to determine delayed mortality, tag retention, and
brand legibility.
Wire tag codes and brands were changed either on a weekly basis or as
marked group quotas were met to obtain contribution data from the various
segments of the smolt outmigration. Different wire codes and brands were used
to identify fish collected from Wanapum and Priest Rapids Dams as well as
transport and control releases. Different wire codes and brands were also
used on sockeye and chinook salmon, except the same brand was used on the two
species for the first part of the marking season (Tables 1 and 2).
4
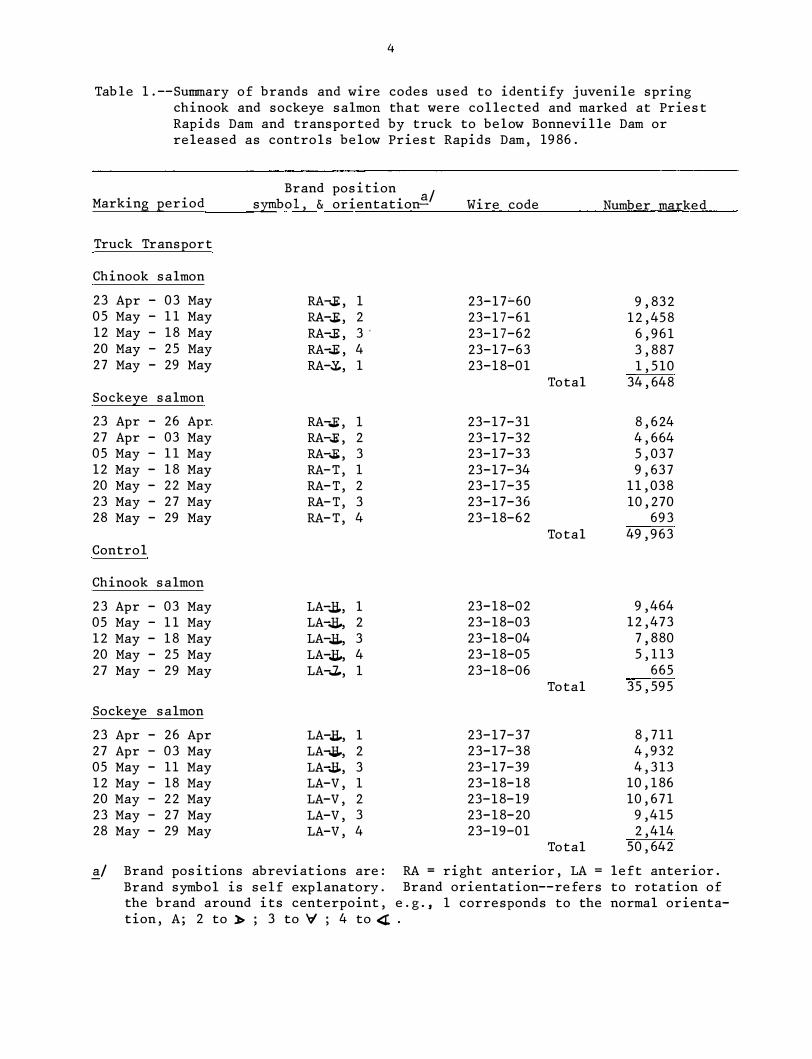
Table 1.--Summary of brands and wire codes used to identify juvenile spring chinook and sockeye salmon that were collected and marked at Priest Rapids Dam and transported by truck to below Bonneville Dam or released as controls below Priest Rapids Dam, 1986.
Marking period
Truck Transport
Chinook salmon
23 Apr - 03 May 05 May - 11 May 12 May - 18 May 20 May - 25 May 27 May - 29 May
Sockeye salmon
23 Apr - 26 Apr. 27 Apr - 03 May 05 May - 11 May 12 May - 18 May 20 May - 22 May 23 May - 27 May 28 May - 29 May
Control
Chinook salmon
23 Apr - 03 May 05 May - 11 May 12 May - 18 May 20 May - 25 May 27 May - 29 May
Sockeye salmon
23 Apr - 26 Apr 27 Apr - 03 May 05 May - 11 May 12 May - 18 May 20 May - 22 May 23 May - 27 May 28 May - 29 May
Brand position b 1 . . . a/ sym o , & orientation-
RA-Ji!, 1 RA-.E, 2 RA-.E, 3 · RA-.E, 4 RA-.Y., 1
RA-.i, 1 RA-.E, 2 RA-.E, 3 RA-T, 1 RA-T, 2 RA-T, 3 RA-T, 4
LA-Ji,, 1 LA-JI-, 2 LA-Jl., 3 LA-Ji-, 4 LA-..Z., 1
LA-J;I., 1 LA-J;J., 2 LA-J;J., 3 LA-V, 1 LA-V, 2 LA-V, 3 LA-V, 4
Wire code
23-17.;..6023-17-6123-17-6223-17-6323-18-01
23-17-3123-17-3223-17-3323-17-3423-17-3523-17-3623-18-62
23-18-0223-18-0323-18-0423-18-0523-18-06
23-17-3723-17-3823-17-3923-18-1823-18-1923-18-2023-19-01
Total
Total
Total
Total
Number marked
9,832 12,458
6,961 3,887 1,510
34,648
8,624 4,664 5,037 9,637
11,038 10,270
693 49,963
9,464 12,473
7,880 5,113
665 35,595
8,711 4,932 4,313
10,186 10,671
9,415 2,414
50,642
�/ Brand positions abreviations are: RA = right anterior, LA = left anterior. Brand symbol is self explanatory. Brand orientation--refers to rotation of the brand around its centerpoint, e.g. 1 1 corresponds to the normal orientation, A; 2 to > ; 3 to \:/ ; 4 to<(. .

5
Table 2.--Summary of brands and wire codes used to identify juvenile spring chinook and sockeye salmon that were collected at Wanapum Dam, marked at Priest Rapids Dam, and transported by truck to below Bonneville Dam or released as controls below Priest Rapids Dam, 1986.
Brand position Marking period symbol, & orientation�/ Wire code Number marked
Truck transport
Chinook salmon
24 Apr - 02 May RA-lSI,, 1 23-18-27 10,479 05 May - 08 May RA-J:il,, 2 23-18-28 8,831 12 May - 16 May RA-Jil,, 3 23-18-29 4,782 19 May - 23 May RA-� 4 23-18-30 1,457 27 May - 02 June RA-:.':v, 3 23-18-31 1,327
Total 26,876
Sockeye salmon
24 Apr - 25 Apr RA-Ji,, 1 23-18-21 2,006 28 Apr - 02 May RA-J;il,, 4 23-18-22 2,018 05 May - 08 May RA-.&, 3 23-18-23 853 12 May - 16 May RA-U, 1 23-18-24 2,205 19 May - 23 May RA-U, 2 23-18-25 4,180 27 May - 02 June RA-U, 3 23-18-26 3,159
Total 14,421
Control
Chinook salmon
24 Apr - 02 May LA-,&, 1 23-18-39 10,438 05 May - 08 May LA-.&, 2 23-18-40 8,898 12 May - 16 May LA-J3,, 3 23-18-41 5,250 19 May - 23 May LA--;&, 4 23-18-42 1,521 27 May - 02 June LA-..J., 3 23-18-43 1,176
Total 27,283
Sockeye salmon
24 Apr - 25 Apr LA-�, 1 23-18-33 2,239 28 Apr - 02 May LA-.B,., 4 23-18-34 1,919 05 May - 08 May LA-.B.., 3 23-18-35 779 12 May - 16 May LA-L, 1 23-18-36 2,189 19 May - 23 May LA-L, 2 23-18-37 4,065 27 May - 02 June LA-L, 3 23-18-38 3,093
Total 14,284
�/ See Tab le 1 �/

6
Seawater Challenge Stress Studies
In 1986, seawater challenge tests measured the stress of handling and
marking on both spring chinook and sockeye salmon. The tests were conducted
in the mobile laboratories located at Priest Rapids Dam. Static seawater
challenge bioassay techniques and sampling procedures were used (Park et al.
1983 and Matthews et al. 1986). Information was recorded on coho salmon and
steelhead inadvertently sampled with spring chinook and sockeye salmon. All
test series were conducted in 34 ppt artificial seawater.
Debilitating stress incurred via the handling/marking process was
determined by measuring seawater mortality in test groups sampled prior to and
after marking. Fish for the prior to marking group (termed "pre-mark" test
condition) were obtained from unanesthetized fish sampled from the transfer
container upon arrival at the marking facility. Fish for the post marking
group (termed "pre-transport" test condition) were obtained from the transport
truck prior to transport and at least 2h after marking. Each of these test
series had three replicates for each sample point, with each replicate
containing 20 to 30 fish of each species. The test series were conducted on
7, 15, and 20 May.
Data on individual lengths, live and dead fish numbers, and descaling
were recorded at the conclusion of each 24-h seawater challenge test series
(Appendix Table 1). Two-way contingency tables with chi-square statistics
were utilized to measure levels of significance. Significance was established
at P(0.05, df = n for comparison between test groups.

7
Collection of Adults from Transportation Tests in 1984-1985
Adult spring chinook and sockeye salmon returning in 1986 from
transportation tests conducted in 1984-1985 were monitored from ocean fishing
catches; Columbia River and tributary catches; spawning grounds; and trapping
facilities at Bonneville, McNary, and Priest Rapids Dams.
Adult trapping facilities were constructed and placed into operation for
the first time this year at Priest Rapids Dam. These facilities were operated
by Grant County PUD personnel from late April through August, which covered
the major portions of the spring chinook and sockeye salmon runs. NMFS
personnel operated similar facilities through the adult runs at Bonneville and
McNary Dams. Trapping was accomplished 7 days/week in most cases, however, at
Priest Rapids Dam sampling was restricted to limited hours of operation each
day. At Bonneville Dam, we estimate NMFS sampled approximately 30% of the
sockeye migration and a very low percentage of the spring chinook salmon
run. At McNary Dam no reasonable estimate of sampling could be established
for either species. The sampling rate at Priest Rapids Dam is as yet unknown
but should be available from adults marked at the trap and subsequently
recovered at upstream hatcheries and the spawning grounds. These data will be
available later.
RESULTS AND DISCUSSION
Fish Handling and Marking
From fish collected at Priest Rapids Dam during the marking season (23
April to 29 May), 34,648 spring chinook salmon and 49,963 sockeye salmon were
marked with CWT, freeze brands, and adipose fin clips and transported by truck
to a release site below Bonneville Dam (Table 1). In addition, 26,876 spring

8
chinook salmon and 14,421 sockeye salmon collected from Wanapum Dam (24 April
to 2 June) were marked and likewise transported (Table 2). An additional
35,595 spring chinook salmon and 50,642 sockeye salmon C?llected from Priest
Rapids Dam (Table 1) and 27,283 spring chinook salmon and 14,284 sockeye
salmon collected from Wanapum Dam (Table 2) were marked and released as
controls below Priest Rapids Dam.
A total of 482 spring chinook salmon were marked and held during four
5-day holding periods and 649 sockeye salmon were marked and held during
five 5-day holding periods, throughout the marking season (Table 3). Delayed
mortality was 0.0% for chinook salmon and 1.8% for sockeye salmon. Tag loss
averaged 1.0% for chinook salmon and 1.2% for sockeye salmon. Brand
placement, retention, and legibility were judged good throughout the season
for chinook salmon, with only 6.4% of the brands categorized as poor (Table
3). From 23 April to 11 May, sockeye salmon were branded with the "rocking
series" brands. During this time, 32.7 and 37.1% of the total sockeye salmon
were branded for the season from Priest Rapids and Wanapum Dams,
respectively. After the second holding period for sockeye salmon, however, it
was decided to completely change the brand series because the "rocking series"
3/16-inch brands were judged to be of very poor quality (37.8% categorized as
poor) (Table 3). From 12 May to 2 June the remaining 67.3 and 62.9% of the
sockeye salmon from Priest Rapids and Wanapum Dams, respectively, were marked
with selected single brands for the two dams. Brand condition for this time
period indicated 0.0% poor brands, with 99.4% of the brands judged good (Table
3).
A combined total for both dams of 11 chinook salmon subyearlings, 34,033
chinook salmon yearlings, 22,303 sockeye salmon, 34,420 steelhead, and 23,329
coho salmon were sorted directly to a holding tank and subsequently released

9
Table 3.--SuI1U11ary of survival, mortality, tag loss, and brand placement and condition after 5-day holding of marked juvenile spring chinook and sockeye salmon at Priest Rapids Dam, 1986.
Number Brand dondition .Holding:: Number Number with Number Number Number period. alive dead lost tags good fair poor
Chinook
02 May - 07 May 120 0 4 63 37 20 09 May - 14 May 187 0 1 150 30 7 16 May - 21 May 87 0 0 65 20 2 27 May - 01 June 88 0 0 82 4 2
Totals 482 0 5 360 91 31
Sockeye
26 Apr - 01 May 108 1 0 37 30 41 02 May - 07 May 109 2 2 15 20 74 09 May - 14 May 103 0 3 79 18 6
*16 May - 21 May 143 0 1 141 2 0 27 May - 01 June 174 9 2 174 0 0
Totals 637 12 8 446 70 121
* - Brand series changed

10
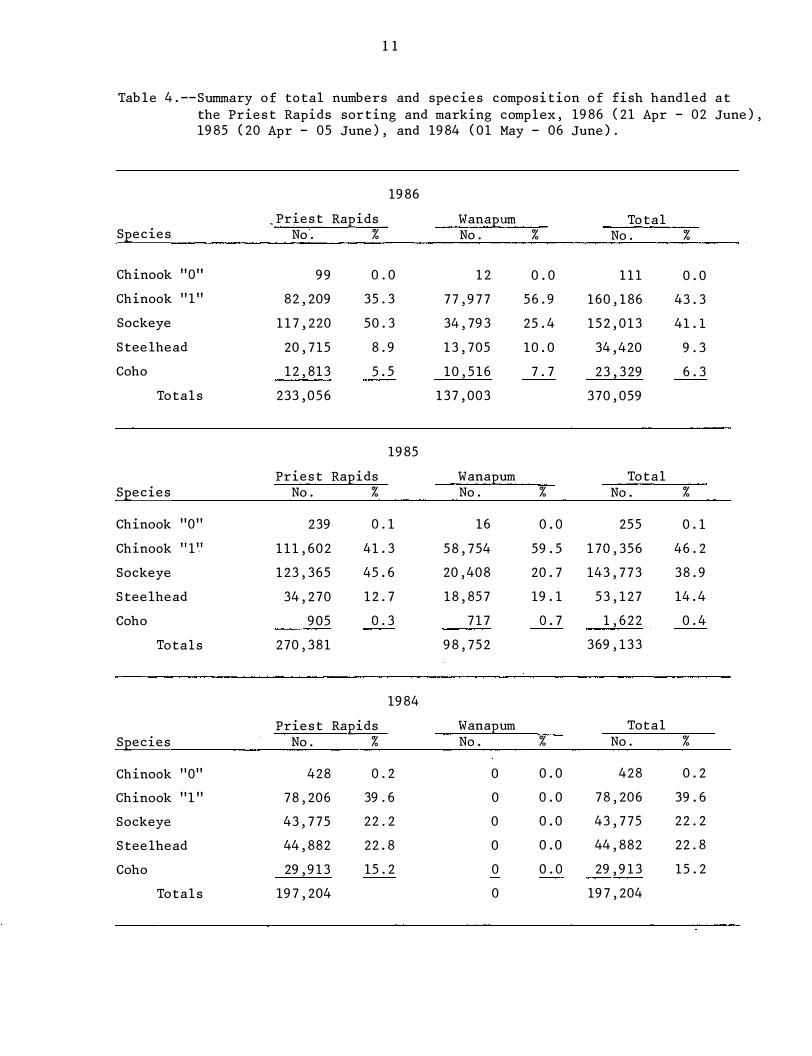
into the river during the marking period. A grand total of 370,059 juvenile
salmonids was handled at the sorting and marking complex in 1986. Grand
totals for 1985 and 1984 were 369,133 and 197,204, respectively (Table 4).
Seawater Challenge Stress Studies
The results of seawater challenge stress tests with spring chinook and
sockeye salmon are presented in Figure 1 and Appendix Table 1. Data indicate
that, as in 1984 and 1985, no significant increase in stress occurred during
handling and marking of spring chinook salmon. Data does, however, indicate
an increase in stress occurred during handling and marking of sockeye
salmon. Previous studies where plasma cortisol was used as a stress indicator
for sockeye salmon (Dell et al. 1985) and limited seawater challenge data in
1985 support these findings.
The inconsistency of mortality among tests and replicates (two tests
showed an increase in stress and one test a decrease in stress) indicates
sockeye salmon exhibit considerable variability in response to
handling/marking, and maybe, different stress responses exist for different
stocks. Previous studies showed higher and more variable cortisol levels for
sockeye salmon than for chinook salmon (Dell et al. 1985).
Length-frequency data indicate that the average size of dead sockeye in
the pre-transport group was considerably less than the average size of live
sockeye from that group and both dead and live fish from the pre-mark group
(Appendix Table 1). This suggests that handling/marking may elicit a higher
stress response in small-size sockeye salmon; more information is obviously
needed. This year's data does not indicate whether the increased
concentration of MS-222 used in the transfer containers and marking anesthetic
system minimized handling stress in sockeye salmon. However, 3 years of
11
Table 4.--Sunnnary of total numbers and species composition of fish handled at the Priest Rapids sorting and marking complex, 1986 (21 Apr - 02 June), 1985 (20 Apr - OS June), and 1984 (01 May - 06 June).
1986
,Prtest Rapids Wanapum Total Species No. % No. % No. %
Chinook "O" 99 0.0 12 0.0 111 0.0
Chinook "l" 82,209 35.3 77,977 56.9 160,186 43.3
Sockeye 117,220 50.3 34,793 25.4 152,013 41.1
Steelhead 20,715 8.9 13,705 10.0 34,420 9.3
Coho 12,813 5.5 10,516 7.7 23,329 6.3
Totals 233,056 137,003 370,059
1985
Priest Rapids Wanapum Total Species No. % No. % No. %
Chinook 11011 239 0.1 16 0.0 255 0.1
Chinook II 1 �I 111,602 41.3 58,754 59.5 170,356 46.2
Sockeye 123,365 45.6 20,408 20.7 143,773 38.9
Steelhead 34,270 12.7 18,857 19 .1 53,127 14.4
Coho 905 0.3 717 0.7 1,622 0.4
Totals 270,381 98,752 369,133
1984
Priest Rapids Wanapum Total Species No. % No. % No. %
Chinook 11011 428 0.2 0 0.0 428 0.2
Chinook II 111 78,206 39 .6 0 0.0 78,206 39.6
Sockeye 43,775 22.2 0 0.0 43,775 22.2
Steelhead 44,882 22.8 0 0.0 44,882 22.8
Coho 29,913 15.2 0 0.0 29,913 15.2
Totals 197,204 0 197,204

50
40
,...._ 30
o ·� 20
10
12
SPRING CHINOOK SOCKEYE
I I
--------1------+------i---------1--------I-------
PRE-MARK PRE-TRANSPORT PRE-MARK PRE-TRANSPORT
Figure 1.--Seawater challenge tests for relative stress of spring chinook and sockeye salmon smolts sampled prior to marking and prior to transport at Priest Rapids Dam, 1986 (vertical bars indicate S.E.).

13
stress work supports the pre-anesthesia concept (anesthetizing fish prior to
handling) for minimizing stress during fish handling/marking operations
(Matthews!/).
Collection of Adults from Transportation Tests in 1984-1985
Over 500 identifiable tagged adults were recovered in 1986 and are
included in our analyses. The majority of these were 1 +ocean age sockeye
salmon returning from 1985 experiments. All but 19 fish were recovered at the
adult collection facilities at dams, demonstrating their importance in our
evaluations (Table 5). In addition, 72 sockeye salmon that had unreadable
brands were recovered at trapping facilities. Summary data for all confirmed
branded fish recovered and for all confirmed CWTs extracted from adults are
presented in Appendix Tables 2 to 13 (appendix tables are listed in order by
year of study, treatment group, and species. (Note: Subsequent to our
analyses, about 100 tagged adult fish were recovered from tributary spawning
grounds and hatcheries--these will be added to the data base in a subsequent
report).
Data accumulated so far are preliminary since returns are not complete
for any group. Therefore, no conclusions can be drawn at this time. There
are however, some implications that can be noted from the preliminary data.
Returns for spring chinook salmon are poor for 1984. Further, there was a
negative transport benefit ratio; a result never observed in almost 20 years
of similar studies on the Snake River. The data strongly suggest that
multiple handling of spring chinook salmon dipped from Wanapum Dam gatewells
lf Gene Matthews, Biologist, National Marine Fisheries Service, 2725 Montlake Boulevard East, Seattle, WA 98112, pers. commun., December 1986.

14
Table 5.--Summary of 1 and 2 ocean age spring chinook and sockeye salmon adults by recovery area that were marked and released in 1984-1985. Data from 1985 releases includes only 1-ocean age fish.
Year, species, release site, Recovery area (site) and experimental group Bonneville McNary Priest R. Ocean Other
1984 - Spring chinook
Test - Bonneville 5 10 1 1 1 Control - Priest Rapids 13 26 16 0 7
1985 - Spring chinook
Test - Bonneville 1 3 5 4 1 Control Priest Ra�}ds 2 4 0 3 1 Test - Bonneville,;;;.: 0 0 0 1 0 Control - Priest Rapids!/ 0 0 0 0 0
1984 - Sockeye
Test - Bonneville 49 6 19 0 0
Control - Priest Rapids 25 17 28 0 0
1985 - Sockeye
Test - Bonneville 99 15 49 0 0
Control - Priest R1pids 22 10 46 0 0
Test - Bonneville!: 26 1 8 0 0
Control - Priest Rapids!/ 9 2 3 0 0
a/ Smolts from these groups were collected at Wanapum Dam, transferred toPriest Rapids Dam, marked, and subsequently treated the same as those fish from Priest Rapids Dam.

15
reduced their survival when compared to fish marked from Priest Rapids Dam
gatewells in 1985 (I return in 50,000 vs 24 returns in 100,000) (Table 6).
Survival of sockeye salmon marked in 1984 and 1985 appears to be good.
Survival of transported fish is much higher than controls. However, benefit
ratios are much reduced between Bonneville Dam and Priest Rapids Dam. This
suggests there is either a differential mortality of transported fish during
upstream passage or a homing loss. Since benefit ratios at McNary Dam
(Table 5) are more like that observed at Priest Rapids Dam, the loss must be
occurring downstream from McNary Dam (Table 5).
From the preliminary data (I-ocean age returns from 1985 only), it would
appear that mortality or homing loss is affecting a particular segment of
transported sockeye salmon smolts (Table 7). The number and percent return of
transported fish are nearly equal at Bonneville and Priest Rapids Dams for the
first four groups, whereas returns for the last two groups (transported as
smolts from 20 May-4 June) are more numerous at Bonneville Dam. Since smolts
released at Priest Rapids Dam as controls have returned to Bonneville and
Priest Rapids Dams in near equal ratios for all six groups, it would appear
that the problem lies with the latter two groups of transport releases. As
more adult return data becomes available, we should be able to more clearly
define transportation benefits for sockeye salmon.
One should be aware of the impacts of fishnets on sockeye salmon and the
subsequent effect on transport benefit ratios. For example, we observed 72
adults that had unreadable brands at trapping facilities--a large percentage
of the brands were obscured because of net marks. Of the 72 adults observed
with unreadable brands, 49 (68%) were 2 ocean age fish and 23 (32%) were I
ocean age fish. Since larger sockeye salmon are targeted by mesh size

16
Table 6.--Summary of returns of chinook and sockeye salmon from control and transport releases of smolts tagged in 1984 and 1985 at Priest Rapids Dam and recovered in 1985-1986.
Year, species, release site, Number of Number of adults and experimental group smolts released recovered
I-ocean age 2-ocean
1984 - Sockeye salmon
Control - Priest Rapids 20,674 1 69 Transport - Bonneville 20,731 4 70
Chinook salmon
Control - Priest Rapids 38,247 0 62 Transport - Bonneville 38,673 2 16
1985 - Sockeye salmon
Control - Priest Rapids 55,432 89 Transport - Bonneville
/ 55,406 163
Control - Priest Rapids!.: 8,559 14 Transport - Bonneville!/ 8,602 35
Chinook salmon
Control - Priest Rapids 49,700 10
Transport - Bonneville /
50,490 14 Control - Priest Rapid� 25,553 0 Transport - Bonneville!/ 26,287 1
Totals 333 217
a/ Smolts from these groups were collected at Wanapum Dam, transferredPriest Rapids Dam, marked, and subsequently treated the same as those fish from Priest Rapids Dam.
age
to

17
Table 7.--Survival (percent return) of transport and control lots of sockeye salmon marked and released in 1985 that returned as adults in 1986 to Bonneville and Priest Rapids Dams.�
No. and (%) No. and (%) Release Tag No. returned to returned to
site code released Dates Bonneville Priest Rapids
Bonneville 23-17-16 10,232 20-28 Apr 10 (0.097) 5 (0.049) 23-17-50 8,146 28 Apr-4 May 10 (0.122) 9 (0.110) 23-17-52 8,171 5-12 May 7 (0.086) 4 (0.049) 23-17-54 6,506 13-19 May 4 (0.061) 4 (0.061) 23-17-26 10,259 20-26 May 32 (0.312) 16 (0.156) 23-17-57 12,092 27 May-4 Jun 36 (0.298) .!!. ( 0 .091)
Total return(%) 99 (0.178) 53 (0.096)
Priest Rapids 23-17-17 9,614 20-28 Apr 9 (0.094) 8 (0.083) 23-17-47 8,189 28 Apr-4 May 5 (0.061) 17 (0.208) 23-17-49 8,171 5-12 May 7 (0.086) 3 (0.037) 23-17-51 6,451 13-19 May 5 (0.078) 3 (0.047) 23-17-19 10,403 20-26 May 5 (0.048) 11 (0.106) 23-17-59 12,604 27 May-4 Jun _i (0.016) � (0.032)
Total return(%) 33 (0.060) 46 (0.083)
a/ See also Appendix Tables 2 to 13.

18
restrictions, adult return rates will be affected and may influence observed
transport benefit ratios.
Inferences drawn from the preliminary adult return data should be treated
with caution. Much more information is needed before valid conclusions can be
made. We believe that studies should be undertaken to define the optimum
survival capabilities of smolts. This is particularly true for spring chinook
salmon. Results of these studies could lead to improved runs whether fish are
transported or not.
SUMMARY AND CONCLUSIONS
1. During 1986, 70,243 chi nook salmon and 100,605 sockeye salmon were
marked from gatewell collection operations at Priest Rapids Dam. An
additional 54,159 chi nook salmon and 28,705 sockeye salmon were marked from
gatewell collection at Wanapum Dam.
2. Seawater challenge tests indicated that chinook salmon smolts were
not significantly stressed, but sockeye salmon were stressed during marking
operations.
3. Adult recovery efforts provided 105 tagged chi nook salmon and 445
sockeye salmon to the data base for transport studies conducted during 1984-
1985. Preliminary data suggest that spring chinook salmon transported in 1984
had a negative benefit ratio. Sockeye salmon transported in 1984-1985 have
generally positive benefit ratios, however, some of the benefit may be offset
by homing loss or unknown mortality factors during their adult migration.
4. Adult spring chi nook salmon that returned from groups of smolts
dipped from gatewells at Wanapum Dam returned at much lower rates than adults
returning from smolts dipped from gatewells at Priest Rapids Dam.

19
RECOMMENDATIONS
1. Studies should be undertaken to determine why some stocks/species
have limited survival capabilities. Studies on spring chinook salmon are
urgent.
2. Sampling eff ort for adult recovery at Priest Rapids Dam should be
increased. Since final analyses must be keyed to returns at Priest Rapids
Dam, we recommend daily trap operations from daylight to dark during spring
chinook and sockeye salmon runs.
3. Supplemental fish from Wanapum Dam should not be used in any future
transport experiments at Priest Rapids Dam.

20
LI'IERAWRE CI'IED
Achord, S., G. Matthews, and D. Park. 1985. Transportation studies at Priest Rapids Dam, 1985. U.S. Dep.
Commer., Natl. Oceanic Atmos. Admin., Natl. Mar. Fish. Serv., Northwest and Alaska Fish. Cent., Seattle, WA. 17 p. plus Appendix (Report to Public Utility District No. 2 of Grant Co., Contract 430-228).
Dell, M., C. Carlson, R. Kindly, D. Park, S. Achord, C. Mccutcheon, D. Weitkamp, R. Loeppke, R. Raleigh, and D. Chapman.
1985. Transportation studies at Priest Rapids Dam, 1984. Public Utility District No. 2 of Grant County, Ephrata, WA.
Ebel, W. J. 1980. Transportation of chinook salmon, Oncorhynchus tshawytscha, and
steelhead, Salmo gairdneri, smolts in the Columbia River and effects on adult returns. Fish. Bull. Voi, 78, No. 2, 1980.
Matthews, G. M., D. L. Park, S. Achord and T. E. Ruehle. 1986. Static seawater challange test to measure relative stress levels
in spring chinook salmon smolts. Trans. Amer. Fish. Society, Vol. 115, No. 2, Mar. 1986
Park, D. L. 1980. Transportation of chinook salmon and steelhead smolts 1968-80
and its impact on adult returns to the Snake River. Natl. Mar. Fish.
Serv., October 1980. 20 p.
Park, D. L., G. M. Matthews, T. E. Ruehle, J. R. Smith, J. R. Harmon, B. H. Monk, and S. Achord.
1983. Evaluation of transportation and related research on Columbia and Snake Rivers, 1982. U.S. Dep. Connner., Natl. Oceanic Atmos. Admin., Natl. Mar. Fish. Serv., Northwest and Alaska Fish. Cent., Seattle, WA. 47 p. plus Appendix (Report to the U.S. Army Corps of Engineers, Contract DACW-68-78-C-0051).
Park, D. L. 1985. A review of smolt transportation to bypass dams on the Snake and
Columbia Rivers, February 1985. 66 p. In: Comprehensive Report of Juvenile Salmonid Transportation, U.S.Army Corps of Engineers, April 1985.

2.1
AFPEND'.IX
Data Tables

Appendix Table 1.--Seawater challenge test data for spring chinook and sockeye salmon sampled before and after handling/marking at Priest Rapids Dam, spring 1986. Data include test numbers, descaling, and average length of live and dead fish by sample area and replicate after a 24-h exposure to artificial seawater (includes data for steelhead and coho salmon which were unintentionally sampled with spring chinook and sockeye salmon in some tests).
Dead fish Live fish Number Number Average fork Number Number Average fork
nondescaled descaled length (mm) nondescaled descaled length (mm) Test Date SC so ST co SC so ST co SC so ST co SC so ST co SC so ST co SC so ST co
Test Condition - Transfer Container - Pre-Mark
1/1 07 May 9 3 0 0 1 0 0 0 124.2 87.3 0 0.0 16 14 1 0 0 0 0 0 126.0 85.0 190.0 0.0 1/2 07 May 4 1 0 0 0 0 0 0 119.2 76.0 0 0.0 21 18 0 0 0 0 0 0 122.5 91.8 0.0 0.0 1/3 07 May 6 0 0 0 0 0 0 0 112.2 0.0 0 0.0 14 10 1 0 0 0 0 0 130.4 87.7 165.0 0.0
2/1 15 May 11 5 0 0 0 0 0 0 130.8 110.4 0 0.0 19 7 2 1 1 0 0 0 138.8 111.6 190.0 130.0 2/2 15 May 9 4 0 1 0 0 0 0 126.4 103.7 0 146.0 21 4 0 4 0 0 0 0 135.5 95.7 ·o.o 169.22/3 15 May 10 6 0 0 0 0 0 0 125.3 104.7 0 0.0 26 4 0 1 0 0 0 0 135.0 113.0 0.0 156.0
3/1 20 May 2 10 0 0 0 0 0 0 130.0 110.0 0 o.o 4 22 0 9 0 0 0 0 132.0 111.1 o.o 158.43/2 20 May 1 7 0 0 0 1 0 0 122.0 107.5 0 0.0 12 20 4 10 0 0 0 0 133.4 107.6 155.5 157.5 3/3 20 May 5 5 0 0 1 0 0 0 126.3 111.6 0 0.0 11 13 0 7 0 0 0 1 138.8 !!bl 0.0 145.2
Totals/averages 57 41 0 1 2 1 0 0 124.8 106.0 0 146.0 144 112 8 32 1 0 0 1 132.4 101.7 169.6 155.3
N
N

Appendix Table 1.--continued
Dead fish Live fish Number Number Average fork Number Number Average fork
nondescaled descaled length (mm) nondescaled descaled length (nun) Test Date SC so ST co SC so ST co SC so ST co SC so ST co SC so ST co SC so ST co
Test Condition - Truck - Pre-Transport
1/1 07 May 4 1 0 0 0 0 0 0 105.5 81.0 0 0 19 4 0 0 0 0 0 0 130.2 84.5 0 0 1/2 07 May 3 9 0 0 1 0 0 0 112. 7 80.7 0 0 20 10 0 0 0 0 0 0 129.9 86.6 0 0 1/3 07 May 4 0 0 0 0 1 0 0 115 .5 71.0 0 0 15 16 0 0 0 0 0 0 125.6 89. 7 0 0
2/1 15 May 7 9 0 0 0 0 0 0 120.0 94.6 0 0 25 3 0 0 1 1 0 0 131.7 118.0 0 0 2/2 15 May 9 19 0 0 0 0 0 0 123.1 97.6 0 0 30 13 0 0 0 0 0 0 133.5 105.4 0 0 2/3 15 May 3 5 0 0 0 1 0 0 123.0 90.8 0 0 13 37 0 0 0 0 0 0 123.9 111.2 0 0
3/1 20 May 0 15 0 0 0 1 0 0 0.0 100.5 0 0 9 16 0 0 0 0 0 0 132.2 114. 7 0 0 3/2 20 May 4 6 0 0 0 1 0 0 128.5 91. 7 0 0 10 21 0 0 1 0 0 0 136.8 109.9 0 0 3/3 20 May 1 31 0 0 0 2 0 0 132.0 103.0 0 0 6 40 0 0 0 0 0 0 121.2 115 .1 0 0
Totals/averages 35 95 0 0 1 6 0 0 119.4 96.8 0 0 147 160 0 0 2 1 0 0 130.3 107.7 0 0 N
w

Appendix Table 2.--Adult recoveries from smolts clipped from gatewells at Priest Rapids Dam and subsequently transported to Bonneville Dam (Corbett Landing) in 1984.
RELEASE GROUPS INCLUDED: 8401A 8401B 8401C 8401D
1984 TRANS TEST TRUCK
SPRING/SUMMER CHINOOK
Brands Used: RAICl RAIDl RAIFl RAIC3
�Jire Codes Used: 231703 231705 231707 231709
YEAR OF RETURN
RECOVERY AREA 1984 1985 1986
RIVER SYSTEM TRAPS BONNEVILLE TRAP 0 1 4
MCNARY TRAP 0 0 10
LmJER GRANITE TRAP 0 0 0
PRIEST RAPIDS TRAP 0 0 1
OCEAN FISHERIES
ALASKA 0 0 0
BRITISH COLUMBIA 0 0 0
WASHINGTON 0 0 0
OREGON 0 1 0
CALIFORNIA 0 0 0
OTHER 0 0 0
RIVER SPORT
COLUMBIA R. BELOW SNAKE R. 0 0 0
COLUMBIA R. ABOVE SNAKE R. 0 0 0
�JENATCHEE R. 0 0 1
SNAKE R. 0 0 0
RIVER COMMERCIAL 0 0 0
INDIAN FISHERY 0 0 0
HATCHERIES 0 0 0
STREAM SURVEY 0 0 0
TOTALS 0 2 16
PERCENT OF RECOVERY 'Y. o.o 11. 1 88.9
NUMBER RELEASED:
TOTAL 'Y. RETURN
5 0.013
10 0.026
0 0.000
0.000
0 0.000
0 0.000
0 0.000
1 0.000
0 0.000
0 0.000
0 0.000
0 0.000
1 0.000
0 0.000
0 0.000
0 0.000
0 0.000
0 0.000
18 0.047
38673

Appendix Table 3.--Adult recoveries from smolts dipped from gatewells at Priest Rapids Dam and subsequently
released downstream from Priest Rapids Dam in 1984.
RELEASE GROUPS INCLUDED: 8402A 8402B 8402C 8402D 1984 TRANS CONTROL
SPRING/SUMMER CHINOOK
Brands Used: LAIU1 LAIR! LAIM1 LAIU3 Wire Codes Used: 231702 231704 231706 231660
YEAR OF RETURN RECOVERY AREA 1984 1985 1986
RIVER SYSTEM TRAPS BONNEVILLE TRAP 0 0 13 MCNARY TRAF" 0 0 26 LmJER GRAN I TE TRAP 0 0 0
PR I EST RAP IDS TRAP 0 0 it>
OCEAN FISHERIES 0 0 0
RIVER SPORT COLUMBIA R. BELOW SNAKE R. 0 0 0
COLUMBIA R. ABOVE SNAKE R. 0 0 1 l�ENATCHEE R. 0 0 3
SNAKE R. 0 0 0
RIVER COMMERCIAL 0 0 0
INDIAN FISHERY (I (I 0
HA.TCHER I ES LEAVENWORTH H. (I (I 1 ENTIAT H. 0 (I 2
STREAM SURVEY 0 0 0
TOTALS 0 (I 6,2
PERCENT OF RECOVERY '.Y. o.o o.o 100.0
NUMBER RELEASED:
TOTAL '¼ RETURN
13 0,040 26 0.068 (I 0.000
16 0.042·
0 0.000
0 0.000 1 0.003 3 0.000
0.000
0 O. OC><)
0 0.000
1 0.003 2 0.00.5
0 0.000
62 0,162
N 38247 \JI

Appendix Table 4.--Adult recoveries from smolts dipped from gatewells at Priest Rapids Dam and subsequently_transported to Bonneville Dam (Corbett Landing) in 1984.
RELEASE GROUPS INCLUDED: 8403A 8403B 8403C 8403D
1984 TRANS TEST TRUCK
SOCl<EVE
Brands Used: RAIC1 RAID1 RAIF! RAIC3
Wire Codes Used: 231653 231655 231657 231659
RECOVERY AREA
YEAR OF RETURN
1984 1985 1986
RIVER SYSTEM TRAPS
BONNEVILLE TRAP 1 3 45
MCNARY TRAP 0 0 6
LmJER GRANITE TRAP 0 0
PRIEST RAPIDS TRAP
0
0 0 19
OCEAN FISHERIES 0 0 0
RIVER SPORT 0 0 0
RIVER COMMERCIAL 0 0 0
INDrnN FISHERY 0 0 0
HATCHERIES 0 0 0
STREAM SURVEY 0 0 0
TOTALS 1 3 70
PERCENT OF RECOVERY /o 1.4 4. 1 94.6
NUMBER RELEASED:
TOTAL /o RETURN
49 0.236
6 0.029
0 0.000
19 0.092
0 0.000
0 0.000
0 0.000
0 0.000
0 0.000
0 0.000
74 0.357
20731
""

Appendix Table 5.--Adult recoveries from smelts dipped from gatewells at Priest Rapids Dam and subsequently
released downstream from Priest Rapids Dam in 1984.
RELEASE GROUPS INCLUDED: 8404A
Brands Used: LAIU1 LAIR!
Wire Codes Used: 231654 231656
RECOVERY AREA
RIVER SYSTEM TRAPS
BONNEVILLE TRAP
MCNARY TRAP
LmJER GRANITE TRAP
PRIEST RAPIDS TRAP
OCEAN FISHERIES
RIVER SPORT
RIVER COMMERCIAL
INDIAN FISHERY
HATCHERIES
STREAM SURVEY
TOTALS
PERCENT OF RECOVERY "
8404B 8404C 8404D
1984 TRANS CONTROL
SOCKEVE
LAIM1 LAIU3
231658 231708
YEAR OF RETURN
1984 1985 1986
0 1 23
0 0 17
0 0 0
0 0 28
0 0 0
0 0 0
0 0 0
0 0 0
0 0 0
0 0 0
0 1 68
o.o 1. 4 98.6
NUMBER RELEASED:
TOTAL " RETURN
24 0.117
17 0.083
0 0.000
28 0, 136
0 0.000
0 0.000
0 0.000
0 0.000
0 0.000
0 0.000
69 0.335
20574
N
-.J
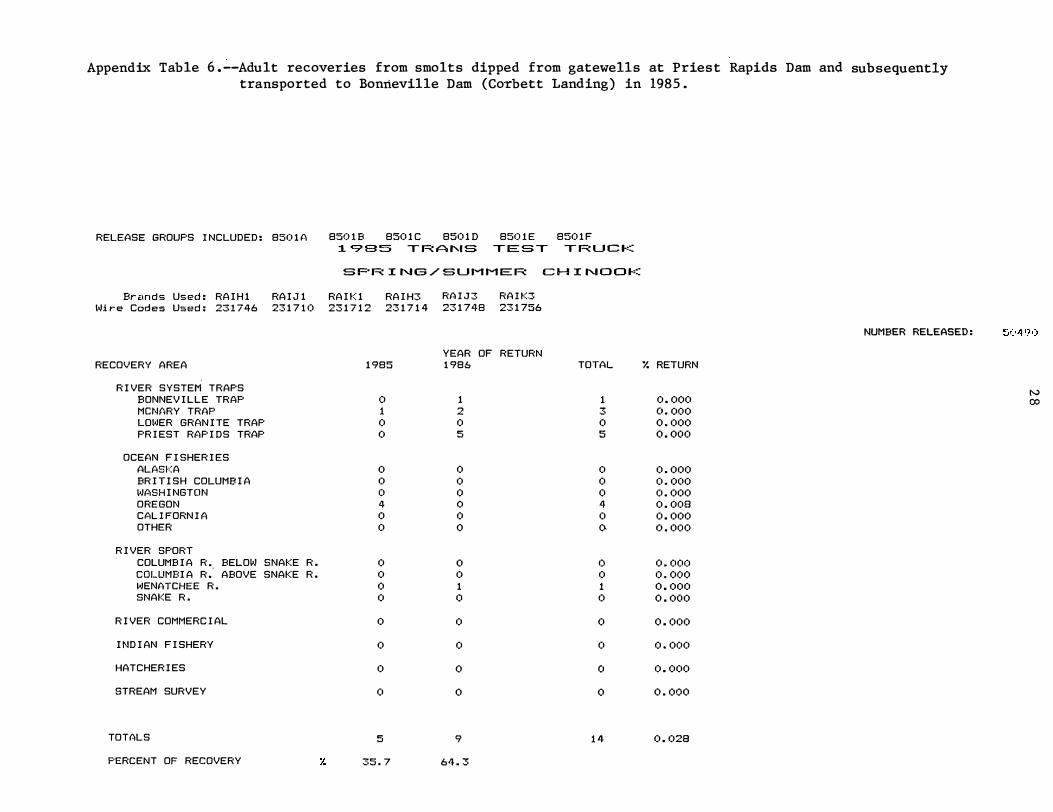
Appendix Table 6.--Adult recoveries from smolts dipped from gatewells at Priest Rapids Dam and subsequently transported to Bonneville Dam (Corbett Landing) in 1985 •
RELEASE GROUPS INCLUDED: 8501A 8501B 8501C 8501D 1985 TRANS
8501E 8501F TEST TRUCK
SPRING/SUMMER CHINOOK
Br-,nnds Used: RAIH1 RAIJ1 RAI1(1 RAIH3 Wir-e Codes Used: 231746 231710 231712 231714
RECOVERY AREA
RIVER SYSTE� TRAPS BONNEVILLE TRAP MCNARY TRAP LOl�ER GRANITE TRAP PRIEST RAPIDS TRAP
OCEAN FISHERIES ALASKA BR IT I SH COLUMBIA wr-,sH I NG TON OREGON CALIFORNIA OTHER
RIVER SPORT COLUMBIA R •. BELOW SNAKE R. co,_UMB IA R. ABOVE SNAKE R. 1,oJENATCHEE R. SNAKE R.
RIVER COMMERCIAL
INDIAN FISHERY
HATCHERIES
STREAM SURVEY
TOTALS
PERCENT OF RECOVERY
1985
0 1 0
0
0
0
(I
4 0
0
0
0
0
0
0
0
0
0
5
35.7
RAIJ3 231748
YEAR OF 1986
1 2 0
5
0
0
0
0
0
0
0
0
1 0
0
0
0
0
9
64.3
RAIK3 231756
RETURN TOTAL
1 3
0
5
0
0
0
4
0
0
I)
0
1 0
0
0
(J
0
14
NUMBER RELEASED:
'1/. RETURN
0.000
(I. 000
0.000
0.000
0.000
C>. 000
0.000
0.008
0.000
0.000
0.000
0. 000
0.000
0. 000
0.000
0.000
0.000
0.000
0.028
N
00

Appendix Table 7.--Adult recoveries from smolts dipped from gatewells at Wanapum Dam and subsequently transported to Bonneville Dam (Corbett Landing) in 1985.
RELEASE GROUPS INCLUDED: 8505A 8505B 8505C 8505D 8505E
1985 TRANS TEST TRUCK
SPRING/SUMMER CHINOOK
Brands Used: RAIZ1 RAIY1 RAIX1 RAIZ3 RAIY3
Wir·e CodE.•s Used: 231728 231730 231740 231722 231744
YEAR OF RETURN
RECOVERY AREA 1985 1986 TOTAL
RIVER SYSTEM TRAPS
BONNEVILLE TRAP 0 0 0
MCNARY TRAP 0 0 0
LmJER GRANITE TRAP 0 0 0
PR I EST RAP IDS TRAP 0 0 0
OCEAN FISHERIES
ALASKA 0 0 0
BR IT I SH COLUMBIA 0 0 0
WASHINGTON 0 0 0
OREGON 0 1 1
CALIFORNIA 0 0 0
OTHER 0 0 0
RIVER SPORT (I 0 0
RIVER COMMERCIAL 0 (I 0
I ND IAN FI SHERY 0 0 0
HATCHERIES 0 0 0
STREAM SURVEY 0 0 0
TOTALS 0 1 1
PERCENT OF RECOVERY ,: o. 0 1 (H). (>
NUMBER RELEASED:
,: RETURN
0.000
0.000
0.000
0.000
0.000
0.000
0.000
o. oo,i
0.000
0.000
0.000
0.000
0.000
0.000
0.000
0.004
26287
N I.O

Appendix Table 8.--Adult recoveries from smolts dipped from gatewells at Priest Rapids Dam and
subsequently released downstream from Priest Rapids Dam in 1985.
RELEASE GROUPS INCLUDED: 8503A 85038 8503C 8503D 8503E 8503F
1985 TRANS CONTROL
SPRING/SUMMER CHINOOK
Brands Used: LAIL1 LAIN1 LAIS1 LAIL3 LAIN3 LAIS3
Wire Codes Used: 231753 231711 231713 231715 231755 231758
RECOVERY AREA
RIVER SYSTEM TRAPS
BONNEVILLE TRAP
MCNARY TRAP
LOWER GRANITE TRAP
PRIEST RAPIDS TRAP
OCEAN FISHERIES
ALASKA
BRITISH COLUMBIA
!•!ASH I NG TON
OREGON
CALIFORNIA
OTHER
RIVER SPORT
COLUMBIA R. BELOW SNAKE R.
COLUMBIA R. ABOVE SNAKE R.
�JENATCHEE R.
SNA�::E R.
RIVER COMMERCIAL
I ND IAN FISHERY
HATCHERIES
STREAM SURVEY
TOTALS
PERCENT OF RECOVERY ��
1985
0
0
0
0
(I
0
(I
3
(I
(I
0
0
0
0
0
0
3
30.0
YEAR OF RETURN
1986 TOTAL
2 2
4 4
0 0
0 0
0 0
0 0
0 0
(I 3
0 0
0 0
0 0
0 0
1 1
0 0
0 0
0 0
0 0
0 0
7 10
70.0
'1/. RETURN
0.000
0.008
0.000
0.000
0.000
0.000
0.000
0.000
0.000
0.000
0.000
0.000
0.000
0.000
0.000
0.000
0.000
0.000
0.020
NUMBER RELEASED: 49700
w
0

Appendix Table 9.--Adults recovered from smolts dipped from gatewells at Wanapum Dam and subsequently released downstream from Priest Rapids Dam in 1985.
RELEASE GROUPS INCLUDED: 8507A 85078 8507C 8507D 8507E
1985 TRANS CONTROL
SPRING/SUMMER CHINOOK
Brands Used: LA2C1 LA2Jl LA141 LA2C3 LA2J3
Wire Codes Used: 231725 231727 231741 231743 231745
YEAR OF RETURN
RECOVERY AREA 1985 1986 TOTAL
RIVER SYSTEM TRAPS
BONNEVILLE TRAP 0 0 0
MCNARY TRAP 0 0 0
LmJER GRANITE TRAP 0 0 0
PRIEST RAPIDS TRAP 0 0 0
OCEAN FISHERIES 0 0 0
RIVER SPORT 0 0 0
RIVER COMMERCIAL 0 0 0
INDIAN FISHERY 0 0 0
HATCHERIES 0 0 0
STREAM SURVEY 0 0 0
TOTALS 0 0 0
PERCENT OF RECOVERY i. o. 0 o.o
NUMBER RELEASED:
¼ RETURN
0.000
0.000
0.000
0. 000
0.000
0.000
0.000
0.000
0. OCH)
0.000
0.000

Appendix Table 10.--Adult recoveries from smolts dipped from gatewells at Priest Rapids Dam and subsequently transported to Bonneville Dam (Corbett Landing) in 1985.
RELEASE GROUPS INCLUDED: 8502A 8502B 8502C 8502D 8502E 8502F
1985 TRANS TEST TRUCK
SOCKEVE
Br"°.nds Used: RAIH1 RAIJ1 RAIK1 RAIH3 RAIJ3 RAIK3
Wire Codes Used: 231716 231750 231752 231754 231726 231757
RECOVERY AREA
YEAR OF RETURN
1985 1986 TOTAL
RIVER SYSTEM TRAPS
BONNEVILLE TRAP 0 99 99
MCNARY TRAP (I 15 15
LmJER GRANITE TRAP 0 0 0
PRIEST RAPIDS TRAP (I 49 49
OCEAN FISHERIES 0 0 0
RIVER SPORT 0 0 0
RIVER COMMERCIAL 0 0 0
INDIAN FISHERY 0 () 0
HATCHERIES 0 0 0
STREAM SURVEY 0 0 0
TOTALS 0 163 163
PERCENT OF RECOVERY /, o.o 100.0
NUMBER RELEASED:
/, RETURN
0.179
0.027
0.000
0.088
0.000
0.000
0.000
0.000
0.000
(>. 000
0.294
vJ
N

Appendix Table 11.--Adult recoveries from smolts dipped from gatewells at Wanapum Dam.and subsequently transported to Bonneville Dam (Corbett Landing) in 1985.
RELEASE GROUPS INCLUDED: 8506A 8506B 8506C 8506D 8506E
1985 TRANS TEST TRUCK
SOCKEVE
Brands Used: RAIZl RAIYl RAIXl RAIZ3 RAIY3
Wire Codes Used: 231662 231718 231720 231742 231724
RECOVERY AREA
YEAR OF RETURN
1985 1986 TOTAL
RIVER SYSTEM TRAPS
BONNEVILLE TRAP 1 25 26
MCNARY TRAP 0 1 1
LmJER GRAN I TE TRAP 0 0 0
PR I EST RAP IDS TRAP 0 8 8
OCEAN FISHERIES 0 0 0
RIVER SPORT 0 0 0
RIVER COMMERCIAL 0 0 0
IMDIAN FISHERY 0 0 0
HATCHERIES 0 0 0
STREAM SURVEY 0 0 0
TOTALS 1 34 35
PERCENT OF RECOVERY ¾ 2.9 97.1
X RETURN
0.302
0.000
0.000
0,093
0.000
0.000
0.000
0.000
0.000
0.000
0.407
NUMBER RELEASED:
w
w 8602

Appendix Table 12.--Adult recoveries from smolts dipped from gatewells at Priest Rapids Dam and subsequently released downstream from Priest Rapids Dam in 1985.
RELEASE GROUPS INCLUDED: 8504A 8504B 8504C 8504D 8504E 8504F
1985 TRANS CONTROL
SDCJ-=-.:EVE
Brands Used: LAIL1 LAIN1 LAIS1 LAIL3 LAIN3 LAIS3
Wire Codes Used: 231717 231747 231749 231751 231719 231759
YEAR OF RETURN
RECOVERY AREA 1985 1986 TOTAL
RIVER SYSTEM TRAPS
BONNEVILLE TRAP (I 33 33
MCNARY TRAP 0 10 10
LmJER GRANITE TRAP (I (I 0
PRIEST RAPIDS TRAP 0 46 46
OCEAN FISHERIES 0 0 0
RIVER SPORT 0 (I 0
RIVER COMMERCIAL (I 0 (I
INDIAN FISHERY (I 0 0
HATCHERIES 0 0 0
STREAM SURVEY (I 0 0
TOTALS 0 89 89
PERCENT OF RECOVERY '¼ o.o 100.(l
'¼ RETURN
0.(160
0.000
0.000
0.083
0.(100
0.000
0.000
0 • 0(H)
0.000
0.000
0.161
NUMBER RELEASED: 55432

Appendix Table 13.--Adult recoveries from smelts clipped from gatewells at Wanapum Dam and
subsequently released downstream from Priest Rapids Dam in 1985.
RELEASE GROUPS INCLUDED: 8508A 85088 8508C 8508D 8508E
1985 TRANS CONTROL
SOCl<EVE
Brands Used: LA2C1 LA2J1 LA141 LA2C3 LA2J3
Wire Codes Used: 231661 231663 231701 231721 231723
YEAR OF RETURN
RECOVERY AREA 1985 1986 TOTAL
RIVER SYSTEM TRAPS
BONNEVILLE TRAP 0 9 9
MCNARY TRAP 0 2 2
LmJER GRANITE TRAP 0 0 (I
PRIEST RhPIDS TRAP 0 3 3
OCEAN FISHERIES 0 0 0
RIVER SPORT 0 0 0
RIVER COMMERCIAL (> (> 0
INDIAN FISHERY 0 0 0
HATCHERIES 0 0 0
STREAM SURVEY 0 0 0
TOTALS 0 14 14
PERCENT OF RECOVERY '¼ o. 0 100.0
'¼ RETURN
0. 000
0.000
0.000
0.035
o. 000
0.000
0.000
0.000
0.000
0.000
0.163
NUMBER RELEASED: 8599