preventive measures; educational …eprints.qut.edu.au/9882/1/9882.pdf- 743 - expanding the focus...
TRANSCRIPT
- 741 -
PREVENTIVE MEASURES;EDUCATIONAL PROGRAMS

- 742 -

- 743 -
Expanding the Focus for EducationalProgrammes in Drink Driving
M.C. Sheehan
Centre for Accident Research and Road Safety – Queensland, Queensland University ofTechnology, Carseldine, Queensland, Australia
KeywordsDrink driving, educational programmes, evaluation, theory
AbstractOver the past twenty years there has been a series of research based educational and rehabilitationinitiatives used to reduce drink driving in Queensland, Australia. This conceptual paper examinesthe implications of the variety of different approaches to education and rehabilitation they haveemployed. It is proposed that there needs to be both clarity and selectivity in targetingprogrammes and new strategies and approaches to implementation in this problem area. Fourresearch based statewide and regional programmes are examined which include two high schoolprogrammes, a rehabilitation programme and a prevention programme designed for a juveniledetention centre population. The programmes are analysed in terms of targets, theoretical andpedagogical models, evaluation outcomes and implementation and continuity constraints. Thefindings demonstrate outcome effectiveness for well-designed behaviour change programmes andthe need for programme designers to determine their target group and to focus programmes onthe target’s particular needs. It is possible to define a general school population and its need forknowledge, information and appropriate social skills however ensuring continuity for suchprogrammes is a major problem. Evaluation findings also indicate that there may be verydifferent theoretical paradigms required for effective programmes for those who already haveinvolvement in drink driving and other criminal behaviours. Research and educational attentionshould move to selecting and trialing the types of theoretical paradigms and implementationstrategies that are relevant for particular and diverse groups. Attention is drawn to the problemsfaced by model interventions in finding and establishing a continuing role in densely packed anddynamic school curricula and proposes possible alternative approaches. Finally, the verydifferent situation of the programme poor environment of juvenile detention centres and thecompeting personal and developmental issues faced by these young persons is discussed.
BackgroundOver the past twenty years the Centre for Accident Research and Road Safety in Queensland hasbeen involved in a series of research based educational initiatives to reduce drink driving byyoung people. Not unlike other western countries in the late seventies and early eightiestransport and health authorities became deeply concerned by the high incidence of alcoholaffected young people in the road fatality tolls. In Australia, more than half the fatal crashes
- 744 -
involving 17-25 year olds involved alcohol1 and this proportion was consistent with U.S. andCanadian data2. In most affected countries this lead to major community concern andcommitment to reducing the problem. In turn, in spite of relatively poor reports in availableliterature at the time on the effectiveness of educational programmes in reducing alcohol relatedproblems, there was a growth in funding by relevant departments to support research andinterventions. Whilst similar programmes and developments were taking place in otherjurisdictions and other countries the core research team in the Centre were the major researchersand innovators in the area and in association with relevant departments took the lead in research,implementation and evaluation of interventions in the state.
This paper reviews our experiences of four programmes, their process, and where available,outcome effectiveness and longevity in the relevant delivery system.
The four high school based programmes to be discussed include:• a school based drink driving prevention programme for the state high school population
[PASS]3;• a modified version of the above programme that was developed and taught to indigenous
community based children [When you think about it]4;• an end of high school celebration alcohol safety programme [Thrills without Spills]5;• and finally, an intervention for adolescents in juvenile justice detention centres which is
currently in the developmental stage. This is a group in which a large proportion of childrenare Indigenous.
Based on these review findings it examines the implications for different approaches toeducation.
ObjectivesThe data are used to examine the effectiveness of:• theoretical clarity and programme design targeted to identified groups; and• implementation and maintenance of programmes in this problem area.
MethodsFour research based statewide and regional programmes are examined. Two of these are for thegeneral school population and two are specially developed for targeted sub-groups. Theprogrammes are analysed in terms of target behaviours, theoretical and pedagogical models,process and outcomes (where available) and implementation and continuity constraints.
Results
Programme 1: PASS. The ‘Plan a Safe Strategy’ drink driving education programme forhigh school students3
This programme was designed to strengthen new behaviours through implementing theAjzen and Madden6 theory of planned behaviour. It explicitly aimed to reduce fatalities andserious injuries due to drink driving through targeting passenger behaviour and training childrenin the use of alternatives to being a passenger of a drink driver. It was taught experimentally in astaged entry methodology to all grade ten students in High Schools in the state that had beenrandomly assigned to an experimental or control group. Because of its aim it was designed to
- 745 -
change young males’ behavioural intentions though it was taught to both male and femalestudents7. It was based on extensive research to ensure that the core behaviour change variablesof the theoretical model were identified and change strategies operationalised. Developmentalresearch examined the theoretical constructs with the young male target group and content wasdesigned to reflect their experiences. It also was explicitly aimed at the general population ofstudents and did not directly address issues raised by high risk students.
It was taught in a highly structured and organised fashion so that sessions were integrated andbuilt on the previous lesson’s content. It was taught over twelve lessons and was part of a majorinitiative of the state education department’s alcohol and drug programmes unit. All teachersdelivering the programme in the schools were specifically and intensively trained. Other specialprogrammes were developed for other teachers in the schools, principals and parents8. It was adirected behaviour change programme and was extremely tightly focussed to learning principlesand effective behaviour change strategies based on research literature.
The programme was intensively evaluated on a number of occasions. It received extensiveprocess evaluation to ensure the programme could be taught and was taught as designed7. A threemonth follow up evaluation to ensure that it had changed attitudes, knowledge and reportedbehavioural intentions7; a three year follow up of changes in reported drink driving and passengerbehaviours and self reported history of offences9; and the 62,000 participants have been followedup for traffic and drink driving histories and currently for serious crashes, fatalities and other risktaking injuries after12 years10. It was followed up after two years by an independent evaluationof best practice road safety programmes in Australia11 and the teachers who had taught theprogramme in the first trial were followed up after five years for feed back on their experiencewith the programme.
The evaluation findings are instructive. The programme seemed to have a significant effect in theright direction on knowledge, attitude and reported behaviour at three months; on self reportedpassenger behaviour at three years but no effect on traffic history data after ten years.
The independent evaluation found it was a model of best practice and very highly valued byteachers. The follow up of teachers after five years was only able to locate a small number [30]of the 150 trained and involved teachers because the majority had either moved on withpromotional positions or had left teaching. A number of the teachers who were locatedmentioned that they had participated in the trial because they thought it would be usefuladditional training and experience and they could use it to move to a better position. TheEducation Department unit which had been responsible for managing the statewide use of theseprogrammes was closed after four years when there was a change of government.
Programme 2: ‘When you think about it’4
As part of the earlier programme it was concluded that a particular effort should be taken to makethe programme relevant to minority Indigenous students. An Indigenous team of writers and ofvideo producers was found and the programme was redesigned for teaching in an Indigenouscommunity school. This version was a much shorter four lessons. It was designed to coversimilar content issues though more attention was given to alcohol knowledge and management asdistinct from drink driving. The pedagogic methods were different and there was more expliciteffort to develop a community focus. In this case teachers were given some training but there

- 746 -
was considerable turn over of teachers during the lead up to the evaluation and for a variety ofreasons there was only limited community and parent knowledge of it. The programme did notevaluate well. Students liked the videos and role play exercises but the strict organisation of themodel and materials could not be maintained in the context of extremely poor school attendance.Of the potential 102 students on the school role only 36 students completed the four lessons ofthe course. The qualitative data obtained in evaluation indicated that there were very severeproblems associated with alcohol consumption in the community which had a major impact onchildren12.
This programme also vanished with the closure of the relevant section of the EducationDepartment and within a year it was impossible to locate copies of it or teachers who had beenassociated with it. The community in question has undergone severe stresses in the years sincethe programme was conducted with a very high suicide incidence among young people. Thetown is now one of the first of the large coastal Indigenous communities to commit to closingdown the local liquor outlet.
Programme 3: ‘Thrills without spills’5
This programme was also developed and implemented in association with the state governmentdrug and alcohol programme unit. It was specifically designed for final year students in ruralschools and aimed to reduce the drink driving crashes and other alcohol associated injuries thatoccurred at the end of the high school celebration week and the following summer holiday.Designed as a trial programme in a rural region it linked lesson based student change behaviourstrategies with community outreach publicity and alcohol control strategies. This schoolprogramme which consisted of five lessons was also based on the Ajzen and Madden theoreticalmodel6 and specifically designed to change students intentions. However this programme mademuch more use of the contribution of the variable ‘perceived behavioural control’. It had becomeclear from our own research and leading programmes in alcohol education in the internationalliterature at the time that if students were to be assisted in managing alcohol related activities in arural community it was important to enlist the support of relevant stakeholders13. Consequently,in addition to classroom activities, this programme built in community intervention strategies forstudents, teachers, parents and designated stakeholders such as liquor outlet managers and police.The programme was run in the region and whilst it was very positively received by teachers andstudents it did not lead to any measurable significant change in relevant injury rates comparedwith a control community. Other relevant issues here are that the programme again was directedat the general school population and content targeted to the research findings from young males.There was no attempt to identify the particular issues that could be of relevance to very high riskyoung people though they presumably would have been under represented in this sample.
A further matter of interest is that once again this programme ceased to be available when thealcohol and drug education unit closed.
Programme 4: ‘The risk taking youth intervention’The final programme to be discussed here is an intervention that is still in the developmentalstage and is being undertaken in association with the state juvenile justice system14. In this casethe focus is on defining the theoretical model and approaches that should inform a drink drivingbehaviour change programme directed towards a known high risk group. The programme is to beprovided for young adolescents who are committed to a juvenile justice detention centre as part
- 747 -
of sentencing for multiple offending. Preliminary research indicates that all involved studentswill have a history of motor vehicle offences including unlawful use of a motor vehicle. Theywill all have a profile of alcohol or drug use and they disproportionately include Indigenousyoung males. Once again the behaviour to be changed can not be directly targeted and a modelfor changing intentions through knowledge and attitudes needs to be determined. In this case thekey issue is that the constructs need to be operationalised through situations, experiences andsignificant others that are directly relevant to these high risk taking young people.
In the time since the original programmes were developed a variety of new findings and newconcepts and theoretical paradigms have emerged that have implications for this type ofintervention. A major relevant work is a recent report on the longitudinal study of substance useby young adults15. This exceptional study which commenced in 1976 reports findings similar tothose of the PASS evaluation. These researchers have found that the best predictor of latersubstance use is use at an earlier (or adolescent) stage and that the factors that reduce risk arewell established in early adolescence. They identified two core predictive attitudinal variableswhich were ‘disapproval of the behaviour’ and ‘perception of risk’. As in the early PASSevaluations this research is dependent on self reports and probably disproportionately representsthe views of the low risk majority of the population rather than the high risk sub-group. Thereare two other emerging theoretical areas that are consistent with findings from the earlier workand supported by current pilot research as having meaning for these young people. These are‘models and meanings given to maleness and masculinity’14 and the recent critical examination ofthe traits of sensation seeking and risk taking16 from the perspective of ‘reputation enhancement’theory17.
DiscussionThere are a number of findings and propositions arising from this twenty year experience indeveloping interventions to reduce or prevent drink driving by young people. Attitude,knowledge and behaviour change can be achieved but programmes tailored to a general schoolpopulation will probably not reach the small sub-group of high risk children engaged in problembehaviours. These young people will need special interventions designed to meet their particularneeds and circumstances. The models for such successful interventions remain to be developedand the quixotic nature of risk taking and risk perceptions for this group may need to be carefullymonitored. Early drink driving remains a predominantly male behaviour and there may beaspects of role identity that influence such behaviours and need to be examined at the communitylevel. The earlier in the young person’s life that an intervention takes place, the more likely it isto be effective or to reduce the likelihood of the behaviour being taken up. The minimaleffectiveness of the Indigenous school programme in a community experiencing severedisruption as a result of dysfunctional alcohol use suggests that interventions in this context.They have to target and involve the wider community in which the young person has to live hislife.
Finally, as yet we have found no solution to the problem of effective programmes ending upundisturbed on school library shelves. It is possible to define a general school population and itsneed for knowledge, information and appropriate social skills however ensuring continuity forsuch programmes is a major problem Strategies to embed ownership of health promotioninitiatives in schools and communities remain to be developed.
- 748 -
References1. South D. Age and drink-driving. Road Traffic Authority, Melbourne 1983.
2. Donelson AC. The Alcohol-Crash Problem. In; Laurence MD, Snortum JR and Zimring FE,editors, Social Control of the Drinking Driver, University of Chicago, 1988, pp 3-40.
3. Queensland Drink Driving Project. PASS: Plan a Safe Strategy Drink Driving PreventionProgramme, Queensland Department of Education, Production Services Branch, Brisbane1988.
4. Queensland Drink Driving Project. When You Think About It, Queensland Department ofEducation, Production Services Branch, Brisbane 1992.
5. Queensland Drink Driving Project. Thrills Without Spills, Queensland Department ofEducation, Production Services Branch, Brisbane 1994.
6. Ajzen I, Madden T. Prediction of Goal-Directed Behavior: Attitudes, Intentions, andPerceived Behavioral Control. J Exp Soc Psych 1986; 22:453-474.
7. Queensland Drink Driving Project. Development and Implementation of the Plan a SafeStrategy Drink Driving Prevention Program, NCADA Monograph Series No. 13, AGPSCanberra 1990.
8. Queensland Drink Driving Project. Principal and Teachers Resource Kit: PASS, QueenslandDepartment of Education, Production Services Branch, Brisbane 1987.
9. Sheehan M, Schonfeld C, Siskind V, Schofield F et al. A Three Year Outcome Evaluation ofa Theory Based Drink Driving Education Program. J Drug Educ 1996; 36:295-312.
10. Sheehan M. Similarities and Differences in a Series of Longitudinal Studies of theEffectiveness of a School Based Drink Driving Education Program. In: Fred H and Smith RBeditors, Alcohol, Drugs and Traffic Safety, Proceedings of the 17th International Conference,Almquist and Wiksell, Stockholm, Sweden, 2000.
11. Marsh CJ, Hyde NH. Road Safety Education in Australian Schools: A Study ofDissemination, Implementation and Exemplary Practice. FORS, Canberra, 1990, CR89.
12. Sheehan M, Schonfeld C, Hindson E, Ballard R. Alcohol Education in an IndigenousCommunity School in Queensland, Australia. Drugs: education, prevention and policy 1995;2:259-273.
13. Pentz MA, Dwyer JH, Mackinnon DP, Flay BR et al. A multicommunity trial for primaryprevention of adolescent drug abuse: effects on drug use prevalence. J Amer Med Assoc1989; 261:3259-3266.
14. Williams C. Masculinity, delinquency and the risky road use behaviour of young maleoffenders, PhD confirmation, Queensland University of Technology, Brisbane 2002.

- 749 -
15. Bachman JG, O’Malley PM, Schulenberg JE, Johnston LD et al. The Decline of SubstanceUse in Young Adulthood. Lawrence Erlbaum, Mahwah NJ, 2002.
16. Zuckerman M. Behavioural expressions and biosocial bases of sensation seeking. Cambridge,UK: Cambridge University Press, 1994.
17. Carroll A. Characterising the goals of juvenile delinquents: nature content and purpose.Psychology, Crime and Law 1995, 1:247-260.

- 750 -

- 751 -
The Potential for Collaborative, Preventative Approachesto Reduce Road Trauma Among Youth
Hulme, A.1 and Harris, A.2
1VicHealth, 2 Royal Automobile Club of Victoria
Keywords Adolescent, behaviour, education, prevention, risk.
Abstract This paper details findings of an exploratory research project that has focused on acomplementary avenue of considering road trauma within a broader framework of healthdeterminants and outcomes. To date, road safety and health promotion initiatives in research,programs, and interventions are largely focused on describing single behaviours and singlesolutions (eg. drink driving, drug and alcohol use, crime prevention), rather than working oncommon causes and common synergistic responses. . However there is a growing body ofevidence that indicates common antecedents underlie multiple, negative health outcomes(Catalano et al, 1998; Homel et al, 2001, Jessor et al, 1991) Using information obtained fromstudies and programs that have addressed some of these issues as well as information fromworkshops with health and road safety professionals, it appears that a co-operative approach toprotecting young people from these common antecedents could have great benefits across manysectors. Collaborative partnerships between different sectors, who all share the goal of preventingthe antecedents which lead to multiple and negative health outcomes, may have the potential toreduce road trauma among young people and warrants further investigation and development. Introduction Road safety programs have traditionally focused on encouraging road users to develop safeattitudes and behaviours with the explicit aim of reducing road trauma. While this approach hasbeen successful to a certain extent, particularly when used in conjunction with other activities likeenforcement, engineering and education, one area that has not been fully examined is thepotential to consider road trauma within a broader framework of health determinants andoutcomes. Many areas of health promotion, like those targeting substance abuse, criminal behaviour,depression and suicide, adopt a similar approach to those in road safety. That is, the specificbehaviour that is being targeted is the sole focus of the treatment and/or intervention program.While some approaches have been “borrowed” or “exchanged” between the health and roadsafety fields, the predominant practice up until now has been for specific agencies to workindependently to develop “single issue” focused programs, policy and research.
- 752 -
While the continuation of programs designed to address specific health behaviours is important,the possibility of focusing programs at a more preventative or causal level, rather than treatingthe symptoms. may have a range of long-term benefits. Studies on the role of risk and protectivefactors note that efforts to reduce risk should be supplemented by intervention efforts to enhanceprotection (Costa et al, 1999). Indeed prevention is a central theme within the field of healthpromotion, with intervention being a supportive, rather than sole means of addressing healthissues.
One question that researchers from many sectors have tried to address is what “factors” canpredict which individuals will develop unsafe or unhealthy behavioural patterns later in life. Thisgives rise to further questions of:• whether these predictive factors are common across a range of health and social outcomes;• how can these factors be prevented from causing negative outcomes; and• what value is there in working collectively, rather than singularly, to prevent factors from
causing multiple, negative outcomes for a range of sectors?
In order to investigate these questions, an explorative research project was commissioned.RACV, TAC and VicHealth jointly funded the “Common Solutions” project, which commencedin January 2001. Crime Prevention Victoria, a new agency established by the Victorian StateGovernment, joined the partnership in April 2002.
The Common Solutions Project is an innovative response to addressing the antecedents thatunderlie a range of health and social problems. Our thinking is akin to that of Schorr (1997) whonotes that there is a growing consensus in the USA that “…multiple and interrelatedproblems…require multiple and interrelated solutions”, and that it is insufficient to address issuessuch as road safety, poverty, education, housing, crime, health and employment one at a time.
This paper provides a broad overview of investigative research findings, explores the dynamicsof the unusual but successful cross-sectoral Common Solutions partnership, and outlines somepossibilities for future activities.
The aims of the Common Solutions project are to:• determine whether certain groups of people are more at risk of experiencing a multitude of
risky behaviours such as drink driving, early school leaving, substance misuse, and criminalbehaviour rather than just one or two of these behaviours;
• draw conclusions about what influencing factors can be addressed to improve healthoutcomes and what elements of upstream programs are most effective;
• examine the effectiveness of approaches that are currently being used to address “upstream”factors in a range of settings;
• determine what are likely benefits and/or disadvantages of this type of approach to reducingroad trauma.

- 753 -
MethodologyIn this investigative work, a very broad review of health promotion, education, and road safetyliterature was conducted. International searches were undertaken through libraries, the internetand electronic databases. Key points to emerge from the literature were:
• A significant amount of time (at least five years) needs to be allocated to the development andimplementation of larger projects.
• Intersectoral collaboration is a key ingredient in every successful project.• Although the issues can vary, from motor vehicle crashes to unintended teenage pregnancy
for example, the factors that protect against these are the same. These can include a caringrelationship with at least one adult, connectedness to school, and effective problem solvingskills.
• For protective factors to be in place across different transitional life stages, such as movingfrom primary to secondary school, various settings need to be targeted simultaneously fordifferent risk factors.
• The combination of factors, rather than any one alone, is often the stronger predictor of lateroutcomes. However, there is a need to simultaneously target various settings to intervene orprevent any one of these factors being the catalyst to risky outcomes.
There were two workshops held, the first with the transport, health and juvenile justice sectors.The second workshop had representatives from the drug and alcohol, sexual health, education andtransport sectors. These workshops were designed to identify any unpublished work that had beenconducted that would contribute to the project, as well as gaining the insights, experience andthoughts of experts from a broad cross-section of health areas.
Participants were asked to describe issues that they faced when working with young people.Common issues amongst these sectors are:• There is an understanding that all sectors are trying to work with the same population group –
young people – and although the issues are different, the underlying antecedents are similar.• Societal pressure on young people is widespread. Young people face the win/lose,
success/failure dichotomies that are so prevalent in society today, and this has a significantimpact on behaviour.
• There is a need to have common messages about working collectively occurring within andbetween sectors to assist in overcoming difficulties posed by terminology and languageissues.
Research findingsThere appears to be a significant amount of data that places road trauma within a broader contextof communities, schools, and families. Alongside road trauma appear issues like substance use,violence, and sexual behaviour, which with road trauma, appear to share similar populationgroups, and occur in similar contexts. The following section will explore the meanings of some ofthese findings, and how they relate to understanding the potential for collaborative, preventiveapproaches to reducing road trauma among youth.

- 754 -
- 755 -
Victim Impact PanelsDo They Impact Drinking And Driving Behavior?
1D.R. Wheeler, 2W. G. Woodall, 3E. Rogers
1Center on Alcoholism, Substance Abuse, and Addictions (CASAA), University of New Mexico,Albuquerque, New Mexico, USA,
2, 3Department of Communications and Journalism, University of New Mexico,Albuquerque, New Mexico, USA,
KeywordsVictim Impact Panels, Prevention, Drunk Driving
AbstractResults of two randomized trials with Victim Impact Panels (VIPs) were compared. Trials havefound that while there is considerable movement among intention and self-efficacy measures,Impact Panels have little effect on subsequent Driving While Intoxicated (DWI) arrest ordrinking and driving behavior.
IntroductionVictim Impact Panels (VIP’s) have been instituted throughout the United States in hope ofreducing DWI’s. VIP’s represent a considerable investment of resources for individualsassociated with Mothers Against Drunk Driving (MADD), for local justice systems (in manylocales, first-time offenders are required to attend VIP sessions as part of their sentence), and forthose attending the VIP.1 If effective, VIP’s could be a cost-effective means of further reducingDWI morbidity and mortality. If not, resources may be better utilized elsewhere.
Investigations of the effectiveness of MADD VIPs do not provide unequivocal evidence aboutthe effects of VIP experiences on subsequent alcohol consumption, drinking and driving behavioror recidivism. MADD-sponsored studies have found that those who attended MADD VIP’s hada lower recidivism level than non-VIP participants. The Washington County, Oregon studyfound the recidivism rate of VIP participants was 8.8 percent, compared to a non-participant re-arrest rate of 40 to 45 percent.2 A similar study in Clackamas County, Oregon found that the re-arrest rate for VIP participants was one-third that of non-participants.3 One study found that thosewho did not attend a VIP were more than twice as likely, 18.7% as compared to 9.3%, to be re-arrested for DUI [Driving Under the Influence] during the 12 months following post-test data-collection.4 Fors and Rojek found that the 12-month re-arrest rate for 404 VIP participants in oneGeorgia county was 6 percent, compared to 15 percent for 431 DWI offenders who did notexperience a VIP.5

- 756 -
Other investigations have not supported the effectiveness of VIPs as a DWI deterrence strategy.Shinar and Compton for example, compared the recidivism rates obtained from driving recordsfor several thousand DWI offenders in California and Oregon with (1) a comparison groupmatched on gender and age, and (2) a comparison group of DWI offenders sentenced to a VIP butwho failed to attend. The results showed that the VIP experience had no measurable effect onrecidivism.6 Additionally, a study which compared 3,517 DWI offenders who were sentenced toattend VIP’s with 1,721 DWI offenders who were not so sentenced in Bernalillo County, NewMexico found that a VIP referral did not increase re-arrest rates but lowered them marginally tonot at all.7
The above-mentioned studies have two major limitations. They employed either a panel surveydesign or a quasi-experimental design that lacked randomization of respondents to treatment orcontrol. Thus they cannot to provide clear, unequivocal evidence as to the effectiveness of VIPprograms.
Two controlled randomized field trials of the effectiveness of VIP’s have been conducted in twocounties of New Mexico, USA, the MADD VIP Trial (MADD) and the Customized VIP Trial(Customized). Both trials involved court-defined first-time DWI offenders. Both trials analyzedtraffic safety records two years following VIP condition. Measures of drinking and drivingbehavior for each trial were obtained from self-report data following VIP condition. There are anumber of differences between the trials: sentencing of the offender; majority population; follow-up to panel presentation; length between and number of follow-up points.
MethodsThe findings of two randomized trials of the effects of Victim Impact Panels on drinking anddriving behavior were compared.
The population of the MADD VIP trial was predominately Hispanic (46%). Participants in theMADD trial were court-defined first-time DWI convicted from the Bernalillo County MetroCourt in Albuquerque, New Mexico. MADD participants were randomly assigned followingcourt sentencing for DWI to either a MADD VIP and DWI school group or a DWI school onlygroup.
MADD participants were assessed at pretest, post-test, one year and two year follow-up timepoints. Their traffic safety records were obtained from the State of New Mexico for the twoyears following the VIP condition. Drinking and driving information was obtained at eachfollow-up point.
The Victim Impact Panels in this trial were presented in a large public hall. The audience rangedbetween 100 and 200 people, police officers patrolled the aisles. Audience members were askedto complete an evaluation form following the presentation.
Native Americans accounted for 60% of the population in the Customized VIP trial. Participantswere inmates in a court-mandated 28-day DWI Detention/Treatment Program in San JuanCounty, New Mexico (SJCDWI). Participants were recruited upon their entrance into the 28-dayProgram. They were randomly assigned to either the Program including VIP or program and no-

- 757 -
VIP upon their entrance into the 28-day Program. Participants in the Customized trial wereassessed on three occasions: intake, the day preceding their release and two month follow-up.
The Victim Impact Panels in the Customized trial were tailored to the audience with regard toethnicity, language and lifestyle. The VIP’s were held in the courtroom where most of theoffenders had been sentenced. The audience was primarily inmate offenders numbering between30 and 40 individuals. Detention center guards were also present. Following the Panel, inmateswere returned to their dorms where they participated in a discussion of how drinking and drivinghad affected their lives. Each inmate was required to fill out a workbook, which they laterreviewed with their counselor.
Table 1: Demographics Study Participants___________________________________________________________________________
MADD Participants Customized VIP Participants _____________________________________________________________
n % n %___________________________________________________________________________Gender
Male 625 (75%) 66 (67%)Female 208 (25%) 33 (33%)
EthnicityAfrican American 17 (2%) 5 (5%)Anglo 300 (36%) 29 (29%)Hispanic 383 (46%) 6 (6%)Native American 100 (12%) 59 (60%)Other 34 (4%) 0
____________________________________________________________________________
ResultsThere was no significant difference in re-arrest or drinking and driving behaviors between thosewho attended and those who did not attend the VIPs in both trials.
The MADD trial found a non-significant trend in the direction of VIP subjects reporting moredrinking and driving behavior at both one-year and two-year follow-ups. Re-arrest rates for DWIapproached being significantly different across groups, with the mean for the VIP group (0.242)being approximately 30% higher than that for the DWI only group (.186),F(1,780)=3.60,p=.0583. 8
The Customized trial had similar findings. A 2x2 Chi square analysis was conducted with groupassignment as one dimension (VIP, no-VIP) and subsequent DWI arrest for a two-year periodafter release from the Program on the second dimension (yes/no). Chi square was not significant,c (1) N=89, 1.40, p<.24, indicating that there was no differential rate of recidivism based upongroup assignment. Chi squares indicated no significant differences between the two groups withrelation to drinking in the past 60 days (yes/no), driving after drinking in the past 60 days(yes/no), number of days with five or more drinks (yes/no), or driving after drinking five or more
- 758 -
drinks (yes/no): Drinking in the past 60 days, P2 (1, N=81)=.020, p=ns; driving after drinking, P2
(1, N=81)=.202, p=ns; five or more drinks, P2 (1, N=81)= .073, p=ns; driving after five or moredrinks, P2 (1, N=81)=.171, p=ns. 9
DiscussionResults of the two randomized trials indicate that, regardless of the population, setting of thepanel, sentencing of the offender, customizing of the panel or utilization of the panel in treatment,VIPs do not appear to produce a differential benefit with regard to recidivism or drinking anddriving behavior of court-defined first-time DWI offenders
VIPs are set up to appeal to the emotions of those in the audience. The overall intent of the VIPis to bring the offender face-to-face with the broad range of negative consequences that drinkingand driving bring about.8 This type of emotional appeal does not appear to have a long-termeffect on the larger issues of alcohol abuse and/or dependency, which are more likely to be theunderlying reasons for drinking and driving. While they may prove to be beneficial to thepanelists and the public at large may see them as a valuable educational tool, Victim ImpactPanels do not appear to have a significant impact on drinking and driving.
References1. Polacsek M., Rogers EM, Woodall WG, Delaney H., et al. MADD victim impact panels and stages-
of-change in drunk driving presentations. J of Studies on Alcohol 2001; 62;344-350.
2. MADD. Study conducted in Washington County, Oregon. 1989 Unpublished.
3. Laughlin LH. Drunk driving: The effects of the Clackamas County DUI Victim Impact Panel onrecidivism rates. Oregon City, OR: Clackamas County MADD Chapter. 1990.
4. Sprang G. Victim Impact Panels: An examination of the effectiveness of this program on loweringrecidivism and changing offender’s attitudes about drinking and driving. J of Social Service Research1997, 22; 73-84.
5. Fors SW, & Rojek DG. The effect of victim impact panels on DUI DWI re-arrest rates: A twelve-month follow-up. J of Studies on Alcohol 1999; 60;514-520.
6. Shinar D and Compton RP. Victim Impact Panels: Their impact on DWI recidivism. Alcohol Drugsand Driving 1995;11;73-87.
7. C’de Baca J, Lapham SC, Paine S., Skipper BJ. Victim impact panels: Who is sentenced to attend?Does attendance affect recidivism of first-time DWI offenders? Alcoholism: Clinical andExperimental Research 2000; 24;1420-1426.
8. Woodall WG, Delaney H., Rogers E, Wheeler DR, et al. Mothers Against Drunk Driving VictimImpact Panels as a DWI Deterrent: Results from a randomized trial. Manuscript, University of NewMexico, Center on Alcoholism and Substance Abuse and Addictions (CASAA), Albuquerque, NM2002.
9. Wheeler DR, Rogers EM, Tonigan JS, Woodall WG. Effectiveness of Customized Victim ImpactPanel on First-Time DWI Offender Inmates. Manuscript, University of New Mexico, Center onAlcoholism and Substance Abuse and Addictions (CASAA), Albuquerque, New Mexico 2002.

- 759 -
Development and Analysis of a Drugand Alcohol Driving Awareness Program
M. E. Dennis
Center for Alcohol and Drug Education StudiesTexas A&M University
P.O. Drawer S-5College Station, Texas 77844-9175
KeywordsAlcohol, education, prevention
AbstractThis paper describes an alcohol/drug education program that focuses upon prevention of unsafedriving behavior because of use of alcohol or other drugs. Results of a survey analysis of theprogram are included.
IntroductionThe state of Texas has the highest incidence of alcohol related traffic deaths in the United States.In 2000, National Highway Safety Administration (NHTSA) data revealed that 50% of all trafficdeaths in Texas were alcohol related as compared to 40% for the United States as a whole (1). Inaddition, research has shown that young people are significantly more likely to be in fatal motorvehicle crashes than adults (2) (see Table 1)
Table 1
BAC & RISK OF DEATH
BACAGE
.020-.049 .080-.099 .150+
16-20 M – 5F – 3
M – 52F – 15
M – 15,560F – 738
21-34 3 13 57235+ 3 11 382
- 760 -
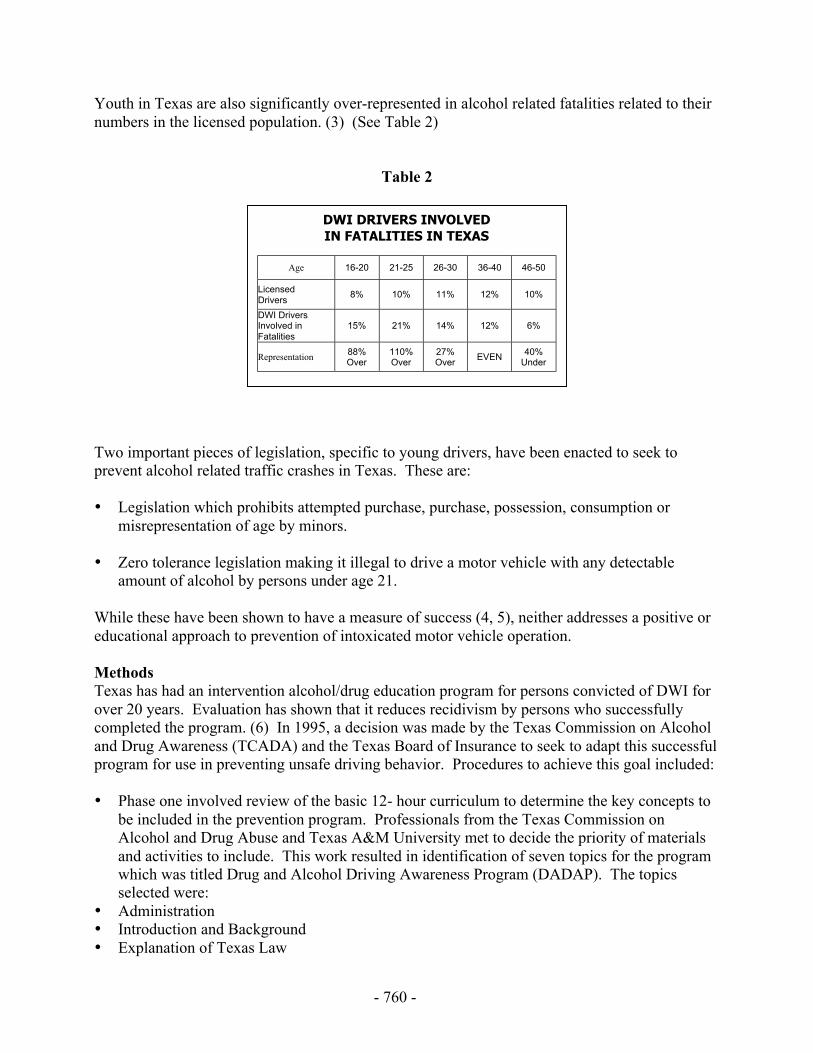
Youth in Texas are also significantly over-represented in alcohol related fatalities related to theirnumbers in the licensed population. (3) (See Table 2)
Table 2
Two important pieces of legislation, specific to young drivers, have been enacted to seek toprevent alcohol related traffic crashes in Texas. These are:
• Legislation which prohibits attempted purchase, purchase, possession, consumption ormisrepresentation of age by minors.
• Zero tolerance legislation making it illegal to drive a motor vehicle with any detectableamount of alcohol by persons under age 21.
While these have been shown to have a measure of success (4, 5), neither addresses a positive oreducational approach to prevention of intoxicated motor vehicle operation.
MethodsTexas has had an intervention alcohol/drug education program for persons convicted of DWI forover 20 years. Evaluation has shown that it reduces recidivism by persons who successfullycompleted the program. (6) In 1995, a decision was made by the Texas Commission on Alcoholand Drug Awareness (TCADA) and the Texas Board of Insurance to seek to adapt this successfulprogram for use in preventing unsafe driving behavior. Procedures to achieve this goal included:
• Phase one involved review of the basic 12- hour curriculum to determine the key concepts tobe included in the prevention program. Professionals from the Texas Commission onAlcohol and Drug Abuse and Texas A&M University met to decide the priority of materialsand activities to include. This work resulted in identification of seven topics for the programwhich was titled Drug and Alcohol Driving Awareness Program (DADAP). The topicsselected were:
• Administration• Introduction and Background• Explanation of Texas Law
DWI DRIVERS INVOLVEDIN FATALITIES IN TEXAS
Age 16-20 21-25 26-30 36-40 46-50
LicensedDrivers
8% 10% 11% 12% 10%
DWI DriversInvolved inFatalities
15% 21% 14% 12% 6%
Representation 88%Over
110%Over
27%Over
EVEN 40%Under
- 761 -
• Physiological and Psychological Effects of Alcohol/Drugs• Effects of Alcohol/Drug on the Driving Task• Signs of a Problem• Decision Making
A brief overview of each topic follows.
1. Module One: Administration - Basic class rules, pre-test and course administration.
2. Module Two: Introduction and Background – This module provides an overview of thecourse and information on the extent of the alcohol/drug problems in Texas, especially asthey relate to specific offenses.
3. Module Three: Explanation of Texas Law – This module provides information on variouslaws relating to minors in possession (MIP), public intoxication, driving while intoxicated(DWI), DUI by minor and controlled substances as well as possible civil penalties which canbe assessed.
4. Module Four: Physiological and Psychological Effects of Alcohol/Drugs – This moduleprovides information on basic effects of alcohol and drugs on the body, absorption, toleranceand other physiological and psychological aspects of alcohol or other drug use.
5. Module Five: Effects of Alcohol/Drugs on the Driving Task – This module shows researchrelated to alcohol on driving task effects and information on the probability of being involvedin a DWI-related accident/fatality.
6. Module Six: Signs of a Problem – This module explores the various warnings signs of aproblem with the use of alcohol or other drugs.
7. Module Seven: Decision Making – This module provides information on possible actionspersons can take to prevent alcohol/drug and driving related problems.
A detailed Administrator/Instructor manual was developed which contains material on programadministration, rules, instructor selection, facilities, data collection and resources in addition tothe course content.
• The second phase of the program development involved creation of anadministrator/instructor preparation program. A 24-hour training program was developedwhich includes:
Criteria for selectionCoverage of the curriculum modulesInstructional techniquesWritten testStudent teaching
- 762 -
• Phase three involved securing approval of the program by the TCADA and the TexasDepartment of Insurance.
The curriculum materials were submitted for review to these two agencies and approval wasobtained. The Texas Department of Insurance agreed to provide a 3 year, 5% automobileinsurance premium reduction for any driver successfully completing the program. Persons whohad been convicted of DWI or MIP within the previous seven years are not eligible for thisdiscount.
• Phase four involved administrator/instructor training. A series of workshops throughoutTexas were held to prepare persons to provide the course.
• Phase five involved ongoing efforts to monitor, evaluate and up-date the program. Collectionof data related to demographics and test scores is conducted. In addition, procedures havebegun to seek to determine the incidence of alcohol/drug related traffic violations and crashesof persons who complete the program. Annual updates are conducted to incorporate newlegislation, research findings and software.
ResultsThe DADAP is presently provided in approximately ten locations in Texas, primarily as part ofhigh school driver education programs. Efforts have been made to provide the course tocompanies and governmental agencies as well as the general public.
A survey of instructors providing the program has enabled identification of areas of strength andweakness. These findings have shown:
1. Most programs and instructors believe the DADAP is a valuable educational tool. Forexample 86% felt it should be required of all beginning drivers in Texas.
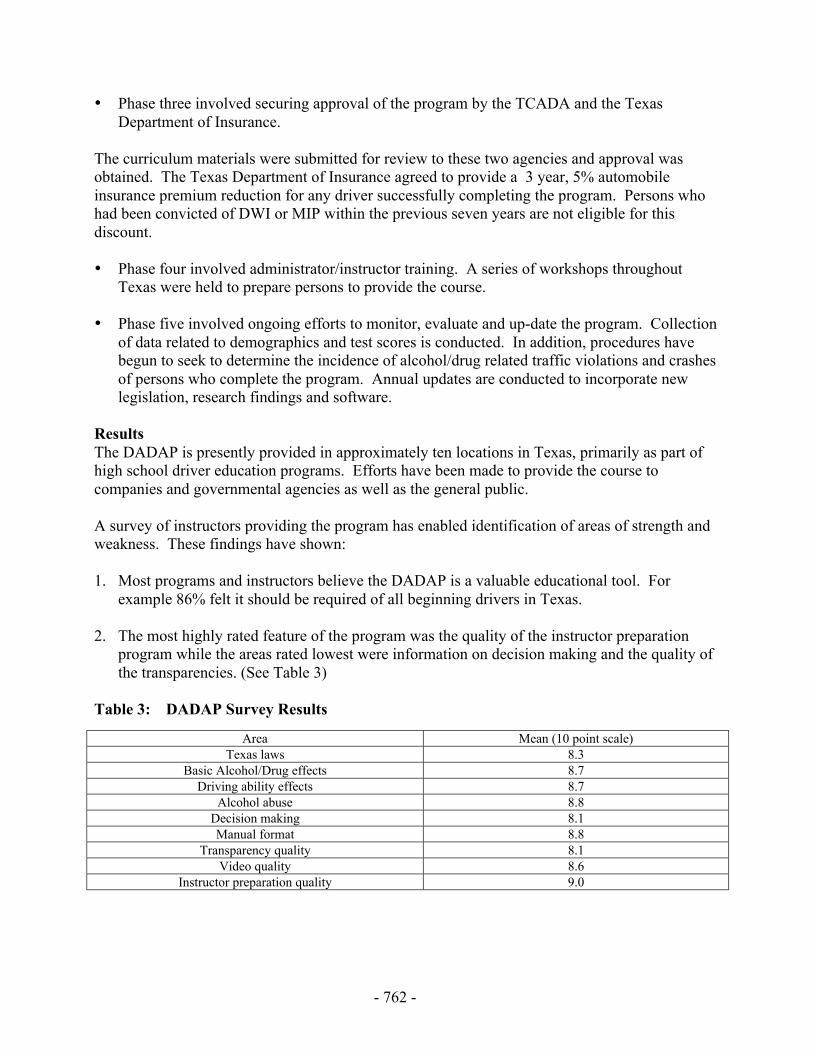
2. The most highly rated feature of the program was the quality of the instructor preparationprogram while the areas rated lowest were information on decision making and the quality ofthe transparencies. (See Table 3)
Table 3: DADAP Survey Results
Area Mean (10 point scale)Texas laws 8.3
Basic Alcohol/Drug effects 8.7Driving ability effects 8.7
Alcohol abuse 8.8Decision making 8.1Manual format 8.8
Transparency quality 8.1Video quality 8.6
Instructor preparation quality 9.0

- 763 -
It should be noted that there was a high degree of agreement and no mean was rated lower than8.1 on a ten point scale.
1. The survey also asked instructors how effective this course is in providing alcohol/drug/traffic safety education for high school driver education students and the publicat large. On a ten point scale, instructors rated the program 9.0 and 9.1 respectfully for highschool driver education students and the general public.
2. Areas in need of improvement – Narrative comments illustrated several areas whichinstructors feel need to be improved. These were:
• More decision making exercises• Improve software quality• Interim quizzes for high school driver education students• More information on non-alcohol drugs• Better advertisement of the program
Each of these areas are being addressed with updates to be in place by September 30, 2002.
DiscussionThe Texas DADAP is an initial educational step in providing alcohol and other drug information related totraffic safety. While no education program can inoculate against poor decisions by drivers, this programhas the potential to assist drivers of all ages in making sound decisions. The survey results indicate thatinstructors feel the program is worthwhile as well as point out areas in need of improvement.
References1. National Highway Traffic Safety Administration. Traffic Safety Facts 2000. DOT HS 809
323, December 2001.
2. Zador, Paul L., Sheila A. Krawchuk and Robert B. Voas. “ Alcohol-Related Relative Risk ofDriver Fatalities and Driver Involvement in Fatal Crashes in Relation to Driver Age andGender: An Update Using 1996 Data. ” Journal of Studies on Alcohol, Vol. 64, 2000, pp.387-395.
3. Texas Department of Public Safety, “Motor Vehicle Traffic Accidents” Austin, Texas, 2000.
4. O’Malley, P.M., and A.C. Wagenaar. “Effects of Minimum Drinking Age Laws and TrafficCrash Involvement Among American Youth: 1976-1987.” Journal of Studies on Alcohol,Vol. 52, #5, 1991.
5. Blomberg, Richard D. “Lower BAC Limits for Youth” Evaluation of the Maryland .02Law.” DOT HS 807860, NHTSA, March, 1992, p. 17.
6. Liu, L.Y. “DWI Recidivism in Texas: 1987-1990.” Texas Commission on Alcohol andDrug Abuse. Austin, Texas 1993.

- 764 -
- 765 -
The Role of Formative Evaluation inDeveloping a Prevention Program for New Young Drivers
E. Votta and M. MacKay
Plan-it Safe, Children’s Hospital of Eastern Ontario, Ottawa, Ontario, Canada
KeywordsEvaluation, Prevention, Youth
AbstractOver 350 youth between 15 and 19 years of age were killed in automobile crashes in Canada in2000 and 30,000 were injured. One approach to reducing risky driving behaviour among newdrivers is family-oriented strategies, such as driving contracts. The I Promise Program (IPP) is aroad-safety program targeting new young drivers and their parents. Its primary objective is toreduce traffic-related injury and death among new young drivers through a Parent-Youth MutualSafe-Driving Contract and a Rear-Window Decal eliciting community feedback. Formativeevaluation ensures that program materials and strategies are appropriate and acceptable for theprogram and target population(s). Because youth, IPP’s major target group were not included inprogram development, we conducted a formative evaluation of the program with the three groupsit impacted [new young drivers, parents of new young drivers, community members].Acceptability of the IPP and its components to the target groups were assessed through focusgroups with young drivers, parents of young drivers, and members of the community. Contentanalyses were conducted to evaluate descriptive data on the target populations’ attitudes towardthe IPP and its components. Analyses indicated the need to review the IPP contract’s language-level, comprehensiveness, length, format and content. Discussion regarding the decal addressedits visual acuity, memory issues, anonymity of reporting, and general feasibility.
IntroductionIdeally, evaluation is a process that begins with the conception of a new injury-preventionprogram idea, interweaves with program activities, and ends upon completion of the program (1).The first stage of evaluation, known as formative evaluation, is a way of making sure programplans, procedures, activities, materials and modifications will work as planned. Formativeevaluation also occurs when an existing program is being modified, has identified barriers withno obvious solutions, or is being used in a new setting with a new population or to target a newproblem or behaviour (1). The reasons to conduct formative evaluation of programs, particularlyinjury-prevention programs, are both important and numerous. First, to learn whether theproposed program materials are suitable for the people who are to receive them. Second, to learnwhether program plans are feasible before they are put into effect. Third, to have an earlywarning system for problems that could become serious if left unattended (1).
- 766 -
By virtue of being open-ended, qualitative methods are especially valuable during the formativeevaluation phase when proposed procedures, activities, and materials are being developed.Qualitative methods allow the evaluator “unlimited scope to probe the feelings, beliefs, andimpressions of the people participating in the evaluation and to do so without prejudicingparticipants with the evaluator’s own opinions” (1). One method of qualitative research is focusgroups. In small-group settings, focus groups allow an evaluator to probe the strength andweaknesses of a new or modified program before it is in effect, or the cause of a problem shouldone develop after a program is in effect. Focus groups allow the exploration of specific programissues with input leading to specific program modifications (e.g., program purpose and concept,language, format, cost). As different combinations of people will yield different perspectives,several focus groups are often conducted in order to maximize one’s understanding of thesituation under evaluation (2).
Whether their purpose is to prevent a problem from occurring, to limit the severity of a problem,or to provide a service, all injury-prevention programs should be evaluated (1). Given this, Plan-it Safe employed a focus group methodology to conduct an independent formative evaluation of anew and innovative driving program. The I Promise Program (IPP) is a primary injuryprevention program developed for new young drivers and their parents. Youth are at greatest riskof being in a motor vehicle collision. They are over represented in crashes relative to the rest ofthe population and have higher per capita death and injury rates than any other age group. InCanada in 2000, over 350 youth between 15 and 19 years of age were killed in car crashes and30,000 were injured (2). These statistics indicate that teen drivers account for 11.5% of driverdeaths and thus constitute a major traffic safety problem in Canada.
The IPP is based upon 1) a mutual safe-driving contract between parents and youth; and 2) a 1-800 number on a rear-window decal that allows community members to file reports on a driver’sbehaviour to a professional call-centre. The program and its materials were developed over a 2-year period in consultation with police departments and insurance companies, and subsequentlylaunched to the public in January 2002. However, the program’s target audiences, particularlynew young drivers, parents of new young drivers, and members of the community were notconsulted during the developmental phase. Using IPP as an example of an injury preventionprogram developed without formative evaluation, the objective of this paper is to review theimportance of formative evaluation as a primary step in developing prevention programs targetedto specific behaviours and/or groups.
MethodsTo assess the acceptability and feasibility of the I Promise Program and its components in EasternOntario, Plan-it Safe conducted a series of focus groups with the three groups it impacted [newyoung drivers, parents of new young drivers, community members]. Eight focus groups wereconducted between October 2001 to February 2002. Four were conducted with 42 new or soon-to-be new young drivers (18 from an urban setting, 23 from a rural setting). Two were conductedwith 19 parents of new or soon-to-be new young drivers (9 from an urban setting, 10 from a ruralsetting) and two were conducted with 14 community members (9 from an urban setting, 5 from arural setting). Participants received a $50.00 honorarium for their participation.
Trained youth moderators facilitated the four focus groups with youth, while the remaining werefacilitated by trained adult moderators. Each session was audio-recorded for later transcription.
- 767 -
The sessions began with a verbal description of the overall program and an invitation for thegroup’s initial perceptions. Participants were then given two versions of the driving contract (theoriginal version and a modified “youth-friendly” version developed by Plan-it Safe), as well asthe registration brochure and frequently asked questions information sheet. They were alsoshown the program’s rear-window decal. For each component, participants were asked toprovide feedback in terms of their likes, dislikes, and suggestions for change. Following this,participants were asked for feedback regarding potential incentives, social marketing strategies,peer reactions, additional modifications, and their willingness to participate.
Audio-recordings were transcribed and qualitative analyses using content analysis procedures(i.e., identification of themes, categories) were conducted to describe the target populations’attitudes toward the IPP and its respective components.
ResultsAnalyses of the focus group transcripts indicated the emergence of 3 general themes: overallprogram concept and message; presentation style of program materials (format, language,content); and influences on participation (program cost, incentives, advertising).
Overall Program Concept and Message. Conceptually, youth and parents identified the programand the driving contract as an effective communication tool that provided families theopportunity to discuss expectations and concerns, and revisit responsible driving behaviours.Given that both parents and youth agree to the contract, it was felt that by participating both mayengage in safer driving behaviours. Youth felt that by participating they could give parents andcommunity-members the message that they wanted to be responsible drivers. Youth and parentsalike appreciated the concept of mutuality underlying the program, specifically that the programmade parents accountable to, and role models for, their children. However, youth wereconcerned that parents would not abide by the contract conditions, while parents were concernedthat youth would remove the rear-window decal.
Despite their positive reception of the program, parents and youth both expressed concerns thatsome parents would coerce youth into participating in the program by threatening a loss of the carand/or driving privileges. Youth also felt somewhat targeted by the program, stating that adultsalso tend to drive irresponsibly. Youth’s initial impressions of the decal were of embarrassment,while the overall message of the program was seen as not to teach responsible driving, but tosimply put a sticker on one’s car. Participants were of the opinion the public would not take thetime to call nor would they know what information to provide upon seeing the decal as it did notrefer to being part of a driving program. Although parents liked the concept of the decal and theoption of filing a report on one’s driving behaviour to someone other than police, some wereconcerned that the program would generate more negative calls than positive calls. Parents werealso concerned that the potential for negative calls could drive a wedge between parents andyouth, and questioned if reports to the call-centre would become part of one’s driving record orget back to police/insurance agents. All participants addressed the difficulties in getting therequired license plate information, calls’ legitimacy, possibility of verifying reports, and specificsof the call-centre (location, staffing).
Parents and youth agreed that the program would only work with responsible youth and wouldnot work in families where issues related to responsibility and safe-driving were being addressed
- 768 -
for the first time. Further, participants stated that the contract and brochure erroneously impliedthat participation in the program would guarantee safety, as well as gave the message to parentsthat they did not care about their children if they did not purchase the program.
Presentation Style of Program Materials: Format, Language, Content. The program materials’presentation style, as specifically related to format, language, and content, also emergedthroughout the focus groups. Participants felt the original documents contained too much textand were therefore too difficult and unappealing to read. Recommended revisions included theuse of bullets (e.g., point-form), graphics and statistics, use of a less formal font, and use oftechniques such as shading, page/paragraph bordering, and bolding.
With respect to the decal, although participants liked the colours used, concerns were raisedabout its visual acuity. Participants felt it was too small, plain, and that there was too muchinformation on it. Participants felt the current phone number was too difficult to recall, andunanimously recommended that it be replaced with either a “catchier” number or a “word” (e.g.,PROMISE). Participants also asked if the decal would withstand different climactic conditionsand was sufficiently reflective to be seen at night and through tinted windows.
Level and tone of the documents’ language was also raised in the focus groups. The originaldocuments were identified as too “legal speak”. Both youth and parents felt the originaldocuments spoke to parents only and implied youth were not mature if they were not willing toparticipate in the program. Participants recommended that the documents be made more “youth-friendly” by using language that was appealing to youth. Participants stated that phases in thecontract and registration brochure were condescending and insulting (e.g., “sit at a table”, “carsare expensive machines”). Both youth and parents stated there was too much redundancy withinand between the program components, particularly between the brochure and FAQs. Participantsrecommended that all program components be made more succinct.
With respect to the content of the various program components, the main theme that emerged inthe focus groups was the relevancy and appropriateness of the information. Youth felt there weretoo many rules and conditions in the original contract and expressed dislike for items such as nosmoking or eating in the car, no talking on cell-phone, music volume level, and the phrases“registered vehicle owner” and “on parents’ side”. With respect to the modified contract, parentsand youth liked the use of the words “I Promise” and the succinctness with which all items werestated. Youth liked a paragraph about what to do in case of an emergency as well as thefollowing items: mood, running late, peers, and loud music could effect their driving; driveralone is responsible for fines; car-maintenance responsibilities section; don’t get in car withimpaired driver.
Participants felt there should be more emphasis on the statements “driving is a privilege”,“parents as role models”, and on the possibility of parents being the recipient of a negative call-centre report. Parents were concerned about youth driving under the influence of drugs (e.g.,marijuana) and thus suggested that “I promise to drive sober” be changed to “I promise to drivesober and drug-free”. Parents indicated a need for clarification regarding the term “incident”,specifically if it referred to a negative report, an infraction, or a crash.
- 769 -
Youth and parents were unanimous in their agreement that the disclaimer included in the contractand brochure was too long. Participants suggested that it be stated whether interested familiescan register on-line and that a link for youth be provided on the website. Participants stated thatit be specified that information is confidential and will not be sold to insurance companies.Parents requested information about the effectiveness of other similar programs.
Participants suggested that the following issues be addressed as an FAQ: how and whereinterested families can contact the IPP for additional information; when the report will besent/received; possibility of prank calls, and how they will be detected/handled by the call-centrestaff; information about the call-centre, specifically staffing, location, and assurance of reportaccuracy; what families should do upon receiving a report; and information about the companyand program developer, specifically who or what is IPP.
Influences on Participation: Program Cost, Incentives, Advertising. With respect to the programcost, participants expressed reservations about its specified cost. They questioned the amount ofthe registration fee, program expenses, cost of re-registration for a 2nd year, whether the programwas non-profit, and/or whether any of the program’s proceeds were going to charity. In theabsence of information to address these issues, participants expressed a hesitancy to participate inthe program.
Insurance discounts and rewards for “incident-free” driving were offered as a planned incentiveto participants in the program. Feedback regarding the planned incentives addressed theirpotential effectiveness and appropriateness. Both youth and parents not only felt that there wastoo much emphasis on insurance discounts in all of the program’s components, but that thereferences were misleading and inconsistent. Participants stated that the involvement of theinsurance companies should be stipulated, specifically what they are able to offer and whichcompanies have agreed to honour a family’s participation. Participants questioned whatinformation would be provided to insurance agents for the purposes of later evaluation.
Contrary to expectations, neither youth nor parents liked the concept of “rewards” in theprogram’s contract. Youth stated that one’s rewards are staying alive and use of the car, and thatrewards for driving responsibly are unnecessary. Parents had reservations about the provisionand frequency of rewards.
All focus group participants unanimously stated that large-scale advertising campaigns should beconducted to ensure that the public would recognize the program upon seeing the decal, wouldknow the process involved in filing a report, and would know they could call with bothcompliments and concerns. Without this, participants questioned the potential effectiveness ofregistering in the program. Participants recommended various advertising mediums be used (i.e.,television, radio, newspaper, posters) in locations where youth and parents converged (e.g., highschools, arenas, community centres), in both urban and rural settings.
DiscussionMany programs are developed without the target population(s)’ input. Although the I PromiseProgram was developed in consultation with numerous police officers, insurance agents, etc., it isan example of an injury-prevention program that was developed without the formal inclusion ofits target audiences in the development process. This paper highlights the importance of
- 770 -
formative evaluation in the development of a new program targeting new drivers and theirparents. The results of the formative evaluation conducted by Plan-it Safe indicate that theprogram in its original form was not acceptable to the target populations. The target audiencesidentified numerous issues with the overall program and its specific components that, ifaddressed and modified accordingly, could increase the appeal and acceptability of the programto the various target populations. Specifically, results indicated the need to consider thefollowing three issues. First, acceptability of the overall program concept and message (i.e.,message given and received). Second, presentation issues such as language (i.e., level, tone,redundancy), format (i.e., readability), and content (i.e., relevancy). Lastly, issues influencingparticipation such as cost (i.e., specifics of expenses), incentives (i.e., consistency/accuracy ofinformation, effectiveness), and advertising (i.e., large-scale, target audiences, mediums).
Following the synthesis of results, the program developer was presented with the groups’feedback and recommendations, as well as modified drafts of the program materials as developedby Plan-it Safe based on the results. Modifications were reviewed and implemented accordingly.Youth and parent recommended modifications to the driving contract, registration brochure, andfrequently asked questions included making the documents youth-friendly, succinct, presentable,and program-relevant. Based on these recommendations, Plan-it Safe’s proposed documentsconsisted of language that was reader-friendly to parents and youth in level, tone, and vocabulary.Where appropriate, text was made more succinct by using point-form rather than sentence-form.Program-relevance was addressed by ensuring that all the content was parent- and youth-specific, applicable, practical, and family-specific.
Redundancy in information among the materials was minimised by combining the registrationbrochure and frequently asked questions into one comprehensive brochure addressing the variousissues raised by youth and parents (e.g., prank calls). Statistics, graphics, and bolding wereincluded to make the document more appealing to the reader. The brochure was modified toinclude the following: information about the program’s components, program’s developer, howthe program works (e.g., communication tool, contract examples, placement of decal), who getsthe reports, when the reports are received, information on the call-centre staff, informationregarding confidentiality of the reports, involvement of all family members, effectiveness ofother programs, ability of program to keep family members safe, provision of road-sideassistance, cost of the program, expenses covered by the registration fee, cost of re-registration,involvement of insurance companies, means of acquiring additional information, registrationprocedures, and a distinct registration form.
With respect to the rear-window decal, the main recommendation was that the current phonenumber be replaced with an easier number or word. It was also recommended that the IPP logoand/or website be included on the decal to show the driver is part of a driving program.
In conclusion, the results of the formative evaluation highlighted the importance of formativeevaluation as a primary step in developing prevention programs targeted to specific behavioursand/or groups. More specifically, the results indicated that while a driving program developed toreduce youth-crashes may be positively received conceptually, it is imperative that the initiative’starget audiences, specifically youth, parents, and community members, be included in thedevelopment phase of such an initiative.

- 771 -
References1. Thompson, N. J., & McClintock, H. O. (2000). Demonstrating your program’s worth. A
primer on evaluation for programs to prevent unintentional injury. Atlanta, GA: Centres forDisease Control and Prevention. National Centre for Injury Prevention and Control.
2. Morgan, D. L. (1998). The Focus Group Guidebook. In D. L. Morgan & R. A. Krueger,(Eds.), The Focus Group Kit. Thousand Oaks, CA: Sage Publications, Inc.
3. Ministry of Transportation, Ontario. (2001). Ontario Road Safety Annual Report (2001).

- 772 -

- 773 -
The Guide to Community Preventive Services: Systematic Reviewsand Evidence-Based Recommendations for Community-Based
Interventions to Reduce Alcohol-Impaired Driving
1R.A. Shults, 1R.W. Elder, 1D.A. Sleet, 2S. Zaza, 3J.L. Nichols, 4R.S. Thompson
1Division of Unintentional Injury Prevention, National Center for Injury Prevention and Control,Centers for Disease Control and Prevention (CDC), Atlanta, Georgia, USA,
2Office of Research and Traffic Records, National Highway Traffic Safety Administration,Washington, DC, USA,
3Division of Prevention Research and Analytic Methods, Epidemiology Program Office, CDC,Atlanta, Georgia, USA,
4Group Health Cooperative of Puget Sound, Seattle, Washington, USA.
Keywordsreview literature, motor vehicles, accidents, traffic, automobile driving, alcohol drinking
AbstractWe conducted systematic reviews of the effectiveness of five community-based interventions toreduce alcohol-impaired driving for the Guide to Community Preventive Services. Results of thereviews were presented to the Task Force on Community Preventive Services (Task Force), a 15-member independent, nonfederal group with expertise in public health policy, behavioral andsocial sciences, and epidemiology. Based on these results, the Task Force made recommendationsfor implementing the interventions. This paper summarizes the findings of the systematic reviewsand lists the recommendations issued by the Task Force. It is based on previously publishedpapers in the American Journal of Preventive Medicine (1,2).
IntroductionAlcohol-impaired driving is a pervasive problem. Individual states and communities haveimplemented a broad range of strategies to reduce its occurrence. These systematic reviews wereundertaken to assess the effectiveness of five such strategies: .08 blood alcohol concentration(BAC) laws; lower BAC laws for young or inexperienced drivers; minimum legal drinking agelaws; sobriety checkpoints; and training for servers of alcoholic beverages. Because of spacelimitations, the citations for the papers reviewed are not included in this report. The reference listis contained in an American Journal of Preventive Medicine paper (1), which is available athttp://thecommunityguide.org/GUIDE/MVOI/pdf/alc_driving.pdf.
MethodsThe systematic reviews summarized in this paper were conducted for the Guide to CommunityPreventive Services (Community Guide) (www.thecommunityguide.org). Detailed methods havebeen described elsewhere (3,4). Briefly, we conducted a comprehensive search for peer-reviewed
- 774 -
journal articles, technical reports, and Association for the Advancement of Automobile Medicineproceedings to screen for inclusion in the review. To be included, a study had to: (a) be primaryresearch published in English before June 30, 2000; (b) provide data on at least one outcomerelated to alcohol-impaired driving (e.g., single-vehicle nighttime crashes); and (c) meetminimum research quality criteria.
We often had to select from several possible effect measures. We established and consistentlyapplied rules for identifying the outcome measure that most adequately reflected alcohol-relatedcrashes and addressed potential confounding variables. When available, we selected effectmeasures that compared alcohol-related fatalities to non-alcohol-related fatalities (e.g., proportionof all fatal crashes involving drivers with BACs of ∃0.10 g/dL; ratio of single vehicle nighttimefatal crashes to multi-vehicle daytime fatal crashes) over the absolute number of alcohol-relatedfatalities. These effect measures help control for both the long-term downward trend in total fatalcrashes and factors that influence the total number of crashes, such as weather, economicconditions, vehicle miles traveled, and safety characteristics of vehicle and highways (5). Whenavailable, we also selected effect measures that incorporated a concurrent comparison group suchas drivers in adjacent states or drivers within the same state who were unaffected by theintervention. For these studies, results were reported in the form of the net change, reflecting thedifference between the percent change for the intervention group and the comparison group. Forstudies using interrupted time series or other regression-based analyses, results were reported interms of the percent change estimated from the model.
The primary outcomes assessed in this literature were fatal and nonfatal injuries resulting fromalcohol-related motor vehicle crashes. Other outcomes included BACs of drivers at roadsidesurveys, and measured and estimated BACs of people leaving bars or other licensedestablishments. In this report, we included a median effect measure for at least one outcome perintervention. For median effect measures based on seven or more studies, the interquartile rangeis reported; otherwise a simple range is reported.
Results
.08 BAC LawsThese laws establish the illegal BAC of 0.08 g/dL for drivers aged 21 years and older in theUnited States (lower BAC levels are established for drivers aged 20 and younger). The literaturesearch identified nine studies of .08 BAC laws in the United States, all of which met the inclusioncriteria. One study presented data in a form that could not be converted to our summary effectmeasure. Seven studies provided state-specific results, and the remaining study provided asummary result for the 16 states that enacted .08 BAC laws before January 1, 1998. The medianpost-law percent change in alcohol-related motor vehicle fatalities was -7% (interquartile range(IQR): -15%, -4%). Post-law follow-up times ranged from 1 to 14 years (median = 5).
Lower BAC Laws for Young or Inexperienced DriversLower BAC laws for young or inexperienced drivers establish a lower illegal BAC for thesedrivers than for older or more experienced drivers. The literature search identified 14 studies ofthe effectiveness of these laws, of which six met the inclusion criteria. Four of the six studieswere conducted in the United States, and the remaining two were conducted in Australia. Each ofthe six studies reported a post-law reduction in crashes. The three studies that examined fatal
- 775 -
crash outcomes reported percent changes of -24%, -17%, and -9%. The two studies that examinedfatal and nonfatal injury crashes reported percent changes of -17% and -3.8%. The study thatexamined crashes in which the investigating police officer believed that the driver had beendrinking alcohol reported a percent change of -11%. Post-law follow-up times for individual statelaws ranged from less than 1 year to 15 years (median = 22 months).
Minimum Legal Drinking Age LawsMinimum legal drinking age (MLDA) laws specify an age below which the purchase or publicconsumption of alcoholic beverages is illegal. Studies included in this review assessed the effectof raising or lowering the MLDA on motor vehicle crashes; most of the studies assessed theeffect of changes in the MLDA from 18 to 21 years or vice versa. Thirty-three studies met theinclusion criteria. Twenty-seven of the included studies were conducted in the United States, fourwere conducted in Australia, one was conducted in the United States and Canada, and theremaining study was conducted in Canada. When the MLDA was raised, crashes likely to involvealcohol among the targeted age group declined by a median of 16% (IQR: -26%, -10%). Whenthe MLDA was lowered, crashes likely to involve alcohol among the targeted age groupincreased by a median of 10% (IQR: 2%, 30%). The effects were consistent over follow-up timesranging from 7 to 108 months.
Sobriety CheckpointsAt sobriety checkpoints, law enforcement officers systematically stop drivers to assess theirdegree of alcohol impairment. The goal is to deter alcohol-impaired driving by increasing theperceived risk of arrest. There are two types of sobriety checkpoints. At random breath testing(RBT) checkpoints, all drivers are stopped and tested for blood alcohol levels. RBT checkpointsare common in Australia and several European countries. In the United States, selective breathtesting (SBT) checkpoints are used. At these checkpoints, police must have a reason to suspectthe driver has been drinking (i.e., probable cause) before testing blood alcohol levels (6).
Seventeen studies of the effectiveness of RBT checkpoints were identified, of which 12 met theinclusion criteria. Eleven of the studies were conducted in Australia, and the remaining study wasconducted in France. For RBT checkpoints, the median percent changes were -22% (IQR: -35%,-14%) for fatal crashes and -16% (IQR: -20%, -11%) for fatal and nonfatal injury crashes. Thetwo RBT checkpoint studies evaluating property damage crashes estimated decreases of 15% and26%. A single study assessed the effect of RBT checkpoints on the observed incidence ofdrinking and driving. This study found that during an RBT checkpoint program, the proportion ofdrivers with any detectable BAC level decreased 13% and the proportion of drivers who wereabove the legal limit of 0.08 g/dL decreased 24% from prior levels.
Fifteen studies of the effectiveness of SBT checkpoints were identified, of which 11 met theinclusion criteria. Nine of the studies were conducted in the United States and two wereconducted in Canada. One study presented data in a form that could not be converted to oursummary effect measure. SBT checkpoints were associated with percent changes in fatal crashesof -20% and -26% in the two studies reporting this outcome. Median percent changes of -20%(IQR: -23%, -9%) were found for fatal and nonfatal injury crashes and -24% (IQR: -32%, -14%)for property damage crashes.

- 776 -
Aggregating across all crash types, median percent changes were -18% (IQR: -22%, -13%) forRBT checkpoints and -20% (IQR: -27%, -13%) for SBT checkpoints. Length of time frominitiation of the checkpoints through the follow-up period ranged from 1 to 120 months (median= 14 months) and was not related to the extent to which crashes decreased (r = -.14, p = .54).
Intervention Training Programs for Servers of Alcoholic BeveragesServer intervention training programs provide education and training to servers of alcoholicbeverages with the goal of altering their serving practices to prevent patron intoxication andalcohol-impaired driving. These practices may include offering patrons food with drinks,delaying service to rapid drinkers, refusing service to intoxicated or underage patrons, anddiscouraging intoxicated patrons from driving. In the United States, there are currently nostandards for server training programs, and their implementation varies widely in terms of thecontent covered, instructional time, and mode of delivery (e.g., face-to-face, videotaped) (7).
The literature search identified eight studies of the effectiveness of server training, five of whichmet the inclusion criteria. These studies suggest that server training programs can potentiallyaffect server behaviors, the level of intoxication of the drinkers being served, and the number oftraffic crashes. Both of the studies that evaluated server behaviors noted improvements followingserver training. Similarly, the three studies that evaluated intoxication among patrons or researchassistants acting as patrons each found that the proportion of intoxicated drinkers declinedfollowing server training (median change = -33%; range -17%, -100%). Finally, one studyevaluated the effect of a statewide 1-day mandatory server training program. Based on a timeseries analysis that adjusted for single-vehicle nighttime fatal crashes in other states, servertraining was associated with a net decrease of 23% in single-vehicle nighttime injury crashes.
Based on the findings from these five studies, the Task Force concluded that intensive, high-quality, face-to-face server training, when accompanied by strong and active managementsupport, is effective in reducing the level of intoxication in patrons. Four of the studies, however,evaluated programs that were implemented on a limited scale, in a small number of drinkingestablishments. These training programs were relatively time-intensive (longer than 4 hours),involved face-to-face training, and covered a broad curriculum including specific interventionpractices. This contrasts with training programs generally in use, which vary widely in intensity,mode of delivery, and content (7). Thus, the studies we reviewed may reflect the efficacy ofserver training under near-optimal conditions. It is not clear to what extent these findings mightgeneralize to larger-scale community-wide programs, to programs with different training methodsor content, or to programs that do not recruit well-motivated managers. Thus, further research isneeded to determine if server intervention training programs that are delivered community-wideare effective at decreasing intoxication and, ultimately, alcohol-impaired driving.

- 777 -
Table: Task Force on Community Preventive Services recommendations forcommunity-based interventions to reduce alcohol-impaired driving
Interventions to Reduce Alcohol-Impaired Driving Task Force Recommendation .08 blood alcohol concentration (BAC) laws Strongly Recommended Lower BAC laws for younger drivers Recommended Minimum legal drinking age laws Strongly Recommended Sobriety checkpoints Strongly Recommended Server intervention training programs (face-to-face instruction with management support) Recommended
DiscussionInterventions to prevent alcohol-impaired driving are implemented within the social and legalcontext of a community. Although these reviews evaluate each intervention as an independentactivity, effective prevention of impaired driving requires a comprehensive and systematicapproach that addresses various individual and ecologic influences on drinking and drivingbehavior (8-10). These reviews can help decision makers identify and implement effectiveinterventions that fit within an overall prevention strategy.
There is sufficient or strong evidence for the effectiveness of these five interventions to reducealcohol-impaired driving. However, important issues related to optimizing their efficiency andeffectiveness require further research.
General question• What effects do community-based interventions to reduce alcohol-impaired driving have on
social norms regarding drinking and driving?
Laws to reduce alcohol-impaired driving• How do variations in enforcement levels influence the effectiveness of laws to reduce
alcohol-impaired driving?• What are the independent effects of publicity on the effectiveness of these laws?• Does public compliance with new laws change over time?
Sobriety checkpoints• Do passive alcohol sensors improve the deterrent effects of sobriety checkpoints?• How do various configurations of sobriety checkpoints (e.g., intermittent blitzes vs.
continuous, weekend nights vs. random time periods, number of officers per checkpoint)affect deterrence?
• What level of enforcement and publicity is needed to maintain effectiveness over time?• Are sobriety checkpoints less effective if warning signs are posted that allow drivers to avoid
the checkpoints?
Server intervention training• Are server intervention training programs that are delivered community-wide effective at
decreasing alcohol-impaired driving and alcohol-related crashes?• What essential content areas should be included in all server intervention training programs?
- 778 -
• What effect does the method by which training is delivered (e.g., videotapes, lectures, role-playing) have on the effectiveness of server training programs?
• How do mandatory vs. voluntary server training programs differ with respect to: 1)management support for program goals; 2) level of participation in training programs; and 3)effectiveness in decreasing patron BACs and drinking and driving?
• What specific management policies and practices are necessary to get the maximumbenefits from server intervention training?
• What is the long-term effect of server intervention training programs? Are “booster sessions”required to maintain effectiveness?
• What effect does server intervention training have on alcohol sales, overall revenues, andtips?
References1. Shults RA, Elder RW, Sleet DA, Nichols JL, et al. Reviews of evidence regarding
interventions to reduce alcohol-impaired driving. Am J Prev Med 2001;21(4S):66-88.
2. Task Force on Community Preventive Services. Recommendations to reduce injuries tomotor vehicle occupants: increasing child safety seat use, increasing safety belt use, andreducing alcohol-impaired driving. Am J Prev Med 2001;21(4S):16-22.
3. Briss PA, Zaza S, Pappaioanou M, Fielding J, et al. Developing an evidence-based Guide toCommunity Preventive Services—methods. Am J Prev Med 2000;18(1S):35-43.
4. Zaza S, Carande-Kulis VG, Sleet DA, Sosin DM, et al. Methods for conducting systematicreviews of the evidence of effectiveness and economic efficiency of interventions to reduceinjuries to motor vehicle occupants. Am J Prev Med 2001;21(4S):23-30.
5. Hingson R, Heeren T, Winter M. Lowering state legal blood alcohol limits to 0.08%: theeffect on fatal motor vehicle crashes. Am J Public Health 1996;86:1297-9.
6. NHTSA. The use of sobriety checkpoints for impaired driving enforcement. Washington, DC:U.S. Department of Transportation, National Highway Traffic Safety Administration, 1990.DOT HS 807 656.
7. Toomey TL, Kilian GR, Gehan JP, Perry CL, et al. Qualitative assessment of trainingprograms for alcohol servers and establishment managers. Public Health Rep 1998;113:162-9.
8. DeJong W, Hingson R. Strategies to reduce driving under the influence of alcohol. Annu RevPublic Health 1998;19:359-78.
9. Holder HD, Saltz RF, Grube JW, Voas RB, et al. A community prevention trial to reducealcohol-involved accidental injury and death: overview. Addiction 1997;92:S155-S171.
10. Liu S, Siegel PZ, Brewer RD, Mokdad AH, et al. Prevalence of alcohol-impaired driving:results from a national self-reported survey of health behaviors. JAMA 1997;277:122-5.
- 779 -
Effectiveness of Sobriety Checkpoints forPreventing Alcohol-involved Crashes
1R.W. Elder, 1R.A. Shults, 1D.A. Sleet, 2J.L. Nichols, 3S. Zaza, and 4R.S. Thompson
1Division of Unintentional Injury Prevention, National Center for Injury Prevention and Control,Centers for Disease Control and Prevention (CDC), Atlanta, Georgia, USA;
2Office of Research and Traffic Records, National Highway Traffic Safety Administration,Washington, DC, USA;
3Division of Prevention Research and Analytic Methods, Epidemiology Program Office, CDC,Atlanta, Georgia, USA;
4Group Health Cooperative of Puget Sound, Seattle, Washington, USA.
KeywordsReview literature; motor vehicles; accidents, traffic; accident prevention; automobile driving;alcohol drinking
AbstractA systematic review of the effectiveness of sobriety checkpoints in reducing alcohol-involvedcrashes and associated injuries and fatalities was conducted using the methodology developed forthe Guide to Community Preventive Services. Results suggest that both RBT and SBTcheckpoints can play an important role in preventing alcohol-related crashes and associatedinjuries. This paper is based on research previously published in the American Journal ofPreventive Medicine (1).
IntroductionSobriety checkpoints have become a popular tool for enforcing laws against alcohol-impaireddriving, and procedures for conducting them vary in different countries. At random breath testing(RBT) checkpoints, which are used in Australia and several European countries, all driversstopped are given breath tests for blood alcohol levels. Issues regarding the violation ofconstitutional protections against unreasonable search and seizure prevent the use of RBTcheckpoints in the United States (2), where selective breath testing (SBT) checkpoints are used.At SBT checkpoints, police must have reason to suspect the driver has been drinking (i.e.,probable cause) before they can demand that a driver take a breath test.
Although sobriety checkpoints remove some drinking drivers from the road, their primary goal isto deter driving after drinking by increasing the perceived risk of arrest. This perceived risk canbe influenced by the level of publicity accompanying the enforcement effort, visibility of thecheckpoint operations themselves, drivers’ beliefs about their ability to avoid detection, and theobjective likelihood of detection (3).
- 780 -
In this review, we estimate the overall effectiveness of sobriety checkpoints. We also examinetheir long-term effects and the relative effectiveness of RBT and SBT checkpoints.
MethodsThis systematic review of studies of sobriety checkpoints was conducted for the Guide toCommunity Preventive Services (Community Guide). Detailed methods have been describedelsewhere (4, 5).
A comprehensive search was conducted for peer-reviewed journal articles, technical reports, andAssociation for the Advancement of Automobile Medicine proceedings to screen for inclusion inthe review. To be included, a study had to: (a) be primary research published in English beforeJune 30, 2000; (b) provide objective data on one or more outcomes related to alcohol-impaireddriving (e.g., single-vehicle nighttime crashes); and (c) meet minimum research quality criteria.When multiple papers used similar methods to evaluate a specific intervention, only the paperwith the longest post-intervention follow-up time was included in the review.
When available, we selected effect measures that compared alcohol-related crash outcomes tonon-alcohol-related outcomes (e.g., comparing single vehicle nighttime crashes to multi-vehicledaytime crashes). These effect measures help control for the long-term downward trend in totalcrashes and for other factors that influence the total number of crashes, such as safetycharacteristics of vehicles and highways, weather, economic conditions, and vehicle milestraveled. To further address potential confounding, when possible we also selected effectmeasures that incorporated a concurrent comparison group such as drivers in communitieswithout checkpoints. For studies incorporating comparison groups, results are reported in theform of the net change, reflecting the difference between the percent change for the interventiongroup and the comparison group. For studies using interrupted time series or other regression-based designs, results are reported in terms of the percent change estimated from the model. Inaddition to reporting results from individual studies, we calculated medians and interquartileranges to summarize outcomes for the three levels of injury severity. We also aggregated resultsacross levels of injury severity to evaluate whether the intervention's effect varied by the type ofcheckpoint (RBT vs. SBT) or by follow-up time.
ResultsThe literature search identified 17 studies of the effectiveness of RBT checkpoints that evaluatedoutcomes of interest. Of these, 12 met the quality criteria for inclusion in this review (three ofthese studies were reported in one paper) (6 – 15). For RBT checkpoints, median decreases were22% (interquartile range (IQR): -35%, -14%) for fatal crashes and 16% (IQR: -20%, -11%) forfatal and nonfatal injury crashes. The two RBT checkpoint studies evaluating property damagecrashes estimated decreases of 15% and 26%.
A single study assessed the effect of RBT checkpoints on the observed incidence of drinking anddriving. This study found that during an RBT checkpoint program, the proportion of drivers withany detectable BAC level decreased 13% and the proportion of drivers who were above the legallimit of 0.08 g/dL decreased 24% from prior levels (13).

- 781 -
Our search identified 15 studies of the effectiveness of SBT checkpoints. Of these, 11 met thequality criteria for inclusion in this review (16 – 26). One of these studies presented data in aform that could not be converted to our summary effect measure (26). SBT checkpoints wereassociated with decreases in fatal crashes of 20% and 26% in the two studies reporting thisoutcome. Median decreases were 20% (IQR: -23%, -9%) for fatal and nonfatal injury crashes and24% (IQR: -32%, -14%) for property damage crashes.
Outcomes from the studies reviewed are presented in the Figure. Aggregating across all crashtypes, median decreases were 18% (IQR: -22%, -13%) for RBT checkpoints and 20% (IQR:-27%, -13%) for SBT checkpoints. Length of time from initiation of the checkpoint program tothe end of follow-up ranged from 1 to 120 months (median = 14 months; IQR: 10 months, 42months), and was not related to the extent to which crashes decreased (r = -.14, p = .54).
Figure: Percent change in crashes likely to involve alcohol after implementing RBT andSBT checkpoint programs
-40 -30 -20 -10 0
Net Percent Change in Crashe
Fatal crash Injury crash Other crash
Median = -20%
Castle, 95
Lacey, 99
Lacey, 86Levy, 90
Voas, 85
Stuster, 95
Mercer, 85
Wells, 92Jones, 95
Mercer, 96
Homel, 88Hardes, 85
Ross, 81
Cameron, 97
Henstridge, 97
Armour, 85
Cameron, 92
McLean, 84Arthurson, 85
Henstridge, 97Henstridge, 97
Median = -18%
RB
T C
heckp
oin
tsS
BT
Ch
eckpo
ints
DiscussionThese results provide strong evidence that both RBT and SBT sobriety checkpoints are effectivein reducing alcohol-related crashes and associated fatal and nonfatal injuries. The greatersensitivity of RBT checkpoints in detecting drinking drivers might lead one to expect a strongerdeterrent effect leading to improved effectiveness in reducing alcohol-related crashes relative toSBT checkpoints (12). The results of this review did not provide evidence of such differential
- 782 -
effectiveness. None of the studies reviewed directly compared RBT and SBT checkpoints,however, so these results should be interpreted cautiously.
Despite differences across studies in design, setting, period of observation, and outcomemeasures evaluated, the results were generally consistent in direction and size. The consistency ofthe results obtained was further supported by stratified analyses, in which similar beneficialeffects were obtained for crashes of varying levels of severity and for both short-term and long-term checkpoint programs.
The results of this review suggest that sobriety checkpoints maintain their effectiveness overtime. Some authors have suggested that aggressive enforcement using sobriety checkpoints couldeventually result in permanent changes in social norms regarding the acceptability of drinkingand driving (3, 27). The degree to which changes in social norms have contributed to the long-term maintenance of the beneficial effects of sobriety checkpoints is unclear.
Several questions remain regarding potential methods for improving the effectiveness andefficiency of sobriety checkpoints. For instance, although passive alcohol sensors have beenshown to improve the detection of alcohol-impaired drivers at checkpoints (24, 28), any resultingimprovement in the deterrent effects of checkpoints has yet to be evaluated. Further research intothe optimal configurations of checkpoints (e.g., number of officers, timing) and the optimaloverall level of enforcement and publicity to sustain their deterrent effects is needed.
References1. Shults RA, Elder RW, Sleet DA, Nichols JL, et al. Reviews of evidence regarding
interventions to reduce alcohol-impaired driving. Am J Prev Med 2001;21(4S):66-88.
2. NHTSA. The use of sobriety checkpoints for impaired driving enforcement. NationalHighway Traffic Safety Administration, Washington (DC) 1990, DOT HS 807 656.
3. Ross HL. The deterrent capability of sobriety checkpoints: Summary of the Americanliterature. National Highway Traffic Safety Administration, Washington (DC) 1992, DOT HS807 862.
4. Briss PA, Zaza S, Pappaioanou M, Fielding J, et al. Developing an evidence-based Guide toCommunity Preventive Services -- methods. Am J Prev Med 2000;18(1S):35-43.
5. Zaza S, Carande-Kulis VG, Sleet DA, Sosin DM, et al. Methods for conducting systematicreviews of the evidence of effectiveness and economic efficiency of interventions to reduceinjuries to motor vehicle occupants. Am J Prev Med 2001;21(4S):23-30.
6. Armour M, Monk K, South D, Chomiak G. Evaluation of the 1983 Melbourne random breathtesting campaign: interim report, casualty accident analysis. Victoria Road Traffic Authority,Melbourne 1985. N8-85.
7. Arthurson RM. Evaluation of random breath testing. Traffic Authority of New South Wales,Sydney 1985. RN 10/85.
- 783 -
8. Cameron MH, Cavallo A, Sullivan G. Evaluation of the random breath testing initiative inVictoria, 1989-1991: Multivariate time series approach. Monash University AccidentResearch Centre, Melbourne 1992. Report 38.
9. Cameron M, Diamantopolou K, Mullan N, Dyte D, et al. Evaluation of the country randombreath testing and publicity program in Victoria, 1993-1994. Monash University AccidentResearch Center, Melbourne 1997. Report 126.
10. Hardes G, Gibberd RW, Lam P, Callcott R, et al. Effects of random breath testing on hospitaladmissions of traffic-accident casualties in the Hunter Health Region. Med J Aust1985;142:625-6.
11. Henstridge J, Homel R, Mackay P. The long-term effects of random breath testing in fourAustralian states: a time series analysis. Federal Office of Road Safety, Canberra 1997. CR162.
12. Homel R, Carseldine D, Kearns I. Drink-driving countermeasures in Australia. Alcohol,Drugs and Driving 1988;4:113-44.
13. McCaul KA, McLean AJ. Publicity, police resources and the effectiveness of random breathtesting. Med J Aust 1990;152:284-6.
14. McLean AJ, Clark MS, Dorsch MM, Holubowycz OT, et al. Random breath testing in SouthAustralia: effects on drink-driving. NHMRC Road Accident Research Unit, University ofAdelaide, Adelaide 1984. HS 038 357.
15. Ross HL, McCleary R, Epperlein T. Deterrence of drinking and driving in France: anevaluation of the law of July 12, 1978. Law and Society Review 1981;16:345-74.
16. Castle SP, Thompson JD, Spataro JA, Sewell CM, et al. Early evaluation of a statewidesobriety checkpoint program. 39th annual proceedings of the Association for theAdvancement of Automotive Medicine, October 16-18, 1995, Chicago, IL, pp 65-78.
17. Jones R, Joksch H, Lacey J, Wiliszowski C, et al. Site report: Wichita, Kansas field test ofcombined speed, alcohol, and safety belt enforcement strategies. National Highway TrafficSafety Administration, Washington (DC) 1995. DOT HS 808 244.
18. Lacey JH, Stewart JR, Marchetti LM, Popkin CK, et al. Enforcement and public informationstrategies for DWI (driving-while-intoxicated) general deterrence: ARREST DRUNKDRIVING - the Clearwater and Largo, Florida experience. University of North CarolinaHighway Safety Research Center, Chapel Hill, NC 1986.
19. Lacey JH, Jones RK, Smith RG. Evaluation of checkpoint Tennessee: Tennessee's statewidesobriety checkpoint program. National Highway Traffic Safety Administration, Washington(DC) 1999. DOT HS 808 841.
20. Levy DT, Asch P, Shea D. An assessment of county programs to reduce driving whileintoxicated. Health Educ Res 1990;5:247-56.
- 784 -
21. Mercer GW. The relationships among driving while impaired charges, police drinking-driving roadcheck activity, media coverage and alcohol-related casualty traffic accidents.Accid Anal Prev 1985;17:467-74.
22. Mercer GW, Cooper PJ, Kristiansen LA. A cost/benefit analysis of a 5-month intensivealcohol-impaired driving road check campaign. 40th annual proceedings of the Associationfor the Advancement of Automotive Medicine, Vancouver, British Columbia, Oct. 7-9, 1996,pp 283-292.
23. Stuster JW, Blowers PA. Experimental evaluation of sobriety checkpoint programs. NationalHighway Traffic Safety Administration, Washington (DC) 1995. DOT HS 808 287.
24. Voas RB, Rhodenizer E, Lynn C. Evaluation of Charlottesville checkpoint operation: Finalreport, December 30, 1983 to December 31, 1984. National Highway Traffic SafetyAdministration, Washington (DC) 1985. DOT DTNH 22-83-C-05088.
25. Wells JK, Preusser DF, Williams AF. Enforcing alcohol-impaired driving and seat belt uselaws, Binghamton, NY. Journal of Safety Research 1992;23:63-71.
26. Voas RB, Holder HD, Gruenewald PJ. The effect of drinking and driving interventions onalcohol-involved traffic crashes within a comprehensive community trial. Addiction1997;92:S221-S236.
27. Homel R. Random breath testing and random stopping programs in Australia. In: Wilson RJ,Mann RE, editors, Drinking and Driving: Advances in Research and Prevention. GuilfordPress, New York, 1990:159-202.
28. Lund AK, Jones IS. Detection of impaired drivers with a passive alcohol sensor. In: Noordzij,P.C. and Roszbach, R. editors, Alcohol, Drugs and Traffic Safety, Proceedings of the 10th
International Conference, Amsterdam, The Netherlands, 1987, pp 379-382.
- 785 -
The Educational Measure Alcohol and Traffic
Jaap W. van der Hulst
Department of Criminal Law, Erasmus University Rotterdam, The Netherlands
KeywordsAlcohol, Educational Measure, Prevention of drunken driving
AbstractThis article deals with preliminary results of the effects of the educational measure alcohol andtraffic on drunken driving in the Netherlands. It appears that this measure has a number ofinteresting positive effects on the prevention of drunken driving and therefore on traffic safety as awhole. It seems worthwhile to continue the implementation of this measure instead of and/or nextto criminal sanctions.
IntroductionAs in many other modern countries the excessive abuse of alcohol in traffic in the Netherlands is anextensive social problem. About 15% of the serious traffic accidents are directly linked to drunkendriving. The traditional criminal sanctions -like short term imprisonment, fines and temporarywithdrawal of the driving license- that are usually imposed are not very effective in terms ofprevention or deterrence. Therefore, in recent years a new approach has emerged in the Dutchpolicy towards drunken driving. The most significant instrument in this approach is the so-callededucational measure alcohol and traffic. This instrument has been largely implemented in theNetherlands since September 1996. The main goal of this measure is to create an insight andawareness in the causes of drunken driving and to learn alternative behavioural strategies todiminish the chance of drunken driving in the future.
This educational measure is an administrative sanction that only can be imposed on authority of theDutch Ministry of Traffic. The use of this authority is not limited by any criminal sanction imposedfor the same offence: the 'ne bis in idem-rule' does not apply (no double jeopardy)(1). Theimplementation of this measure is in the hands of institutions for addiction health care. Themeasure can be imposed on drivers:- that had a blood alcohol level between 1,3 and 1,8;- that had a blood alcohol level above 1,8 only after psychiatric evaluation;- that are recidivists: in a period of five years on two or more occasions they have had a blood
alcohol level above 0,5 (the minimum illegal level in the Netherlands) and on one of thoseoccasions a level above 0,8;
- 786 -
This measure is generally not implemented in cases of drunken driving that led to a serious trafficaccident, when the driver has serious psychiatric problems, the driver is not able to speak Dutchand the driver already had concluded this measure within the last five years.
The measure itself consists of a three-day training and education programme and a fourth day inwhich the measure is closed by means of an individual evaluation. In the three days the mainsubjects of training and education are: the use of alcohol in the Netherlands, alcohol and the abilityto drive, consequences of drunken driving on (the lack of) traffic safety, alcohol and justice, useand abuse of alcohol and prevention of drunken driving. After a sufficient conclusion of thismeasure the drivers’ license is returned.
This measure has to be concluded in twelve weeks after the day the drunken driving was detected.The costs of the implementation of this measure are partly born by the State but the drunken driverhas to pay for the majority of the direct costs involved: he has to pay a fee of about 200 US Dollars.Refusal to conclude this measure as well as refusal to pay the required fee leads to the permanentwithdrawal of the drivers’ license.
MethodsDue to the recent implementation of this measure only short term and mid-long evaluation has beenpossible until now. The results of this evaluation have been gathered in a comprehensive researchby the investigation bureau called Traffic Test(2). This evaluation basically has been founded onthe method of a quasi-experimental investigation design. This meant that two groups of drunkendrivers were investigated: the experimental group of drunken drivers that did participate in andconcluded the educational measure and a control-group of drunken drivers that were detected andconvicted but did not participate in the educational measure.
Members of the experimental groups received a questionnaire two weeks before the start of theimplementation of the educational measure and five weeks after the conclusion of this measure.This implies that between the first and the second questionnaire a period of about two monthselapsed. In the same period also the members of the control group received the two questionnaireswith the same set of questions. Beside, separate in-depths interviews were held with both membersof the experimental group and the control group that responded to the two questionnaires. Thepurpose of these interviews was to collect additional and anektodical information concerning theirresponse.
The first questionnaire was send to 382 persons in the experimental group of which 221 returnedthe questionnaire in good order. The second questionnaire was send to these 221 persons of which77 returned the questionnaire in good order. The final response was therefore just above 20%.The first questionnaire was also send to 732 persons in the control group of which 165 returned thequestionnaire in good order. The second questionnaire was send to these 165 persons of which 93returned the questionnaire in good order. The final response for this group was therefore about13%.
The reason for these low response percentages is not quite clear, as there was no opportunity for anon-response investigation. The fact that the second questionnaire was received more than onemonth after the conclusion of the educational measure could explain the poor response in theexperimental group. But then the low response in the control group still remains unexplained. From
- 787 -
reactions during the interviews another probable explanation can be derived: the length of bothquestionnaires was perceived as 'quite long'. Apparently this perception was not compensated bythe fact that the persons that returned both the questionnaires in good order were rewarded with aten US Dollars reward.
Before the evaluation the relevant background information - like age, sexe, the date of detection,the blood alcohol level and prior detection of drunken driving - of both the persons in theexperimental and the control group was completely available. During the evaluation comparisonbetween the response and non-response in both groups appeared not to be 100%-possible for all therelevant background information-features. Moreover, this comparison was not helped by the fact ofthe different response percentages to the two questionnaires. Given these obstacles, it appeared thatthe persons in the response group were older and that the period between detection of the drunkendriving and the response is relatively short(er). Also, in the control group there was a betterresponse of females.
This all adds up to the conclusion that the results of this evaluation have to be interpreted withmoderation.
ResultsThere is a considerable positive effect on the level of knowledge on issues concerning drunkendriving in the experimental group after conclusion of the educational measure. Both the participantsand the educators in this measure consider this increase in knowledge as an important learningexperience.
There is a slight positive effect on the social behaviour in risks situation that could lead to drunkendriving in the experimental group. After conclusion of this measure the participants seem to have abetter social understanding and coping behaviour in risk situations such as parties and businessmeetings with drinking clients.
There is a positive effect on the social behaviour towards other persons in risk situations that couldlead to drunken driving in the experimental group. After conclusion of this measure the participantsseem to take more initiative to make agreements with other persons to prevent themselves fromdrunken driving: they are more willing to leave the car at home, be driven home by others and theymake more use of public means of transport.
The fact that drunken driving can lead to this measure is experienced as very annoying by theexperimental group and thus in itself seems to have a preventive effect on drunken driving.
It appears that this measure has no influence on more structural social-emotional features, likepersonality, level of responsibility and internal attribution. These are, however, important learninggoals of the measure.
Nor does the conclusion of this measure have any effect on the perception of the chance of beingdetected by the police for drunken driving (the next time) in the experimental group.
Although the period of this evaluation has been too short for a long-term investigation in therecidivist behaviour of the experimental group, there are signs that lead to the provisional
- 788 -
conclusion that in fact drunken driving in the experimental group has diminished considerably afterconclusion of the measure.
DiscussionComparing these results with the general lack of positive results in the control group, the overallconclusion should be that the educational measure alcohol and traffic seems worthwhile in itselfand also in addition to the criminal sanctions imposed on drunken driving. This conclusion is in linewith educational interventions in other countries(3). Beside, the financial costs and required timefor both State authorities and participants seem acceptable. Also, when this measure is used insteadof criminal sanctions there is the obvious positive effect on the criminal justice system: lessdrunken drivers will have to be tried in (usually costly and traumatising) criminal proceedings.Moreover, the long-term effect of the implementation of criminal sanctions on drunken drivingappear to be quite moderate in terms of prevention and deterrence. Therefore, the alternativeapproach of the educational measure should be given credit, although future long-term research tothe effects of this measure remains necessary.
References1. European Court of Justice 7 November 2000, case of Blokker v the Netherlands.
2. Behavioral effects of the educational measure alcohol and traffic, Veenendaal, 2000.
3. See for Germany: Birnbaum D, Biehl B, Sage E, Scheffel B. Evalution des Nachschulungskurs'Mainz-77', 1999, and for the USA and Canada: Peck RC, Sadler DD, Perrine MW. Thecomparative effectiveness of alcohol rehabilitation and licensing control action for drunkdriving offenders: a review of the literature, Alcohol, Drugs and Driving, 1, pp 15-39.
- 789 -
The Educational Measure Alcohol and Traffic (EMA)
1J.A.M.M. Vissers and 2R.J. van Beekum
1Traffic Test BV, Veenendaal, The Netherlands,2Driver Rehabilitation Department, Dutch Driving Test Organisation CBR,
Rijswijk, The Netherlands.
KeywordsDriving under influence, rehabilitation, legal framework.
AbstractIn 1996 in the Netherlands a new course model was introduced to reduce the problem of drunkdriving: the Educational Measure Alcohol and traffic (EMA). Anyone apprehended while drivingwith a blood-alcohol-concentration (BAC) of between 1.3 and 1.8 per mille qualifies him- orherself for a three day educational course followed by an individual evaluation. By using a socalled quasi-experimental design in which an experimental group of course participants wascompared with a control group of non-participants the effects of the EMA were studied.
IntroductionThe Educational Measure Alcohol and traffic (EMA) was introduced in 1996 and is imposedwithin the framework of administrative law. The legal procedure starts with the assumption that aholder of a driving licence doesn’t meet the standards of driving anymore. Generally thisinformation is gained by police-officers, because they observe deviant traffic behaviour (in thiscase drunk driving). The police inform the Minister of Transport (actually it is the Dutch DrivingTest Organisation CBR because the Minister delegated this task to the CBR) about theassumption. Based on this assumption and depending on the criteria a decision will be made.Either a person has to go to a medical test or to a rehabilitation program.
The main criteria for the imposition of the EMA are the following:• The driver has been apprehended with a blood-alcohol-concentration between 1.3 and 1.8 per
mille.• Within a period of 5 years the driver has twice been apprehended with a blood-alcohol-
concentration higher than 0.8 per mille.• Anyone apprehended with a blood-alcohol-concentration higher then 1.8 per mille has to
participate in a medical test. If a person succeeds this medical examination he still has tofollow the rehabilitation program because of his lack of attitude towards drinking and driving.
• If a person refuses the breath-analysis.
The EMA-courses are organised by didactically skilled workers of the Centres for Alcohol andDrugs. The course leaders are usually group-workers or health education-workers and specially

- 790 -
trained in working with people who have a problem on alcohol. Qualification criteria for courseleaders are: degree in behavioural sciences as psychology, adult education, pedagogics andhealth education or specially trained in health and social studies.
The EMA-program aims at increasing relevant knowledge regarding the risks of alcohol in motortraffic. The legal consequences are discussed as well as the influence of alcohol on the ability todrive a car. Apart from increasing knowledge, the program also aims at influencing attitudestowards the combination of drinking and driving. It tries to convince the participants that otherthan even a modest alcohol consumption before driving should be considered as irresponsiblebehaviour. It also tries to raise the participants consciousness of his pattern of alcoholconsumption, also in combination with high risk social situations and alternatives in such highrisk situations.
The EMA-course counts three course-days spread over a three week period. The EMA isconcluded with an individual interview between course-leader and each participant. Aftercompleting the interview the participants receive a certificate for following the EMA.On a yearly basis about 8,000 DWI-drivers are referred to the EMA. This means about 800courses are performed each year.
The EMA-program is partly based on the theory of Fischbein and Azjen reasoned action model.The most important elements for changing the DWI-behaviour are:• Increase of knowledge: having enough knowledge about facts concerning driving and
drinking is one of the main conditions to be able to change this behaviour.• Influencing the positive and negative outcome expectations: these expectations are calculated,
such as the chance to be caught, taking the risk of an accident etc.• Social influence: it is important to take into account the influence of significant others (for
example partners, friends, colleagues, relatives) on the decision whether to drive afterdrinking or not.
• Personal effectiveness: this is a personal estimation on the ability to perform the adequatebehaviour in certain circumstances (for example someone is able to resist social pressurewhen it comes to refusing alcohol, or someone is depending on alcohol).
• Habitual behaviour: when it comes to this kind of behaviour the person is not aware of thisbehaviour. When performing habitual behaviour people do not anticipate any longer on theoutcome of this behaviour (whether the outcome is positive or negative). So the person is alsonot aware of the risks that come by conducting this behaviour. For example when drinkingand driving have become habitual behaviour you are not aware of the fact that you areconducting behaviour with a high risk. This is influenced by personal positive outcomeexperiences while performing this habit; never been caught by the police or never havingcaused an accident.
Another important theory that is used in the EMA is the ‘circle of change’ of Prochaska andDiClemente. For the trainer it is very important to find out in which stage of change the courseparticipant is situated: for instance is he still in the stage of preview or has he already made adecision for himself to separate his drinking and driving.
- 791 -
MethodsThe experimental design of the evaluation study was a so called quasi-experimental design inwhich an experimental group of course participants was compared with a control group of non-participants. The control group was also arrested for driving under the influence, but their BAC’swere just below the criteria for the EMA. So these offenders could not be obliged to attend theEMA. In most cases the control group had to pay a fine and were confronted with a temporarydriving ban.
A total of 382 course participants were asked to take part in the research. Of them 221 persons(58%) filled in de prestest and 77 persons of this group filled in the posttest as well (20%).In the control group 732 persons were asked to take part in the research. Of them 165 personsreturned the questionnaire of the pretest (23%) and 93 persons of this group also returned theposttest (13%).
Respondents of the experimental and control group do not differ much on most demographicvariables. Only age (higher in the control group) and employment (a higher percentage in theexperimental group has a job) do differ between groups. On several traffic related variables thegroups do differ. Car use is higher in the experimental group (more daily use of the car and morekilometres driven). In this group dependence on the car is also higher. Furthermore the BAC inthe experimental group is somewhat higher than in the control group. This is of course aconsequence of the fact that the respondents of the control group do not meet the criteria forreferral the EMA. In the experimental group respondents had been arrested for DWI morefrequently than in de control group.
In the statistical analyses the differences between experimental and control group are controlledfor by matching both groups on the variables DWI-recidivism and car use. After matching thegroups on those variables most differences in the other variables (age, mileage, dependence onthe car) disappear.
Results
Increase in knowledgeThe experimental group scores significantly better on knowledge about alcohol and DWI in theposttest than the control group. In this case the EMA has a strong learning effect (see Figure 1).
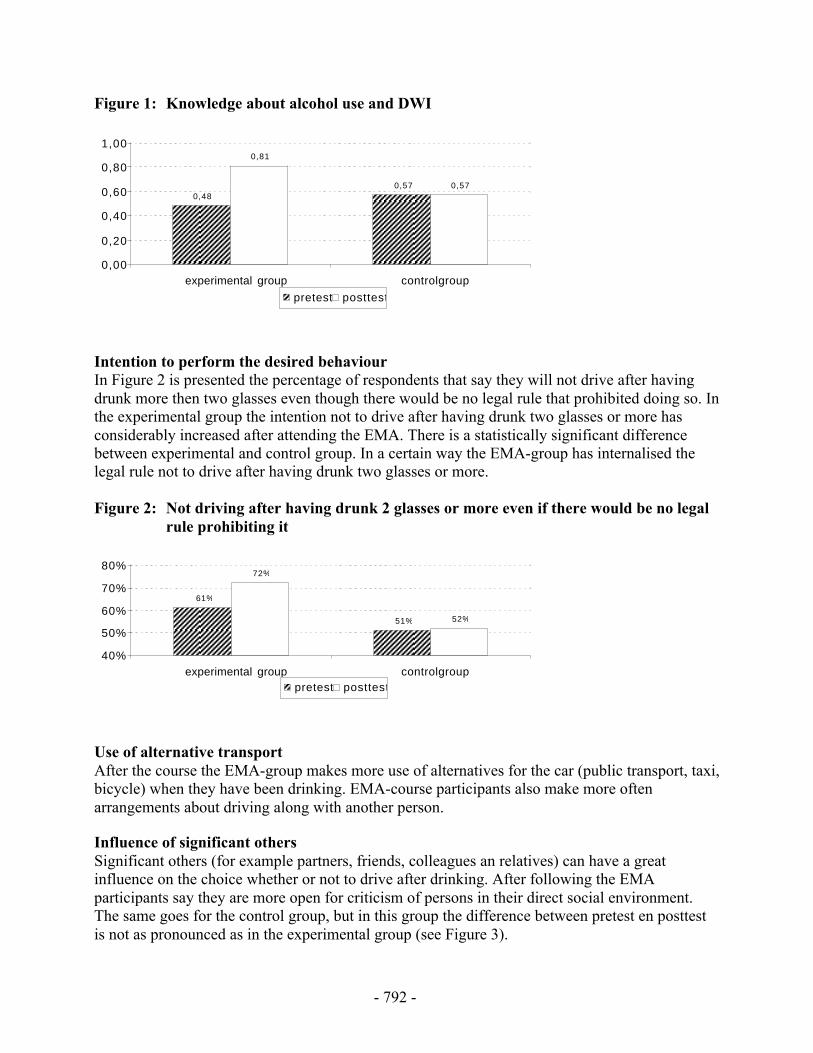
- 792 -
Figure 1: Knowledge about alcohol use and DWI
0,480,57
0,81
0,57
0,00
0,20
0,40
0,60
0,80
1,00
experimental group controlgroup
pretest posttest
Intention to perform the desired behaviourIn Figure 2 is presented the percentage of respondents that say they will not drive after havingdrunk more then two glasses even though there would be no legal rule that prohibited doing so. Inthe experimental group the intention not to drive after having drunk two glasses or more hasconsiderably increased after attending the EMA. There is a statistically significant differencebetween experimental and control group. In a certain way the EMA-group has internalised thelegal rule not to drive after having drunk two glasses or more.
Figure 2: Not driving after having drunk 2 glasses or more even if there would be no legalrule prohibiting it
61%
51%
72%
52%
40%
50%
60%
70%
80%
experimental group controlgrouppretest posttest
Use of alternative transportAfter the course the EMA-group makes more use of alternatives for the car (public transport, taxi,bicycle) when they have been drinking. EMA-course participants also make more oftenarrangements about driving along with another person.
Influence of significant othersSignificant others (for example partners, friends, colleagues an relatives) can have a greatinfluence on the choice whether or not to drive after drinking. After following the EMAparticipants say they are more open for criticism of persons in their direct social environment.The same goes for the control group, but in this group the difference between pretest en posttestis not as pronounced as in the experimental group (see Figure 3).

- 793 -
Figure 3: Influence of criticism of significant others on DWI
29%
41%
54% 52%
10%
20%
30%
40%
50%
60%
experimental group controlgrouppretest posttest
Self reported recidivismIn Figure 4 for both experimental and control group the percentage of persons is presented thatsay they have driven while under the influence of alcohol (two glasses or more). In both groupswe can see a slight decrease in DWI. The percentages in the experimental group being somewhatsmaller (pretest as well as posttest) than in the control group. In the experimental group therecidivism rate is diminished by 50% (a decrease of 6 percentage points). The differences arehowever statistically not significant. We should notice that the period over which recidivism isreported by the respondents is very short (about three months between pretest and posttest). For agood insight into the recidivism rate both groups must be followed for at least a year or two andbeside self report data also data of police registration should be taken into account.
Figure 4: Self reported recidivism of DWI
12%
18%
6%
12%
0%
10%
20%
experimental group controlgrouppretest posttest
Motivation, internal control, problem awareness and self-condemnationRespondents were (in both pretest en posttest situation) asked to what extent:• they are motivated not to drive a car after having been drinking (motivation);• they think they have control over themselves as to not go driving after drinking (internal
control);• they are aware of the fact that DWI is a personal and social problem (problem awareness);• they disapprove of their own DWI behaviour (self-condemnation).
Both groups do not differ on any of the four aspects in a statistically significant way. When thereis an increase between pretest en posttest situation, there is an increase in both groups. Thereforethe EMA does not seem to have an effect on any of the four aspects.

- 794 -
Although the experimental group scores significantly better on the motivation factor, this is not aresult of the EMA-course. It is rather a result of the fact that the respondents are confronted witha legal procedure that eventually can end with losing the driving licence.
Social pressureFigure 5 shows that the capability to cope with social pressure is slightly better in theexperimental group after following the EMA. In the control group we see exactly the opposite: aslight decrease. In this case the difference is statistically significant. In other words the EMAhelps participants to better cope with social pressure.
Figure 5: Coping with social pressure
0,53
0,37
0,60
0,27
0,20
0,30
0,40
0,50
0,60
0,70
experimental group controlgrouppretest posttest
Perceived consequences of new arrestThe experimental group thinks the consequences of being arrested again for DWI are moreserious than the control group does. This is already the case in the pretest situation and althoughit is slightly increased in the posttest situation, it is more an effect of the threat of the legalprocedure than an effect of the EMA.
DiscussionThe EMA is imposed as part of a legal procedure that in the end can lead to an invalidation of thedriving licence. Confrontation with this legal procedure is experienced by offenders as verydrastic. Motivation to refrain from DWI is therefore much greater in this group than in the controlgroup that is only confronted with a fine and a temporary driving ban. Also the motivation not tocombine drinking and driving is more pronounced in the experimental group than in the controlgroup. This is mainly due to the panic reaction that the legal procedure provokes.
Beside these “shock effects” of the legal procedure the EMA on its own brings about thefollowing positive changes in course participants:• After attending the EMA knowledge about facts concerning drinking and driving increases
considerably.• The EMA has a positive influence towards the use of the social environment to control the
drinking and driving behaviour of course participants.• The EMA increases the capability to resist social pressure.• The EMA stimulates the use of alternative ways of transport after drinking.
- 795 -
In certain aspects though the EMA is not effective:• The EMA seems to have no significant influence on a number of social-affective factors such
as problem awareness, awareness of guilt, sense of responsibility and internal attribution.• The EMA seems to have no influence on the perceived chance of being caught again for
DWI.• The EMA not yet leads to a significant reduction in recidivism of DWI.
Given the results of the evaluation study and based on the fact that a growing number of courseparticipants are being close to a problem drinker, the EMA-program has been rearranged. In thenew program, which has recently been introduced, transfer of information is much less importantand more emphasis is laid on techniques to motivate course participants to separate drinking anddriving. The individual interview with course participants at the end of the EMA has beenreplaced by an interview at the start of the course. Like in the old situation the interview isperformed by the course leader, but it now has the character of an admission interview. It ismeant to motivate the DWI-driver to participate in a constructive way and to reduce his resistanceagainst the EMA-course and the course leader.
Beside these adaptations of the course also a quality system was introduced. In this system thequality of the realisation of the EMA itself (are all parts of the course performed in the prescribedway) and of the performance of the course leader are monitored on a continuous basis.Information is collected by written questionnaires that are filled in by participants as well as bycourse leaders. The function of the quality system is threefold:• signalising shortcomings in the EMA-program;• signalising common shortcomings of course leaders;• signalising individual shortcomings of course leaders.
On the basis of the quality system defects can be discovered in an early stage and correctivemeasures can be taken. Hopefully hereby the effectiveness of the EMA can be increased.
ReferencesNägele RC, Vissers JAMM. Gedragseffecten van de EMA. Een evaluatieonderzoek naar de leer-en de gedragseffecten op de middellange termijn van de Educatieve Maatregel Alcohol enverkeer. Traffic Test, Veenendaal, 2000.
Vissers JAMM, van ’t Hoff JP. Effecten van de EMA. Een evaluatieonderzoek naar deleereffecten van de Educatieve Maatregel Alcohol en verkeer. Traffic Test, Veenendaal, 1998.

- 796 -
- 797 -
Bob in Belgium:Preventing and Deterring Drink Driving
M. Scheers, M. Drevet
Behaviour and Policy Department,Belgian Institute for Road Safety, Brussels, Belgium
AbstractSince 1987, the Belgian police forces and the Belgian Road Safety Institute (BRSI) have beenjoining efforts in organising the year-end campaigns to prevent drink driving. The main objectiveis to reduce the number of alcohol-related accidents by deterring and preventing drink driving. In1995 Bob, the person who does not drink when he has to drive, was introduced. Right from thestart, this prevention campaign has been a real success. Evaluation based on a comparative studyof the alcohol-related accidents and on the breath tests carried out by the police, shows that theproblem of drink driving is still present: the number of positive breath tests and the number ofaccidents are increasing. The main cause of this evolution is the fact that the number of repressiveactions (breath tests) seriously decreased. The number of impaired drivers during the year-endcampaign is lower than during the rest of the year. This confirms the statement that thecombination of repression and prevention is more effective than prevention (or repression) on itsown.
IntroductionIn Europe, in-depth studies reveal that alcohol is implicated in 19% of injury accidents and in22% of serious accidents (1).
In Belgium in 2000, 8.5% of all injury accidents were alcohol-related. Alcohol was implicated in10.2% of all serious accidents (accidents with death or serious injury). 23.8% of these accidentshappen during weekend-nights, 18.5 % during week nights (2).
In 1996, The Belgian Toxicology and Trauma (3) study reveals that 28% of people arriving at theemergency service after an injury accident have an alcohol rate higher than the legal limit. Duringthe weekend nights, this percentage reaches 50%.
In 1987, collaboration was set up between the Belgian police forces and the Belgian Institute forRoad Safety (BRSI), in order to prevent drink driving during the year-end period (from the 1st ofDecember till the 15th of January). This collaboration includes two parts: the first one consists ofa prevention campaign, the second part consists of reinforced repressive actions (breath testing).In 1995 Bob, the person who does not drink when he has to drive, was introduced in Belgium. Atthe same moment the legal alcohol limit was brought back from 0,8 ‰ to 0,5 ‰.

- 798 -
ObjectivesThe main objective of the campaign is to reduce the number of alcohol-related accidents bydeterring and preventing drink driving. The strategy to attain this target is based on the principlethat repression and prevention should go hand in hand.
Bob is presented as a person with a very positive image. In fact, Bob is someone positive,friendly, self-confident, who takes initiatives and has a sense of humour. He is widely appreciatedbecause he drives without having drunk and his friends can count on him to bring them homesafely.
Each year, this concept is supported by posters (see below), spots on TV and radio, Bob’s website(www.Bob.be) and the ‘horeca’ campaign (in bars and cafés). Concerning the horeca campaign,the Arnoldus Group, the Confederation of Belgian brewers, is the partner of the BSRI since thecreation of the Bob concept. More than 9000 cafés are actively implicated in the year-endcampaign. They put Bob-posters on the walls, the Bobs of the evening can have Bob-key rings,tee shirts, balloons and other Bob-gadgets. This material reminds their customers that drinkingand driving do not go together. The public transport companies are joining the year-end campaignas well: more busses and metros are driving during the night of 31 December. Price reductionsand free tickets have to stimulate people to use the public transport facilities.
But the presence of Bob is not limited to the year-end period. The Bob bus is present at differentmusic festivals and at every other big event all over the year. Each summer, Bob-games, quizzesor other activities are organised in touristic areas.
The main objectives of the Bob campaigns are:- insisting on the fact that drinking and driving do not mix;- to make drink driving socially unacceptable and- to encourage people who are going out to choose their Bob.
The baseline “It’s party time when Bob drives” remained unchanged. The Bob concept hasevolved. Firstly, people had to know who Bob is (1995/1996 ; 1996/1997), afterwards theirattitude toward drink driving had to be changed (1997/1998 ; 1998/1999 ; 1999/2000). The latestcampaigns (2000/2001 ; 2001/2002) are targeted at a behaviour change.
For the repressive part of the campaign, the police forces were asked to increase the number ofalcohol controls and to organise random breath testing (objective risk of being caught). Thedrivers with a negative result are rewarded with a Bob-key ring. During the campaign the resultsof these actions are announced to the press, in order to influence the subjective risk of beingcaught.
MethodsAn evaluation is carried out by means of a comparative analysis of the number of accidents(official statistics NIS - BSRI) and of the number of positive breath tests during police controls.Concerning the results of these controls, we must be very careful to generalise conclusions: thedata collection is done on voluntary base, which means that the number of participating policeforces and those who send the results to the BSRI change every year.
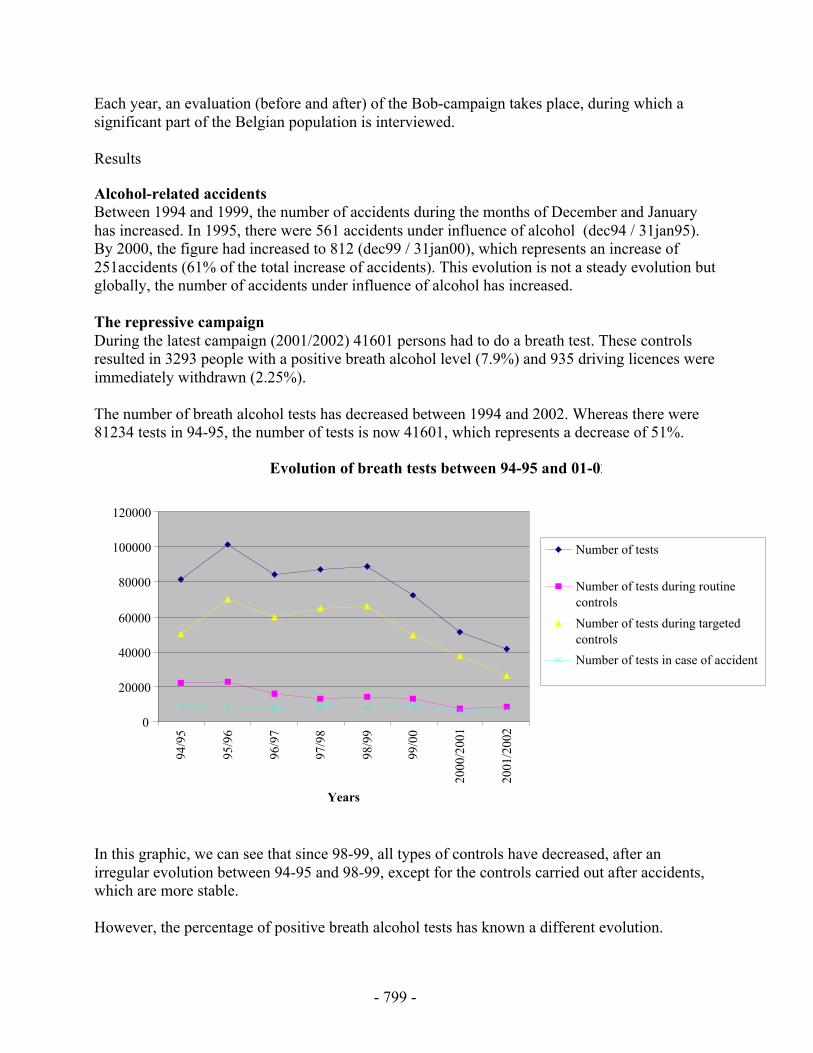
- 799 -
Each year, an evaluation (before and after) of the Bob-campaign takes place, during which asignificant part of the Belgian population is interviewed.
Results
Alcohol-related accidentsBetween 1994 and 1999, the number of accidents during the months of December and Januaryhas increased. In 1995, there were 561 accidents under influence of alcohol (dec94 / 31jan95).By 2000, the figure had increased to 812 (dec99 / 31jan00), which represents an increase of251accidents (61% of the total increase of accidents). This evolution is not a steady evolution butglobally, the number of accidents under influence of alcohol has increased.
The repressive campaignDuring the latest campaign (2001/2002) 41601 persons had to do a breath test. These controlsresulted in 3293 people with a positive breath alcohol level (7.9%) and 935 driving licences wereimmediately withdrawn (2.25%).
The number of breath alcohol tests has decreased between 1994 and 2002. Whereas there were81234 tests in 94-95, the number of tests is now 41601, which represents a decrease of 51%.
Evolution of breath tests between 94-95 and 01-02
0
20000
40000
60000
80000
100000
120000
94/9
5
95/9
6
96/9
7
97/9
8
98/9
9
99/0
0
2000
/200
1
2001
/200
2
Years
Number of tests
Number of tests during routinecontrols
Number of tests during targetedcontrols
Number of tests in case of accident
In this graphic, we can see that since 98-99, all types of controls have decreased, after anirregular evolution between 94-95 and 98-99, except for the controls carried out after accidents,which are more stable.
However, the percentage of positive breath alcohol tests has known a different evolution.
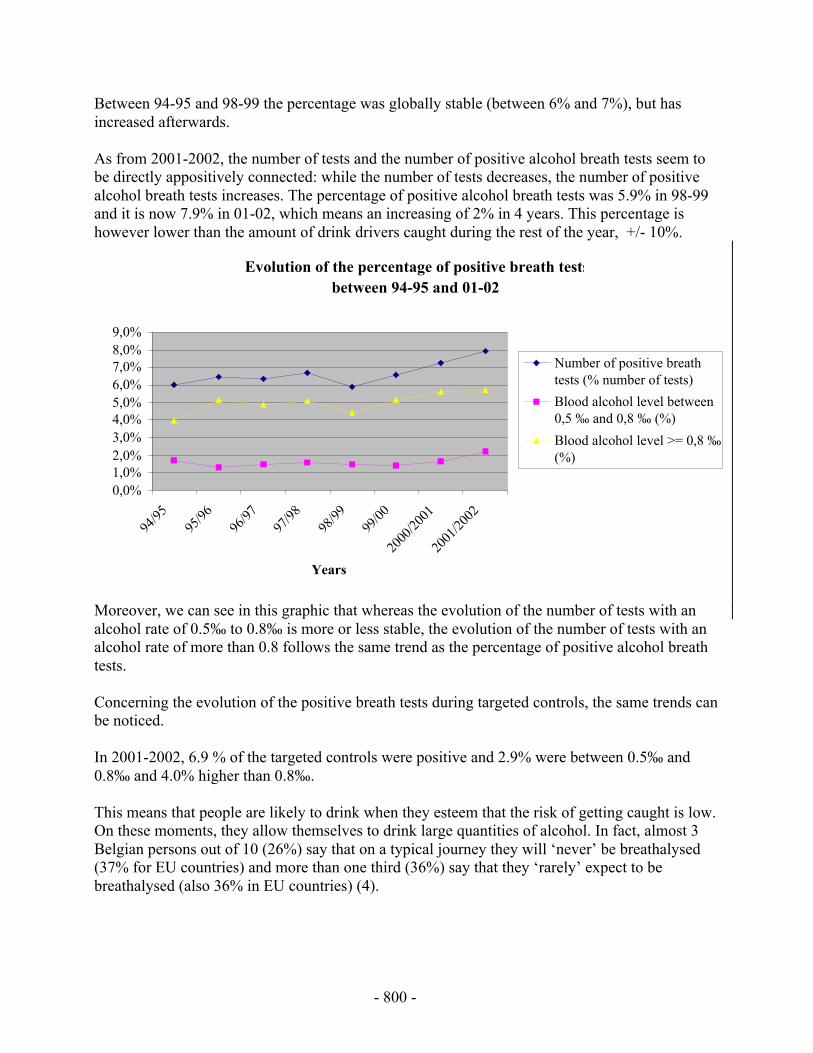
- 800 -
Between 94-95 and 98-99 the percentage was globally stable (between 6% and 7%), but hasincreased afterwards.
As from 2001-2002, the number of tests and the number of positive alcohol breath tests seem tobe directly appositively connected: while the number of tests decreases, the number of positivealcohol breath tests increases. The percentage of positive alcohol breath tests was 5.9% in 98-99and it is now 7.9% in 01-02, which means an increasing of 2% in 4 years. This percentage ishowever lower than the amount of drink drivers caught during the rest of the year, +/- 10%.
Evolution of the percentage of positive breath testsbetween 94-95 and 01-02
0,0%1,0%2,0%3,0%4,0%5,0%6,0%7,0%8,0%9,0%
94/95
95/96
96/97
97/98
98/99
99/00
2000
/2001
2001
/2002
Years
Number of positive breathtests (% number of tests)
Blood alcohol level between0,5 ‰ and 0,8 ‰ (%)
Blood alcohol level >= 0,8 ‰(%)
Moreover, we can see in this graphic that whereas the evolution of the number of tests with analcohol rate of 0.5‰ to 0.8‰ is more or less stable, the evolution of the number of tests with analcohol rate of more than 0.8 follows the same trend as the percentage of positive alcohol breathtests.
Concerning the evolution of the positive breath tests during targeted controls, the same trends canbe noticed.
In 2001-2002, 6.9 % of the targeted controls were positive and 2.9% were between 0.5‰ and0.8‰ and 4.0% higher than 0.8‰.
This means that people are likely to drink when they esteem that the risk of getting caught is low.On these moments, they allow themselves to drink large quantities of alcohol. In fact, almost 3Belgian persons out of 10 (26%) say that on a typical journey they will ‘never’ be breathalysed(37% for EU countries) and more than one third (36%) say that they ‘rarely’ expect to bebreathalysed (also 36% in EU countries) (4).
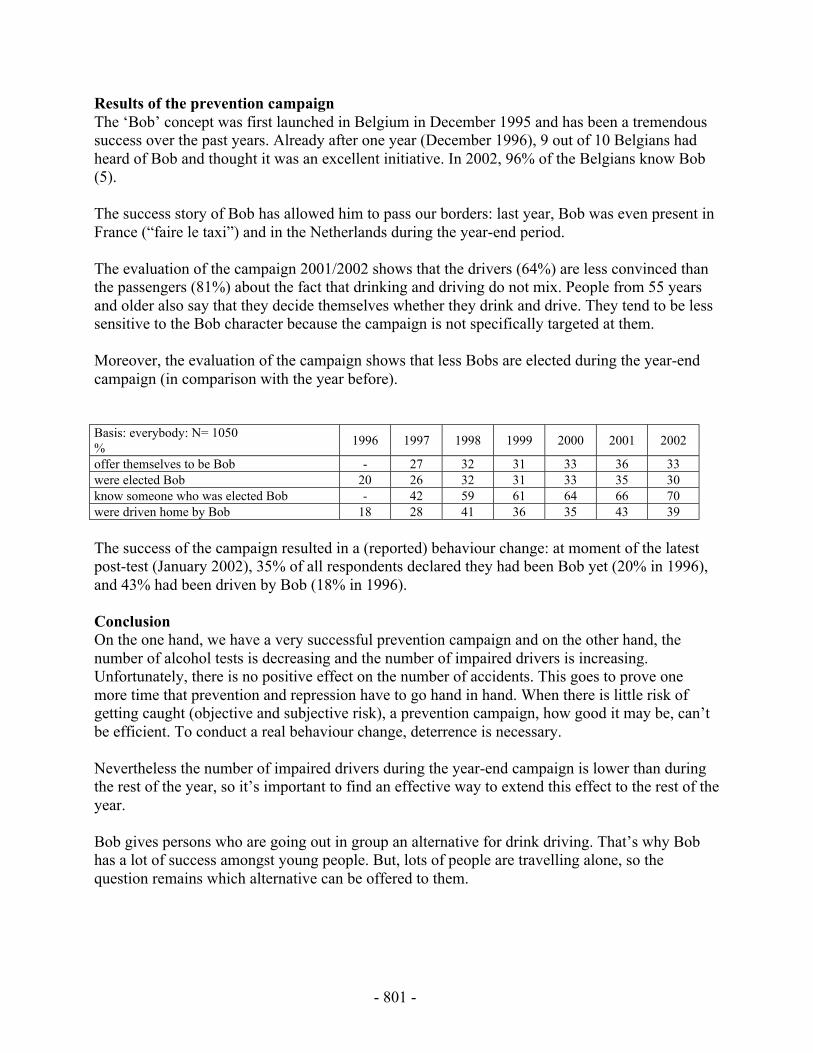
- 801 -
Results of the prevention campaignThe ‘Bob’ concept was first launched in Belgium in December 1995 and has been a tremendoussuccess over the past years. Already after one year (December 1996), 9 out of 10 Belgians hadheard of Bob and thought it was an excellent initiative. In 2002, 96% of the Belgians know Bob(5).
The success story of Bob has allowed him to pass our borders: last year, Bob was even present inFrance (“faire le taxi”) and in the Netherlands during the year-end period.
The evaluation of the campaign 2001/2002 shows that the drivers (64%) are less convinced thanthe passengers (81%) about the fact that drinking and driving do not mix. People from 55 yearsand older also say that they decide themselves whether they drink and drive. They tend to be lesssensitive to the Bob character because the campaign is not specifically targeted at them.
Moreover, the evaluation of the campaign shows that less Bobs are elected during the year-endcampaign (in comparison with the year before).
Basis: everybody: N= 1050%
1996 1997 1998 1999 2000 2001 2002
offer themselves to be Bob - 27 32 31 33 36 33were elected Bob 20 26 32 31 33 35 30know someone who was elected Bob - 42 59 61 64 66 70were driven home by Bob 18 28 41 36 35 43 39
The success of the campaign resulted in a (reported) behaviour change: at moment of the latestpost-test (January 2002), 35% of all respondents declared they had been Bob yet (20% in 1996),and 43% had been driven by Bob (18% in 1996).
ConclusionOn the one hand, we have a very successful prevention campaign and on the other hand, thenumber of alcohol tests is decreasing and the number of impaired drivers is increasing.Unfortunately, there is no positive effect on the number of accidents. This goes to prove onemore time that prevention and repression have to go hand in hand. When there is little risk ofgetting caught (objective and subjective risk), a prevention campaign, how good it may be, can’tbe efficient. To conduct a real behaviour change, deterrence is necessary.
Nevertheless the number of impaired drivers during the year-end campaign is lower than duringthe rest of the year, so it’s important to find an effective way to extend this effect to the rest of theyear.
Bob gives persons who are going out in group an alternative for drink driving. That’s why Bobhas a lot of success amongst young people. But, lots of people are travelling alone, so thequestion remains which alternative can be offered to them.
- 802 -
References1. European Transport Safety Council, Reducing traffic injuries resulting from alcohol
impairment. ETSC, Brussels, 1995.
2. Belgian Road Safety Institute (s.d.) Road Safety. Annual report 2000. BSRI, Brussels,2001.
3. Belgian Society of Emergency and Disaster Medicine (BESEDIM), Toxicological Society ofBelgium and Luxemburg (BLT), Belgian Road Safety Institute (BSRI), Belgian Toxicologyand Trauma Study. BSRI, Brussels, 1997.
4. SARTRE 2, The attitude and Behaviour of European car drivers to road safety. Part:Executive summary, SWOV, Leidschendam, 1998.
5. BSRI, Road Safety, Post-test. Brussels, January 2002.
- 803 -
Experimental Testing of the Designated Driver Concept
1J. Lange, 2T. Falb, 2M. Johnson
1Student Health Services, San Diego State University, San Diego, California, USA, 2PacificInstitute for Research and Evaluation, Calverton, Maryland, USA.
KeywordsAlcohol, designated drivers
AbstractIn theory, the designated-driver concept holds great promise for reducing the incidences of drunkdriving. It is simple, inexpensive, almost universally recognized, and generally positivelyregarded by the U.S. population as a means for avoiding drunk driving. In practice, however,research has shown that implementing the designated-driver concept is often flawed. To functionproperly, groups of drinkers must commit to the three stages: (1) the group must designate adriver before starting to drink, (2) the designee must abstain from drinking, and (3) the designeemust fulfill his or her responsibility to be the driver. Failure at any of these three stages ofimplementation could result in potentially impaired drivers either claiming to be the designateddriver or usurping the role of the designated driver. The research described was designed toaddress factors that may impede proper implementation of the designated-driver concept. Sixintervention trials were designed to (1) cue the use of designated drivers, (2) change the attitudesof the group, and (3) affect group norms to support the proper use of designated drivers. Therewere 309 participating groups recruited as they crossed as pedestrians into Tijuana, Mexico fromSan Diego, California. Each was assigned at random to the conditions. Results indicate thatcueing alone decreased the returning BACs of drivers. Using group members to deliver pro-designated driver messages decreased driver and passenger BACs even farther.
IntroductionPrograms clearly fitting the harm reduction paradigm are “safe-ride” and “designated-driver”campaigns that focus mostly on reducing the consequences of heavy drinking rather thanreducing the amount consumed. Ross pointed to the problems in the United States caused by thefact that most commercial drinking establishments (and most friends’ homes as well) must bereached by automobile (1). Consequently, drinking and driving becomes almost inevitable. Thissupports two harm reduction concepts. The use of “safe-rides” where the drinking establishmentor a public organization provides transportation home for individuals too impaired to drive safely,and the “designated-driver” concept where one member of a group attending a drinking eventrefrains from consuming alcohol in order to provide a safe ride home for others in the group.
Several communities have organizations that provide rides to individuals who have been drinkingand who believe they cannot drive safety home. Harding, Apsler, and Goldfein surveyed 335
- 804 -
such ride service programs in both large and small communities across the country (2). Theydiscovered that most of these programs provided free transportation for impaired drinkers butonly 15 percent provided a method for returning the drinkers’ vehicles to their homes. This is amajor limitation that apparently accounts for the low usage of the safe-ride programs.
Both concepts—safe-ride and designated-driver—can help minimize the highway safetyconsequences of heavy drinking. Alternatively, it must also be recognized that one of theinformal controls on the amount of drinking is the individual’s perception of the risk of crashinvolvement or arrest if driving while impaired. A designated driver may also sense grouppressure to limit consumption. The availability of a substitute driver, either through a safe-rideprogram or through a designated-driver program, can act to remove these constraints. This raisesthe possibility that heavy drinkers who know they will be a passenger will consume more than ifthey had to drive. This, in turn, could cause additional harm due to the increased dependence onalcohol or the increased risk of non-traffic-related trauma (e.g., falls, fires, or violence). Hardingand Caudill conducted telephone and barroom surveys of drinkers who had been transported by adesignated driver (3). Their respondents reported small, but significant, increases in their drinkingoutside the home when a designated driver was available. Thus, evaluators of designated-driverprograms need to consider two issues: (1) the extent to which these programs reduce the crashrisk of drivers being transported by designated drivers, and (2) the program’s potential forincreasing consumption that results in increased drinking-related problems in non-traffic safetyareas.
DeJong and Wallack felt that this potential was problematic enough to suggest that designated-driver programs should only be advocated when used with other environmental interventions thatwould influence alcohol consumption (4). They claim that encouraging the use of designateddrivers sends a “mixed message” to people, as it appears to condone heavy drinking. They citeothers who go as far as to suggest that designated driving is tantamount to “enabling.” However,they also acknowledge that there is no empirical evidence to support this fear. Wagenaar alsonotes the lack of data on this point, stating “We urgently need controlled studies of designated-driver programs, including direct observation data on the specific patterns of response of drinkersto the availability of a designated driver” (5, p. 444).
Perhaps more serious than the question of “enabling”, are the questions raised related toimplementation. Studies have demonstrated that designated drivers often drink, sometimes athigh levels (6). Further, even though the concept is quite familiar and popular to a vast majorityof the population, it clearly is not always used, as drunk driving still occurs all to often.
The research presented here examines the effectiveness of a number of brief interventionsdesigned to enhance the proper use of designated drivers in a high-risk drinking setting. Testingof passengers’ returning BAC will also allow for analysis of the “enabling” hypothesized effectsof designated drivers.
Methods
ParticipantsParticipants were recruited on the U.S. side of the San Diego/Tijuana pedestrian border crossing.Whole groups of young people were approached and asked a number of screening questions.
- 805 -
Eligible groups must have included a San Diego County resident between the ages of 18 and 30,arrived by private car, and averaged at least one passenger per driver. Eligible participants wereoffered $10 to participate.
There were 309 groups recruited that successfully completed the data collection. There were1,159 total participants (59.3% males). Ages ranged from 18 to 46 (M=20.4, SD=2.86). All datacollection reported here occurred on approximately one Friday and Saturday night per monthbetween June 2000 and June 2001. Recruitment times were between 10 PM and 1 AM.Returning times were between 12 AM and 6 AM.
Experimental ConditionsEach group was randomly assigned into one of seven experimental conditions. These conditionsare summarized in Table 1.
Table 1 Experimental conditions
Condition Description
1. Control Participants are treated identically to other conditions, but no questions aboutdesignated-driver use are included.
2. Cueing only Participant groups are asked to identify their designated driver.3. Cue plus physical
reminderAfter identifying the designated driver, the driver is asked to wear a special IDbracelet with the words “Designated Driver” printed on it.
4. Attitude change throughdissonance reduction
The identified designated driver is asked to read a pro-designated driver usestatement that may evoke feelings of hypocrisy. This in turn may create adissonant reduction effort that results in a more pro-designated-driver attitude.
5. Reward of driver The identified designated driver is offered a reward for returning from Tijuanasober.
6. Normative pressurethrough reward
All members of the group are offered a reward if the driver returns sober.
7. Normative pressurethrough attitude change
A randomly selected participant group member reads aloud a pro-designateddriver use statement. Then the group selects the designated driver.
ProceduresTwo survey staff members wearing colored windbreakers, and carrying clipboards recruited participants.Initial group selection was based upon an appearance that the group may meet the eligibility requirements,and being the next group to cross a tapeline placed on the sidewalk once the other surveyors were ready toaccept a group for processing.
The survey was described as an effort to make the Tijuana border area safer and more enjoyable for thosewho visit it. Participants were informed about the nature of the task, and that they would receive a $10money order upon their return to the United States, if they checked in with a member of the researchsurvey team before 6:00 AM on their way back. We decided to offer the incentive as a $10 U.S. PostalMoney Order instead of cash to hinder possible attempts to return to Tijuana to drink more. The entiregroup must have agreed for the group to participate in the study.
Once the group agreed to participate, members were given a questionnaire on a clipboard and asked towear a hospital style ID bracelet with a subject code number. This allowed us to match arrival withreturning data while maintaining the anonymity of the participant. These methods matched closely thosedescribed previously by Lange (7).
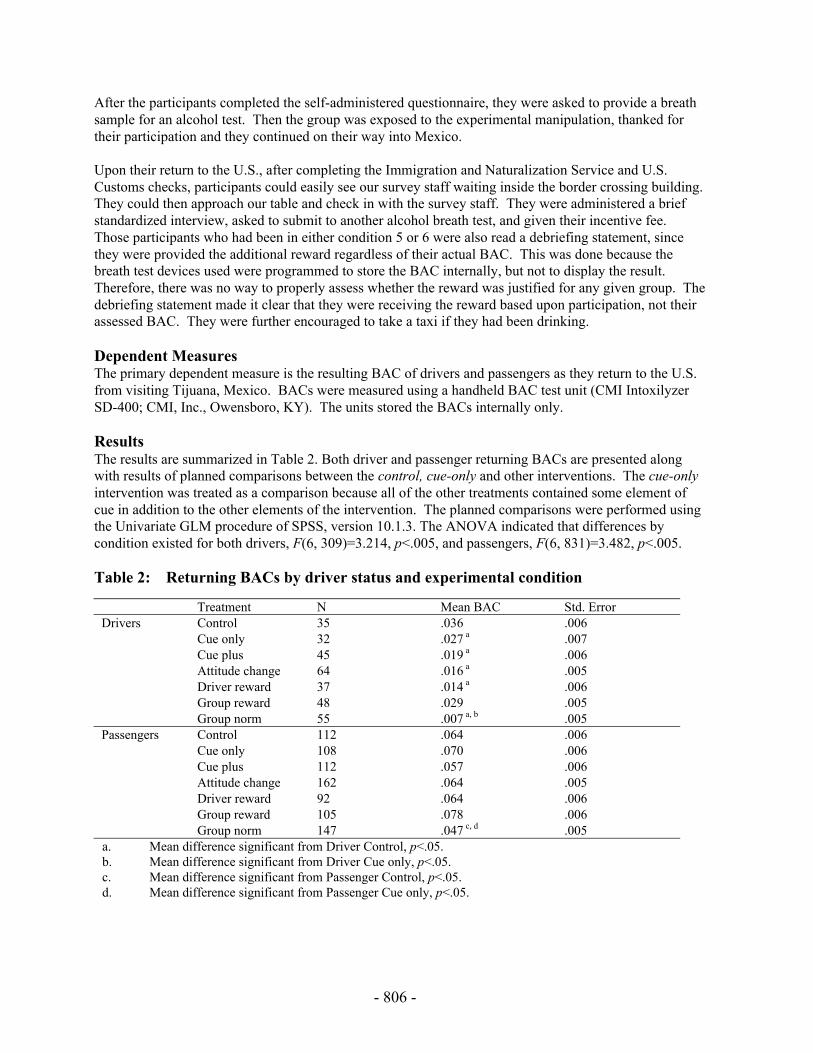
- 806 -
After the participants completed the self-administered questionnaire, they were asked to provide a breathsample for an alcohol test. Then the group was exposed to the experimental manipulation, thanked fortheir participation and they continued on their way into Mexico.
Upon their return to the U.S., after completing the Immigration and Naturalization Service and U.S.Customs checks, participants could easily see our survey staff waiting inside the border crossing building.They could then approach our table and check in with the survey staff. They were administered a briefstandardized interview, asked to submit to another alcohol breath test, and given their incentive fee.Those participants who had been in either condition 5 or 6 were also read a debriefing statement, sincethey were provided the additional reward regardless of their actual BAC. This was done because thebreath test devices used were programmed to store the BAC internally, but not to display the result.Therefore, there was no way to properly assess whether the reward was justified for any given group. Thedebriefing statement made it clear that they were receiving the reward based upon participation, not theirassessed BAC. They were further encouraged to take a taxi if they had been drinking.
Dependent MeasuresThe primary dependent measure is the resulting BAC of drivers and passengers as they return to the U.S.from visiting Tijuana, Mexico. BACs were measured using a handheld BAC test unit (CMI IntoxilyzerSD-400; CMI, Inc., Owensboro, KY). The units stored the BACs internally only.
ResultsThe results are summarized in Table 2. Both driver and passenger returning BACs are presented alongwith results of planned comparisons between the control, cue-only and other interventions. The cue-onlyintervention was treated as a comparison because all of the other treatments contained some element ofcue in addition to the other elements of the intervention. The planned comparisons were performed usingthe Univariate GLM procedure of SPSS, version 10.1.3. The ANOVA indicated that differences bycondition existed for both drivers, F(6, 309)=3.214, p<.005, and passengers, F(6, 831)=3.482, p<.005.
Table 2: Returning BACs by driver status and experimental condition
Treatment N Mean BAC Std. ErrorControl 35 .036 .006Cue only 32 .027 a .007Cue plus 45 .019 a .006Attitude change 64 .016 a .005Driver reward 37 .014 a .006Group reward 48 .029 .005
Drivers
Group norm 55 .007 a, b .005Control 112 .064 .006Cue only 108 .070 .006Cue plus 112 .057 .006Attitude change 162 .064 .005Driver reward 92 .064 .006Group reward 105 .078 .006
Passengers
Group norm 147 .047 c, d .005a. Mean difference significant from Driver Control, p<.05.b. Mean difference significant from Driver Cue only, p<.05.c. Mean difference significant from Passenger Control, p<.05.d. Mean difference significant from Passenger Cue only, p<.05.
- 807 -
DiscussionFirst, it is clear that drivers tend to have lower BACs than their passengers. This is an importantconsideration given that there is also an indication that at least for some of those in the sample, thedesignated driver concept is being misapplied. Mere mention of the concept, and prompting the publicdesignation prior to drinking resulted in a reduction in the returning BAC of drivers. Observations of thegroups in the experiment confirmed that many were rather surprised by the designated driver cue. Attimes, the cue prompted negotiations between group members that one would have expected to occur priorto our contact with them. This may indicate that a major impediment to proper use is not awareness, oreven attitudes, but cognitive processes that do not even consider the issues of returning travel.
Additionally, it is interesting that the only intervention that demonstrated significant improvement overthe cue-only condition was the group-norm intervention. In that intervention, a group member is enticedto read a pro-designated driver statement and ask the group about their use of a designated driver for theevening. There are a number of possible mechanisms by which this may have more impact than cueingalone. One possibility is that the driver observing the friend read the statement will misattribute thepersuasive message to their friend’s true internal beliefs. This would follow from the logic of theFundamental Attribution Error literature (8). The result would be an increased persuasive force for themessage, and thus a lower driver BAC. Additional research is needed to determine if this is a plausiblehypothesis.
Aside from the prevalent misapplication of the concept, designated drivers have been criticized because ofthe possibility that they facilitate greater drinking by passengers. The results of this experiment indicatethat this may not be a valid concern. Increasing the proper use of designated drivers produced nosignificant increases in passenger BACs. To the contrary, when group members were solicited to offer thepro-designated driver message, passenger BACs were actually reduced. The mechanism by which thiseffect occurred is not clear from the present data analysis.
References1. Ross, H. L. (1992). Confronting drunk driving: Social policy for saving lives. New Haven,
CT: Yale University Press.
2. Harding, W. M., Apsler, R., & Goldfein, J. (1998, January). A directory of ride serviceprograms. (Final Technical Report DOT HS 807 290). Washington, DC: U.S. Department ofTransportation, National Highway Traffic Safety Administration.
3. Harding, W. M., & Caudill, B. D. (1997). Does the use of designated drivers promoteexcessive alcohol consumption? In C. Mercier-Guyon (Ed.) Proceedings of the 14th AnnualConference on Alcohol, Drugs and Traffic Safety, Volume 3. Annecy, 21 - 26 September,1997. (pp. 1359–1364). Annecy, France: Centre d'Etudes et de Recherches en Médecine duTraffic.
4. DeJong, W., & Wallack, L. (1992). The role of designated driver programs in the preventionof alcohol-impaired driving: A critical reassessment. Health Education Quarterly, 19(4),429–442.
5. Wagenaar, A. C. (1992). Designated driver programs: A commentary on the DeJong andWallack article. Health Education Quarterly, 19(4), 443–445.

- 808 -
6. Fell, J., Voas, R. B., & Lange, J. E. (1997). Designated driver concept: Extent of use in theUSA. Journal of Traffic Medicine, 25(3–4), 109–114.
7. Lange, J.E. (2002). Alcohol’s effect on aggression: A two–channel theory. Psychology ofAddictive Behaviors, 16(1), 47-55.
8. Nisbett, R. E., & Ross, L. (1980). Human inference: Strategies and shortcomings of socialjudgment. Englewood Cliffs, NJ: Prentice-Hall.
- 809 -
Responsible Beverage Service Training Programmes:A Good Way to Decrease Alcohol, Related Problems
1H. Sacy and 2S. Beauchamp Ph.D.
1Éduc’alcool, Québec, Canada, 2University of Montréal, Montréal.
KeywordsAlcohol, Responsible service, waiters, servers, bars, accidents.
AbstractThere is a lot of talk about Responsible Beverage Service Training Programmes and howeffective they really are in combating drunk driving, social problems related to excessivedrinking and the sale of alcohol to minors. Some of the obstacles to implementing theprogrammes include staff turnover, fear of a drop in sales and a lack of political will. A criticalanalysis of the effectiveness of Responsible Beverage Service Training Programmes wasconducted recently by compiling the results of more than 25 research studies. Experiences inseveral countries highlight the most promising aspects of the programmes and most favourableconditions for their implementation.
The programmes sensitise serving staff and give them the means to take action. But theprogrammes cannot be effective without backing from the milieu, support from the ownersand managers of drinking establishments, and appropriate legislation. While it cannot beproven irrefutably that Responsible Beverage Service Training Programmes alone contributesignificantly to reducing drinking-related problems, they are nonetheless efficient when theyare supported, understood and made mandatory.
Introduction• Responsible beverage service training programmes were introduced in the 1980s in Australia,
Canada, the U.S. and other countries.• Often supported or required by legislation, they are designed to prevent the sale of alcohol to
minors and excessive drinking by customers in licensed establishments.• Do they work?• If they do, under what conditions?• How should they be implemented?
- 810 -
Methods and Results Effectiveness 29 studies examining the effectiveness of such programs have been analysed. I. Evaluation of serving staff awareness, attitudes and behaviours Howard-Pitney et al. (1991): The impact of a 1-day training course on awareness, beliefs and
behaviours, as well as on house rules and policy (Park City, Utah). Results:
• Significant difference in awareness and belief that customers will be favourable towardsthe policies and practices of responsible beverage service.
• Little effect on the development of strategies for taking action.• Establishments where staff had taken the course posted more notices about the availability
of non-alcoholic beverages, and fewer employees were drinking on the job.
Gliksman et al. (1993): Impact of a server intervention program (SIP) on serving staff inThunder Bay, Ontario.
Results:• Significant increase in awareness.• More positive attitude towards the idea of intervening with customers.• SIP would appear to be significantly effective in changing behaviour.• Doubt as to support from managers and owners in establishing house policies.
McKnight (1991): Factors that might influence the effectiveness of training programmes and
lead to responsible action (3-6 hours of training for 1,079 servers in 100 establishments in 8U.S. cities).
Results:
• Significant improvement in awareness, attitudes and behaviours, as reported by servingstaff.
• When observed, behaviour with intoxicated customers did not change significantly.
II. Evaluation of impact on customer drinking Toomey et al. (1999): Ability to recognise the signs of alcohol intoxication and strategies in
such cases (24 establishments studied, 68 attempted entries in an urban area of Minnesota. Results:
• Five refusals.• Of the 63 admitted, 20 were refused service on the first request, and 20 more were refused
on the second request.• In 8% of the 66 drinks served, serving staff said they recognised that the customer-actors
were inebriated.• Strategy: Refuse to serve alcohol (68% of refusals) or serve non-alcoholic beverage (18%
of refusals).

- 811 -
Toomey et al. (2001): The impact of the Alcohol Risk Management (ARM) programme onthe sale of alcohol to intoxicated customers.
Results:
• Two out of five establishments have set clear, written policies.• No significant reduction in the sale of alcohol to intoxicated customers.• No reduction in the sale of alcohol to minors.
Buka and Birdthistle (1999): Long-term impact of the Rhode Island Community AlcoholAbuse and Injury Prevention Project (CAAIPP).
Results:
• No significant different in the sale of alcohol to minors or to intoxicated customers, andno major change in preventing inebriation.
• Initial Increase in general practices of responsible service during follow-up, followed by adecline.
• Importance of adding "booster" sessions after initial training. Russ and Geller (1987): Impact of a training programme on dealing with inebriated customers
as they leave the bar (with actors playing the role of inebriated patrons). Results:
• Increase in number of cases of intervention by serving staff.• Trained staff more frequently offered water and food.• Increase in delays before serving.• Comments on driving while impaired.• More checking of ID cards.• No refusal to serve a sixth drink.• Promising future for training programmes.
III.Evaluation of the impact on driving while impaired Wagenaar and Holder (1991): The impact of responsible service practices on road accidents
involving impaired drivers in Texas, between 1978 and 1989. Results:
• Significant reduction in the number of road accidents involving an impaired driver.• Clear impact of media coverage of lawsuits.• Effective in making serving staff more responsible.
Holder and Wagenaar (1994): The impact of mandatory training sessions for serving staff on
road accidents occurring at night and involving impaired drivers in Oregon. Results:
• As serving staff became trained, the number of accidents decreased.• Server training proved effective.• 68% of serving staff who completed the training reported positive changes in their
awareness, attitudes and behaviour towards customers.
- 812 -
Levy and Miller (1995): Costs and profits generated by the introduction of a law respecting
responsible beverage service; Washetenaw, Michigan. Results:
• Reduction in human costs, including suffering, loss of quality of life and health care costs.• Reduction in financial losses.• Reduction in consequences for others.• The mandatory responsible beverage service programme in Washetenaw is paying off.
IV. Difficulties implementing and applying rules and policy Saltz and Stanghetta (1997): Implementation criteria to maximise the effectiveness of
responsible beverage service programmes in three locations in inland California, coastalCalifornia and South Carolina.
Results: Public opinion is important in implementing programmes and awareness must be raised
among managers. Wittman (1989): The experience of alcoholic beverage-related strategies developed for
university students of Greek background in the western U.S. Results: Serious resistance to establishing the programme, but three solutions suggested by fraternity
representatives:• Influential individuals likely to oppose the project should be identified and advance action
taken before the programme is implemented.• Organisations with decision-making power within the community should participate in
applying a system for controlling the consumption of alcoholic beverages.• Value conflicts with community opinion leaders should be resolved.
Simons-Morton and Cummings (1997): Evaluated the TEAM programme in Houston, Texas,
by consulting serving staff. Results:
• Significant improvement in staff awareness of their preventive role.• Some difficulty putting the programme into practice.• Staff continue to serve intoxicated customers for the following reasons:
• don't want to lose profits and tips• customers who are refused service are not pleased• pressure from managers to maximise alcohol sales and keep customers happy and
satisfied.
- 813 -
McKnight (1996) also concludes that responsible service programmes are often used to shiftresponsibility from managers to serving staff, and this tendency is encouraged by the lawlimiting manager responsibility if serving staff have been trained.
Single (1990) believes that
• responsible beverage service programmes can be effective in reducing drunkenness;• such programmes should receive more support from management policy that is more
preventive than legal-oriented;• the success of such programmes cannot be extrapolated to a reduction in social problems
related to alcohol abuse. Holder et al. (1993) also conclude that the degree of responsibility in the United States is
linked to publicity about responsible beverage service and the degree of awareness among theowners and managers of licensed establishments.
Turrisi et al. (1999) analysed the perceptions of bar owners and serving staff with regard to
responsible beverage service policies. Results:
• No significant difference between the attitudes of owners and serving staff.• Policies that are designed to do customers a favour are perceived as positive.• Those limiting the sale of alcohol were not well received.
Discussion• The programmes are effective for increasing awareness and changing the attitudes of serving
staff.• Results are not as clear with regard to behaviour.• Various factors can affect the effectiveness of the programmes.• After training, serving staff know how to deal with an inebriated customer or someone they
suspect is a minor.• This knowledge does not get put into practice. The issue is to identify the factors that limit and facilitate responsible service:• The server is often portrayed as the person whose job it is to provide pleasure.• That leads to ambiguity when he or she must stop serving drinks.• Customers will be unhappy if they are refused service, and servers then have to deal with the
situation and the fact that they will not get a tip.• If the establishment does not support responsible beverage service practices, servers who
follow them risk being reprimanded or even fired.• Some servers wait longer between drinks, offer coffee and make comments about impaired
faculties, all while pouring the customer another drink.• Responsible service practices cannot be implemented without support from the environment,
i.e. the manager or owner: - who encourages training - who sets clear house policy
• Programmes are effective when they are mandatory and backed by sanctions (studies inOregon, Texas and Michigan).
- 814 -
• Media coverage of lawsuits against servers is a key factor in applying responsible servicepractices and reducing alcohol-related road accidents.
• Programmes are more effective if they are supported by public opinion, if managers adoptclear, written house policies and if employees are encouraged to implement them.
• Effectiveness also depends on the type and duration of the training, and the trainingobjectives.
Conclusion• The effectiveness of responsible beverage service programmes cannot be demonstrated
conclusively, but some factors cannot be ignored:• Serving staff cannot be held solely responsible.• Governments must promote the programmes and make them mandatory.• Owners and managers must participate actively in implementing them.• Public opinion must provide support.• Programmes must continue to be evaluated in order to remove obstacles to their
implementation. • Éduc’alcool and its partners have launched a new program in Québec, Service in Action,
taking all these aspects into account. Evaluation and results are yet to be determined. A briefpresentation of the program is made.
ReferencesBuka, Stephen L. and Isolde J. Birdthistle, "Long-Term Effects on a Community-Wide AlocoholServer Training Intervention," Journal of Studies on Alcohol 60 (1): 27-37 (1999).
Gliksman, Louis et al., "The Role of Alcohol Providers in Prevention: An Evaluation of a ServerIntervention Programme," Addiction 9 (88): 1195-1203 (1993).
Holder, Harold D. et al., "Alcoholic Beverage Server Liability and the Reduction of Alcohol-Involved Problems," Journal of Studies on Alcohol 54 (1): 23-36 (1993).
Holder, Harold D. and Alexander C. Wagenaar, "Mandated Server Training and ReducedAlcohol-Involved Traffic Crashes: A Time Series Analysis of the Oregon Experience," AccidentAnalysis and Prevention 26 (1): 89-97 (1994).
Howard-Pitney, Beth et al., "Responsible Alcohol Service: A Study of Server, Manager, andEnvironmental Impact," American Journal of Public Health 81 (2): 197-199 (1991).
Levy, David T. and Ted R. Miller, "A Cost-Benefit Analysis of Enforcement Efforts to ReduceServing Intoxicated Patrons," Journal of Studies on Alcohol 56 (2): 240-247 (1995).
McKnight, A. James, "Factors Influencing the Effectiveness of Server-Intervention Education,"Journal of Studies on Alcohol 52 (5): 389-397 (1991).
- 815 -
McKnight, A. James, "Server Intervention to Reduce Alcohol-Involved Traffic Crashes," AlcoholHealth & Research World 20 (4): 227-229 (1996).
Russ, Nason W. and Scott Geller, "Training Bar Personnel to Prevent Drunken Driving: A FieldEvaluation," American Journal of Public Health 77 (8): 952-954 (1987).
Saltz, Robert F. and Paula Stanghetta, "A Community-Wide Responsible Beverage ServiceProgram in Three Communities: Early Findings," Addiction 92 (supplement 2): S237-S249(1997).
Simons-Morton, Bruce G. and Sharon Snider Cummings, "Evaluation of a Local DesignatedDriver and Responsible Server Program to Prevent Drinking and Driving," Journal of DrugEducation 27 (4): 321-333 (1997).
Single, Eric, "Server Intervention: A New Approach to the Prevention of Impaired Driving,"Health Education Research 5 (2): 237-245 (1990).
Toomey, Traci L. et al., "Project ARM: Alcohol Risk Management to Prevent Sales to Underageand Intoxicated Patrons," Health Education & Behavior 28 (2): 186-199 (2001).
Toomey, Traci L. et al., "Alcohol Sales to Pseudo-Intoxicated Bar Patrons," Public HealthReports 114: 337-342 (1999).
Turrisi, Rob, Bev Nicholson, and James Jaccard, "A Cognitive Analysis of Server InterventionPolicies: Perceptions of Bar Owners and Servers," Journal of Studies on Alcohol 60 (1): 37-46(1999)
Wagenaar, Alexander C. and Harold D. Holder, "Effects of Alcoholic Beverage Server Liabilityon Traffic Crash Injuries," Alcoholism: Clinical and Experimental Research 15 (6): 942-947(1991).
Wittman, Friedner D., "Planning and Programming Server Intervention Initiatives for Fraternitiesand Sororities: Experiences at a Large University," Journal of Primary Prevention 9 (4): 247-269(1989).

- 816 -

- 817 -
An Evaluation of Coin-Operated Breath TestingMachines in South Australian Licensed Premises
L.N. Wundersitz
Road Accident Research Unit, The University of Adelaide, 5005, Australia
KeywordsAlcohol, breath test, evaluation
AbstractA six month trial of coin-operated breath testing machines was conducted in licensed premises inSouth Australia to examine public attitudes towards, and use of, the machines, the effect ondrinking and driving behaviour, and also matters such as commercial viability. Data wascollected by down loading from the memory in each breath testing machine, direct observation,and interviews with machine users, non-using patrons, and interviews with the licensees of thepremises.
Coin-operated hotel breath testers were generally well received by both the hotel patrons andhotel licensees and they appeared likely to have had some effect in reducing illegal drink driving.Selective targeting of the larger hotels, particularly with young clientele, should be a priority toensure commercial viability.
IntroductionCampaigns have been directed to educate the public about ‘standard drinks’ and how to countthem, but this approach has its limitations as other variables complicate estimation of BAClevels. Improving drivers’ ability to estimate their BACs before deciding whether or not to drivehas the potential to further decrease drink driving and alcohol-related road crashes.
A study of drivers and riders admitted to the Royal Adelaide Hospital as a result of a road crash,found the majority of respondents (50%) nominated hotel-based premises as the last place ofalcohol consumption (1). Coin-operated breath testing machines in licensed premises couldprovide drinkers with an accurate source of BAC feedback at the point where the decision todrive is made.
Transport SA commissioned a six month trial of installing Australian Standard certified coin-operated breath alcohol testing machines in twenty five South Australian licensed premises. Thisreport on the trial addresses the financial viability of the machines, the patterns of machine usage,perceptions of machine users and the effect of BAC feedback from the machine on subsequentdrinking and driving behaviour.

- 818 -
MethodsTwenty five machines were installed in 12 metropolitan hotels, 6 metropolitan football clubs, 5rural hotels and 2 rural clubs throughout South Australia. Venues were selected on the basis ofbeing well patronised and if the licensees agreed to participate in the study.
Quantitative data was recorded electronically by each of the breath testing machines. The numberof tests was recorded in addition to the time of testing, date of testing and BAC reading for eachcompleted test. The machines were calibrated and data was down loaded on a monthly basis. Thecost per test was one dollar.
One hundred and nine patrons who chose to use the coin-operated breath tester wereunobtrusively observed and their BAC readings were recorded before they were approached foran interview. Patrons leaving the premises were randomly selected and interviewed (N=614).Respondents from both of these groups were breath tested using a hand held breath tester(Alcolmeter, SD 400) to compare the BAC distributions of machine users and non-users.Respondents were asked to rinse their mouth with water if they said they had consumed alcoholin the last 5 minutes to minimise the risk of mouth alcohol inflating the reading.
The licensee of each of the 25 participating venues was interviewed by telephone to determinetheir attitudes towards the machines, their observations of machine use, the perceived impact ontheir business and any problems they had experienced.
Results
Financial Viability and Usage PatternsA total of 24,129 tests were recorded by the machines, an approximate average daily usage rateof 5.4 tests per machine. This was not enough to cover their cost in the majority of licensedvenues (see Table 1). Each machine cost $340 (Australian) per month to lease from thedistributor. This meant each machine was required to be used 2,040 times at $1 each to breakeven for the 6 month trial. This equated to an average rate of 11.2 tests per day over the 6 months.Hence, as shown in Table 1, machines were commercially viable in only two venues.
The two venues that generated enough revenue to cover leasing costs in this trial were large,busy, establishments with relatively young patrons. Accessibility to the machines was rated as‘good’ in both establishments and each machine was located in a central position near the mainbar area. The machines in football clubs and the smaller hotels were particularly under-utilised.
A summary of specific data recorded by the breath testing machines is collated and presented inTable 2. Overall, the machines were most frequently used between 8pm and 4am on Friday andSaturday nights. These times coincide with the peak time for alcohol involvement in road crashes(2).
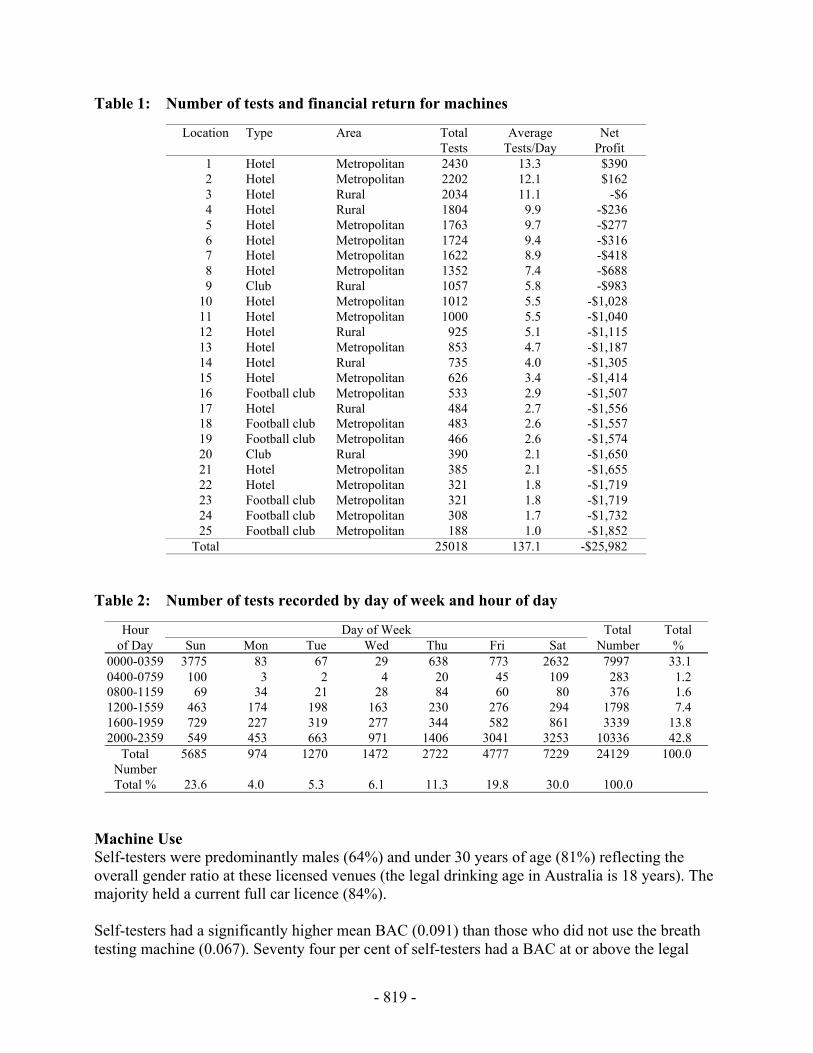
- 819 -
Table 1: Number of tests and financial return for machines
Location Type Area TotalTests
AverageTests/Day
NetProfit
1 Hotel Metropolitan 2430 13.3 $3902 Hotel Metropolitan 2202 12.1 $1623 Hotel Rural 2034 11.1 -$64 Hotel Rural 1804 9.9 -$2365 Hotel Metropolitan 1763 9.7 -$2776 Hotel Metropolitan 1724 9.4 -$3167 Hotel Metropolitan 1622 8.9 -$4188 Hotel Metropolitan 1352 7.4 -$6889 Club Rural 1057 5.8 -$983
10 Hotel Metropolitan 1012 5.5 -$1,02811 Hotel Metropolitan 1000 5.5 -$1,04012 Hotel Rural 925 5.1 -$1,11513 Hotel Metropolitan 853 4.7 -$1,18714 Hotel Rural 735 4.0 -$1,30515 Hotel Metropolitan 626 3.4 -$1,41416 Football club Metropolitan 533 2.9 -$1,50717 Hotel Rural 484 2.7 -$1,55618 Football club Metropolitan 483 2.6 -$1,55719 Football club Metropolitan 466 2.6 -$1,57420 Club Rural 390 2.1 -$1,65021 Hotel Metropolitan 385 2.1 -$1,65522 Hotel Metropolitan 321 1.8 -$1,71923 Football club Metropolitan 321 1.8 -$1,71924 Football club Metropolitan 308 1.7 -$1,73225 Football club Metropolitan 188 1.0 -$1,852
Total 25018 137.1 -$25,982
Table 2: Number of tests recorded by day of week and hour of day
Hour Day of Week Total Totalof Day Sun Mon Tue Wed Thu Fri Sat Number %
0000-0359 3775 83 67 29 638 773 2632 7997 33.10400-0759 100 3 2 4 20 45 109 283 1.20800-1159 69 34 21 28 84 60 80 376 1.61200-1559 463 174 198 163 230 276 294 1798 7.41600-1959 729 227 319 277 344 582 861 3339 13.82000-2359 549 453 663 971 1406 3041 3253 10336 42.8
TotalNumber
5685 974 1270 1472 2722 4777 7229 24129 100.0
Total % 23.6 4.0 5.3 6.1 11.3 19.8 30.0 100.0
Machine UseSelf-testers were predominantly males (64%) and under 30 years of age (81%) reflecting theoverall gender ratio at these licensed venues (the legal drinking age in Australia is 18 years). Themajority held a current full car licence (84%).
Self-testers had a significantly higher mean BAC (0.091) than those who did not use the breathtesting machine (0.067). Seventy four per cent of self-testers had a BAC at or above the legal
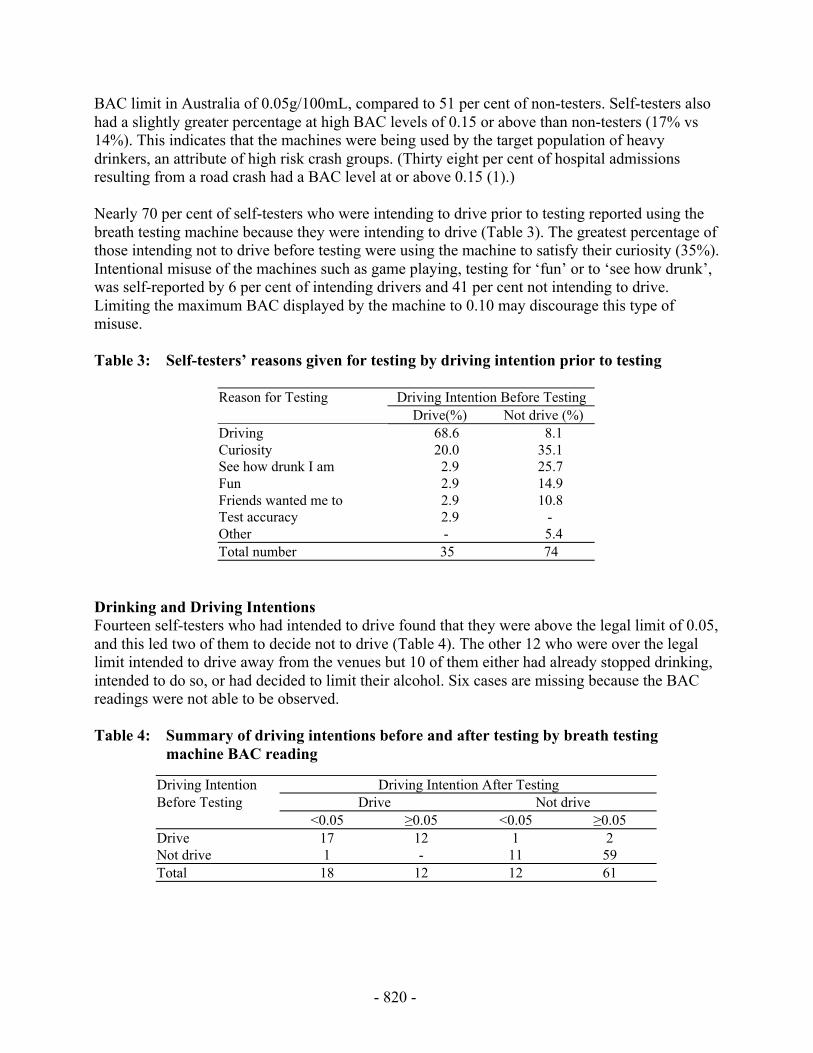
- 820 -
BAC limit in Australia of 0.05g/100mL, compared to 51 per cent of non-testers. Self-testers alsohad a slightly greater percentage at high BAC levels of 0.15 or above than non-testers (17% vs14%). This indicates that the machines were being used by the target population of heavydrinkers, an attribute of high risk crash groups. (Thirty eight per cent of hospital admissionsresulting from a road crash had a BAC level at or above 0.15 (1).)
Nearly 70 per cent of self-testers who were intending to drive prior to testing reported using thebreath testing machine because they were intending to drive (Table 3). The greatest percentage ofthose intending not to drive before testing were using the machine to satisfy their curiosity (35%).Intentional misuse of the machines such as game playing, testing for ‘fun’ or to ‘see how drunk’,was self-reported by 6 per cent of intending drivers and 41 per cent not intending to drive.Limiting the maximum BAC displayed by the machine to 0.10 may discourage this type ofmisuse.
Table 3: Self-testers’ reasons given for testing by driving intention prior to testing
Reason for Testing Driving Intention Before TestingDrive(%) Not drive (%)
Driving 68.6 8.1Curiosity 20.0 35.1See how drunk I am 2.9 25.7Fun 2.9 14.9Friends wanted me to 2.9 10.8Test accuracy 2.9 -Other - 5.4Total number 35 74
Drinking and Driving IntentionsFourteen self-testers who had intended to drive found that they were above the legal limit of 0.05,and this led two of them to decide not to drive (Table 4). The other 12 who were over the legallimit intended to drive away from the venues but 10 of them either had already stopped drinking,intended to do so, or had decided to limit their alcohol. Six cases are missing because the BACreadings were not able to be observed.
Table 4: Summary of driving intentions before and after testing by breath testingmachine BAC reading
Driving Intention Driving Intention After TestingBefore Testing Drive Not drive
<0.05 ≥0.05 <0.05 ≥0.05Drive 17 12 1 2Not drive 1 - 11 59Total 18 12 12 61
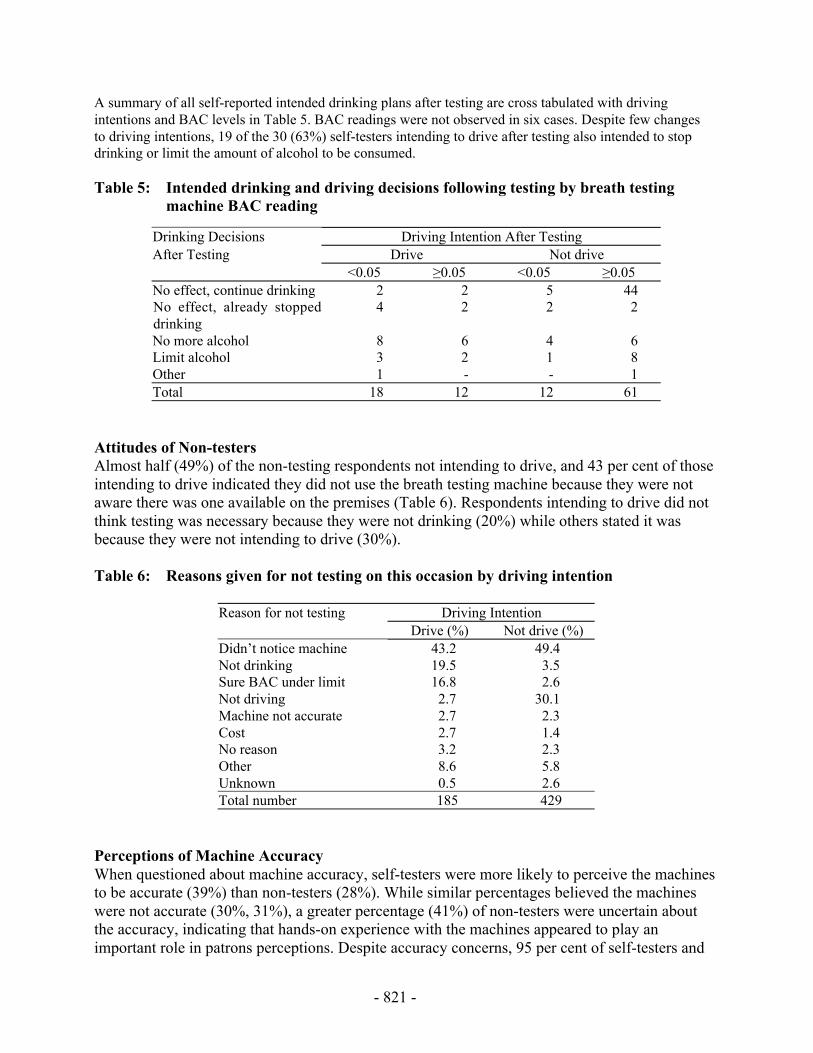
- 821 -
A summary of all self-reported intended drinking plans after testing are cross tabulated with drivingintentions and BAC levels in Table 5. BAC readings were not observed in six cases. Despite few changesto driving intentions, 19 of the 30 (63%) self-testers intending to drive after testing also intended to stopdrinking or limit the amount of alcohol to be consumed.
Table 5: Intended drinking and driving decisions following testing by breath testingmachine BAC reading
Drinking Decisions Driving Intention After TestingAfter Testing Drive Not drive
<0.05 ≥0.05 <0.05 ≥0.05No effect, continue drinking 2 2 5 44No effect, already stoppeddrinking
4 2 2 2
No more alcohol 8 6 4 6Limit alcohol 3 2 1 8Other 1 - - 1Total 18 12 12 61
Attitudes of Non-testersAlmost half (49%) of the non-testing respondents not intending to drive, and 43 per cent of thoseintending to drive indicated they did not use the breath testing machine because they were notaware there was one available on the premises (Table 6). Respondents intending to drive did notthink testing was necessary because they were not drinking (20%) while others stated it wasbecause they were not intending to drive (30%).
Table 6: Reasons given for not testing on this occasion by driving intention
Reason for not testing Driving IntentionDrive (%) Not drive (%)
Didn’t notice machine 43.2 49.4Not drinking 19.5 3.5Sure BAC under limit 16.8 2.6Not driving 2.7 30.1Machine not accurate 2.7 2.3Cost 2.7 1.4No reason 3.2 2.3Other 8.6 5.8Unknown 0.5 2.6Total number 185 429
Perceptions of Machine AccuracyWhen questioned about machine accuracy, self-testers were more likely to perceive the machinesto be accurate (39%) than non-testers (28%). While similar percentages believed the machineswere not accurate (30%, 31%), a greater percentage (41%) of non-testers were uncertain aboutthe accuracy, indicating that hands-on experience with the machines appeared to play animportant role in patrons perceptions. Despite accuracy concerns, 95 per cent of self-testers and
- 822 -
89 per cent of non-testers believed that coin-operated breath testing machines should be morewidely available.
Licensee AttitudesLicensees were generally positive towards the machines, with 44 per cent reporting fromobservation a moderating effect on patrons’ drink driving behaviour, although some (16%) wereconcerned about the accuracy of the machines and game playing. Alcohol sales were seen asbeing reduced due to the machine by only 12 per cent of licensees. Overall, 80 per cent oflicensees were interested in continuing to have a breath testing machine in their venue, although anumber questioned the financial viability of the machines.
DiscussionThe results from this trial indicated that coin-operated hotel breath testing machines were wellreceived by both the hotel patrons and hotel licensees. They appeared likely to have had someeffect in reducing illegal drink driving, although the number of relevant cases observed was verysmall. Of the 14 people who were observed to have registered a blood alcohol reading at or above0.05 and who were intending to drive before testing, two decided not to drive based on their highreading. However, 8 of the remaining 12 altered their drinking pattern in an attempt to lower theirblood alcohol concentration (BAC). Therefore, the machines biggest role appears to be as auseful educational tool in relation to drinking drivers learning when to stop drinking.
The modest change found in driving intention for those above the legal limit of 0.05 may be dueto practical reasons such as not feeling comfortable leaving the vehicle at the venue overnight. Itmust be also noted that these were both stated drinking and driving intentions because it was notpractical in this study to observe actual behaviour.
The availability of coin-operated breath testing machines should be targeted at the groupspotentially benefiting most from knowledge of their BAC - young males with high BAC levels.The demographic characteristics of the self-testers in this study and in previous research (3,4)were similar to those of high crash risk groups (1,2).
Under the negotiated leasing arrangement, the machines were financially self supporting in twolarge metropolitan hotels with young clientele. Selective targeting of these types of venues shouldbe a priority to ensure commercial viability. Innovative financial packages may need to beoffered in other venues to provide an incentive for licensees to install and promote the use of themachines.
References1. Holubowycz OT, Kloeden CN, McLean AJ. Drinking Behaviour and Other Characteristics Of
Injured Drivers and Riders. NHMRC Road Accident Research Unit, University of Adelaide,Adelaide, 1992, Research Report 2/92.
2. McLean AJ, Holubowycz OT, Sandow BL. Alcohol and Crashes: Identification of RelevantFactors in this Association. Road Accident Research Unit, University of Adelaide, Adelaide,1980.

- 823 -
3. Mackiewcz GA. The Efficacy and Educative Value of Coin-operated Breath Testers. RoadTraffic Authority, Hawthorn, Victoria, 1988, Report SR/89/1.
4. Haworth N, Bowland L. Estimation of Benefit-Cost Ratios for Coin-Operated BreathTesting, Monash University Accident Research Centre, Clayton, Victoria, 1995, Report No.82.

- 824 -