preventable blindness in mexico - deloitte · pdf filedeloitte access economics chart 4.1 :...
TRANSCRIPT

The economic cost and burden of eye diseases and preventable blindness in Mexico Novartis Farmaceutica, S.A. de C.V
28 March 2014

Contents Glossary .................................................................................................................................... ii
Executive Summary .................................................................................................................. iv
1 Background: Preventable blindness ............................................................................... 10
2 Prevalence and cost of blindness ................................................................................... 11
2.1 Prevalence of blindness .................................................................................................. 11
2.2 Loss of wellbeing from blindness .................................................................................... 12
2.3 Direct (health care) costs of blindness ............................................................................. 12
2.4 Indirect costs of blindness .............................................................................................. 13
2.5 Total economic costs of blindness ................................................................................... 15
3 Prevalence and cost of eye diseases causing blindness and VI ....................................... 17
3.1 Cataract.......................................................................................................................... 17
3.2 Diabetic retinopathy ....................................................................................................... 19
3.3 Glaucoma ....................................................................................................................... 22
3.4 ‘Wet’ age-related macular degeneration ......................................................................... 24
3.5 Direct costs of eye disease by payer ................................................................................ 26
4 Cost-effective interventions .......................................................................................... 28
4.1 Current implementation of interventions ........................................................................ 28
4.2 Method for assessing cost-effectiveness ......................................................................... 28
4.3 Findings .......................................................................................................................... 30
5 Conclusions and recommendations ............................................................................... 33
References .............................................................................................................................. 35
Appendix A : Technical Appendix ............................................................................................ 38
Detailed methodology ............................................................................................................ 39
Limitation of our work ............................................................................................................... 45
Charts Chart 1.1 : Causes of blindness for selected WHO sub-regions ................................................ 10
Chart 2.1 : Prevalence of blindness in 2013 ............................................................................. 12
Chart 2.2 : Composition of the health system costs of blindness in Mexico (% by eye disease) 13
Chart 2.3 : Total indirect costs of blindness, 2013 .................................................................... 15
Chart 2.4 : Economic costs of blindness (composition) ............................................................ 16
Chart 3.1 : Breakup of the economic costs of cataract in Mexico, 2013 ................................... 19
Chart 3.2 : Breakup of the economic costs of DR in Mexico, 2013............................................ 21
Chart 3.3 : Breakup of the economic costs of glaucoma in Mexico, 2013 ................................. 24
Chart 3.4 : Breakup of the economic costs of wet AMD, 2013 ................................................. 26
Chart 3.5 : Proportion of direct costs of eye disease in Mexico, by payer (%) ........................... 27

. Deloitte Access Economics
Chart 4.1 : Estimated cost saving generated by anti-VEGF treatment, screening diabetic retinopathy, and glaucoma screening*.................................................................................... 32
Tables Table 2.1 : Prevalence of blindness in 2013 ............................................................................. 11
Table 2.2 : Estimated loss of wellbeing from blindness in Mexico, DALYs in 2013 .................... 12
Table 2.3 : Direct costs of blindness by eye disease in Mexico, 2013........................................ 13
Table 2.4 : Estimated productivity losses from blindness in Mexico, 2013 ............................... 14
Table 2.5 : Estimated informal care costs of blindness in Mexico, 2013 ................................... 15
Table 2.6 : Total economic costs of blindness, 2013 ................................................................ 15
Table 3.1 : Prevalence of cataract in Mexico, 2013 .................................................................. 17
Table 3.2 : Estimated loss of wellbeing from cataract, DALYs in 2013 ...................................... 18
Table 3.3 : Direct costs of cataract, 2013 ................................................................................. 18
Table 3.4 : Indirect costs of cataract, 2013 .............................................................................. 19
Table 3.5 : Total economic costs of cataract in Mexico, 2013................................................... 19
Table 3.6 : Prevalence of DR in Mexico 2013 ........................................................................... 20
Table 3.7 : Estimated loss of wellbeing from DR in Mexico, DALYs in 2013............................... 20
Table 3.8 : Direct costs of DR in Mexico, 2013 ......................................................................... 20
Table 3.9 : Indirect costs of DR in Mexico, 2013....................................................................... 21
Table 3.10 : Total economic costs of DR, 2013 ......................................................................... 21
Table 3.11 : Prevalence of glaucoma in Mexico, 2013 .............................................................. 22
Table 3.12 : Estimated loss of wellbeing from glaucoma in Mexico, DALYs in 2013 .................. 22
Table 3.13 : Direct costs of glaucoma, 2013 ............................................................................. 23
Table 3.14 : Indirect costs of glaucoma in Mexico, 2013 .......................................................... 23
Table 3.15 : Total economic costs of glaucoma in Mexico, 2013 .............................................. 23
Table 3.16 : Prevalence of wet AMD in 2013 ........................................................................... 24
Table 3.17 : Estimated loss of wellbeing from wet AMD, DALYs in 2013 .................................. 25
Table 3.18 : Direct costs of wet AMD in Mexico, 2013 ............................................................. 25
Table 3.19 : Indirect costs of wet AMD in Mexico, 2013 .......................................................... 26
Table 3.20 : Total economic costs of wet AMD, 2013............................................................... 26
Table 4.1 : Availability of eye screening programs in Mexico ................................................... 28
Table 4.2 : Cost-effectiveness studies identified for four interventions to prevent blindness ... 29
Table 4.3 : Estimated effectiveness and cost effectiveness of cataract screening, retinal screening, glaucoma screening and anti-VEGF treatment, 2013 ............................................................... 30
Table 5.1 : Estimated cost-effectiveness of interventions (a) ................................................... 33

. Deloitte Access Economics
Table A.1 : Visual acuity conversion based on different measures ........................................... 38
Table A.2 : Causes of blindness by WHO subregion (% of total blindness) ................................ 39
Table A.3 : Weighted non-blind disability weights by eye condition ......................................... 41
. Deloitte Access Economics
Glossary AMD Age-related macular degeneration
BCVA Best corrected visual acuity
CPI Consumer Price Index
DAE Deloitte Access Economics
DALY Disability-adjusted life year
DM Diabetes mellitus
DR Diabetic retinopathy
DRG Diagnostic Related Group
EBU European Blind Union
EEA European Economic Area
EMA European Medicines Agency
ENSANUT Encuesta Nacional de Salud y Nutrición (National Health and Nutrition Survey) 2012
EU European Union
GBD Global Burden of Disease
GDP Gross Domestic Product
GP General Practitioner
HRG Hospital-Related Groups
ICER Incremental cost effectiveness ratio
ILO International Labor Organization
MEX$ Mexican pesos
NCBI National Council for the Blind of Ireland
NVAMD Neovascular age-related macular degeneration
OECD Organisation for Economic Cooperation and Development
OOP Out-of-pocket
PPP Purchasing Power Parity
QALY Quality Adjusted Life Year
T2DM Type 2 diabetes mellitus
UK United Kingdom
UN United Nations
V2020 Vision 2020
VEGF Vascular endothelial growth factor
VI Visual impairment

. Deloitte Access Economics
VYG Vision years gained
WHO World Health Organisation
YLD Year of healthy life lost due to disability
YLL Year of life lost due to premature death
iv Deloitte Access Economics
Executive Summary Blindness and eye disease impose a significant personal and economic burden on individuals and society. Early intervention can prevent a substantial number of cases, resulting in improved wellbeing and economic savings.
Deloitte Access Economics (DAE) has analysed the economic impact and burden of four eye diseases and blindness in nine countries initially (Australia, Canada, France, Germany, Italy, Poland, Slovakia, Spain, and the UK) and the cost-effectiveness of interventions to prevent eye disease and blindness. Subsequently the analysis has been expanded to an additional seven countries:
Denmark;
Ireland;
Japan;
Mexico;
Sweden;
Switzerland; and
Turkey.
A detailed literature search was conducted to identify local prevalence, costing and cost-effectiveness data and studies for each country. Studies were given preference if they were local population-based studies. Due to variable study quality and availability of local data, extrapolation was used in some instances from one country to another. A disease-cost burden analysis and assessment of intervention cost-effectiveness was then conducted for each country. The Technical Appendix (Appendix A) details the assumptions and methods used in this report. This report presents estimates for Mexico.
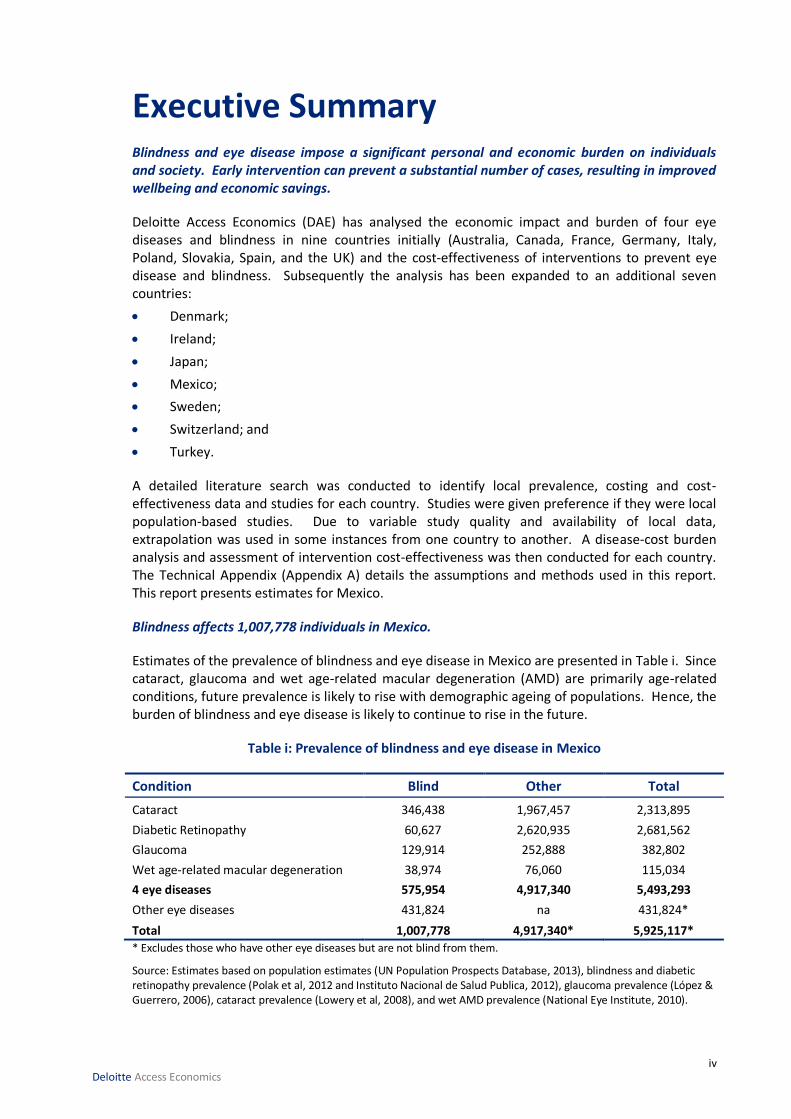
Blindness affects 1,007,778 individuals in Mexico.
Estimates of the prevalence of blindness and eye disease in Mexico are presented in Table i. Since cataract, glaucoma and wet age-related macular degeneration (AMD) are primarily age-related conditions, future prevalence is likely to rise with demographic ageing of populations. Hence, the burden of blindness and eye disease is likely to continue to rise in the future.
Table i: Prevalence of blindness and eye disease in Mexico
Condition Blind Other Total
Cataract 346,438 1,967,457 2,313,895
Diabetic Retinopathy 60,627 2,620,935 2,681,562
Glaucoma 129,914 252,888 382,802
Wet age-related macular degeneration 38,974 76,060 115,034
4 eye diseases 575,954 4,917,340 5,493,293
Other eye diseases 431,824 na 431,824*
Total 1,007,778 4,917,340* 5,925,117*
* Excludes those who have other eye diseases but are not blind from them.
Source: Estimates based on population estimates (UN Population Prospects Database, 2013), blindness and diabetic retinopathy prevalence (Polak et al, 2012 and Instituto Nacional de Salud Publica, 2012), glaucoma prevalence (López & Guerrero, 2006), cataract prevalence (Lowery et al, 2008), and wet AMD prevalence (National Eye Institute, 2010).

v Deloitte Access Economics
Blindness and eye disease impose reduced quality of life and suffering for individuals affected due to disability and injury, a type of ‘intangible cost’. These are measured in disability-adjusted life years (DALYs).
A substantial amount of DALYs are estimated to result from blindness and eye disease in Mexico. Annual DALYs from blindness and eye disease are presented in Table ii.
Table ii: Loss of wellbeing from blindness and eye disease in Mexico
Prevalence DALYs
Blindness 433,344
Cataract 155,003
Diabetic Retinopathy 55,106
Glaucoma 60,577
Wet age-related macular degeneration 26,056
Source: Estimates based on sources in Table i and Stouthard et al (1997).
Loss of wellbeing from specific eye diseases is presented in Chart i. Cataract imposes the largest loss of wellbeing in Mexico. This is due to the significant number of people with blindness from cataract in Mexico.
Chart i: Loss of wellbeing from eye disease (in DALYs)
Vision impairment and blindness from eye disease impose not only lost quality of life and wellbeing for individuals affected, but also a significant economic burden on society.
Blindness is estimated to result in substantial annual economic costs in Mexico of around €434.3 million1, with informal care costs accounting for three quarters (77%) of the total. Chart ii shows the breakdown of the total economic cost by direct health care costs, productivity losses and informal care costs.
1 Direct cost estimates using Barcelo et al (2003), Secretaria De Salud 2012, Lazcano-Gomez (2013), Guedes (2011), Kara-Junior (2010), and exchange rates from Bloomberg. Productivity estimates using Census de Poblacion y Vivienda 2010, general employment rate from ILO (2013a); average annual earnings from ILO (2013b), and tax rates from OCED (2013a). Informal care estimates using informal care hours from Ngenda et al (2007); average hourly earnings from ILO (2013b) and general population employment from ILO (2013a). See section 2 of the report for further information.

vi Deloitte Access Economics
Chart ii: Economic cost of blindness2
Source: Estimates based on sources in footnote 1.
The annual economic costs resulting from the eye diseases studied – cataract, diabetic retinopathy (DR), glaucoma and wet age-related macular degeneration (AMD) – are presented in Chart iii by eye disease. It is estimated that the economic cost of eye disease in Mexico are €463.7 million in 20133. Wet AMD has the highest economic cost of all eye diseases, with costs for cataract and diabetic retinopathy being roughly comparable.
Chart iii: Economic cost of eye disease (cataract, DR, glaucoma, wet AMD)
Source: Estimates based on sources in footnote 1.
With today’s knowledge and technology, the World Health Organisation (WHO) estimates that around 80% of global blindness is avoidable using cost-effective interventions (WHO, 2010).
2 The economic cost is composed of direct costs (healthcare costs), productivity losses and costs of informal care.
Productivity losses are estimated using lower than average employment rates for blind people (employment gaps), under a human capital approach. Informal care costs are estimated using an opportunity cost method (value of forgone carer earnings). These methods are further outlined in Appendix A.
3 Costs based on the sources listed in footnote 1.
5%
17%
78%
Direct costs Productivity losses Informal care costs
39%
33%
15%
13%
Cataract DR Glaucoma Wet AMD

vii Deloitte Access Economics
WHO also estimates that the two main causes of visual impairment in the world are uncorrected refractive errors and cataract.
Dilated eye evaluation for the detection of cataracts (and AMD and glaucoma) is estimated to be a highly cost-effective intervention, with estimated incremental cost-effectiveness ratios (ICERs) well below estimated Gross Domestic Product (GDP) per capita per quality adjusted life year (QALY) in Mexico (the WHO (2013a) threshold for high cost effectiveness).
Screening for DR in people with type 2 diabetes mellitus (T2DM) is also a cost-effective intervention in Mexico.
Treatment with ranibizumab for wet AMD is a cost-effective intervention for preventing blindness associated with wet AMD (estimated ICERs are again below the cost-effectiveness thresholds of three times GDP per capita). Additionally, reviewed literature is likely to underestimate the long-term benefits associated with ranibizumab use, due to limited-duration study lengths.
A technician-led glaucoma screening program for those aged 40 and older may not be a cost effective intervention if population prevalence is less than 4%. However, glaucoma screening concurrently with cataract and AMD screening through dilated eye evaluation is a highly cost effective intervention, as identified above.
Table iii: Estimated cost-effectiveness of interventions (a)
Country Screening for
cataract Screening for DR Screening for
glaucoma Treatment with
ranibizumab for wet AMD
Mean ICER
CE rating*
Mean ICER
CE rating*
Mean ICER
CE rating*
Mean ICER
CE rating*
Mexico 3,796 HCE 6,794 CE to HCE
23,640 CE to NCE
11,233 CE to HCE
(a) Where ICER = cost (€) per QALY gained. * Against WHO cost-effectiveness thresholds: CE = cost effective, HCE = highly cost effective and NCE = not cost
effective.
Estimates of vision years gained (VYG)4 from implementation of these interventions are presented for Mexico in Table iv.
Table iv: Vision years gained from implementation of interventions
Country DR screening Screening for glaucoma Treatment with ranibizumab for wet AMD
VYG range VYG VYG range
Mexico 71,783; 154,282 25,393 7,592; 17,945
Detecting eye disease early can prevent blindness, thereby averting disability burden with substantial economic savings.
Estimated economic costs of the four eye diseases averted by implementing the interventions across countries are presented in Chart iv5. This shows potentially substantial economic savings are achievable through aversion of blindness.
4 An increase in the number of years living without severe visual impairment following the intervention over a one year
time period. 5 The total economic costs of eye disease in these charts exclude existing expenditure on anti-VEGF treatment for wet
AMD.

viii Deloitte Access Economics
Chart iv: Estimated cost saving generated by screening DR, glaucoma screening and anti-VEGF treatment
Estimates based on Rein (2012), Maberley (2003), Facey (2002), Vijan (2000), Soria-Cedillo (2008), Burr et al (2007), Hernandez (2008), and Vaahtoranta-Lehtonen (2007).
Since the completion of this report, a new study specifically for the treatment of Wet AMD for adults over 40 years in Mexico was published (Arreola-Ornelas et al, 2014). This study is particularly relevant as it considered the standard treatment method in Mexico (verteporfin) in comparison to ranibizumab. Significantly, it finds that in Mexico ranibizumab was the dominant option in comparison to vertoporfin, with incremental QALY gains of 0.2811 (0.426 for ranibizumab compared to 0.1449 for verteporfin) at lesser cost (MXN79,337.05 to MXN156,788.58 respectively). It concluded with an ICER per percentage point gain in quality of life of -MXN2,754.53/-€1556.
Blindness and eye disease impose substantial lost wellbeing and economic costs, and should be a public health priority. Cost-effective interventions should be promoted to reduce the burden on individuals and society.
Prevention of blindness and eye disease through investment in cost-effective interventions will lead to:
healthier populations;
6 While the ICER per percentage point gain in quality of life differs to mean ICER reported in Table iii, it would be considered more cost effective than what is reported in Table iii.

ix Deloitte Access Economics
reduced health care costs and burden on health budgets;
a healthier tax-paying workforce and lower productivity losses;
reduced costs and burden to informal care givers (informal care costs); and
improved wellbeing, quality of life and productivity for individuals and longer working lives
Deloitte Access Economics

10 Deloitte Access Economics
1 Background: Preventable blindness Blindness imposes physical, social, financial and quality-of-life limitations on individuals affected. Blindness also results in economic burden and social impacts on society due to expenditures on health care treatment, productivity losses from employment impacts, costs of providing formal and informal care, and lost wellbeing. With today’s knowledge and technology, the WHO estimates that around 80% of global blindness is avoidable using cost-effective interventions (WHO, 2010).
Blindness imposes a substantial global economic burden, as well as significant loss of wellbeing in affected individuals due to reduced quality of life and disability. The WHO notes that age-related blindness as well as blindness related to diabetes continues to increase throughout the world (WHO, 2013b).
Blindness and visual impairment (VI) can be broadly defined as a limitation in one or more functions of the eye or visual system, most commonly impairment of visual acuity (sharpness/ clarity of vision), visual fields (the ability to detect objects to either side, above or below the direction in which the person is looking), contrast sensitivity and colour vision.
Cataract is the leading cause of blindness globally, accounting for nearly half of all blindness (Resnikoff et al, 2004). This is followed by glaucoma, which accounts for 12% of all blindness globally. However, causes of blindness differ across different regions in the world, and between developing and developed countries. Chart 1.1 presents causes of blindness by selected WHO subregion. The four eye diseases of cataract, glaucoma, DR and AMD account for nearly three quarters of all blindness globally.
Chart 1.1: Causes of blindness for selected WHO sub-regions
Source: Resnikoff et al (2004) Note: EUR-A region includes Denmark, Ireland, Switzerland and Sweden; AMR-B region includes Mexico; WPR-A region includes Japan; and EUR-B1 region includes Turkey.
0%
10%
20%
30%
40%
50%
60%
70%
80%
90%
100%
EUR-A AMR - B WPR-A EUR-B1
Cataract Glaucoma AMD Corneal opacities Diabetic retinopathy Childhood blindness Trachoma Others

11 Deloitte Access Economics
2 Prevalence and cost of blindness The estimated prevalence of blindness across countries in 2013 and its associated economic costs and lost wellbeing are presented in this chapter. A prevalence approach to costing measures the number of people with a given condition (in this case, blindness) in a base period (in this case, calendar year 2013), and the costs of treating them, as well as other financial and non-financial costs (productivity losses, carer burden, loss of wellbeing) in that year, due to the condition. All methodological details are presented in the Technical Appendix to this report, Appendix A. For Mexico, a number of assumptions were required due to a lack of local data. If local data is not collected in the future, there will continue to be weakness in assessing any estimate of the state of health related to eye diseases and in tracking the progress of treatment in Mexico.
2.1 Prevalence of blindness Blindness prevalence has been estimated quantitatively according to local definitions and/or based on availability of country-specific prevalence data and definitions included therein.
Legal definitions of blindness and VI differ across countries, for example, for driver licensing requirements and disability pension eligibility (Bron et al, 2010). The WHO defines low vision as best-corrected visual acuity (BCVA) of <6/18 and blindness as BCVA of <3/60. The WHO definitions align with International statistical classification of diseases, injuries and causes of death 10th revision (ICD-10-AM). VI and blindness can differ from one eye to the other, with prevalence rates reported for either the better or the worse eye in terms of the extent of VI7.
The local definition and the definition used to estimate blindness prevalence in Mexico is <3/60 (Polack et al 2012). A table of visual acuity conversions using different measures is presented in Appendix A.
The estimated prevalence of blindness in 2013 in Mexico is presented in Table 2.1.
Table 2.1: Prevalence of blindness in 2013
Estimated population, 2013 (i)
Blindness prevalence
(ii)
Blindness prevalence rate
(ii)/(i) x 100
Sources for blindness prevalence rates
number number %
122,332,399 1,007,778 0.82 Polack et al (2012) Source: DAE using UN Population Prospects Database (2013) and prevalence sources noted in the last column.
The estimated prevalence of blindness in 2013 in Mexico with respect to the other countries in the scope of this study is presented in Chart 2.1.
7 This report presents blindness prevalence estimates in accordance with local definitions of blindness, or with definitions in available prevalence data.

12 Deloitte Access Economics
Chart 2.1: Prevalence of blindness in 2013
Source: DAE using UN Population Prospects Database (2013) and prevalence sources noted in the last column of Table 2.1.
2.2 Loss of wellbeing from blindness
‘Burden of disease’ refers to the intangible costs of disability and loss of wellbeing from VI and blindness, which result in a reduced quality of life. DALYs are the primary non-financial metric used by the WHO and other organisations for quantifying the burden of disease, and measure the suffering and premature death from illness or injury8. The DALY approach has been successful in avoiding the subjectivity of individual valuations and overcomes problems of comparability between individuals/nations, as compared to the QALY approach. The estimates below quantify the total burden of disease from morbidity associated with VI and blindness9. A disability weight of 0.43 for severe VI (blindness) from Stouthard et al (1997) was applied to total prevalence of blindness to estimate total loss of wellbeing in DALYs (see Appendix A). Estimates are presented in Table 2.2.
In Mexico, a total of 433,344 DALYs were lost as a result of blindness in 2013.
Table 2.2: Estimated loss of wellbeing from blindness in Mexico, DALYs in 2013
Blindness prevalence (i) Blindness disability weight (ii) Total DALYs from blindness (i) x (ii)
number weight DALYs 1,007,778 0.43 433,344
Source: DAE using UN Population Prospects Database (2013), Stouthard et al (1997) and prevalence sources noted in the last column of Table 2.1.
2.3 Direct (health care) costs of blindness
The direct financial costs of blindness are those incurred within the health care system in each country, by the government or other payers (including patients), as a result of treatment. Direct
8 A DALY of 0 represents a year of perfect health, while a DALY of 1 represents a year dead. Other health states are attributed values between 0 and 1 as assessed by experts on the basis of published quality of life data for various health states. A disability weight of 0.43 for blindness can be interpreted as a 43% reduction in a person’s quality of life relative to perfect health.
9 Morbidity equates to years of healthy life lost due to disability (YLDs), which is one of two components of DALYs, the other being years of life lost due to premature mortality (YLL). The estimates in this report assume no mortality specifically due to blindness and eye disease. Past DAE research has revealed additional mortality risk due to blindness is negligible after adjusting for confounding factors.
0.00%
0.10%
0.20%
0.30%
0.40%
0.50%
0.60%
0.70%
0.80%
0.90%
Turkey Denmark Ireland Japan Mexico Sweden Switzerland
0
200,000
400,000
600,000
800,000
1,000,000
1,200,000
Blind prevalence Blind prevalence rate

13 Deloitte Access Economics
financial costs to a country’s health system include the relevant proportion of the costs of hospitalisation (buildings, care and consumables), general practice (GP) and specialist medical services, the cost of prescription pharmaceuticals and other medications, allied health services, research and other costs. The direct costs of blindness were estimated specifically for the conditions of cataract, DR, glaucoma and wet AMD. The methodology for estimating total disease specific direct costs, including costs for those who are blind with each disease, is described in detail in the Technical Appendix (Appendix A).
The total direct financial costs of blindness by eye disease in Mexico are presented in Table 2.3, including the cost per blind person.
Table 2.3: Direct costs of blindness by eye disease in Mexico, 2013
Cataract DR Glaucoma Wet AMD Total Cost per blind person
€ million € million € million € million € million € per blind person 2.65 2.8 2.2 14.7 22.3 39
Source: DAE using Barcelo et al (2003), Secretaria De Salud 2012, Lazcano-Gomez (2013), Guedes (2011), Kara-Junior (2010) and exchange rates from Bloomberg
Chart 2.2 presents health system costs of blindness, by eye disease, in Mexico. Of the €22.3 million in health system costs, treatment for wet AMD comprises the bulk at 66%.
Chart 2.2: Composition of the health system costs of blindness in Mexico (% by eye disease)
Source: DAE using sources noted for Table 2.3.
2.4 Indirect costs of blindness
Blindness imposes financial impacts on society more broadly, outside the health care system. These impacts are referred to in this report as ‘indirect costs’.
In this study, the following indirect costs of blindness were estimated:
productivity losses from reduced labour market participation through lower employment associated with blindness; and
the costs to informal carers from providing care to someone with blindness.
11.9%
12.4%
9.8%
66.0%
Cataract DR Glaucoma Wet AMD

14 Deloitte Access Economics
2.4.1 Productivity losses and employment impacts
Blindness impacts the employment situation of individuals affected. People with lower levels of vision have reported having lower job satisfaction, less freedom to decide their employment situation, less opportunities to develop new skills, less support and recognition, and fears that their health may limit their ability to work until regular retirement age (Mojon-Azzi et al, 2010).
People who are blind also face lower than the average employment rates of the general population, and consequently, experience a loss of earnings that, together with associated taxation losses, comprise productivity losses from blindness. Revenue to the government is lost due to potential income tax and potential indirect tax foregone (sales tax). The latter is lost because, as income falls, so does consumption of goods and services.
In this report, productivity losses are estimated using the lower than average employment rates for blind people10. The calculation of productivity losses was restricted to blind people of working age (15-64 years) across countries. Appendix A details the method used to estimate productivity losses from the lower employment participation of blind people.
Employment gaps and estimated productivity losses from blindness are presented in Table 2.4. Taxation rates (income and value-added) (OECD, 2013a) were applied to estimate lost taxation accruing to the government. The taxes included were income tax; reported at 5.7% and indirect tax; reported at 16%. The employment rate of the general population in Mexico is estimated to be 9% higher than that of people who are blind, amounting to a total of €74.5 million in lost productivity.
Table 2.4: Estimated productivity losses from blindness in Mexico, 2013
Blind people’s employment rate
(i)
General
population employment rate
(ii)
Employment rate gap
1-(i)/(ii)
Average annual
earnings
Total productivity
losses
Lost taxation to
government
% % % € € million € million
53 58 9 4,223 74.5 16.2
Source: DAE using Census de Poblacion y Vivienda 2010, general employment rate from ILO (2013a); average annual earnings from ILO (2013b), and tax rates from OCED (2013a).
2.4.2 Informal care costs
Provision of day-to-day care and support for blind people is often provided by family carers and friends. In many countries, society and the public health and welfare sector rely heavily on the support that these carers provide. Care provided by family and friends is referred to as informal care. Informal care is distinguishable from formal care as it is provided free of charge and not regulated by the government. However, opportunity costs accrue in the provision of informal care, as it is not free in an economic sense. Time spent caring for a blind person is time that cannot be directed to other activities such as paid work, unpaid work or leisure.
The method for estimation of informal care costs, based on earnings foregone in paid work, is detailed in Appendix A. Total annual costs of informal care for those with blindness, and associated lost taxation accruing to the government from carer earnings foregone, are presented
10 Productivity losses may also occur as a result of higher absenteeism, and lower productivity at work (‘presenteeism costs’). However, these components could not be estimated due to lack of available data for countries. Thus, productivity losses presented in this report are conservative, and do not reflect the full magnitude of lost productivity from blindness.

15 Deloitte Access Economics
in Table 2.5. Informal care cost €337.5 million in 2013 and the government lost an estimated €73.4 million in taxation revenue forgone.
Table 2.5: Estimated informal care costs of blindness in Mexico, 2013
Annual informal care hours per blind person
(i)
Blindness prevalence
(ii)
Average hourly
earnings
(iii)
General population
employment
(iv)
Total informal care
costs
(i) x (ii)
x (iii) x (iv)
Lost tax to government
hours number € % € million € million
316.68 1,007,778 1.83 58 337.5 73.4 Source: DAE using informal care hours from Ngenda et al (2007); average hourly earnings from ILO (2013b); general population employment from ILO (2013a).
The components of total indirect costs of blindness in 2013 are graphically presented in Chart 2.3. Informal care costs comprise the bulk of indirect costs in Mexico (82%).
Chart 2.3: Total indirect costs of blindness, 2013
Source: DAE using sources noted for Table 2.4 and Table 2.5.
2.5 Total economic costs of blindness
The total economic costs of blindness (i.e. the direct and indirect costs combined) in 2013 in Mexico are presented by cost component in Table 2.6. The total economic cost of blindness is estimated to be approximately €434.3 million in 2013 in Mexico. This amounts to a direct cost per person who is blind because of the four eye diseases of €39 and an indirect cost of a person who is blind of €409 in 2013.
Table 2.6: Total economic costs of blindness, 2013
Direct costs Productivity losses Informal care Total costs Direct cost per blind person
Indirect cost per blind person
€ million € million € million € million € € 22.3 74.5 337.5 434.3 39 409
Source: DAE using all sources previously mentioned.

16 Deloitte Access Economics
Note: Direct costs of blindness are calculated as the total direct cost of blindness caused by the four eye diseases, whereas indirect costs of blindness include blindness due to other causes as well as the four eye diseases.
The economic costs of blindness are graphically presented in Chart 2.4. This shows the composition of economic costs of blindness. Informal care costs comprise three quarters (75%) of the economic costs of blindness, since treatment rates are relatively low in comparison to other countries (which impacts on productivity losses and informal care).
Chart 2.4: Economic costs of blindness (composition)
Source: DAE using all sources previously mentioned.
9%
16%
75%
Direct costs Productivity Informal care
17 Deloitte Access Economics
3 Prevalence and cost of eye diseases causing blindness and VI This chapter reports the estimated prevalence and associated economic costs of four eye diseases which cause a substantial level of blindness and VI globally: cataract, DR, glaucoma and wet AMD.
The prevalence of cataract, glaucoma and wet AMD has been estimated for those aged 50 years and older, as these conditions are primarily age-related. DR prevalence has been estimated for those aged 18 years and older, as both type 1 and type 2 diabetes and their associated complications can occur in younger age groups. Details on the methodology for estimating eye disease prevalence are presented in Appendix A.
It should be noted that the standard of care for AMD and cataract has changed greatly over the last decade, and this may have some impact on prevalence rates in populations with these conditions. While the most recent country-specific studies have been used to estimate prevalence, this point should be considered in interpreting AMD and cataract prevalence estimates, which are indicative.
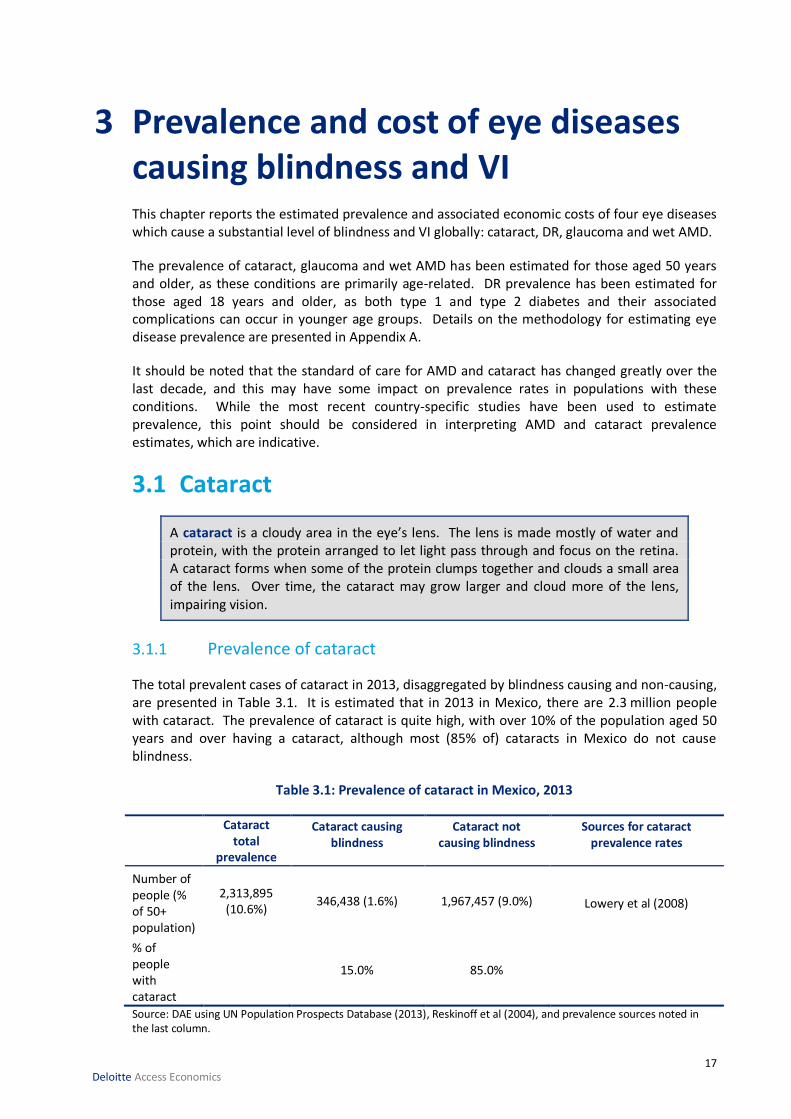
3.1 Cataract
A cataract is a cloudy area in the eye’s lens. The lens is made mostly of water and protein, with the protein arranged to let light pass through and focus on the retina. A cataract forms when some of the protein clumps together and clouds a small area of the lens. Over time, the cataract may grow larger and cloud more of the lens, impairing vision.
3.1.1 Prevalence of cataract
The total prevalent cases of cataract in 2013, disaggregated by blindness causing and non-causing, are presented in Table 3.1. It is estimated that in 2013 in Mexico, there are 2.3 million people with cataract. The prevalence of cataract is quite high, with over 10% of the population aged 50 years and over having a cataract, although most (85% of) cataracts in Mexico do not cause blindness.
Table 3.1: Prevalence of cataract in Mexico, 2013
Cataract total
prevalence
Cataract causing blindness
Cataract not causing blindness
Sources for cataract prevalence rates
Number of people (% of 50+ population)
2,313,895 (10.6%)
346,438 (1.6%) 1,967,457 (9.0%) Lowery et al (2008)
% of people with cataract
15.0% 85.0%
Source: DAE using UN Population Prospects Database (2013), Reskinoff et al (2004), and prevalence sources noted in the last column.

18 Deloitte Access Economics
3.1.2 Loss of wellbeing from cataract
Loss of wellbeing from cataract causing blindness was estimated by applying the disability weight for severe vision loss of 0.43 from the Netherlands study (Stouthard et al, 1997) to the number of people blind from cataract.
A combined disability weight of 0.05 for mild/moderate VI from cataract was applied to estimated mild and moderate VI cases from cataract to estimate loss of wellbeing from non-blinding cataract (see Appendix A: Table A.3). Estimates of lost wellbeing from cataract are presented in Table 3.2.
In Mexico, it is estimated that a total of 155,003 DALYs were lost as a result of cataract in 2013, with the majority (148,969 DALYs) resulting from cataract causing blindness.
Table 3.2: Estimated loss of wellbeing from cataract, DALYs in 2013
DALYs from blindness from cataract
Other DALYs from cataract
Total DALYs from cataract
DALYs DALYs DALYs 148,969 6,034 155,003
Source: DAE using Access Economics (2009), Resnikoff et al (2004), Stouthard et al (1997), UN Population Prospects Database (2013) and sources noted for Table 3.2.
3.1.3 Direct costs from cataract
The only effective treatment for cataract is surgery (Mayo Clinic, 2013). The surgery removes the cloudy lens and replaces it with a substitute lens. The direct costs of cataract were estimated by multiplying the estimated volume of cataract surgeries in Mexico by the country-specific cost of surgery. Estimates for the direct costs of cataract are presented in Table 3.3.
In Mexico, the total direct cost of cataract is estimated to be €17.7 million in 2013, with an estimated cost per prevalent case of €8.
Table 3.3: Direct costs of cataract, 2013
Estimated cost per
case
Estimated number of
cataract surgeries
Total direct
costs of surgery
Protection Fund Against
Catastrophic Expenditures (annual cost)
Total direct costs of cataract
Sources used to estimate cost per
surgery
€ Number € million € million € million
211 79,393 16.8
0.9 17.7 Kara-Junior et al (2010), Secretaria De Salud (2012).
Source: DAE using OECD (2013b), UN Population Prospects Database (2013) and cost sources noted in last column.
3.1.4 Indirect costs from cataract
The indirect costs of cataract were estimated by attributing a portion of total productivity losses and informal care costs of blindness (Section 2.4) to cataract using WHO health region specific fractions from Resnikoff et al (2004). Informal care costs comprise the majority of costs.

19 Deloitte Access Economics
Table 3.4: Indirect costs of cataract, 2013
Productivity losses Informal care costs Total indirect costs
€ million € million € million 29.8 135.0 164.8
Source: DAE using sources noted previously.
3.1.5 Total costs of cataract
The total economic cost of cataract in Mexico is presented in Table 3.5. The breakup of costs is graphically presented in Chart 3.1. Informal care costs comprise the majority of costs from cataract in Mexico (74%), followed by productivity costs (16%). The cost per person with cataract in Mexico is estimated to be approximately €79.
Table 3.5: Total economic costs of cataract in Mexico, 2013
Direct costs Productivity losses Informal care Total costs Cost per person with cataract
€ million € million € million € million € 17.7 29.8 135.0 182.5 79
Source: DAE using sources previously mentioned.
Chart 3.1: Breakup of the economic costs of cataract in Mexico, 2013
Source: DAE using sources previously mentioned.
3.2 Diabetic retinopathy
DR occurs when diabetes mellitus (DM) damages the tiny blood vessels inside the retina. This usually affects both eyes. At first, micro-aneurysms occur. As the disease progresses, some blood vessels that nourish the retina are blocked.
3.2.1 Prevalence of DR
The total prevalent cases of DR in 2013, disaggregated by those who are blind and those not blind, are presented in Table 3.6. A total of 2.7 million people were estimated to have DR, or 3.3% of the total population aged 18 years and over. Of these, 2.3% were blind, or 60,627 people.
10%
16%
74%
Direct costs Productivity Informal care
20 Deloitte Access Economics
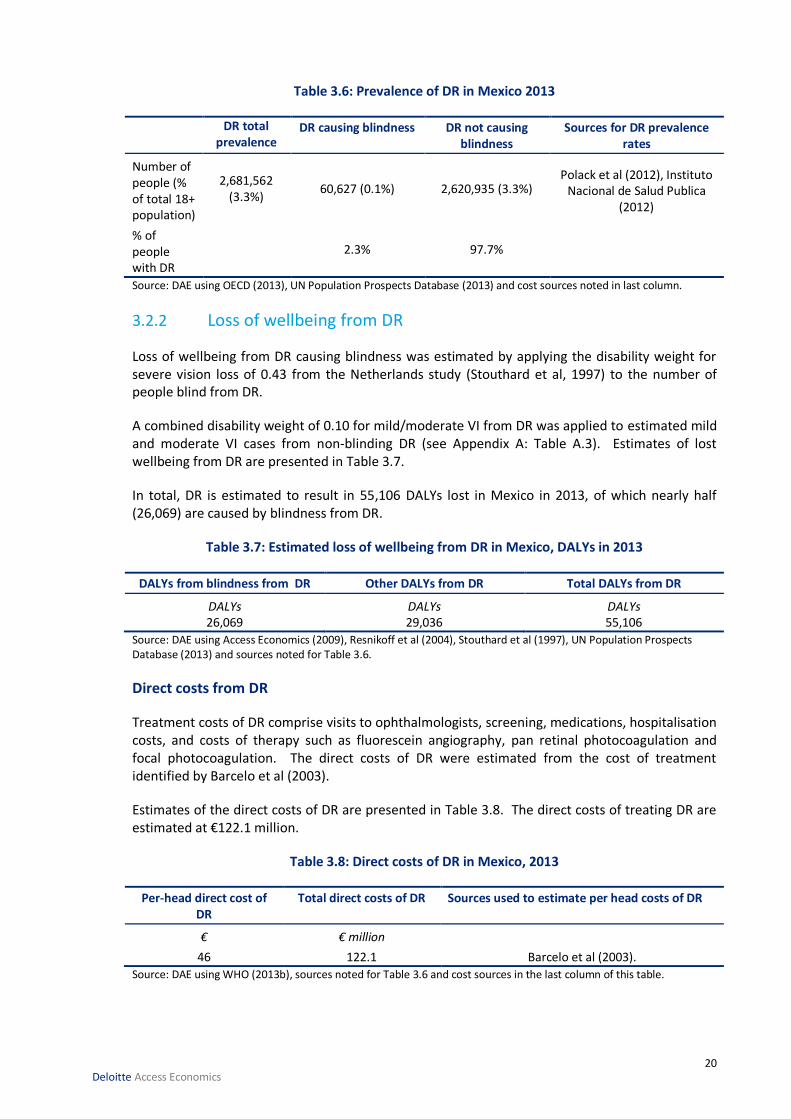
Table 3.6: Prevalence of DR in Mexico 2013
DR total prevalence
DR causing blindness DR not causing blindness
Sources for DR prevalence rates
Number of people (% of total 18+ population)
2,681,562 (3.3%)
60,627 (0.1%) 2,620,935 (3.3%) Polack et al (2012), Instituto
Nacional de Salud Publica (2012)
% of people with DR
2.3% 97.7%
Source: DAE using OECD (2013), UN Population Prospects Database (2013) and cost sources noted in last column.
3.2.2 Loss of wellbeing from DR
Loss of wellbeing from DR causing blindness was estimated by applying the disability weight for severe vision loss of 0.43 from the Netherlands study (Stouthard et al, 1997) to the number of people blind from DR.
A combined disability weight of 0.10 for mild/moderate VI from DR was applied to estimated mild and moderate VI cases from non-blinding DR (see Appendix A: Table A.3). Estimates of lost wellbeing from DR are presented in Table 3.7.
In total, DR is estimated to result in 55,106 DALYs lost in Mexico in 2013, of which nearly half (26,069) are caused by blindness from DR.
Table 3.7: Estimated loss of wellbeing from DR in Mexico, DALYs in 2013
DALYs from blindness from DR Other DALYs from DR Total DALYs from DR
DALYs DALYs DALYs 26,069 29,036 55,106
Source: DAE using Access Economics (2009), Resnikoff et al (2004), Stouthard et al (1997), UN Population Prospects Database (2013) and sources noted for Table 3.6.
Direct costs from DR
Treatment costs of DR comprise visits to ophthalmologists, screening, medications, hospitalisation costs, and costs of therapy such as fluorescein angiography, pan retinal photocoagulation and focal photocoagulation. The direct costs of DR were estimated from the cost of treatment identified by Barcelo et al (2003).
Estimates of the direct costs of DR are presented in Table 3.8. The direct costs of treating DR are estimated at €122.1 million.
Table 3.8: Direct costs of DR in Mexico, 2013
Per-head direct cost of DR
Total direct costs of DR Sources used to estimate per head costs of DR
€ € million
46 122.1 Barcelo et al (2003).
Source: DAE using WHO (2013b), sources noted for Table 3.6 and cost sources in the last column of this table.

21 Deloitte Access Economics
3.2.3 Indirect costs from DR
The indirect costs of DR were estimated by attributing a portion of total productivity losses and informal care costs of blindness (Section 2.4) to DR using WHO health region specific fractions from Resnikoff et al (2004) (Appendix A)11.
In Mexico, total indirect costs associated with DR were estimated to amount to €28.8 million, with the majority (€23.6 million) being informal care costs.
Table 3.9: Indirect costs of DR in Mexico, 2013
Productivity losses Informal care costs Total indirect costs
€ million € million € million 5.2 23.6 28.8
Source: DAE using sources previously mentioned.
3.2.4 Total costs of DR
The total economic cost of DR is presented in Table 3.10. The breakup of costs is graphically presented in Chart 3.2. The majority (81%) of costs for DR in Mexico are direct costs.
Table 3.10: Total economic costs of DR, 2013
Direct costs Productivity losses Informal care Total costs Cost per person with DR
€ million € million € million € million € 122.1 5.2 23.6 150.9 56
Source: DAE using sources previously mentioned.
Chart 3.2: Breakup of the economic costs of DR in Mexico, 2013
Source: DAE using sources previously mentioned.
11 Indirect costs are reasonably assumed to relate to the onset of blindness rather than the underlying eye diseases per se.
81%
3%
16%
Direct costs Productivity Informal care

22 Deloitte Access Economics
3.3 Glaucoma
Glaucoma is a group of diseases that can lead to damage to the eye’s optic nerve and result in VI and blindness. Open-angle glaucoma, the most common type, occurs when, for largely unknown reasons, fluid passes too slowly through the meshwork drain of the anterior chamber in the front of the eye. As the fluid builds up, the pressure inside the eye rises. Unless the pressure at the front of the eye is controlled, it can damage the optic nerve and cause VI.
3.3.1 Prevalence of glaucoma
The total prevalent cases of glaucoma in 2013, disaggregated by those who are blind and those not blind, are presented in Table 3.11. It is estimated that in 2013, there were 382,802 people with glaucoma in Mexico, or 1.8% of the population aged 50 years and over. Glaucoma, like cataracts and DR, has a higher proportion (66.1%) not causing blindness.
Table 3.11: Prevalence of glaucoma in Mexico, 2013
Glaucoma total
prevalence
Glaucoma causing blindness
Glaucoma not causing blindness
Sources for glaucoma prevalence rates
Number of people ( % of total 50+ population)
382,802 (1.8%)
129,914 (0.6%) 252,888 (1.2%) López & Guerrero (2006)
% of people with glaucoma
33.9% 66.1%
Source: DAE using OECD (2013), UN Population Prospects Database (2013) and cost sources noted in last column.
3.3.2 Loss of wellbeing from glaucoma
Loss of wellbeing from glaucoma causing blindness was estimated by applying the disability weight for severe vision loss of 0.43 from the Netherlands study (Stouthard et al, 1997) to the number of people blind from glaucoma.
A combined disability weight of 0.08 for mild/moderate VI from glaucoma was applied to estimated mild and moderate VI cases from non-blinding glaucoma (see Appendix A: Table A.3). Estimates of lost wellbeing from glaucoma are presented in Table 3.12.
In total, glaucoma is estimated to result in 60,577 DALYs lost in Mexico in 2013, of which most (55,863) result from blindness caused by glaucoma.
Table 3.12: Estimated loss of wellbeing from glaucoma in Mexico, DALYs in 2013
DALYs from blindness from glaucoma
Other DALYs from glaucoma Total DALYs from glaucoma
DALYs DALYs DALYs 55,863 4,714 60,577
Source: DAE using Access Economics (2009), Resnikoff et al (2004), Stouthard et al (1997), UN Population Prospects Database (2013) and sources noted for Table 3.11.
23 Deloitte Access Economics
3.3.3 Direct costs from glaucoma
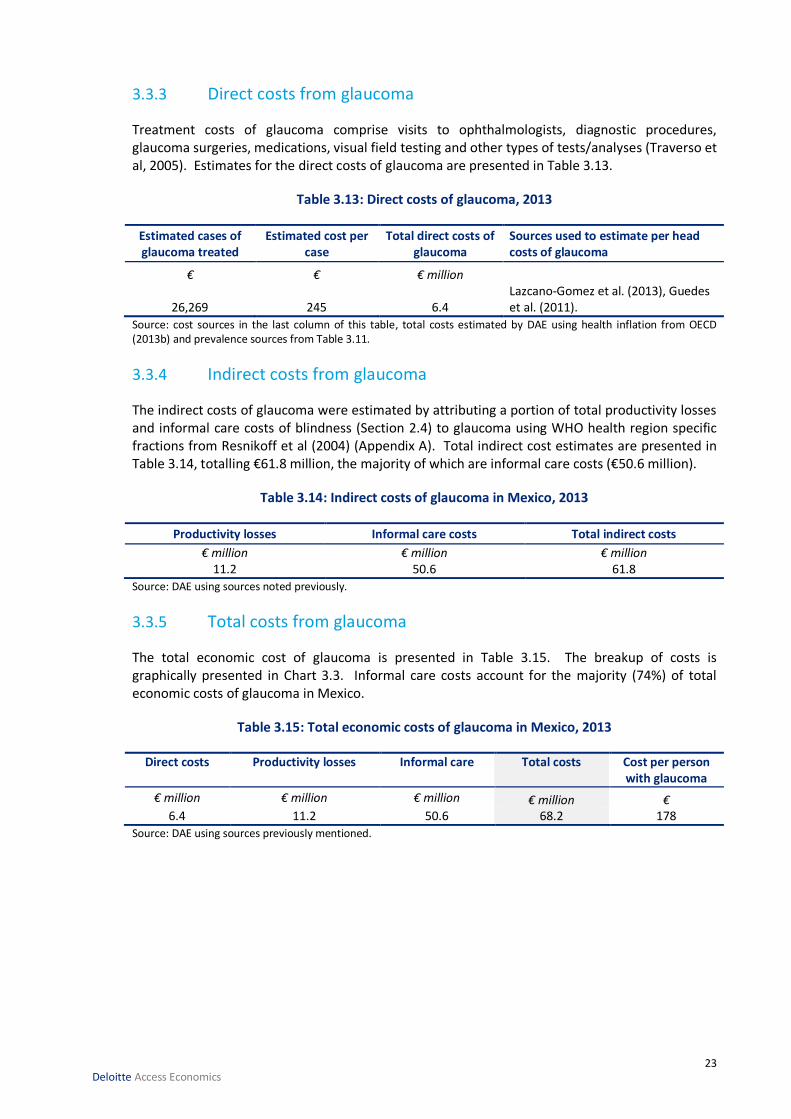
Treatment costs of glaucoma comprise visits to ophthalmologists, diagnostic procedures, glaucoma surgeries, medications, visual field testing and other types of tests/analyses (Traverso et al, 2005). Estimates for the direct costs of glaucoma are presented in Table 3.13.
Table 3.13: Direct costs of glaucoma, 2013
Estimated cases of glaucoma treated
Estimated cost per case
Total direct costs of glaucoma
Sources used to estimate per head costs of glaucoma
€ € € million
26,269 245 6.4 Lazcano-Gomez et al. (2013), Guedes et al. (2011).
Source: cost sources in the last column of this table, total costs estimated by DAE using health inflation from OECD (2013b) and prevalence sources from Table 3.11.
3.3.4 Indirect costs from glaucoma
The indirect costs of glaucoma were estimated by attributing a portion of total productivity losses and informal care costs of blindness (Section 2.4) to glaucoma using WHO health region specific fractions from Resnikoff et al (2004) (Appendix A). Total indirect cost estimates are presented in Table 3.14, totalling €61.8 million, the majority of which are informal care costs (€50.6 million).
Table 3.14: Indirect costs of glaucoma in Mexico, 2013
Productivity losses Informal care costs Total indirect costs
€ million € million € million 11.2 50.6 61.8
Source: DAE using sources noted previously.
3.3.5 Total costs from glaucoma
The total economic cost of glaucoma is presented in Table 3.15. The breakup of costs is graphically presented in Chart 3.3. Informal care costs account for the majority (74%) of total economic costs of glaucoma in Mexico.
Table 3.15: Total economic costs of glaucoma in Mexico, 2013
Direct costs Productivity losses Informal care Total costs Cost per person with glaucoma
€ million € million € million € million € 6.4 11.2 50.6 68.2 178
Source: DAE using sources previously mentioned.

24 Deloitte Access Economics
Chart 3.3: Breakup of the economic costs of glaucoma in Mexico, 2013
Source: DAE using sources previously mentioned.
3.4 ‘Wet’ age-related macular degeneration
AMD is an incurable eye disease and the leading cause of blindness in elderly people. In AMD, damage occurs to the macula, the part of the retina that enables central vision and seeing fine detail, characterised by a ‘black spot’ in vision. ‘Wet’ (exudative or neo-vascular) AMD accounts for around two-thirds of all late-stage AMD. Here, abnormal blood vessels grow under the retina and macula and leak fluid, causing the macula to bulge or lift, and distorting or destroying central vision.
3.4.1 Prevalence of wet AMD
The total prevalent cases of wet AMD in 2013, disaggregated by those who are blind and those not blind, are presented in Table 3.16. In Mexico, a total of 115,034 people are estimated to have wet AMD, or 0.5% of the total population aged 50 years and over. Of the four eye diseases studied, wet AMD has the largest proportion causing blindness (33.9%).
Table 3.16: Prevalence of wet AMD in 2013
Wet AMD total
prevalence
Wet AMD causing blindness (a)
Wet AMD not causing blindness
Sources for wet AMD prevalence rates
Number of people (, % of total 50+ population)
115,034 (0.5%)
38,974 (0.2%) 76,060 (0.3%)
National Eye Institute (2010), estimates on Hispanics in the United States, due to lack of
applicable Mexican prevalence data
Proportion of wet AMD total
33.9% 66.1%
(a) Proportions for AMD from Resnikoff et al (2004) and a 90% estimated proportion of AMD VI cases caused by wet AMD (Vinores, 2006).
10%
16%
74%
Direct costs Productivity Informal care

25 Deloitte Access Economics
3.4.2 Loss of wellbeing from wet AMD
Loss of wellbeing from wet AMD causing blindness was estimated by applying the disability weight for severe vision loss of 0.43 from the Netherlands study (Stouthard et al, 1997) to the number of people blind from wet AMD.
A combined disability weight of 0.13 for mild/moderate VI from wet AMD was applied to estimated mild and moderate VI cases from non-blinding wet AMD (see Appendix A: Table A.3). Estimates of lost wellbeing from wet AMD are presented in Table 3.17.
It is estimated that wet AMD led to 26,056 DALYs lost in Mexico in 2013, with 16,759 resulting from blindness caused by wet AMD.
Table 3.17: Estimated loss of wellbeing from wet AMD, DALYs in 2013
DALYs from blindness from wet AMD
Other DALYs from wet AMD Total DALYs from wet AMD
DALYs DALYs DALYs 16,759 9,297 26,056
Source: DAE using Access Economics (2009), Resnikoff et al (2004), Stouthard et al (1997), UN Population Prospects Database (2013) and sources noted for Table 3.16.
3.4.3 Direct costs from wet AMD
Treatment costs of wet AMD comprise visits to ophthalmologists, diagnosis and monitoring of AMD through tests such as fluorescein angiography and fundus photography, cost of laser treatment and costs of pharmaceuticals including on the drug ranibizumab (Lucentis). Estimates for the direct costs of wet AMD are presented in Table 3.18.
The total direct health care costs of wet AMD in Mexico including the cost of ranibizumab are estimated to be €43.5 million in 2013.
Table 3.18: Direct costs of wet AMD in Mexico, 2013
Per-head direct cost of wet AMD
Prevalence of wet AMD
Total direct costs of wet AMD
Sources used to estimate per head costs of wet AMD
€ Number € million
378 115,034 43.5 DAE other vision studies see Appendix A for method.
Source: DAE using sources noted for Table 3.16 and cost sources in the last column of this table, Lucentis sales volume data provided by Novartis.
3.4.4 Indirect costs of wet AMD
The indirect costs of wet AMD were estimated by attributing a portion of total productivity losses and informal care costs of blindness (Section 2.4) to wet AMD using WHO health region specific fractions from Resnikoff et al (2004) (Appendix A). Total indirect cost estimates are presented in Table 3.19.
Total indirect costs of wet AMD in Mexico are estimated to total €18.5 million. The majority of indirect costs for wet AMD are informal care costs, almost five times the productivity losses associated with wet AMD.

26 Deloitte Access Economics
Table 3.19: Indirect costs of wet AMD in Mexico, 2013
Productivity losses Informal care costs Total indirect costs
€ million € million € million 3.4 15.2 18.5
Source: DAE using sources mentioned previously.
3.4.5 Total costs from wet AMD
The total economic cost of wet AMD is presented in Table 3.20. The breakup of costs is graphically presented in Chart 3.4. Direct costs account for over two thirds (70%) of total economic costs of wet AMD. The cost per person with wet AMD was €539.
Table 3.20: Total economic costs of wet AMD, 2013
Direct costs Productivity losses Informal care Total costs Cost per person with wet AMD
€ million € million € million € million € 43.5 3.4 15.2 62. 539
Source: DAE using sources previously mentioned.
Chart 3.4: Breakup of the economic costs of wet AMD, 2013
Source: DAE using sources previously mentioned.
3.5 Direct costs of eye disease by payer
Applying health funding parameters from the WHO (2013a), the proportions of direct costs of eye disease accruing to different payers in each country were estimated and are presented in Chart 3.5. The government pays for nearly half (49.4% of) the cost of eye diseases in Mexico, while individuals pay for 46.6% and private insurance 4.0%.
70%
5%
25%
Direct costs Productivity Informal care

27 Deloitte Access Economics
Chart 3.5: Proportion of direct costs of eye disease in Mexico, by payer (%)
Source: DAE using WHO (2013a) and sources noted for Table 2.3
4.0%
46.6%
0.0%
49.4%
Private insurance Individuals (out-of-pocket)
Other parties Government
28 Deloitte Access Economics
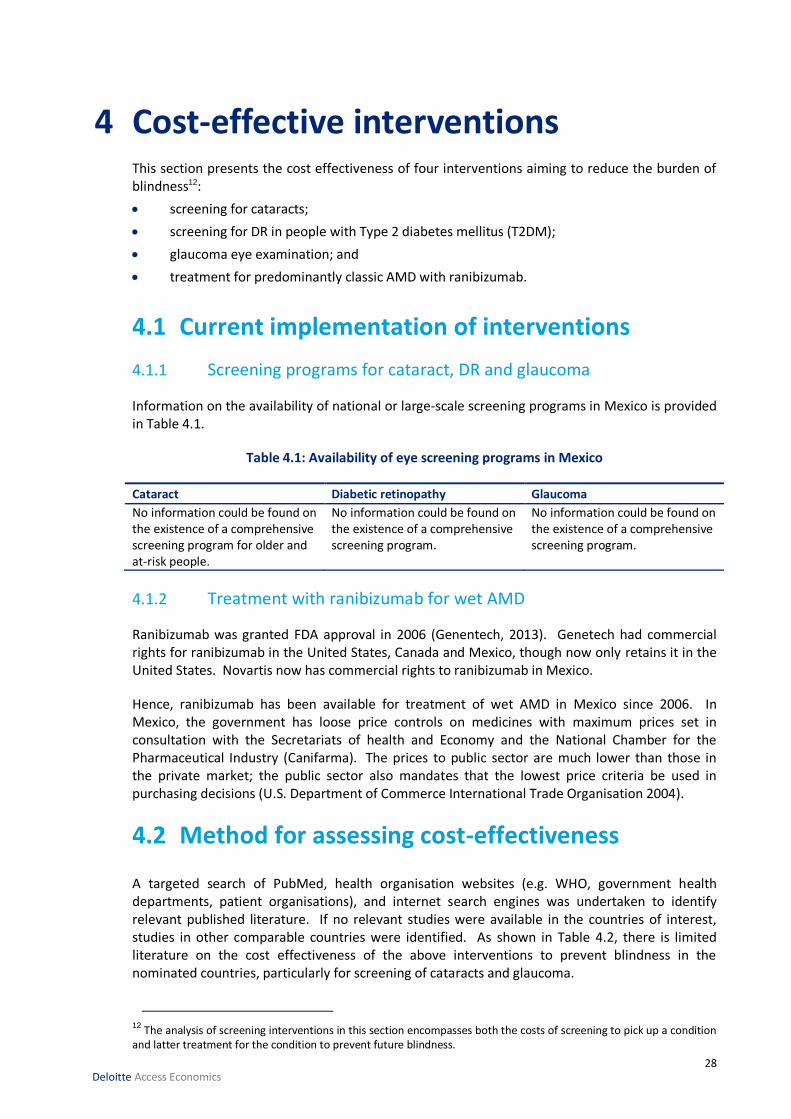
4 Cost-effective interventions This section presents the cost effectiveness of four interventions aiming to reduce the burden of blindness12:
screening for cataracts;
screening for DR in people with Type 2 diabetes mellitus (T2DM);
glaucoma eye examination; and
treatment for predominantly classic AMD with ranibizumab.
4.1 Current implementation of interventions
4.1.1 Screening programs for cataract, DR and glaucoma
Information on the availability of national or large-scale screening programs in Mexico is provided in Table 4.1.
Table 4.1: Availability of eye screening programs in Mexico
Cataract Diabetic retinopathy Glaucoma
No information could be found on the existence of a comprehensive screening program for older and at-risk people.
No information could be found on the existence of a comprehensive screening program.
No information could be found on the existence of a comprehensive screening program.
4.1.2 Treatment with ranibizumab for wet AMD
Ranibizumab was granted FDA approval in 2006 (Genentech, 2013). Genetech had commercial rights for ranibizumab in the United States, Canada and Mexico, though now only retains it in the United States. Novartis now has commercial rights to ranibizumab in Mexico.
Hence, ranibizumab has been available for treatment of wet AMD in Mexico since 2006. In Mexico, the government has loose price controls on medicines with maximum prices set in consultation with the Secretariats of health and Economy and the National Chamber for the Pharmaceutical Industry (Canifarma). The prices to public sector are much lower than those in the private market; the public sector also mandates that the lowest price criteria be used in purchasing decisions (U.S. Department of Commerce International Trade Organisation 2004).
4.2 Method for assessing cost-effectiveness
A targeted search of PubMed, health organisation websites (e.g. WHO, government health departments, patient organisations), and internet search engines was undertaken to identify relevant published literature. If no relevant studies were available in the countries of interest, studies in other comparable countries were identified. As shown in Table 4.2, there is limited literature on the cost effectiveness of the above interventions to prevent blindness in the nominated countries, particularly for screening of cataracts and glaucoma.
12 The analysis of screening interventions in this section encompasses both the costs of screening to pick up a condition and latter treatment for the condition to prevent future blindness.

29 Deloitte Access Economics
Table 4.2: Cost-effectiveness studies identified for four interventions to prevent blindness
Country
Screening for
cataracts
Screening for diabetic retinopathy
Screening for glaucoma
Treatment for wet AMD with
ranibizumab
Australia - - - -
Canada - Maberley 2003 - Brown 2008
Denmark - - - -
France - - - Cohen 2008
Germany - - - Neubauer 2010
Italy - - - -
Ireland - - - -
Japan - - - -
Mexico - - - Soria-Cedillo 2008
Poland - - - -
Slovak republic - - - -
Spain - - - Hernandez-Pastor 2008/2010
Sweden - - - -
Switzerland - - - -
Turkey - - - -
United Kingdom - Facey 2002 Burr 2007
Hernandez 2008
Colquitt 2008
Finland - - Vaahtoranta-Lehtonen 2007
-
Greece - - - Athanasakis 2012
United States Rein 2012 Vijan 2000 - Hurley 2008
For each intervention, incremental cost-effectiveness ratios (ICERs) were extracted from the above studies, and the potential cost of blindness avoidable by the intervention. All costs and ICERs were converted to Euros for the year of study using Purchasing Power Parity (PPP) for the year of the study, and then inflated to a 2013 price using the Consumer Price Index (CPI) in the country of the study. Where a primary study was not available in a nominated country, the analyses presented the maximum and minimum values reported for other countries, and applied the relative Gross Domestic Product (GDP) per capita to reflect different healthcare prices. The number of blind years and DALYs averted were estimated by adjusting the study findings to the corresponding population in the countries of interest.
ICERs for interventions were assessed against WHO thresholds for cost-effectiveness (WHO, 2013b). More information is provided in Appendix A on WHO thresholds for cost-effectiveness.

30 Deloitte Access Economics
4.3 Findings
The four interventions are defined according to the identified cost-effectiveness literature as:
Cataract screening: Dilated eye evaluations by eye care professionals to screen for nuclear cataracts (and AMD, glaucoma and uncorrected refractive errors) among individuals with no diagnosed eye disorders.
Glaucoma screening: A three-yearly screening program for glaucoma targeting individuals aged 40 years and above. A technician first undertakes automated test to quantify functional visual field loss or structural damage of the optic nerve, together with a measurement of intra-ocular pressure; individuals identified as at risk are referred to a glaucoma optometrist for a full glaucoma assessment, and if positive, to an ophthalmologist for confirmation and, if necessary treatment.
Diabetic retinopathy screening: Systematic mydriatic photography in individuals with T2DM; and
Anti-VEGF treatment: Treatment with ranibizumab at a dose of 0.5mg, assuming 5 injections per year over 2 years in individuals with wet AMD.
Table 4.3 shows the estimated effectiveness and cost effectiveness of cataract screening, retinal screening, glaucoma screening and anti-VEGF treatment in Mexico.
Table 4.3: Estimated effectiveness and cost effectiveness of cataract screening, retinal screening, glaucoma screening and anti-VEGF treatment, 2013
Intervention Cost per QALY gained
Mean (range, in €)
Number of vision years gained13
Cost offsets due to vision years gained (€)‡
Number of DALYs prevented
Cataract screening
3,796 (3,468; 4,113)
Insufficient information
Insufficient published information
Insufficient information
Glaucoma screening
23,640
(16,704; 87,835)a 25,393b 426,730; 10,807,033 2,133; 8,785
Screening for diabetic retinopathy┼
6,794
(4,371; 29,167)c 71,783; 154,282 3,268,737; 70,094,313 6,819; 24,047
Anti-VEGF 11,233
(4,987; 34,628)d 7,592; 17,945 2,865,441; 14,108,765 969; 5,425
┼ Estimated based on primary studies listed in Table 4.2; only Maberley et al (2003) reported number of blind years avoided. Note that the Canadian study refers to a screening program implemented in rural region of Ontario.
‡ lower limit was estimated by using only direct (health care) costs prevented, whereas the upper limited was estimated according to indirect costs (productivity losses and informal care costs) plus direct costs prevented from blindness.
a Based on the findings for 40 year-old cohort in Burr et al (2007) (the same study was also reported by Hernandez et al 2008); median corresponds to 6.0% prevalence, whereas upper and lower limits were based on 1.0% and 10.0%, respectively. Comparator is opportunistic case finding.
b Estimated based on Vaahtoranta-Lehtonen (2007). c Comparators were opportunistic screening in the UK study and ‘no program’ in the Canadian study. d Based on country-specific studies identified, see Table 4.2; all studies were based on the Antibody for the Treatment of Predominantly Classic Choroidal Neovascularisation in AMD (ANCHOR) trial. Since completion of this report an additional study was undertaken specifically for Mexico, these findings are reported separately below.
Table 4.3 shows that ranibizumab would avert between 3.72% and 20.8% of the total estimated DALYs associated with vision impairment and blindness in Mexico. Ranibizumab would generate substantial savings of up to €14.1 million (Table 4.3).
13 An increase in the number of years living without severe visual impairment following the intervention over a one year
time period.

31 Deloitte Access Economics
Since the completion of this report, a new study specifically for the treatment of Wet AMD for adults over 40 years in Mexico was published (Arreola-Ornelas et al, 2014). This study is particularly relevant as it considered the standard treatment method in Mexico (verteporfin) in comparison to ranibizumab. Significantly, it finds that in Mexico ranibizumab was the dominant option in comparison to vertoporfin, with incremental QALY gains of 0.2811 (0.426 for ranibizumab compared to 0.1449 for verteporfin) at lesser cost (MXN79,337.05 to MXN156,788.58 respectively). It concluded with an ICER per percentage point gain in quality of life of -MXN2,754.53/-€15514.Screening for diabetic retinopathy in Mexico would generate cost offsets of up to €70.1 million due to gaining between 6,819 and 24,047 vision years. The cost offsets represent up to 3.0% of the total economic costs associated with the four eye diseases (Table 4.3).
For glaucoma screening, notwithstanding the high level of uncertainty of cost-effectiveness estimates, it may generate savings and avert DALYs, if an average of 24.2 days15 of vision years is gained through screening, as estimated by Vaahtoranta-Lehtonen (2007). In Mexico, glaucoma screening may avert up to 0.8% of the total economic costs associated with the four eye diseases (Table 4.3).
14 While the ICER per percentage point gain in quality of life differs to the cost per QALY definition gained used in this report, it would be considered more cost effective than what is reported in Table 4.3.
15 Reported as 930 years of avoided visual disability for 701 persons over an average 20 year time horizon

The burden of eye disease and preventable blindness
32 Deloitte Access Economics
Chart 4.1: Estimated cost saving generated by anti-VEGF treatment, screening diabetic retinopathy, and glaucoma screening*
* Total economic costs of eye disease exclude existing expenditure on anti-VEGF treatment for wet AMD Note: Figures presented in this chart refer to the upper estimates of the cost savings presented in Table 4.3

The burden of eye disease and preventable blindness
33 Deloitte Access Economics
5 Conclusions and recommendations The findings in this report are based on detailed literature search and desktop analysis for Mexico, with preference given to data from local population based studies. Due to variable study quality and availability of local data, extrapolation was used in some instances from one country to another. The Technical Appendix (Appendix A) details the assumptions and methods used in this report.
Blindness and eye disease have been found to affect 5,925,117 people in Mexico. Blindness and eye disease impose not only lost quality of life and wellbeing (DALYs), but also a significant economic burden on society, including costs from health care treatment (direct costs), productivity losses and informal care provision.
Blindness is estimated to result in annual economic costs of €434.3 million in Mexico. The annual economic costs of the four eye diseases studied – cataract, DR, glaucoma and wet AMD are €463.7 million in Mexico.
With today’s knowledge and technology, the WHO estimates that around 80% of global blindness is avoidable using cost-effective interventions (WHO, 2010). This study has found that interventions to prevent and treat eye disease are cost-effective and may result in averted DALYs and substantial economic savings from blindness prevention. Table 5.1 presents mean ICERs and cost-effectiveness ratings for each intervention.
Table 5.1: Estimated cost-effectiveness of interventions (a)
Country Screening for
cataract Screening for DR Screening for
glaucoma Treatment with
ranibizumab for wet AMD
Mean ICER
CE rating*
Mean ICER
CE rating*
Mean ICER
CE rating*
Mean ICER
CE rating*
Mexico 3,796 HCE 6,794 CE to HCE
23,640 CE to NCE
11,233 CE to HCE
(a) Where ICER = cost (€) per QALY gained. * Against WHO cost-effectiveness thresholds: CE = cost effective, HCE = highly cost effective and NCE = not cost effective.
Dilated eye evaluation for the detection of cataracts (with AMD and glaucoma) was found to be a highly cost-effective intervention.
Screening for DR in people with type 2 diabetes was found to be a cost-effective intervention. In Mexico, screening for DR could gain 6,819 to 24,047 vision years over a one year period, which corresponds to economic savings of up to €70.1 million.
Treatment with ranibizumab for wet AMD was found to be a cost-effective intervention for preventing blindness associated with wet AMD. Due to a considerable number of individuals with wet AMD and higher healthcare costs, anti-VEGF treatment would generate substantial savings in Mexico; treatment with ranibizumab could gain 969 to 5,425 vision years over a one year period, which corresponds to economic savings of up to €14.1 million.
A technician-led glaucoma screening program for those aged 40 and older may not be a cost effective intervention if population prevalence is less than 4%. However, this study found that glaucoma screening concurrently with cataract and AMD screening through dilated eye evaluation is a highly cost effective intervention, as mentioned above. Notwithstanding the high level of

The burden of eye disease and preventable blindness
34 Deloitte Access Economics
uncertainty of cost-effectiveness estimates, glaucoma screening may generate savings and avert DALYs, if an average of 24.2 days of vision is gained through screening, as estimated by Vaahtoranta-Lehtonen (2007).
Blindness and eye disease impose substantial lost wellbeing and economic costs, and should be a public health priority. Cost-effective interventions should be explored and promoted to reduce the burden on individuals and society.
This study has found that the prevention of blindness would result in significant benefits both in improved wellbeing and economic savings.

The burden of eye disease and preventable blindness
35 Deloitte Access Economics
References Access Economics 2009, Future sight loss UK: The economic impact of partial sight and blindness
in the UK adult population, Report for RNIB.
Arreloa-Ornelas H, Lemus-Carmona E, Camacho-Cordero L 2014, Evaluación económica de ranibizumab en pacientes adultos con degeneración macular relacionada con la edad (DMRE) exudative en México, Revista Mexicana de Oftalmología, 81(1):5-15.
Barcelo A, Aedo C, Rajpathak S & Robles S 2003, The cost of diabetes in Latin America and the Caribbean, Bulletin of the World Health Organization, 81:19-27.
Bron A, Viswanathan A, Thelen U, de Natale R, Ferreras A, Gundgaard J, Schwartz G, Buchholz P 2010, ‘International vision requirements for driver licensing and disability pensions: using a milestone approach in characterization of progressive eye disease’, Clinical Ophthalmology, 4: 1361–1369.
Burr JM, Mowatt G, Hernández R, Siddiqui MA, Cook J, Lourenco T, Ramsay C, Vale L, Fraser C, Azuara-Blanco A, Deeks J, Cairns J, Wormald R, McPherson S, Rabindranath K, Grant A, 2007, ‘The clinical effectiveness and cost-effectiveness of screening for open angle glaucoma: a systematic review and economic evaluation’, Health Technol Assess, 11(41): iii-iv, ix-x, 1-190.
Deloitte Access Economics 2011, Eyes on the future. A clear outlook on Age-related Macular Degeneration, Report for the Macular Degeneration Foundation.
European Medicines Agency (EMA) 2013, Lucentis (ranibizumab), available at: http://www.ema.europa.eu/ema/index.jsp?curl=pages/medicines/human/medicines/000715/human_med_000890.jsp&mid=WC0b01ac058001d124 [accessed 5 July 2013].
Furtado J, Lansingh V, Carter M, Milanese M, Pena B, Ghersi H, Bote P, Nano M & Silva J 2012, Causes of blindness and visual impairment in Latin America, Survey of Ophthalmology 57(2), 149-177.
Genetech 2013, Lucentis® (ranibizumab injection), available at: http://www.gene.com/media/product-information/lucentis [accessed December 23].
Guedes R, Guedes V & Chaoubah A 2011, Resources use, costs and effectiveness of non-penetrating deep sclerectomy according to glaucoma stage, Arq Bras Oftalmol. 74(6):400-4.
Gustavo N, López-Ortega M, Púb M, Matarazzo C, Antrop M, Juárez-Ramírez C & Antrop D 2007, La atención de los enfermos y discapacitados en el hogar. Retos para el sistema de salud mexicano, Salud Pública Méx, 49(4):286-294.
Instituto Nacional De Estadistica y Geografia 2010, Censo de Población y Vivienda 2010, available at: http://www.inegi.org.mx/sistemas/olap/proyectos/bd/consulta.asp?p=17118&c=27769&s=est# [accessed 23 December 2013].
Instituto Nacional de Salud Publica 2012, ‘ENSANUT’ Encuesta Nacional de Salud y Nutrición (National Health and Nutrition Survey), available at: http://ensanut.insp.mx/informes/ENSANUT2012ResultadosNacionales.pdf [accessed 20 February].

The burden of eye disease and preventable blindness
36 Deloitte Access Economics
International Labour Organization (ILO) 2013a, ILOSTAT Database: Employment to Population ratio, http://www.ilo.org/ilostat/faces/home/statisticaldata?_adf.ctrl-state=14j8zo60ft_110&clean=true&_afrLoop=130026195130726 [accessed 16 December 2013].
International Labour Organization (ILO) 2013b, Global Wage Database, http://www.ilo.org/global/research/global-reports/global-wage-report/2012/lang--en/index.htm [accessed 16 December 2013].
Kara-Junior N, Mazuerk M, Santhiago M, Parede T, Espindola R & Carvalho R 2010, Phacoemulsification versus extracapsular extraction: governmental costs, Clinics, 65(4):357-61.
Lazcano-Gomez G, Hernandez-Oteyza A, Iriarte-Barbos M & Hernandez-Garciadiego C 2013, Topical glaucoma therapy cost in Mexico, Int Ophthalmol DOI 10.1007/s10792-013-9823-6.
López, G & Guerrero J 2006, Prevalencia de glaucoma primario en la Coordinación Universitaria del Hospital Civil de Culiacán en el periodo 2003-2005, Boletín Médico - Facultad de Medicina UAS, 12(2).
Lowery J, Leasher J, Gibb R, Schell D 2008, Change in visual acuity status of patients served by a humanitarian vision clinic in Mexico, Optometry 79(2):70-7.
Maberley D, Walker H, Koushik A, Cruess A, 2003, ‘Screening for diabetic retinopathy in James Bay, Ontario: a cost-effectiveness analysis’, CMAJ 168(2):160-4.
Mathers C, Vos T, Stevenson C 1999, The burden of disease and injury in Australia, Australian Institute of Health and Welfare (AIHW), Canberra.Ministerodella Health, 2011
Mayo Clinic 2013, Cataracts, treatments and drugs, available at: http://www.mayoclinic.com/health/cataracts/DS00050/DSECTION=treatments-and-drugs [accessed July 20, 2013].
Mojon-Azzi S, Sousa-Poza A, Mojon D 2010, ‘Impact of low vision on employment’, Ophthalmologica, 224: 381-388.
National Eye Institute 2010, Statistics and Data, available at: http://www.nei.nih.gov/eyedata/ [accessed 23 December 2013].
NIDEK 2013, Conversion Table for Representation of Visual Acuity, available at: http://www.nidek-intl.com/ophthalmology/visual_acuity.html [accessed 27 August, 2013].
Organisation for Economic Cooperation and Development (OECD) 2013a, Stat.Extracts: Public Sector, Taxation and Market Regulation, http://stats.oecd.org/Index.aspx?DataSetCode=AWCOMP# [accessed 16 December 2013].
Organisation for Economic Cooperation and Development (OECD) 2013b, Stat.Extracts: Health Care Utilisation, Surgical Procedures, http://stats.oecd.org/index.aspx?queryid=30167 [accessed 16 December 2013].
Polack S, Yorston D, López-Ramos A, Lepe-Orta S, Baia RM, Alves L, Grau-Alvidrez C, Gomez-Bastar P & Kuper H 2012, Rapid assessment of avoidable blindness and diabetic retinopathy in Chiapas, Mexico, Ophthalmology, 119(5):1033-40.

The burden of eye disease and preventable blindness
37 Deloitte Access Economics
Resnikoff S, Pascolini D, Etya’ale D, Kocur I, Mariotti SP, Pokharel GP, Pararajasegaram R, Mariotti SP (2004) ‘Global data on visual impairment in the year 2002’, Bulletin of the World Health Organization, 82(11):844-851.
Secretaria De Salud 2012, Informe de Rendicion de Cuentas: 2006-2012 Consolidado, Gobierno Federal.
Stouthard M, Essink-Bot M, Bonsel G, Barendregt J, Kramers P 1997, Disability weights for diseases in the Netherlands, Department of Public Health, Erasmus University, Rotterdam.
Traverso C, Walt J, Kelly S, Hommer A, Bron A, Denis A, Nordmann J, Renard J, Bayer A, Grehn F, Pfeiffer N, Cedrone C, Gandolfi S, Orzalesi N, Nucci C, Rossetti L, Azuara-Blanco A, Bagnis A, Hitchings R, Salmon J, Bricola G, Buchholz P, Kotak S, Katz L, Siegartel L, Doyle J, ‘Direct costs of glaucoma and severity of the disease: a multinational long term study of resource utilisation in Europe’, Br J Ophthalmol, 89: 1245–1249.
United Nation (UN), Department of Economic and Social Affairs, Population Division (2013), World Population Prospects: The 2012 Revision, CD-ROM edition.
Vaahtoranta-Lehtonen H, Tuulonen A, Aronen P, Sintonen H, Suoranta L, Kovanen N, Linna M, Läärä E, Malmivaara A 2007, Cost effectiveness and cost utility of an organized screening programme for glaucoma, Acta Ophthalmol Scand, 85(5):508-18.
Van den Berg B, Brouwer W, van Exel J, Koopmanschap M, van den Bos GAM, Rutten F 2006, ‘Economic valuation of informal care: Lessons from the application of the opportunity cost and proxy good methods’ Social Science & Medicine, 62: 835-845.Vijan S, Hofer TP, Hayward RA, 2000, ‘Cost-utility analysis of screening intervals for diabetic retinopathy in patients with type 2 diabetes mellitus’, JAMA, 283(7):889-96.
Vinores S 2006, ‘Pegaptanib in the treatment of wet, age-related macular degeneration’, International Journal of Nanomedicine, 1(3): 263–268.
Wimo A, Winblad B, Jonsson L 2007, ‘An estimate of the total worldwide societal costs of dementia in 2005’, Alzheimer’s & Dementia, 3(2):81-91.
U.S. Department of Commerce International Trade Organisation 2004, Pharmaceutical Price Controls in OECD Countries Implications for U.S. Consumers, Pricing, Research and Development, and Innovation, available at: http://www.ita.doc.gov/td/chemicals/drugpricingstudy.pdf [accessed 23 December 2013].
World Health Organisation (WHO) 2004, GLOBAL BURDEN OF DISEASE 2004 UPDATE: DISABILITY WEIGHTS FOR DISEASES AND CONDITIONS.
World Health Organisation (WHO) 2010, Action plan for the prevention of avoidable blindness and visual impairment 2009-2013, WHO Library.
World Health Organisation (WHO) 2013a, Choosing interventions that are cost-effective (WHO-CHOICE), cost effectiveness thresholds, http://www.who.int/choice/costs/CER_thresholds/en/index.html, accessed 29 July 2013.
World Health Organisation (WHO) 2013b, Blindness, available at: http://www.who.int/topics/blindness/en/ [accessed 24 June, 2013].
World Health Organisation (WHO) 2013c, Global Health Expenditure Database, http://apps.who.int/nha/database/StandardReport.aspx?ID=REP_WEB_MINI_TEMPLATE_WEB_VERSION&COUNTRYKEY=84641 [accessed 16 December 2013].

The burden of eye disease and preventable blindness
38 Deloitte Access Economics
Appendix A: Technical Appendix Visual acuity conversion
Table A.1: Visual acuity conversion based on different measures
Snellen based on 6 metres Decimal LogMAR
6/300 0.02 +1.7 6 / 190 0.032 +1.5 6 / 150 0.04 +1.4
6 / 120 (3/60) 0.05 +1.3 6 / 95 0.06 +1.2 6 / 75 0.08 +1.1 6 / 60 0.1 +1.0 6 / 48 0.125 +0.9 6 / 38 0.16 +0.8 6 / 30 0.2 +0.7 6 / 24 0.25 +0.6 6 / 19 0.32 +0.5 6 / 15 0.4 +0.4 6 / 12 0.5 +0.3 6 / 9.5 0.63 +0.2 6 / 7.5 0.8 +0.1 6 / 6 1.0 0
6 / 4.8 1.25 -0.1 6 / 3.8 1.6 -0.2 6 / 3 2.0 -0.3
Source: NIDEK (2013).
Causes of blindness by WHO health region
Resnikoff et al (2004) estimated the proportions of blindness attributable to each eye disease by WHO health region. For Mexico, these fractions were employed to estimate the prevalence of blind cataract, blind DR, blind glaucoma and blind wet AMD. Since the fractions for AMD in both Resnikoff et al (2004) and Access Economics (2009) relate to total AMD, an adjustment had to be made to estimate the fraction of blindness from wet AMD. Vinores (2006) reports that 90% of vision loss cases from AMD are due to the wet form. Hence, this fraction was applied to the AMD proportions of blindness from Resnikoff et al (2004) and Access Economics (2009) to estimate the proportion of blindness attributable to wet AMD.

The burden of eye disease and preventable blindness
39 Deloitte Access Economics
Table A.2: Causes of blindness by WHO subregion (% of total blindness)
Region Cataract Glaucoma AMD Corneal opacity
DR Childhood blindness
Trachoma Oncho-cerciasis
Others
% % % % % % % % % Afr-D 50 15 8 5.2 6.2 6 9.6 Afr-E 55 15 12 5.5 7.4 2 3.2 Amr-A 5 18 50 3 17 3.1 3.9 Amr-B 40 15 5 5 7 6.4 0.8 20.8 Amr-D 58.5 8 4 3 7 5.3 0.5 13.7 Emr-B 49 10 3 5.5 3 4.1 3.2 22.2 Emr-D 49 11 2 5 3 3.2 5.5 21.3 Eur-A 5 18 50 3 17 2.4 4.6 Eur-B1 28.5 15 15 8 15 3.5 15 Eur-B2 35.5 16 15 5 15 6.9 6.6 Eur-C 24 20 15 5 15 2.4 18.6 Sear-B 58 14 3 5 3 2.6 14.4 Sear-D 51 9 5 3 3 4.8 1.7 22.5 Wpr-A 5 18 50 3 17 1.9 0.025 5 Wpr-B1 48.5 11 15 3 7 2.3 6.4 6.8 Wpr-B2 65 6 5 7 3 3.6 3.5 6.9 Wpr-B3 65 6 3 3 5 9.5 4.3 4.2 World 47.8 12.3 8.7 5.1 4.8 3.9 3.6 0.8 13
Source: Resnikoff et al (2004)
Detailed methodology
Blindness prevalence
A literature search was conducted for Mexico to identify studies reporting the prevalence of blindness, with key search terms based on VA cut-off scores (e.g. 6/60, 3/60), and a range of terms for VI, blindness and vision loss. Targeted searches were conducted of PubMed, healthcare and patient organisation websites, and general internet search engines. Identified prevalence rates were applied to 2013 national population estimates from the United Nations (UN) World Population Prospects Database (UN, 2013)16.
Total blindness was estimated from the only viable Mexican prevalence estimate sourced. Polack et al (2012) provides total prevalence estimates for blindness (2.3% with <3/60, 2.0% male and 2.6% female). However there was a lack of estimates disaggregating age groupings. Accordingly the Hispanic prevalence rates in the United States (National Eye Institute, 2010) were used to estimate the relative age splits, and then fitted to the total prevalence estimates by Polack et al (2012).
However, as the Hispanic ratios were only 40 and over for blindness, further extrapolations of the lower age groups were made using UK age and gender ratios and trends established by the Hispanic estimates. As most blindness occurs over the age of 40, this estimation method in the younger groups is unlikely to affect the overall estimate of blindness significantly.
Prevalence of eye disease
The total prevalence of eye disease (blind and non-blind) was estimated for cataract, DR, glaucoma and wet AMD. The prevalence of cataract, glaucoma and wet AMD was estimated for those aged 50 years and older, as these conditions are primarily age-related. DR prevalence was estimated for those aged 18 years and older, as both type 1 and type 2 diabetes and their associated complications can occur in younger age groups.
16 Annual male and female population estimates by five-year age group, major area, region and country, medium-fertility projections for 2011-2100 (UN, 2013).

The burden of eye disease and preventable blindness
40 Deloitte Access Economics
Relevant studies on the country-specific prevalence of each eye disease were identified through tailored searches of databases (e.g. PubMed), journals (e.g. Salud Pública de México ), healthcare and patient organisation websites, and general internet search engines. These were applied to country-specific population estimates (UN, 2013) to estimate the total prevalence of each eye disease.
Mexican specific prevalence estimates were first sought for the four eye diseases.
Polack et al (2012) provided Mexican specific data for DR (percentage of those with DR of the diabetic population). This rate was applied to the total medically diagnosed diabetic population estimate from the latest National Health and Nutrition Survey ‘ENSANUT’ (Instituto Nacional de Salud Publica, 2012).
López & Guerrero (2006) provided estimates of the prevalence of glaucoma in a Mexican hospital setting and the prevalence of glaucoma in Mexico nationally. The national figure was used for our estimate.
Lowery et al (2008) provides Mexican estimates of those with cataracts; while this was clinically based (biasing the results), other Latin America studies tended to have various bias or methodological problems (e.g. selection bias or recruiting methods) that also made any reliable estimate difficult (Furtado et al, 2012). Accordingly the Lowery et al (2008) used should be considered a conservative estimate.
The National Eye Institute (2010) estimates of the prevalence of wet AMD in Hispanics living in the United States of America were used to estimate prevalence in Mexico. This is due to no Mexico specific information and inconsistent information for other comparable countries (results from our literature search and confirmed by other literature reviews such as Furtado et al, 2012). Notably prevalence estimates derived for the other eye diseases above were reasonably comparable to the Hispanic rates from the National Eye Institute (2010), accordingly the use of these estimates is considered the best fit until better data is available.
Where there were no local prevalence estimates for Mexico (i.e. for glaucoma, wet AMD and cataracts), the National Eye Institute (2010) age-gender rates for Hispanics in the United States were used as a proxy for the Mexican population.
Blindness prevalence from each eye disease was estimated by applying attributable proportions from Resnikoff et al (Table A.2) to total country-specific blindness prevalence estimated in Section 2.1. Non-blindness prevalence for each eye disease was estimated by deducting blindness prevalence of each eye disease from total prevalence of each eye disease.17
Loss of wellbeing from blindness and eye disease
Any weighting exercise for use in burden of disease analysis or economic evaluation should measure preferences for clearly defined and relevant health states. Two key sources of disability weights for VI were identified for estimation of lost wellbeing in this report: the WHO Global Burden of Disease (GBD) study (WHO, 2004) and a Netherlands study (Stouthard et al, 1997).
For this report, the Netherlands study disability weights were utilised. The Netherlands study uses a methodology consistent with GBD. However, it used more specific disease stages and severity levels than the GBD, so that judgements were not required on the distribution of stages or severities in the population. In addition, the study defined each disease stage by the
17 The sources generally provide prevalence estimates of visually-impairing disease, since people tend to only receive a diagnosis or self-report eye conditions when they start to notice vision loss. Moreover, the earlier Access Economics studies have been based on epidemiological studies where cases of disease with no visual impairment were excluded, so there are likely to be very few of such cases estimated in total prevalence.
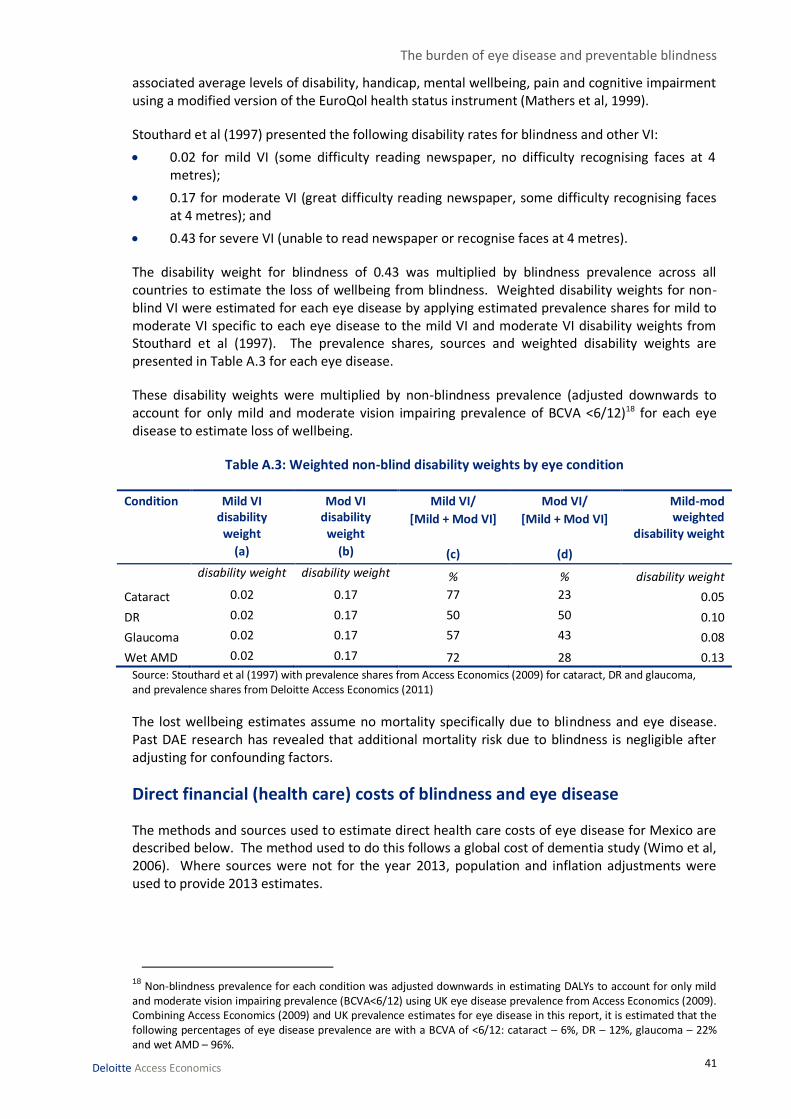
The burden of eye disease and preventable blindness
41 Deloitte Access Economics
associated average levels of disability, handicap, mental wellbeing, pain and cognitive impairment using a modified version of the EuroQol health status instrument (Mathers et al, 1999).
Stouthard et al (1997) presented the following disability rates for blindness and other VI:
0.02 for mild VI (some difficulty reading newspaper, no difficulty recognising faces at 4 metres);
0.17 for moderate VI (great difficulty reading newspaper, some difficulty recognising faces at 4 metres); and
0.43 for severe VI (unable to read newspaper or recognise faces at 4 metres).
The disability weight for blindness of 0.43 was multiplied by blindness prevalence across all countries to estimate the loss of wellbeing from blindness. Weighted disability weights for non-blind VI were estimated for each eye disease by applying estimated prevalence shares for mild to moderate VI specific to each eye disease to the mild VI and moderate VI disability weights from Stouthard et al (1997). The prevalence shares, sources and weighted disability weights are presented in Table A.3 for each eye disease.
These disability weights were multiplied by non-blindness prevalence (adjusted downwards to account for only mild and moderate vision impairing prevalence of BCVA <6/12)18 for each eye disease to estimate loss of wellbeing.
Table A.3: Weighted non-blind disability weights by eye condition
Condition Mild VI disability
weight
(a)
Mod VI disability
weight
(b)
Mild VI/
[Mild + Mod VI]
(c)
Mod VI/
[Mild + Mod VI]
(d)
Mild-mod weighted
disability weight
disability weight disability weight % % disability weight
Cataract 0.02 0.17 77 23 0.05
DR 0.02 0.17 50 50 0.10
Glaucoma 0.02 0.17 57 43 0.08
Wet AMD 0.02 0.17 72 28 0.13
Source: Stouthard et al (1997) with prevalence shares from Access Economics (2009) for cataract, DR and glaucoma, and prevalence shares from Deloitte Access Economics (2011)
The lost wellbeing estimates assume no mortality specifically due to blindness and eye disease. Past DAE research has revealed that additional mortality risk due to blindness is negligible after adjusting for confounding factors.
Direct financial (health care) costs of blindness and eye disease
The methods and sources used to estimate direct health care costs of eye disease for Mexico are described below. The method used to do this follows a global cost of dementia study (Wimo et al, 2006). Where sources were not for the year 2013, population and inflation adjustments were used to provide 2013 estimates.
18 Non-blindness prevalence for each condition was adjusted downwards in estimating DALYs to account for only mild and moderate vision impairing prevalence (BCVA<6/12) using UK eye disease prevalence from Access Economics (2009). Combining Access Economics (2009) and UK prevalence estimates for eye disease in this report, it is estimated that the following percentages of eye disease prevalence are with a BCVA of <6/12: cataract – 6%, DR – 12%, glaucoma – 22% and wet AMD – 96%.
The burden of eye disease and preventable blindness
42 Deloitte Access Economics
Cataract
The direct costs for those who are blind with cataract were estimated by distributing the country-specific estimated cost of cataract surgery by the country-specific prevalence shares between blind and non-blind cataract. The surgical cost of treating cataracts was estimated from Kara-Junior (2010). Noting this study was based in Brazil, costs were adjusted to take into account Mexican health system and economy (e.g. adjusting costs by relative GDP). The direct costs of cataracts were estimated by multiplying estimated country-specific per capita treatment of cataracts by the prevalence of cataracts. In addition the literature search identified that Mexico has established a Protection Fund Against Catastrophic Expenditures for cataracts (Secretaria De Salud, 2012), which was also included in the cost estimates.
DR
The direct costs of DR were estimated by multiplying estimated country-specific per capita treatment costs of DR by the prevalence of DR. The direct costs for those who are blind with DR were estimated by distributing the country-specific estimated cost of DR by the country-specific prevalence shares between blind and non-blind DR.
The per case estimates were derived from a Latin America study (Barcelo, 2003) that identified both the cost of DR and the number of cases specifically for Mexico.
Glaucoma
The direct costs of glaucoma were estimated by multiplying estimated country-specific per capita treatment costs of glaucoma by the number of cases of glaucoma treated per year. The direct costs for those who are blind with glaucoma were estimated by distributing the country-specific estimated cost of glaucoma by the country-specific prevalence shares between blind and non-blind glaucoma.
Glaucoma estimates were based on the cost for treating a case of glaucoma (Guedes 2011) and the average pharmaceutical cost of treating glaucoma (Lazcano-Gomez, 2013). As there were no cost estimates on a ‘per prevalence’ case and there were no figures for the number of cases treated in Mexico, the same proportional rate of treatment for glaucoma was assumed as for cataracts.
Wet AMD
The literature review identified studies and data, for both Mexico and wider Latin America, that only provided treatment costs but not the number of cases treated or the cost per prevalent case. Accordingly the most accurate method to estimate the direct costs of wet AMD is by identifying the average total cost of wet AMD to GDP for countries that had enough data to provide cost estimates. This was then applied to Mexico and adjusted for Mexico’s GDP, expected treatment rates relative to the average country treatment rate and sales of Lucentis.
The direct costs for those who are blind with wet AMD were estimated by distributing the country-specific estimated cost of wet AMD by the country-specific prevalence shares between blind and non-blind wet AMD.
Indirect costs of blindness
Productivity losses
A loss in productivity of an individual due to blindness will only equate to a loss in productivity to the economy under fairly strict conditions. These are:

The burden of eye disease and preventable blindness
43 Deloitte Access Economics
the economy is at full employment so any reduction in hours worked due to blindness cannot be replaced by employing or increasing hours of other workers; and
the income of an individual is proportional to the total value added to production.
DAE adopts a human capital approach to the estimation of productivity losses in developed countries, which is most consistent with the first condition of an economy at, or close to, full employment. The unemployment rates in the countries analysed may or may not be sufficiently low to incur a permanent productivity loss and therefore the losses presented in this report should be interpreted with caution.
The second condition will occur if there is a perfect labour market such that the marginal benefit from an additional hour of work (the value added) is equal to the marginal cost (the wage). In reality, labour markets are imperfect for a number of reasons such as asymmetric information and labour market restrictions imposed by government regulation and natural barriers. In addition, synergy created between labour, capital and land means a reduction in working hours may also impact the productivity of other factors of production. Consequently the value of productivity from labour will be larger than the wage provided to an individual so using lost income from blindness as a proxy for lost productivity will tend to underestimate the true cost. It is likely that, in the absence of blindness, that people with blindness would participate in the labour force and obtain employment at the same rate and average weekly earnings as others. The implicit assumption here is that the numbers of such people would not be of sufficient magnitude to substantially influence the overall clearing of labour markets, and average wages would remain the same.
In this report, productivity losses are estimated using the lower than average employment rates for people who are blind19. The calculation of productivity losses was restricted to blind people of working age (15-64 years) across countries
The employment gap is the lower employment of people with blindness that can be attributed to their blindness. The employment gap from blindness in each country was estimated as:
1 – [Employment rate of blind people (%) / Employment rate of the general population
(%)]
Estimated employment gaps were multiplied by average annual earnings and the general population employment rate to estimate total productivity losses from blindness.
The blind employment rate was derived from the Censo de Población y Vivienda 2010. The census identified the population 12 years and over, economic participation rate who had a ‘limitation to see’.
Informal care costs
In this study, the opportunity cost method was employed to estimate the costs of informal care provision to those who are blind.
The opportunity cost method values earnings foregone by the carer, in caring for the person with blindness. From a theoretical perspective, the opportunity cost method is the benchmark (Van den Berg et al, 2006). The opportunity cost method measures the value in alternative use of time spent caring, which is typically valued by productivity losses (or value of leisure time) associated
19 It should be noted that the employment rates have not been age-gender standardised. This may be a generous assumption as people who are blind are generally older than the general population and may be over-represented in lower employment participation groups (e.g. women aged 55-64). However, employment participation rates are tending to increase in this cohort and, moreover, this generous assumption is offset by being conservative in productivity loss estimation overall by excluding losses from absenteeism, presenteeism and premature mortality.

The burden of eye disease and preventable blindness
44 Deloitte Access Economics
with caring. This is based on the assumption that time spent providing informal care could be alternatively used within the paid workforce or in leisure activities. The value of informal care using the opportunity cost method can be represented as ti × wi, where ti is the time provided by individual i on providing care, and wi is the net market wage rate of individual i (van den Berg et al, 2006).
The most recent study for Mexico on carer hours was done by Ngenda et al (2007). It identified, through the 2002 National Survey of Time Use, the pattern of time devoted by members of Mexican households to providing care to ill and disabled family members. It found that for households 6.09 hours were spent per week with someone classified as ‘sick’ and 8.17 hours for someone classified as ‘disabled’. To be conservative, the lower figure of 6.09 hours per week was used.
WHO thresholds for assessing cost-effectiveness
The WHO ‘Choosing Interventions that are Cost-Effective’ (CHOICE) project uses threshold values in its analyses to assess relative cost effectiveness of an intervention (WHO, 2011). Following recommendations of the Commission of Macroeconomics and Health, WHO uses GDP as a readily available indicator to define three categories of cost-effectiveness:
highly cost effective – cost per DALY averted less than GDP per capita;
cost effective – cost per DALY averted between one and three times GDP per capita; and
not cost effective – cost per DALY averted more than three times GDP per capita.

Limitation of our work Deloitte Australia's conflict and independence check for this project, while meeting all professional services standards and legal obligations, did not extend to every author of every source referenced; consequently there is not certainty regarding the existence of current or previous business relationships between cited researchers and Novartis.
General use restriction
This report is prepared solely for the use of Novartis Farmaceutica, S.A. de C.V. This report is not intended to and should not be used or relied upon by anyone else and we accept no duty of care to any other person or entity. The report has been prepared for the purpose of estimating the burden of eye disease and preventable blindness. You should not refer to or use our name or the advice for any other purpose.

Contact us
Deloitte Access Economics ACN: 149 633 116 Level 1 9 Sydney Avenue Barton ACT 2600 PO Box 6334 Kingston ACT 2604 Australia Tel: +61 2 6175 2000 Fax: +61 2 6175 2001 www.deloitteaccesseconomics.com.au
Deloitte Access Economics is Australia’s pre-eminent economics advisory practice and a member of Deloitte's global economics group. The Directors and staff of Access Economics joined Deloitte in early 2011.
Deloitte refers to one or more of Deloitte Touche Tohmatsu Limited, a UK private company limited by guarantee, and its network of member firms, each of which is a legally separate and independent entity. Please see www.deloitte.com/au/about for a detailed description of the legal structure of Deloitte Touche Tohmatsu Limited and its member firms.
About Deloitte
Deloitte provides audit, tax, consulting, and financial advisory services to public and private clients spanning multiple industries. With a globally connected network of member firms in more than 150 countries, Deloitte brings world-class capabilities and deep local expertise to help clients succeed wherever they operate. Deloitte's approximately 170,000 professionals are committed to becoming the standard of excellence.
About Deloitte Australia
In Australia, the member firm is the Australian partnership of Deloitte Touche Tohmatsu. As one of Australia’s leading professional services firms. Deloitte Touche Tohmatsu and its affiliates provide audit, tax, consulting, and financial advisory services through approximately 5,400 people across the country. Focused on the creation of value and growth, and known as an employer of choice for innovative human resources programs, we are dedicated to helping our clients and our people excel. For more information, please visit our web site at www.deloitte.com.au.
Liability limited by a scheme approved under Professional Standards Legislation.
Member of Deloitte Touche Tohmatsu Limited
© 2014 Deloitte Access Economics Pty Ltd