prevalence estimates of pathological gambling in …
TRANSCRIPT
University of Calgary
PRISM: University of Calgary's Digital Repository
Alberta Gambling Research Institute Alberta Gambling Research Institute
2002
Prevalence estimates of pathological gambling in
Puerto Rico
Volberg, Rachel A.; Vales, Pedro A.
Revista Puertorriqueña de Psicología
Volberg, R. A., Vales, P. A. (2002). Estimados de prevalencia sobre el juego patológico en Puerto
Rico [Prevalence estimates of pathological gambling in Puerto Rico]. Revista Puertorriqueña de
Psicología 13, 71-98.
http://hdl.handle.net/1880/45032
journal article
http://creativecommons.org/licenses/by-nc-nd/3.0/
Attribution Non-Commercial No Derivatives 3.0 Unported
Downloaded from PRISM: https://prism.ucalgary.ca
PREVALENCE ESTIMATES OF PATHOLOGICAL GAMBLING IN PUERTO RICO
Rachel A. Volberg, Ph.D. Gemini Research
P.O. Box 628 Northampton, MA 01061-0628
413-584-4667
&
Pedro A. Vales, Ph.D. Consultores en Conducta Humana, Inc.
PO Box 4373 San Juan, PR 00919
(787) 724-7269
Gambling and Problem Gambling in Puerto Rico
Acknowledgments
The research reported here was funded by the Puerto Rico Department of the Treasury.
We would also like to thank the residents of Puerto Rico who were interviewed for this survey.
Their contribution has been vital in adding to our knowledge of changes in gambling and
gambling-related problems throughout the world.
1
Gambling and Problem Gambling in Puerto Rico
Abstract Legal gambling has proliferated internationally and has become a public health issue
because of the association between gambling participation and the prevalence of pathological
gambling. This paper summarizes the major findings of a prevalence survey of gambling and
problem gambling conducted in Puerto Rico. A sample of 1,506 residents of Puerto Rico, aged
18 years and older, were interviewed in person to determine involvement in gambling activities.
The interview included the South Oaks Gambling Screen for pathological gambling.
A substantial proportion of the sample, 6.8% (±1.3%), scored as current probable
pathological gamblers. This prevalence rate is higher than prevalence rates for probable
pathological gambling identified in the general population of any other jurisdiction where similar
surveys have been conducted. Gender, age, marital and employment status, regular participation
in continuous forms of gambling, starting to gamble at a young age, and having a parent who had
gambling problems are major risk factors.
The findings provide a baseline for further study into the relationship between socio-
economic status, cultural attitudes toward gambling and gambling-related difficulties. The
findings also raise questions about the impact of methods of data collection (face-to-face
interviews versus telephone interviews versus mailed questionnaires) on identified prevalence
rates of probable pathological gambling.
2
Gambling and Problem Gambling in Puerto Rico
Introduction
Until recently throughout the world, the legalization of gambling has proceeded with little
consideration of the potentially negative impacts that gambling can have on individuals, families and
communities. In the 1990s, however, prevalence surveys have become an essential component
in the establishment and monitoring of gambling legalization (Volberg & Dickerson, 1996).
While gambling in Puerto Rico dates back to the Spanish period of colonization, the
establishment of some form of assistance for problem gamblers did not come until 1994 when the
Department of the Treasury funded a helpline (Programa PODEMOS). As in many other
jurisdictions, services for problem gamblers were established in Puerto Rico before any empirical
research was undertaken to determine the prevalence of gambling and problem gambling on the
Island.
In 1997, the first prevalence survey of gambling and problem gambling was carried out in
Puerto Rico. The main purpose of this study was to explore the extent and magnitude of legal
and illegal gambling among adults in Puerto Rico and to examine different gambling patterns in
the population. The study also sought to establish a baseline measure of the prevalence of
gambling-related problems and to identify the types of gambling causing the greatest difficulties for
the citizens of Puerto Rico.
In this article, we first briefly present information about the evolution of legal gambling in
Puerto Rico. After a discussion of the methods used in collecting the data for this survey, we
examine patterns of gambling participation and gambling expenditures among a sample of 1,506
individuals aged 18 and over in Puerto Rico. We then identify some of the significant differences
between non-problem and pathological gamblers. We conclude with a discussion of the
significance of these findings for the field of gambling research.
The History of Gambling in Puerto Rico
Puerto Ricans have always been enthusiastic gamblers and these activities form an
essential part of everyday life in the Island. One of the oldest gambling activities in Puerto Rico
are the cockfights, a recreational activity introduced by the Spaniards and regulated by the
3
Gambling and Problem Gambling in Puerto Rico
government for many years. There are approximately 125 cockfighting arenas throughout Puerto
Rico and cockfights are held every day throughout the Island. Horse racing was also introduced
to Puerto Rico by the Spaniards and has been regulated by the government since the beginning
of the 20th Century. In 1910, horse racing was legalized throughout the island and, in 1956,
wagering at off-track facilities (OTB) was legalized. At present, horse races are run five days a
week at the “El Comandante” racetrack, in Canóvanas, near San Juan, Puerto Rico.
Casinos represent one of the most recent legal gambling activities in Puerto Rico, having
been instituted under the Random Games Law in 1948. Nearly all of the tourist hotels in Puerto
Rico have casinos where both tourists and Puerto Ricans are able to play slot machines and
table games like blackjack, poker, craps and roulette.
The first lottery in Puerto Rico dates back to 1814 when the Puerto Rico Traditional
Lottery was started by order of the King of Spain. However, it was not until 1934 that the lottery
was officially instituted. “Loto” and “Pega Tres” (Pick Three) are special lottery games created in
1989. These games are run electronically and buyers are able to select their own numbers, six in
the case of “Loto” and three in the case of “Pega Tres.” All lotteries in Puerto Rico are weekly
games. “Pega Tres” was initiated in 1990 and “Loto” in 1991.
Charitable games, specifically bingo, were legalized in Puerto Rico in 1950. Only
churches and non-profit organizations with at least 10 years of operation in Puerto Rico are
permitted to conduct charitable gaming activities and each specific activity requires a separate
permit. Another small-stakes form of gambling, known as “Picas,” is a traditional activity that
dates back to the Spanish colonial period. This activity and other small-stakes games are
permitted under a 1927 law that was amended twice in the mid-1930s. These games are a
feature of the Patron Feast week held by each municipality once a year.
Illegal lotteries in Puerto Rico include all types of lottery games not organized or
authorized by the Government of Puerto Rico. “Bolita” (known as “the numbers” in English) is the
most common illegal lottery game. “Bolita” is similar to the legal “Pega Tres” game. In some
parts of the Island, variations of “bolita” are played with different styles and frequency. Some
4

Gambling and Problem Gambling in Puerto Rico
areas use race tracks to identify the winning number since horse races are run five days a week.
Others use the “Pega Tres” winning game or the last three digits of the Traditional Lottery.
Other illegal types of gambling in Puerto Rico include illegal horse race betting, dog
fights, cockfights outside of licensed arenas and car races outside of officially established tracks.
Betting on sports events and on slot machines not regulated by the government are also illegal in
Puerto Rico.
Despite public concerns, legal gambling is an expanding enterprise in Puerto Rico.
According to the Treasury Department, betting on legal types of gambling in Puerto Rico has
increased 609% in the 24 years between FY 1970 and FY 1995, from $343 million to $2.6 billion.
The same quarter-century has seen an increase of 593% in revenues to the Government of
Puerto Rico from legal gambling activities. In FY 1970, the government received $37 million in
revenues from legal types of gambling on the Island. In FY 1995, the government received $259
million in revenues from legal gambling on the Island.
Methods Nearly all of the surveys of gambling and problem gambling completed to date have been
baseline surveys, assessing these behaviors in the population for the first time. Baseline
prevalence surveys provide estimates of the number of individuals in the general population who
have experienced or are experiencing difficulties controlling their involvement in gambling as well as
information about the demographic characteristics and gambling activities of these individuals. This
information is useful in planning for the availability of gambling opportunities as well as in targeting
services for problem gamblers.
The great majority of surveys of gambling and problem gambling have been conducted by
telephone. Baseline studies of gambling and problem gambling have been carried out in 32
United States and Canadian jurisdictions as well as in Australia, New Zealand and Spain.
Replication surveys based on the South Oaks Gambling Screen have been carried out in nine
North American jurisdictions.
5
Gambling and Problem Gambling in Puerto Rico
In contrast to other jurisdictions, the Puerto Rico survey was conducted through household
interviews rather than by telephone. The decision to conduct household rather than telephone
interviews in Puerto Rico was based on the high proportion of families in Puerto Rico with no
telephone service or with unlisted telephone numbers. Without access to close to one-third of the
population of the Island, it would have been impossible to obtain a representative sample of Puerto
Rico residents by means of a telephone survey. In addition, the Puerto Rico survey was conducted
in Spanish which meant that a careful and validated translation of the English questionnaire was
required.
The survey in Puerto Rico was completed in seven stages. These stages included
developing the sample design, translating and back-translating the questionnaire, conducting a pilot
survey to test clarity and comprehension of the questionnaire, completion of 1,506 interviews with
respondents in the community aged 18 and over, coding and analyzing the data and preparing a
report to the Treasury Department.
Sample Design The sampling design for the study used a double stratification process to obtain adequate
representation by type of municipality as well as by urban versus rural residence. A sample of
1,500 was considered appropriate in order to maintain comparability with similar surveys done in
other jurisdictions as well as to obtain an acceptable level of confidence (±2.5%) in the overall
results of the survey. Once the sample sizes for urban and rural groups in each type of municipality
were identified, a subset of municipalities from each category was selected. Three metropolitan
municipalities, three large towns and eight small towns were randomly selected from the 78
municipalities in Puerto Rico.
A total of 1,506 interviews were completed in March and April of 1997. Information from
the interviewers showed that approximately 45 individuals (representing 3% of the completed
sample) refused to participate in the study. This represents an excellent response rate; far better
than response rates typically achieved with mail or telephone surveys. Sample respondents
were compared to the Puerto Rico population along three dimensions: gender, age and urban-
6
Gambling and Problem Gambling in Puerto Rico
rural distribution. There were no statistically significant differences between the sample and the
total population in terms of any of these variables.
Questionnaire
The questionnaire for the survey in Puerto Rico was composed of three sections. The
first section included questions about 13 different types of gambling, legal and illegal, available to
residents of Puerto Rico. For each type of gambling, respondents were asked whether they had
ever tried this type of gambling, whether they had tried it in the past year and whether they
participated once a week or more in this type of gambling. Respondents were also asked to
estimate their monthly expenditures on any type of gambling that they had tried in the past year.
The second section of the questionnaire was composed of the lifetime and current South Oaks
Gambling Screen items. The South Oaks Gambling Screen (Lesieur & Blume, 1987) is the tool
most often used by clinicians and researchers to identify individuals as problem or pathological
gamblers. The final section of the questionnaire included questions about the demographic
characteristics of each respondent.
The questionnaire was translated into Spanish by a Puerto Rico-based translation
service and analyzed by a law professor, a professor of sociology and a professor of clinical
psychology for accuracy and content validity. The Spanish questionnaire was then translated
back into English by another Puerto Rico-based translation service. These translators did not
have access to the original English version of the questionnaire. The back-translation was
reviewed by the authors of this article and assessed for correspondence to the original English
version.
Pilot Test
A pilot test of the Spanish questionnaire was completed with 50 households to test the
efficacy of the translation. Since the South Oaks Gambling Screen was already known to have
good reliability in English, reliability analysis of the data from the pilot test was done largely to test
whether the instrument was operating as expected in the Spanish translation.
7
Gambling and Problem Gambling in Puerto Rico
In conducting the analysis of the reliability of the questionnaire, the data were clustered
into 15 different groups.1 The first 13 clusters were made up of questions about each type of
gambling; the remaining two clusters were composed of the South Oaks Gambling Screen items
and a group of miscellaneous items. With the exception of the South Oaks Gambling Screen
which contains 20 items, all of the other clusters included between five and seven items.
Reliability analysis was performed for each cluster as well as for the questionnaire as a whole,
since this was the principal unit of measurement.
The initial reliability analysis of the pilot test data showed that while the South Oaks
Gambling Screen had high reliability (coefficient alpha = .89), the remaining clusters and the
overall questionnaire had a lower than acceptable reliability. Examination of the “gambling”
clusters and the entire questionnaire revealed a common element responsible for the low
reliability values. In a consistent fashion, the questions responsible for the degradation of the
alpha value were those related to gambling expenditures. When the reliability coefficients were
re-computed excluding these questions, the coefficient alpha was raised to .82 for the overall
questionnaire. The alpha values for the individual gambling clusters were raised to nearly .50
which is adequate, given the small number of items in each cluster. On the basis of this analysis,
we concluded that the Spanish version of the questionnaire is highly reliable although the
expenditure items should be treated with caution.
Gambling In Puerto Rico In every recent survey of gambling and problem gambling in North America, the majority of
respondents acknowledge participating in one or more of the gambling activities included in the
questionnaire. In the United States, the proportion of respondents who have ever gambled ranges
from 64% in Mississippi in 1996 to 92% in New Jersey in 1989 (Volberg, 1997; Volberg &
Steadman, 1989). In 1997, 93% of the respondents in Puerto Rico acknowledged participating in
one or more of 13 gambling activities.
1 The reliability analysis of the pilot test data was carried out by Dr. Rubén Vélez García, a clinical psychologist and specialist in quantitative analysis.
8
Gambling and Problem Gambling in Puerto Rico
Lifetime participation among Puerto Rico respondents was highest for lotteries, charitable
games (not including bingo) and casinos. Lifetime participation rates were also high for the illegal
numbers game (“bolita”), gambling machines not at casinos, parimutuel wagering on horses and
cockfights and bingo. Lifetime participation rates for all other types of gambling were much lower.
The majority of respondents who ever gambled in Puerto Rico had done so in the past year.
Past-year participation was highest for the lotteries although participation rates for charitable games,
casinos, the numbers, gambling machines and wagering on horses and cockfights were also high.
The pattern of gambling participation in Puerto Rico, where the majority of respondents (61%)
participate once a week or more in at least one type of gambling, is distinct from all other
jurisdictions where similar surveys have been done.
Expenditures
Information about respondents’ expenditures on gambling in Puerto Rico must be treated
with caution. This is because of the low reliability of these items, identified in our analysis of data
from the pilot test. The analysis of expenditure data presented here is intended only as a means
of confirming the relative importance of the different types of gambling in Puerto Rico and not as
a method for ascertaining actual spending on different types of gambling.
One important adjustment to the expenditure data from Puerto Rico was to exclude the
expenditures of eight respondents who claimed to spend very large amounts at casinos in a typical
month. This adjustment was made for two reasons. First, the expenditures of these eight
individuals had an extreme impact on our analysis of gambling expenditures for the sample as a
whole. Second, an examination of the demographic characteristics of these individuals led us to
question the truth of their claims. 2
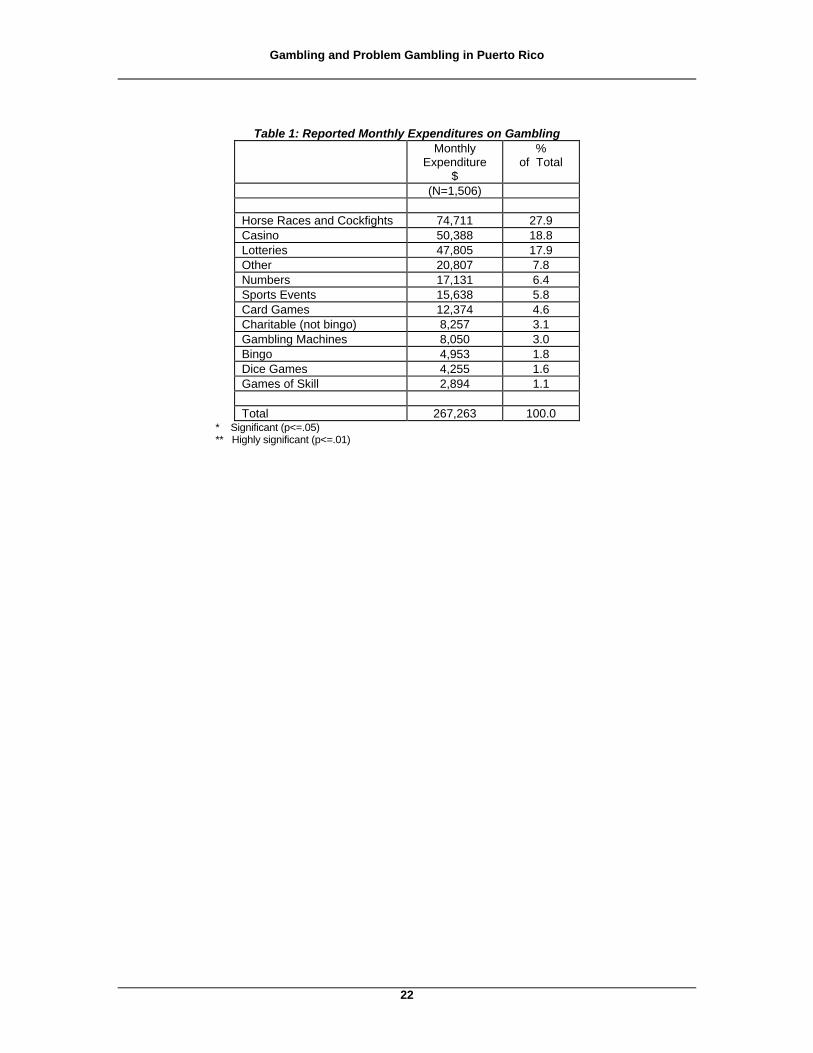
Table 1 shows total reported monthly expenditures on different types of gambling in Puerto
Rico as well as the proportion that each type of expenditure represents of total adjusted monthly
2 All of these respondents were middle-aged, divorced or separated men from outside Puerto Rico living in metropolitan areas and claiming annual incomes under $15,000. However, all of these men claimed that they spent $20,000 or more at casinos in a typical month. The adjustment was made by calculating the casino expenditures of these respondents as zero.
9
Gambling and Problem Gambling in Puerto Rico
expenditures on gambling. Only those types of gambling for which total monthly expenditures
exceeded 1% of the total monthly expenditure are shown.
TABLE 1 ABOUT HERE
Table 1 shows that monthly expenditures on three types of gambling account for 65% of
reported expenditures on gambling. Expenditures on horse races and cockfights account for over
one-quarter (28%) of total gambling expenditures. Monthly expenditures at casinos account for
another 19% and expenditures on the lotteries account for 18% of total monthly gambling
expenditures. Expenditures on all other types of gambling are much lower and none represent
more than 10% of the total.
In most jurisdictions, a small proportion of the respondents (between 5% and 10%) report
spending relatively large amounts on gambling in a typical month. In Puerto Rico, 27% of the
respondents report spending $100 or more on gambling in a typical month. This is more than twice
the proportion of heavy spenders identified in other jurisdictions. These heavy gamblers account for
90% of reported monthly expenditures on gambling in Puerto Rico.
Respondents in the highest spending group in Puerto Rico are significantly more likely to be
male and divorced or separated than respondents in lower spending groups. These high-spending
respondents are significantly more likely to have graduated from high school, to be employed and to
have annual household incomes over $25,000 than respondents in lower spending groups.
Men in Puerto Rico estimate that they spend more than twice as much on gambling in a
typical month as women. Respondents who have not graduated from high school report spending
significantly less than those who have a high school diploma or have attended college.
Respondents who are employed report spending significantly more on gambling than respondents
who are unemployed or those who are keeping house, retired or disabled. Finally, respondents with
annual household incomes over $50,000 report spending significantly more on gambling than
respondents with lower annual household incomes.
10
Gambling and Problem Gambling in Puerto Rico
Pathological Gambling In Puerto Rico The majority of people who participate in legal gambling are “social gamblers” who gamble
responsibly, for entertainment and to socialize with friends and family. In general, the term “problem
gambling” refers to all of the patterns of gambling behavior that compromise, disrupt or damage
personal, family or vocational pursuits (National Council on Problem Gambling, 1997). “Pathological
gambling” lies at one end of a spectrum of problem gambling and was first recognized as a
psychiatric disorder in 1980 (American Psychiatric Association, 1980). Recent changes have been
made to the psychiatric criteria for pathological gambling to incorporate empirical research that links
pathological gambling to other addictive disorders like alcohol and drug dependence. The essential
features of pathological gambling are a continuous or periodic loss of control over gambling; a
progression, in gambling frequency and amounts wagered, in the preoccupation with gambling and
in obtaining monies with which to gamble; and a continuation of gambling involvement despite
adverse consequences (American Psychiatric Association, 1994).
In prevalence surveys, individuals are categorized as “problem gamblers” or “probable
pathological gamblers” on the basis of their responses to the questions included in the South Oaks
Gambling Screen (Lesieur & Blume, 1987). Respondents scoring three or four out of a possible 20
points on the South Oaks Gambling Screen items are classified as "problem gamblers" while those
scoring five or more points are classified as "probable pathological gamblers." In surveys
conducted since 1990, a distinction is also made between "lifetime" and “current” problem and
probable pathological gamblers. Lifetime problem and probable pathological gamblers are
individuals who have, at some time in their lives, met the South Oaks Gambling Screen criteria
for problem or pathological gambling. Current problem and probable pathological gamblers are
individuals who have met these criteria in the past year.
Research on the performance of the South Oaks Gambling Screen has shown that the
lifetime screen is very good at detecting pathological gambling among those who currently
experience the disorder. However, as expected, the screen identifies at-risk individuals at the
expense of generating a substantial number of false positives. The current South Oaks Gambling
Screen produces fewer false positives than the lifetime measure but more false negatives and thus
11
Gambling and Problem Gambling in Puerto Rico
provides a weaker screen for identifying pathological gamblers in the clinical sense. However, the
greater efficiency of the current South Oaks Gambling Screen makes it a more useful tool for
detecting rates of change in the prevalence of problem and pathological gambling over time (Abbott
& Volberg, 1996).
Following established criteria for classifying respondents with gambling-related
difficulties, Puerto Rico respondents who scored three or four points on the lifetime South Oaks
Gambling Screen were classified as “lifetime problem gamblers” while those who scored five or
more points were classified as “lifetime probable pathological gamblers.” Respondents who
scored three or four points on the current South Oaks Gambling Screen were classified as
“current problem gamblers” while those who scored five or more points were classified as
“current probable pathological gamblers.” In Puerto Rico, 7.4% (±1.3%) of the respondents
scored as lifetime probable pathological gamblers and an additional 6.4% (±1.2%) of the
respondents scored as lifetime problem gamblers. Also in Puerto Rico, 6.8% (±1.3%) of the
respondents scored as current probable pathological gamblers and an additional 4.4% (±1.0%) of
the respondents scored as current problem gamblers.
12
Gambling and Problem Gambling in Puerto Rico
Comparing Non-Problem And Pathological Gamblers In Puerto Rico As in other jurisdictions, there are differences between non-problem gamblers and probable
pathological gamblers in Puerto Rico. Probable pathological gamblers in Puerto Rico are
significantly more likely than non-problem gamblers to be male and between the ages of 21 and 54
while non-problem gamblers are more likely to be female and over the age of 55. While two out of
every three gamblers in Puerto Rico are married, probable pathological gamblers are more likely to
be divorced or separated than non-problem gamblers. In contrast, non-problem gamblers are more
likely to be widowed or never married than probable pathological gamblers in Puerto Rico.
Probable pathological gamblers are significantly more likely to be employed than non-problem
gamblers in Puerto Rico and to have annual household incomes over $50,000. Probable
pathological gamblers in Puerto Rico are significantly younger than non-problem gamblers and they
acknowledge starting to gamble at a significantly younger age.
Probable pathological gamblers in Puerto Rico are significantly more likely than non-
problem gamblers to have ever tried most of the different types of gambling included in the survey.
This includes wagering at casinos, card games, horse races or cockfights, gambling machines,
games of skill, dice games, sports and ‘bolita.” Non-problem and probable pathological gamblers
are just as likely to have purchased lottery tickets and to have played bingo while non-problem
gamblers are significantly more likely than probable pathological gamblers to have ever wagered on
charitable games not including bingo. These same differences are true for gambling in the past
year.
Probable pathological gamblers in Puerto Rico are significantly more likely than non-
problem gamblers to gamble once a week or more often. Probable pathological gamblers are most
likely to gamble weekly on “continuous” types of gambling, characterized by rapid cycles of play.
These include wagering on horse races and cockfights, “bolita,” illegal gambling machines, at
casinos, on sports, on card games not at a casino and on games of skill. While more non-problem
gamblers than probable pathological gamblers in Puerto Rico identified the lotteries as their favorite
type of gambling, significantly more probable pathological gamblers than non-problem gamblers
13
Gambling and Problem Gambling in Puerto Rico
identified wagering at a casino and wagering on horse races and cockfighting as their favorite type
of gambling.
Although expenditures on every type of gambling except charitable games are significantly
higher for probable pathological gamblers than for non-problem gamblers in Puerto Rico, the
greatest differences between non-problem and probable pathological gamblers in Puerto Rico in
average monthly expenditures are for gambling on horse races and cockfights and for wagering at
casinos. Differences between non-problem and probable pathological gamblers’ expenditures on
lotteries and sports are also substantial. The average total monthly expenditures on gambling are
three times higher for probable pathological gamblers than for non-problem gamblers in Puerto
Rico.
There are other significant differences between non-problem and probable pathological
gamblers in Puerto Rico. One important difference between non-problem and probable pathological
gamblers is the age at which they start gambling. While the mean age at which non-problem
gamblers in Puerto Rico started gambling is 21 years old, the mean age at which probable
pathological gamblers in Puerto Rico started gambling is significantly younger at 18 years old.
Probable pathological gamblers are significantly more likely than non-problem gamblers in
Puerto Rico to have felt nervous about their gambling and to have felt that one or both parents had
a gambling problem. Probable pathological gamblers are significantly more likely than non-problem
gamblers to spend three or more hours gambling per session, to have lost $100 or more in a single
day and to travel 15 or more miles in order to gamble.
Discussion The findings from the Puerto Rico gambling survey have implications for policy and
program decisions now being made throughout the world. The data from the Puerto Rico survey
raise a number of interesting issues for the field of gambling research. These include the role of
socio-economic status in the prevalence of pathological gambling and the impact of different
methods of data collection on identified prevalence rates.
14
Gambling and Problem Gambling in Puerto Rico
Identifying Prevalence Rates Similar to Puerto Rico
The lifetime and current prevalence rates of probable pathological gambling in Puerto
Rico are far higher than prevalence rates in any other United States jurisdiction. These rates are
also far higher than prevalence rates of probable pathological gambling in the Canadian
provinces, Australia, New Zealand and Europe (Abbott & Volberg, 1996; Becoña, 1996;
Dickerson, Baron, Hong & Cottrell, 1996; Ladouceur, 1996).
Prevalence rates similar to those identified in Puerto Rico have only been found among
two specific ethnic groups. These include the Maori in New Zealand and American Indians in
North Dakota (Abbott & Volberg, 1996; Volberg, 1993; Volberg & Silver, 1993). Substantial
numbers of these two ethnic groups were surveyed as part of larger studies of gambling and
problem gambling in New Zealand in 1991 and North Dakota in 1992. The national survey in
New Zealand included a random sample of 3,933 respondents and an additional 120 individuals
with Maori or Pacific Island ancestry. The survey in North Dakota included a random sample of
1,517 respondents and an additional sample of 400 American Indians (primarily Sioux and
Chippewa) from the four counties in the state with the highest proportion of American Indian
residents.
All of the New Zealand respondents and the majority of the North Dakota respondents
were interviewed by telephone although a small group of the American Indian respondents in
North Dakota (N=72) were interviewed in person by American Indian interviewers. Like the
questionnaire used in Puerto Rico, the questionnaire administered to all of the respondents in
New Zealand and North Dakota was composed of three major sections, including questions
about involvement in different types of gambling, the lifetime and current South Oaks Gambling
Screen and demographic items.
Despite great differences among indigenous people throughout the world, there are
similarities in the conditions under which many of these groups live. Poverty, unemployment and
dependence on welfare are widespread. Many such groups have been subject to a history of
colonization and accompanying policies of economic exploitation and many remain relatively
disadvantaged in socio-economic terms. Like other indigenous groups, Maori and American
15
Gambling and Problem Gambling in Puerto Rico
Indians have relatively low levels of formal education and household income. These groups also
have high unemployment rates and high levels of morbidity and mortality on a wide range of indices
including particularly high rates of alcohol and substance misuse.
In a subsequent analysis of the data from New Zealand and North Dakota, Caucasian
respondents from New Zealand were compared with Maori respondents and Caucasian
respondents from North Dakota were compared with American Indian respondents (Volberg &
Abbott, 1997). Compared to Caucasians in each jurisdiction, the Maori in New Zealand and the
American Indians in North Dakota were significantly more likely to gamble weekly and to
acknowledge spending significantly higher amounts on gambling in a typical month. Compared
to Caucasians in each jurisdiction, the Maori in New Zealand and the American Indians in North
Dakota had significantly higher lifetime and current prevalence rates of problem and pathological
gambling.
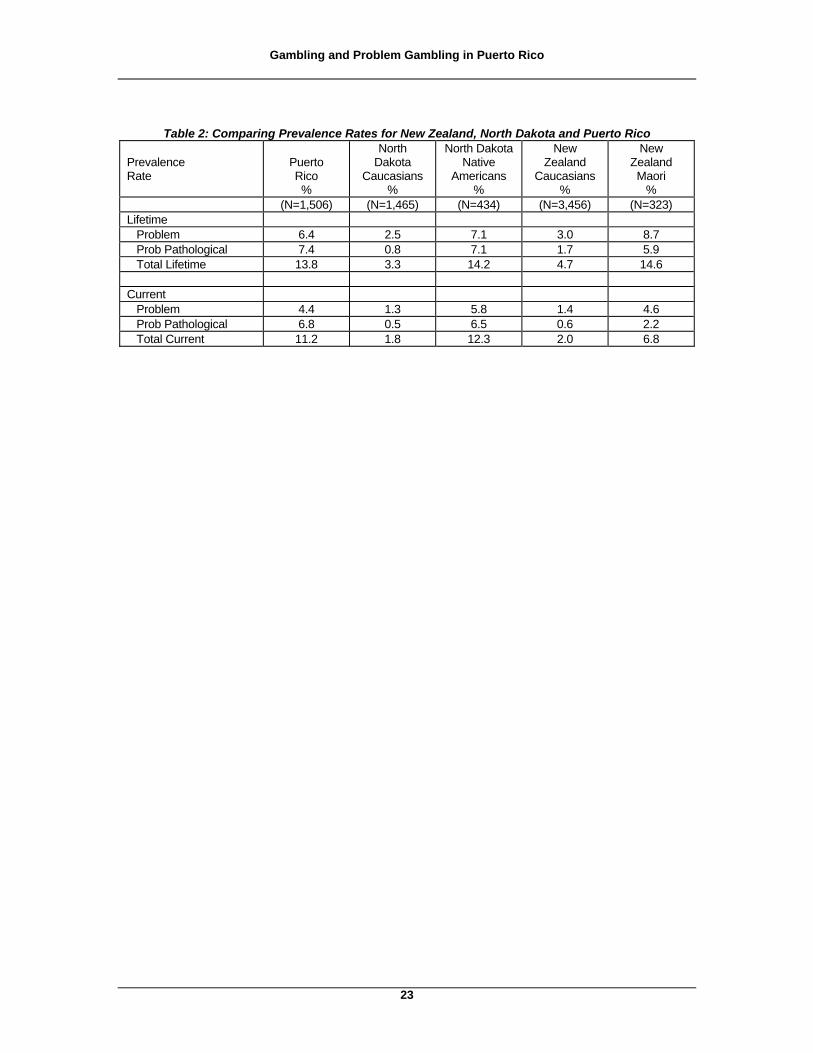
Table 2 shows the lifetime and current prevalence rates of probable pathological
gambling for Puerto Rico as well as for American Indians from North Dakota, Maori from New
Zealand and Caucasians from these two jurisdictions. Group sizes for Maori in New Zealand and
American Indians in North Dakota reflect the inclusion of some minority respondents in the
random samples of the general population in each jurisdiction. The table shows that the lifetime
and current prevalence rates of problem and pathological gambling in Puerto Rico are similar to
the prevalence rates among American Indians in North Dakota and the Maori in New Zealand
and far higher than the prevalence rates among Caucasians in these two jurisdictions.
TABLE 2 ABOUT HERE
It has been suggested that, in contrast to the upper and middle classes, the working and
lower classes represent subcultures where gambling is a socially sanctioned activity that gives
status to the participants (Volberg, Reitzes & Boles, 1997). Combined with the stresses that are
part of working and lower class life, gambling represents a challenging opportunity to beat the
16
Gambling and Problem Gambling in Puerto Rico
system, get some action, demonstrate one’s skills and gain prestige among one’s friends. Since
gambling is so widely sanctioned and gambling participation and expenditures are so much
higher among these groups, it follows that prevalence rates of probable pathological gambling will
be far higher than in jurisdictions where these groups represent a far smaller proportion of the
population. We can therefore hypothesize that the extremely high prevalence rates among
American Indians in North Dakota, the Maori in New Zealand and in Puerto Rico all emerge from
the role played by gambling in these highly impoverished cultures.
The Impact of Method on Prevalence Rates
One issue in conducting surveys of gambling and problem gambling is whether the
method of data collection has an impact on the identified prevalence of probable pathological
gambling. Some researchers have suggested that telephone surveys underestimate the true
prevalence of probable pathological gambling because of the likelihood that some other person in
the household may be listening to the interview (Lesieur, 1994). This assumes that the other
person is listening in on a telephone extension or, alternatively, that the questions in the interview
can be easily inferred from the respondent’s answers to specific items.
Research on differences in disclosure rates in surveys of other sensitive topics, such as
depression and personal health practices, does not support the notion that significant bias is
introduced by the method used to collect the data (Hochstim, 1967; Wells, Burnham, Leake &
Robins, 1988). Similar evidence has emerged in the field of gambling research. For example, no
significant differences were found in disclosure rates for alcohol and drug use, school grades,
physical health, psychological distress, eating disorders or gambling-related difficulties when
adolescents surveyed by telephone and with a paper-and-pencil questionnaire in high schools
were compared (Winters, Stinchfield & Fulkerson, 1993). Further, a recent survey of 3,000
respondents aged 15 to 74 in Sweden found no significant differences in gambling participation
or problem gambling prevalence rates when the results from respondents interviewed by a
mailed questionnaire and those interviewed by telephone were compared (Abbott, Rönnberg &
Volberg, 1997).
17
Gambling and Problem Gambling in Puerto Rico
It is possible that the exceptionally high prevalence rates of lifetime and current probable
pathological gambling identified in Puerto Rico are the result of the data collection method used
in Puerto Rico. Respondents interviewed in person may be more willing to acknowledge socially
undesirable behaviors and this may lead to higher rates of agreement with items on the South
Oaks Gambling Screen. Further research is required to determine whether face-to-face
interviews lead to significantly different rates of acknowledgment of problem gambling questions
than either mailed questionnaires or telephone interviews.
A more likely explanation is that prevalence rates of probable pathological gambling are
substantially higher among marginal and highly impoverished groups like the Maori in New
Zealand and American Indians in the United States. Again, further research and analysis is
required to determine whether prevalence rates of probable pathological gambling are
substantially higher among extremely low income groups than among respondents with higher
socio-economic status.
Conclusion The impacts of gambling-related difficulties can be substantial, not only for individuals but
for families and communities. Pathological gamblers experience physical and psychological stress
and exhibit substantial rates of depression, alcohol and drug dependence and suicidal ideation.
The families of pathological gamblers experience physical and psychological abuse as well as
harassment and threats from bill collectors and creditors. Other significant impacts include those on
employers, creditors, insurance companies, social service agencies and the civil and criminal justice
systems.
The first step usually taken by governments in response to an emerging social problem is
to determine the number of individuals who may be in need of assistance as a result of a specific
government policy or activity. The next step is to develop a range of services for affected
individuals and their families. In the wake of widespread gambling legalization in the 1980s and
1990s, governments throughout the world have moved forward in implementing measures to
18
Gambling and Problem Gambling in Puerto Rico
educate the public as well as treatment professionals and gaming operators about gambling-
related difficulties.
This study represents the first thorough assessment of rates of gambling and problem
gambling in Puerto Rico. The data from this survey provide insights that will be valuable in ongoing
policy and planning efforts on the Island. In the future, it will be important for everyone involved with
legal gambling in Puerto Rico to continue to work together to develop ways to help the citizens of
Puerto Rico who experience difficulties related to their gambling and to prevent any future increases
in the prevalence of problem gambling on the Island.
19
Gambling and Problem Gambling in Puerto Rico
References Abbott, M. W. & R. A. Volberg. 1996. "The New Zealand National Survey of Problem and
Pathological Gambling." Journal of Gambling Studies, 12 (2): 143-160. Abbott, M. W., S. Rönnberg & R. A. Volberg. 1997. Some Major Conclusions from the Pilot
Study of Gambling and Problem Gambling in Sweden. Report to the Sweden Ministry of Health and Social Affairs.
American Psychiatric Association. 1980. Diagnostic and Statistical Manual of Mental Disorders,
Third Edition. Washington, DC: American Psychiatric Association. American Psychiatric Association. 1994. Diagnostic and Statistical Manual of Mental Disorders,
Fourth Edition. Washington, DC: American Psychiatric Association. Becoña, E.. 1996. "Prevalence Surveys of Problem and Pathological Gambling in Europe: The
Cases of Germany, Holland and Spain," Journal of Gambling Studies 12 (2): 179-192. Dickerson, M. G., E. Baron, S-M. Hong & D. Cottrell. 1996. "Estimating the Extent and Degree of
Gambling-Related Problems in the Australian Population: A National Survey," Journal of Gambling Studies 12 (2): 161-178.
Hochstim, J. R. 1967. “A Critical Comparison Of Three Strategies Of Collecting Data From
Households,” Journal Of The American Statistical Association 62: 976-987. Ladouceur, R. 1996. "Prevalence of Pathological Gamblers in Canada and Related Issues,"
Journal of Gambling Studies 12 (2): 129-142. Lesieur, H. R. 1994. "Epidemiological Surveys of Pathological Gambling: Critique and Suggestions
for Modification," Journal of Gambling Studies 10 (4): 385-398. Lesieur, H. R. & S. B. Blume. 1987. "The South Oaks Gambling Screen (SOGS): A New
Instrument for the Identification of Pathological Gamblers," American Journal of Psychiatry 144: 1184-1188.
National Council on Problem Gambling. 1997. Problem and Pathological Gambling in America:
The National Picture. Report prepared by the Research and Public Policy Committees of the National Council on Problem Gambling.
Volberg, R. A. 1993. Gambling and Problem Gambling Among Native Americans in North Dakota.
Report to the North Dakota Department of Human Services. Volberg, R. A. 1997. Gambling and Problem Gambling in Mississippi. Report to the Mississippi
Council on Compulsive Gambling. Social Research Report Series 97-1. Social Science Research Center, Mississippi State University.
Volberg, R. A. & M. W. Abbott. 1997. “Gambling and Problem Gambling Among Indigenous
Peoples,” Substance Use and Misuse 32 (11). (forthcoming). Volberg, R. A. and M. G. Dickerson (eds.). 1996. Journal of Gambling Studies, Special Issue on
International Prevalence Studies and Related Treatment Developments. Vol. 12, No. 2. Volberg, R. A. & E. Silver. 1993. Gambling and Problem Gambling in North Dakota. Report to the
North Dakota Department of Human Services, Division of Mental Health.
20
Gambling and Problem Gambling in Puerto Rico
Volberg, R. A. & H. J. Steadman. 1989. "Prevalence Estimates of Pathological Gambling in New
Jersey and Maryland," American Journal of Psychiatry 146: 1618-1619. Volberg, R. A., D. C. Reitzes & J. Boles. 1997. “Exploring the Links Between Gambling, Problem
Gambling and Self-Esteem.” Deviant Behavior 18: 321-342. Wells, K. B., Burham, M. A., Leake, B. & Robins, L. N. 1988. “Agreement Between Face-To-
Face And Telephone Administered Versions Of The Depression Section Of The NIMH Diagnostic Interview Schedule,” Journal Of Psychiatric Research 22: 207-220.
Winters, K. C., R. D. Stinchfield & J. Fulkerson. 1993. "Toward the Development of an Adolescent
Gambling Problem Severity Scale," Journal of Gambling Studies 9 (1): 63-84.
21
Gambling and Problem Gambling in Puerto Rico
Table 1: Reported Monthly Expenditures on Gambling Monthly
Expenditure $
% of Total
(N=1,506) Horse Races and Cockfights 74,711 27.9 Casino 50,388 18.8 Lotteries 47,805 17.9 Other 20,807 7.8 Numbers 17,131 6.4 Sports Events 15,638 5.8 Card Games 12,374 4.6 Charitable (not bingo) 8,257 3.1 Gambling Machines 8,050 3.0 Bingo 4,953 1.8 Dice Games 4,255 1.6 Games of Skill 2,894 1.1 Total 267,263 100.0
* Significant (p<=.05) ** Highly significant (p<=.01)
22
Gambling and Problem Gambling in Puerto Rico
Table 2: Comparing Prevalence Rates for New Zealand, North Dakota and Puerto Rico Prevalence Rate
Puerto Rico %
North Dakota
Caucasians %
North Dakota Native
Americans %
New Zealand
Caucasians %
New Zealand Maori
% (N=1,506) (N=1,465) (N=434) (N=3,456) (N=323) Lifetime Problem 6.4 2.5 7.1 3.0 8.7 Prob Pathological 7.4 0.8 7.1 1.7 5.9 Total Lifetime 13.8 3.3 14.2 4.7 14.6 Current Problem 4.4 1.3 5.8 1.4 4.6 Prob Pathological 6.8 0.5 6.5 0.6 2.2 Total Current 11.2 1.8 12.3 2.0 6.8
23