pressure-loss and flow coefficients … · inside a chordwise-finned, impingement, convection ......
TRANSCRIPT
NASA TECHNICAL
MEMORANDUM
CO
NASA TM X-3028
PRESSURE-LOSS AND FLOW COEFFICIENTSINSIDE A CHORDWISE-FINNED,
IMPINGEMENT, CONVECTION, ANDFILM AIR-COOLED TURBINE VANE
by Steven A. Hippensteele
Lewis Research Center
Cleveland, Ohio 44135
NATIONAL AERONAUTICS AND SPACE ADMINISTRATION • WASHINGTON, D. C. • APRIL 1974
https://ntrs.nasa.gov/search.jsp?R=19740011532 2018-08-04T16:50:27+00:00Z
1. Report No.
NASA TM X-30282. Government Accession No. 3. Recipient's Catalog No.
4. Title and Subtitle
PRESSURE-LOSS AND FLOW COEFFICIENTS INSIDE A CHORDWISE-FINNED, IMPINGEMENT, CONVECTION, AND FILM AIR-COOLEDTURBINE VANE
5. Report DateAPRIL 1971*
6. Performing Organization Code
7. Author(s)
Steven A. Hippensteele8. Performing Organization Report No.
E-7719
9. Performing Organization Name and Address
Lewis Research CenterNational Aeronautics and Space AdministrationCleveland, Ohio 44135
10. Work Unit No.
501-24
11. Contract or Grant No.
12. Sponsoring Agency Name and Address
National Aeronautics and Space AdministrationWashington, D.C. 20546
13. Type of Report and Period Covered
Technical Memorandum14. Sponsoring Agency Code
15. Supplementary Notes
16. Abstract
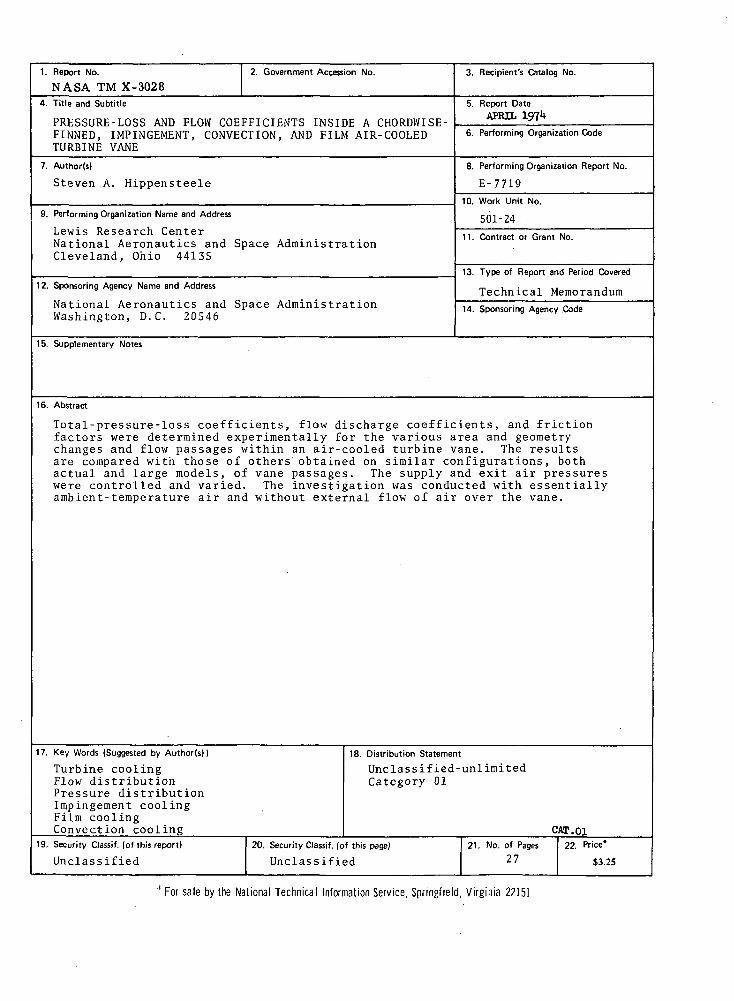
Total-pressure-loss coefficients, flow discharge coefficients, and frictionfactors were determined experimentally for the various area and geometrychanges and flow passages within an air-cooled turbine vane. The resultsare compared with those of others obtained on similar configurations, bothactual and large models, of vane passages. The supply and exit air pressureswere controlled and varied. The investigation was conducted with essentiallyambient-temperature air and without external flow of air over the vane.
17. Key Words (Suggested by Author(s))
Turbine coolingFlow distributionPressure distributionImpingement coolingFilm coolingConvection cooling
18. Distribution Statement
Unclassified-unlimitedCategory 01
CAT.01
19. Security Classif. (of this report)
Unclassified20. Security Classif. (of this page)
Unclassified21. No. of Pages
27
22. Price*
$3.25
' For sale by the National Technical Information Service, Springfield, Virginia 22151
PRESSURE-LOSS AND FLOW COEFFICIENTS INSIDE A CHORDWISE-FINNED,
IMPINGEMENT, CONVECTION, AND FILM AIR-COOLED TURBINE VANE
by Steven A. Hippensteeje
Lewis Research Center
SUMMARY
Total-pressure-loss coefficients, flow discharge coefficients, and
friction factors were experimentally determined for the various area and
geometry changes and flow passages within an air-cooled turbine vane. The
supply and local external pressure levels of the vane, with no external flow
of gas over the airfoil, were controlled to simulate those which might be
expected in an engine. The investigation was conducted with essentially
ambient-temperature air. The measured expansion and contraction total-
pressure-loss coefficients ranged from 1.03 to 1.85. These coefficients
in general can be predicted within about 20 percent with available infor-
mation. The orifice flow discharge coefficients were essentially constant
and varied from 0.73 to 0.87. These values compared well with results that
others obtained with similar passage configurations.
INTRODUCTION
An experimental investigation was made to determine total-pressure-
loss coefficients, flow discharge coefficients, and friction factors of an
air-cooled turbine vane and to compare the results with available data or
correlations.
An accurate knowledge of cooling airflow distribution within turbine
vanes is necessary for the correct prediction of both metal temperature
distribution and vane life. Cooling airflow distribution is, in turn,
based on accurate knowledge of pressure-loss and flow coefficients. This
study is part of a series of studies by the Lewis Research Center to in-
vestigate experimental coolant pressure-loss and flow coefficients in
various vanes, blades, and flow models. In a previous study (ref. 1), the
discharge coefficients for thick-plate orifice flow models were determined.
In reference 2 the coolant flow through a predominantly convection-cooled
vane with trailing-edge pin fins and leading-edge impingement cooling was
investigated. Reference 3 investigated the flow characteristics of sev-
eral turbine airfoil cooling system configurations consisting of leading-
edge impingement, impingement with crossflow, pin fins, a feeder supply
tube, and a composite model. An analysis of pressure and flow distribu-
tion in a strut-supported wire-cloth vane was made in reference 4. The
present report covers the experimental determination of total-pressure-
loss coefficients in a vane inlet and airfoil section, flow discharge co-
efficients in impingement and film cooling holes, and friction factors in
chordwise fin cooling passages.
The experimental tests were conducted on a full-size convection- and
film-cooled test vane with a 9.8-centimeter (3.86-in.) span and a 6.1-
centimeter (2.4-in.) chord. Collectors were attached to the film-cooling
and trailing-edge discharge ports, and the collector pressures were con-
trolled to simulate the external pressure distribution experienced in tur-
bine operation. The tests were run with air temperatures of 300 K (80 F)
and pressures of about 2 to 3 atmospheres.
In the vane design studied, a portion of the supply air impinged on
the leading edge and then exited through film cooling holes on both the
suction and pressure surfaces. The remaining cooling air flowed through
chordwise fin passages in the midchord region and then exited through a
split trailing edge.
APPARATUS
Test Equipment
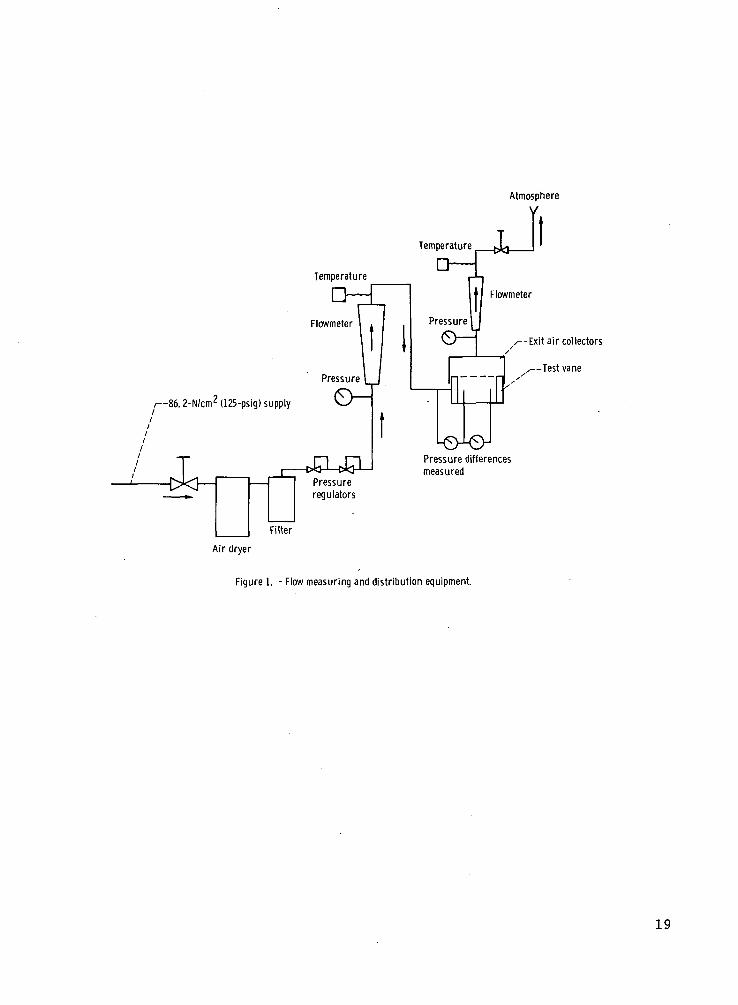
The flow measuring and distribution equipment used is shown schemati-
cally in figure 1. Air at 86.2 N/cm (125 psig) entered the test equip-
ment, was dried and filtered, and passed through a pressure regulator to
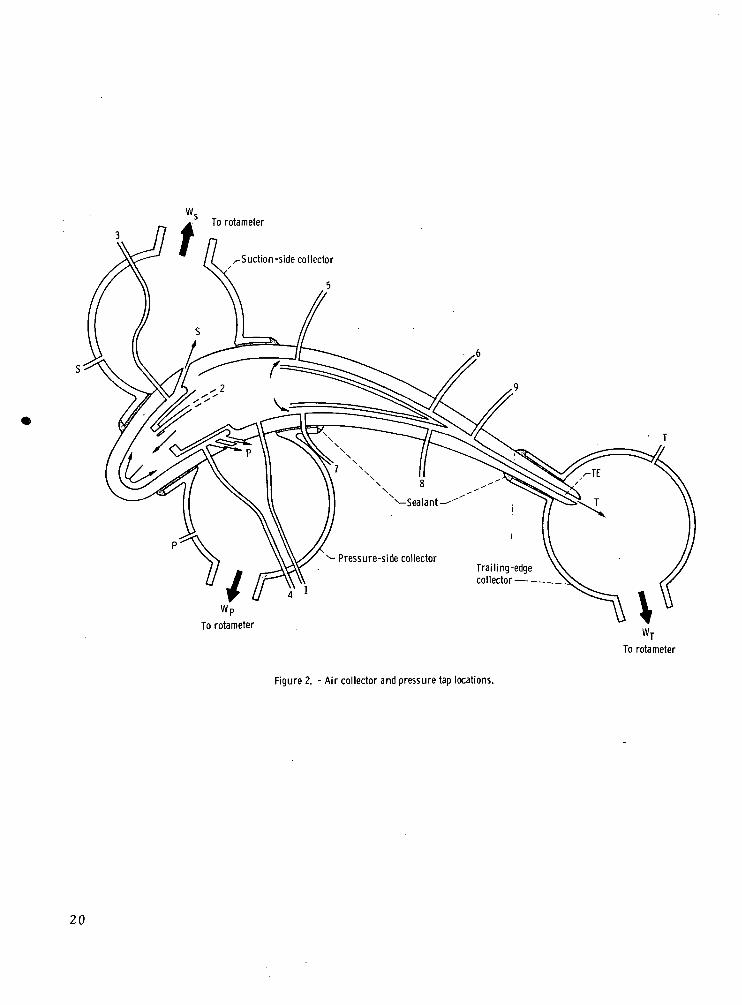
the test vane. The air that exited from openings in the vane suction side,
pressure side, and trailing edge was ducted to separate collectors attached
as shown in figure 2. From the collectors the air passed through separate
flowmeters and throttling valves before being discharged to the atmosphere.
The collectors were closed-end steel cylinders with contoured slots. These
collectors were attached by screws to the vane and sealed with an air-
curing silicone.
Test Vane
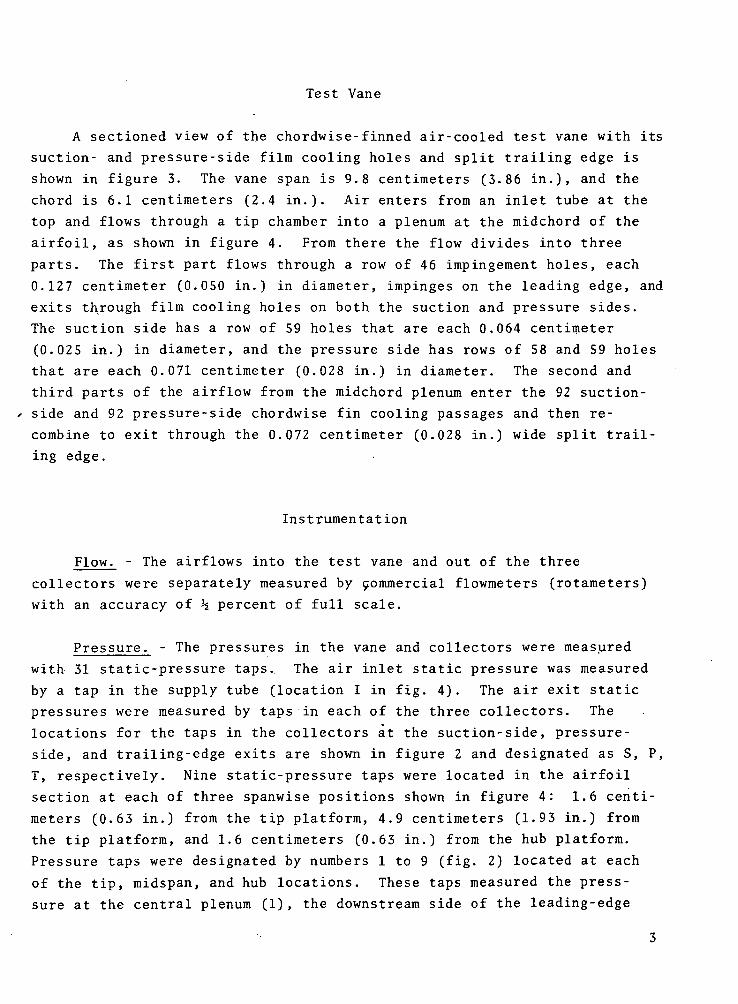
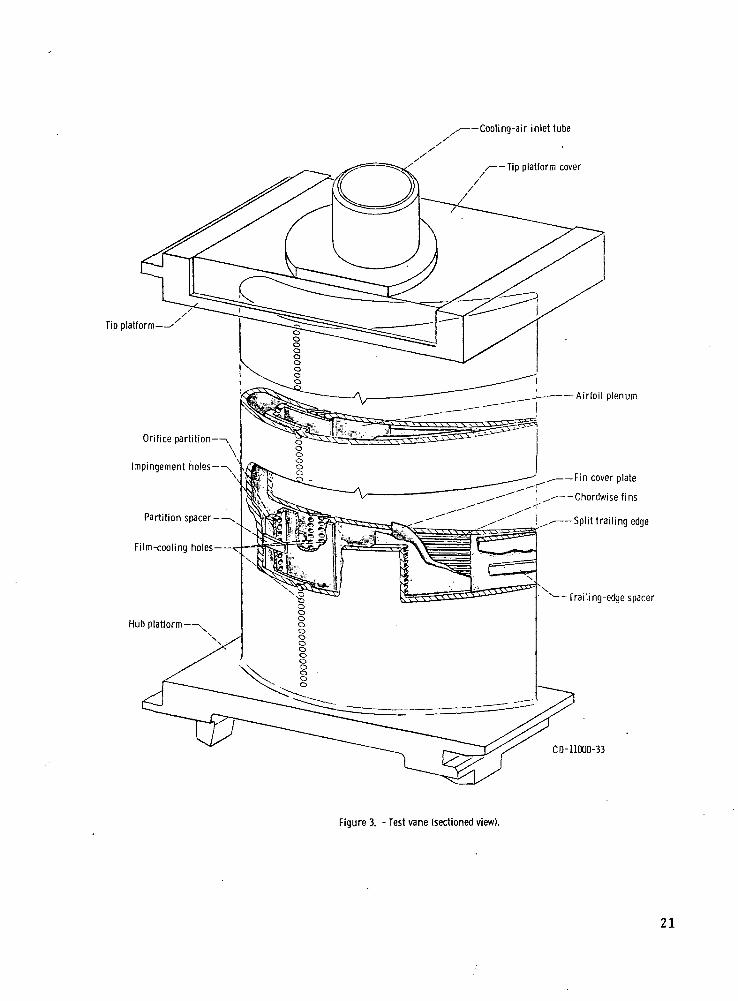
A sectioned view of the chordwise-finned air-cooled test vane with its
suction- and pressure-side film cooling holes and split trailing edge is
shown in figure 3. The vane span is 9.8 centimeters (3.86 in.), and the
chord is 6.1 centimeters (2.4 in.). Air enters from an inlet tube at the
top and flows through a tip chamber into a plenum at the midchord of the
airfoil, as shown in figure 4. From there the flow divides into three
parts. The first part flows through a row of 46 impingement holes, each
0.127 centimeter (0.050 in.) in diameter, impinges on the leading edge, and
exits through film cooling holes on both the suction and pressure sides.
The suction side has a row of 59 holes that are each 0.064 centimeter
(0.025 in.) in diameter, and the pressure side has rows of 58 and 59 holes
that are each 0.071 centimeter (0.028 in.) in diameter. The second and
third parts of the airflow from the midchord plenum enter the 92 suction-
side and 92 pressure-side chordwise fin cooling passages and then re-
combine to exit through the 0.072 centimeter (0.028 in.) wide split trail-
ing edge.
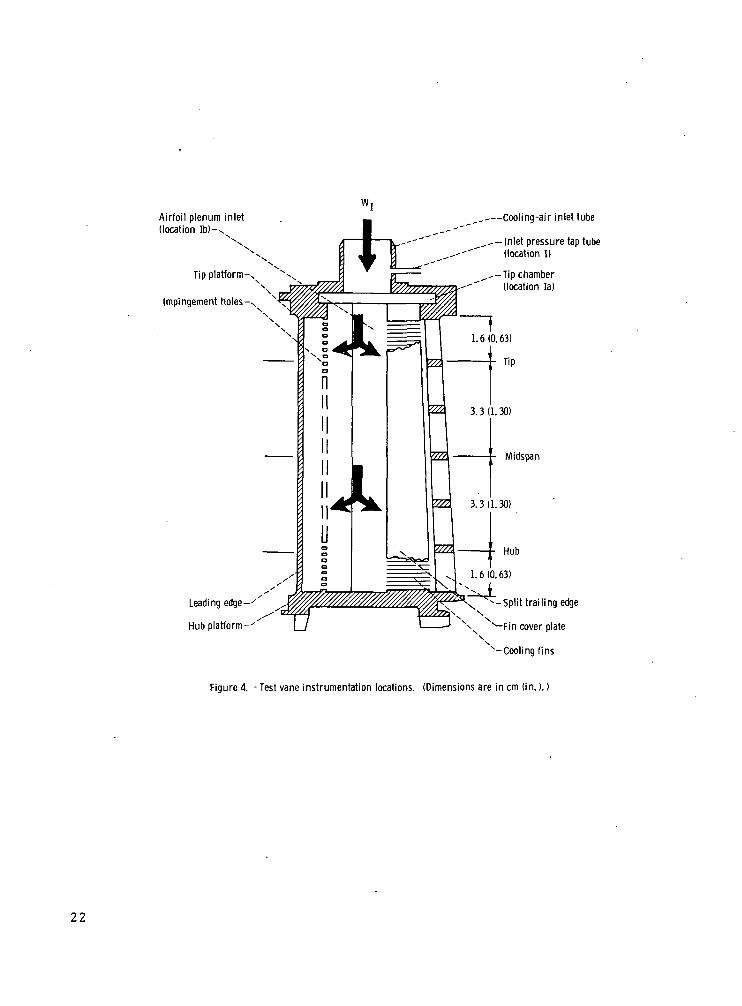
Instrumentation
Flow^ - The airflows into the test vane and out of the three
collectors were separately measured by commercial flowmeters (rotameters)
with an accuracy of h percent of full scale.
Pressure. - The pressures in the vane and collectors were measured
with 31 static-pressure taps.. The air inlet static pressure was measured
by a tap in the supply tube (location I in fig. 4). The air exit static
pressures were measured by taps in each of the three collectors. The
locations for the taps in the collectors at the suction-side, pressure-
side, and trailing-edge exits are shown in figure 2 and designated as S, P,
T, respectively. Nine static-pressure taps were located in the airfoil
section at each of three spanwise positions shown in figure 4: 1.6 centi-
meters (0.63 in.) from the tip platform, 4.9 centimeters (1.93 in.) from
the tip platform, and 1.6 centimeters (0.63 in.) from the hub platform.
Pressure taps were designated by numbers 1 to 9 (fig. 2) located at each
of the tip, midspan, and hub locations. These taps measured the press-
sure at the central plenum (1), the downstream side of the leading-edge

impingement holes (2), the upstream side of the suction-side (3) and
pressure-side (4) film cooling holes, the entrance (5) and exit (6) of the
suction-side cooling fin passages, the entrance (7) and exit (8) of the
pressure-side cooling fin passages, and the entrance to the trailing edge
(9). Although read independently, the pressures from each of the three *
span locations were mathematically averaged for calculations. The
pressures were measured on Bourdon-type pressure gages and water U-tubes.
Measured pressures were accurate to within ±0.034 N/cm (0.05 psi).
Temperature. - The inlet air temperature was measured at the same
locations as the inlet pressure (location I, fig. 4) by a Chromel-Alumel
thermocouple. The temperature of the air from each of tJie three exits
from each of the three exits from the vane was measured by a Chromel-
Alumel thermocouple in each collector. The temperature measurements were
read on a null balance potentiometer.
EXPERIMENTAL PROCEDURE
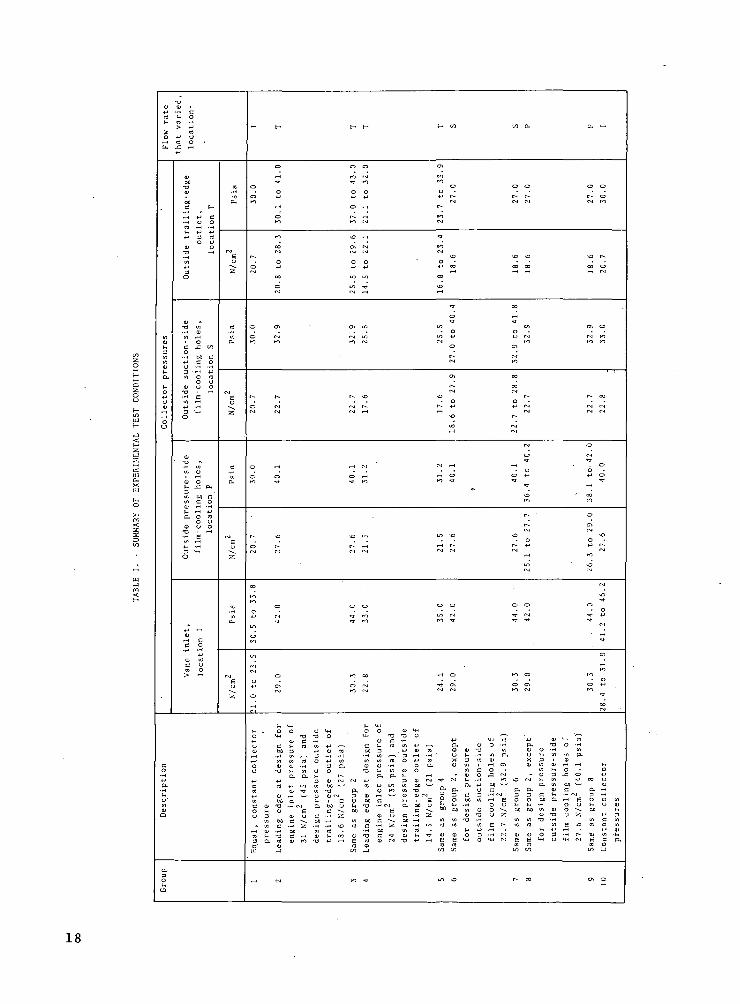
In the first set of tests the inlet pressure to the test vane was7
varied over several different values [from 21.0 to 23.5 N/cm (30.5 to 33.8
psia)] while the three exit pressures (suction, pressure, and trailing edge)
remained constant at 20.7 N/cm (30.0 psia). In the second set of tests
the inlet pressure to the test vane remained constant at several different
values [from 22.8 to 30.3 N/cm (33.0 to 44.0 psia)] while each of the
three exit pressures was varied independently over a range of pressures.
Two pre.ssures were maintained at nominal while the third was varied from
minimum measurable airflow to maximum airflow. In the third set of tests
the inlet pressure to the test vane was varied over several different
values [from 28.4 to 31.9 N/cm (41.2 to 46.2 psia)] while the three exit
pressures (suction, pressure, and trailing edge) remained constant at what
was considered to be the design pressure distribution around the vane,
[22.8, 27.6, and 20.7 N/cm2 (33.0, 40-0, and 30.0 psia)], respectively.
The four temperatures, the 31 pressures, the inlet flow, and the
three exit flows were measured and recorded for each of the 75 test runs
made. The conditions for the test runs are summarized in table I.
ANALYTICAL PROCEDURE
The analysis to determine the correlations for the experimental
pressure-loss data and to predict loss coefficients for the airflow within
the test vane required some simplifying assumptions. It should be recog-
nized that the ideal method for determining the correlations would be to
measure flows and pressures at many spanwise positions. However, that
detail is beyond the scope of these tests. A discussion of the analytical
methods and assumptions follows.
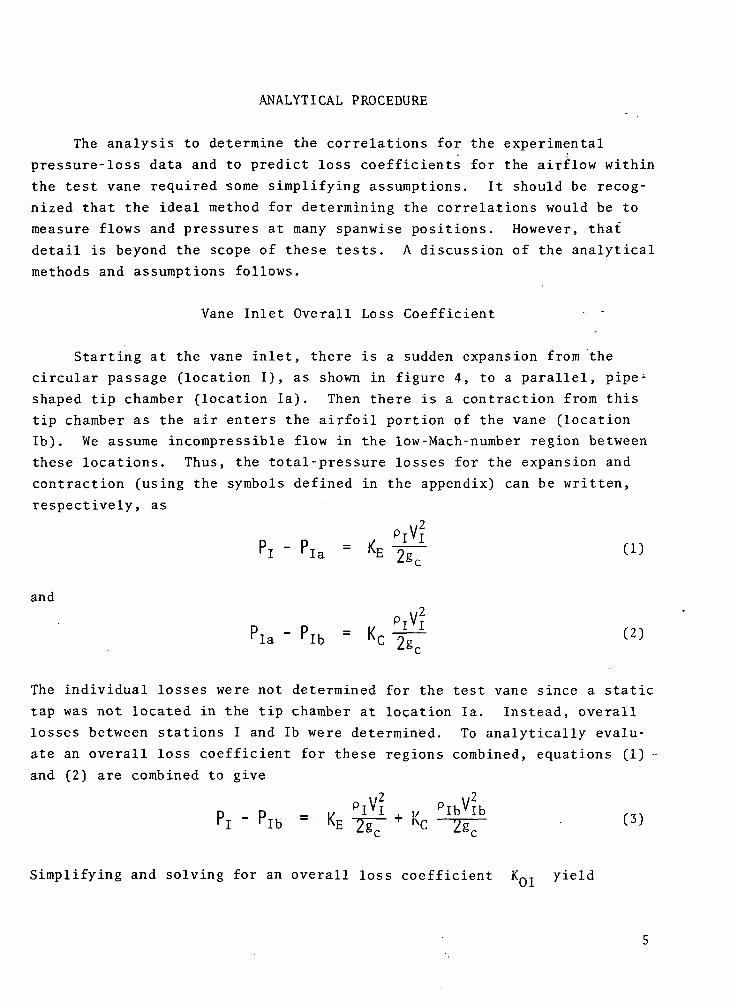
Vane Inlet Overall Loss Coefficient - ~
Starting at the vane inlet, there is a sudden expansion from the
circular passage (location I), as shown in figure 4, to a parallel, pipe-
shaped tip chamber (location la). Then there is a contraction from this
tip chamber as the air enters the airfoil portion of the vane (location
Ib). We assume incompressible flow in the low-Mach-number region between
these locations. Thus, the total-pressure losses for the expansion and
contraction (using the symbols defined in the appendix) can be written,
respectively, as
piViPI - Pia = *E j£ CD
and
The individual losses were not determined for the test vane since a static
tap was not located in the tip chamber at location la. Instead, overall
losses between stations I and Ib were determined. To analytically evalu-
ate an overall loss coefficient for these regions combined, equations (1) -
and (2) are combined to give
PI " Pib = KE -77— + Kc — 7g — • (3)
Simplifying and solving for an overall loss coefficient KQI yield
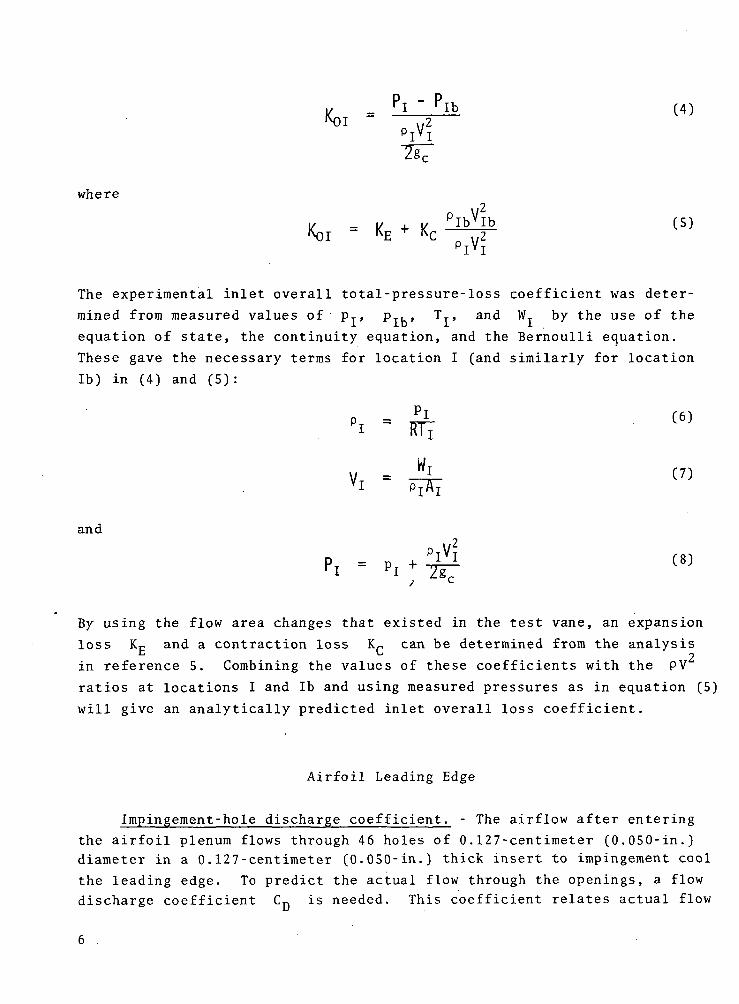
(4),,PIVI
where2
I/"
PIbVIb (5)T p y2
The experimental inlet overall total-pressure-loss coefficient was deter-
mined from measured values of p.,, PTU» T,, and W., by the use of the
equation of state, the continuity equation, and the Bernoulli equation.These gave the necessary terms for location I (and similarly for location
Ib) in (4) and (5) :
>. • £
and
- +
By using the flow area changes that existed in the test vane, an expansion
loss Kg and a contraction loss KC can be determined from the analysis
in reference 5. Combining the values of these coefficients with the PV
ratios at locations I and Ib and using measured pressures as in equation (5)
will give an analytically predicted inlet overall loss coefficient.
Airfoil Leading Edge
Impingement-hole discharge coefficient. - The airflow after entering
the airfoil plenum flows through 46 holes of 0.127-centimeter (0.050-in.)
diameter in a 0.127-centimeter (0.050-in.) thick insert to impingement cool
the leading edge. To predict the actual flow through the openings, a flow
discharge coefficient CQ is needed. This coefficient relates actual flow
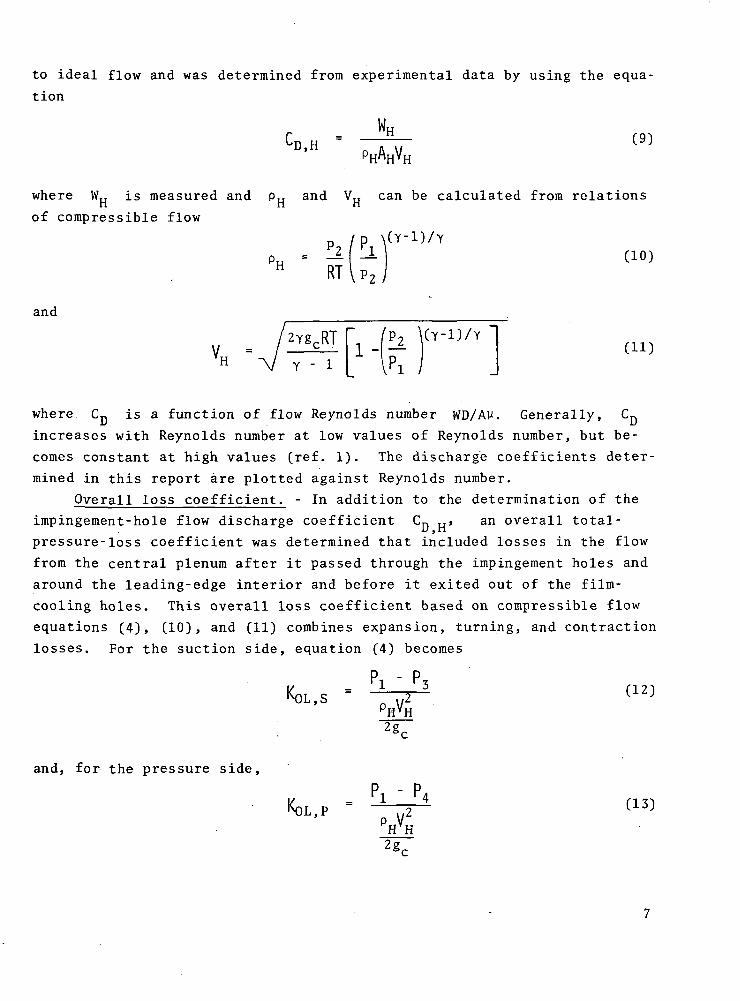
to ideal flow and was determined from experimental data by using the equa-
tion
CDH = -^- ^u>" ~ A \l
where Wtl is measured and p.. and VTT can be calculated from relationsn H n
of compressible flow
* 'and
v _ , 2Ygc*TVH
where C~ is a function of flow Reynolds number WD/Ay. Generally, CDincreases with Reynolds number at low values of Reynolds number, but be-
comes constant at high values (ref. 1). The discharge coefficients deter-
mined in this report are plotted against Reynolds number.
Overall loss coefficient. - In addition to the determination of the
impingement-hole flow discharge coefficient Cn H, an overall total-it,npressure-loss coefficient was determined that included losses in the flow
from the central plenum after it passed through the impingement holes and
around the leading-edge interior and before it exited out of the film-
cooling holes. This overall loss coefficient based on compressible flow
equations (4), (10), and (11) combines expansion, turning, and contraction
losses. For the suction side, equation (4) becomes
P - Pr i r -z
PHVH
and, for the pressure side,
Kn = ^^KOL,P 2
VH

where PH and V.. were found by using equations (10) and (11) , respec-
tively.
Film-cooling-hole discharge coefficients. - After the air flows
around the leading edge, it exits through a row of fifty-nine 0.064-
centimeter (0.025-in.) diameter holes in the suction side and rows of fifty-
eight and fifty-nine 0.071-centimeter (0.028-in.) diameter holes in the
pressure side. For the suction side the flow discharge coefficient Cn cu i ois determined by using equations (9) to (11) but with subscripts S, 3, and
S substituted for H, 1, and 2, respectively, in these equations. For the
pressure-side coefficient Cn D, subscripts P, 4, and P are substitutedU tr
for H, 1, and 2, respectively, in these equations. The discharge coeffi-
cients are plotted against Reynolds number.
Airfoil Midchord
Fin-passage friction factors. - Fanning friction factors for the
suction- and pressure-side fin passages can be determined, assuming only
viscous losses through the passages. The Fanning friction factor (ref. 6)
of the fin passages was determined for the suction side by using
/ = P S ' P f e ._ fl4)FS P v2PFSVFS
and for the pressure side by using
P, - P
PFpVpP2*c
The densities were obtained from the equation of state. The passage veloc-
ities were obtained from the continuity equation [eq. (7)]. This, how-
ever, required that the flow split between the suction- and pressure-side
fin passages be known. To obtain the flow W^ through the suction-side
fin passage, assume that the values of pressure drop, friction factor,
cross-sectional area, hydraulic diameter, and density-are the same for
both the suction and pressure cooling fin passages. Starting with
= ARFp
2/Fp / WFp \ LFPSCPFP
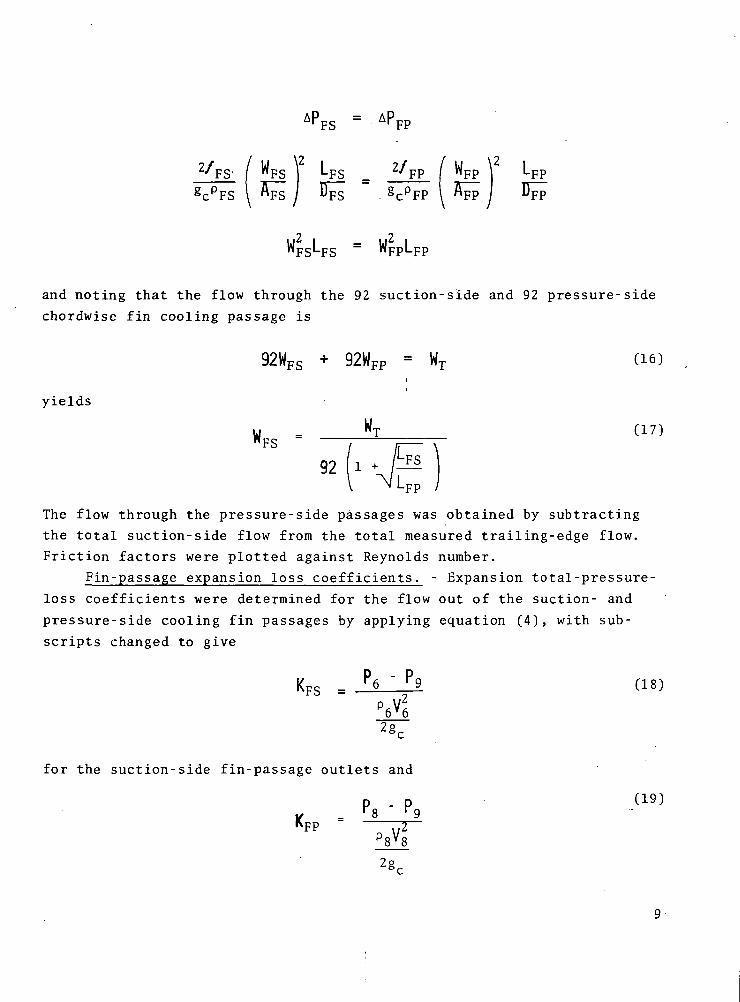
and noting that the flow through the 92 suction-side and 92 pressure-side
chordwise fin cooling passage is
92WFS + 92WFP = WT (16)i
yields
y _ WT (17)"FS ~
The flow through the pressure-side passages was obtained by subtracting
the total suction-side flow from the total measured trailing-edge flow.
Friction factors were plotted against Reynolds number.
Fin-passage expansion loss coefficients. - Expansion total-pressure-
loss coefficients were determined for the flow out of the suction- and
pressure-side cooling fin passages by applying equation (4), with sub-
scripts changed to give
KFS = P6 ' P9 (18)
for the suction-side fin-passage outlets and
p (19)
for the pressure-side fin-passage outlets. The velocities and densities
can be obtained by using the flow split equation (16) and the state, con-
tinuity, and the Bernoulli equations. By using the area changes that exist
loss coefficients can be estimated from the analysis in reference 7.
Airfoil Trailing-Edge Discharge Coefficient
After the flow passes out of the midchord cooling fin passages, it
flows through a 0.071-centimeter (0.028-in.) wide trailing-edge passage.
A flow discharge coefficient is needed to predict the actual flow through
the trailing-edge passage. This coefficient was determined from experi-
mental data by using equations (9) to (11) but with the subscripts H, 1,
and 2 changed to TE, 9, and T, respectively. The trailing-edge flow
discharge coefficient CD _„ is plotted against Reynolds number.
RESULTS AND DISCUSSION
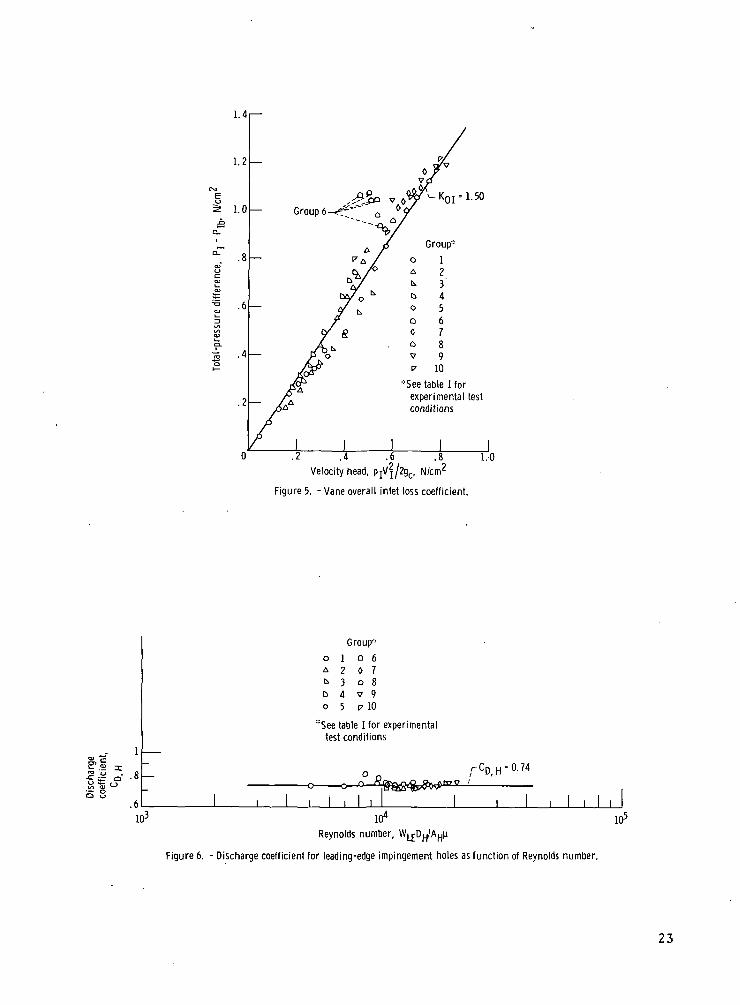
Vane Inlet Overall Loss Coefficient
An overall total-pressure-loss coefficient based on the total-
pressure difference between locations I and Ib and the area at location I
was determined. Separate experimental ̂ expansion and contraction loss co-
efficients between these locations could not be determined because there
was no pressure tap at location la. The experimental inlet overall loss
coefficient KQy was determined by using equations (4) to (8). The co-
efficient is the slope of the plot of the total-pressure difference
against the velocity head shown in figure 5. For the majority of the data
the average value is 1.50, which except for group 6 (table I), is cor-
related within 22 percent. Using the flow area ratio of location I to la
and location la to Ib and the data of reference 5 combined with equation
(5) gives an analytical prediction of KQ-, of 1.2. The higher value ob-
tained in actual tests on the airfoil would be expected because of the
more complex geometry of the actual vane compared to that assumed in ref-
erence 5. The reason for the departure of group 6 data was not apparent.
10
Airfoil Leading Edge
Impingement-hole discharge coefficient. - The compressible flow dis-
charge coefficient C^ „ based on measured flows and the pressures at lo-
cations 1 and 2 obtained by using equations (9) to (11) is shown in figure
6. The data indicate an essentially constant coefficient of 0.74 (within
4 percent for the majority of the data). This value agrees with the ex-
periment.al value of 0.79 from reference 3 for a similar configuration and
conditions.
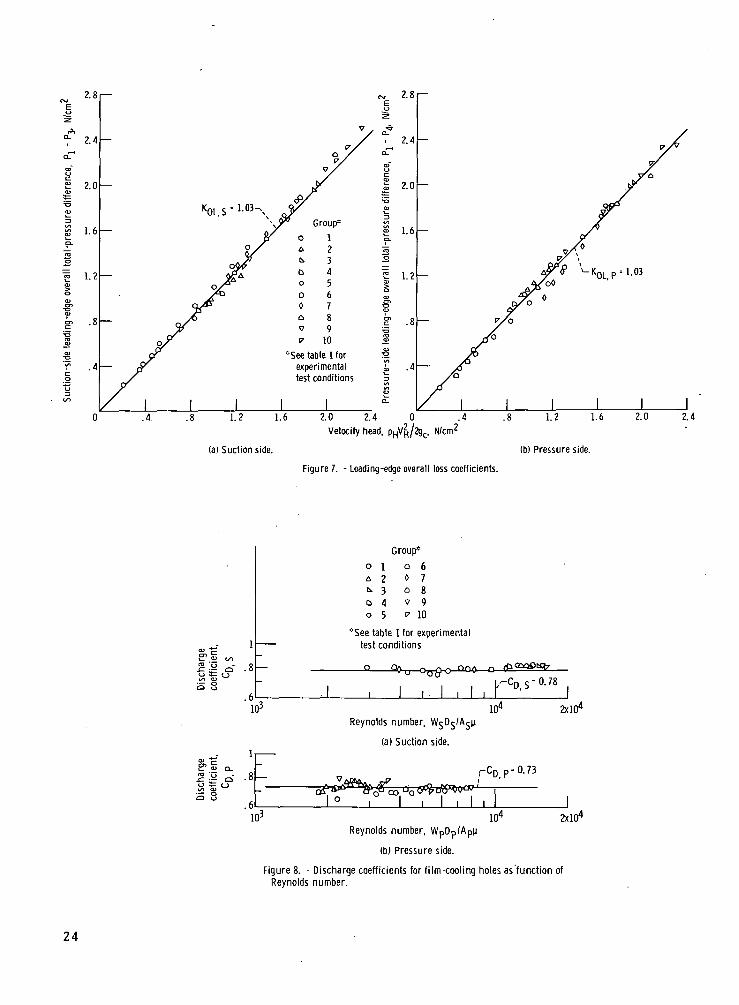
Overall loss coefficient.- The overall total-pressure-loss coeffi-
cients for the suction side K_f „ and the pressure side Knj p were de-
termined by using measured flows and pressures at locations 1, 3 (for suc-
tion side), and 4 (for pressure side) and equations (10) to (13). The co-
efficients for the suction and pressure sides, shown in figures 7 (a) and
(b), respectively, are the slope of the plot of the total-pressure
difference against the velocity head. The majority of the data correlated
within 10 percent of a value of 1.03 for both suction and pressure sides.
Reference 3 investigated a similar configuration with the same ratio of
hole diameter to impingement-wall distance and the same range of
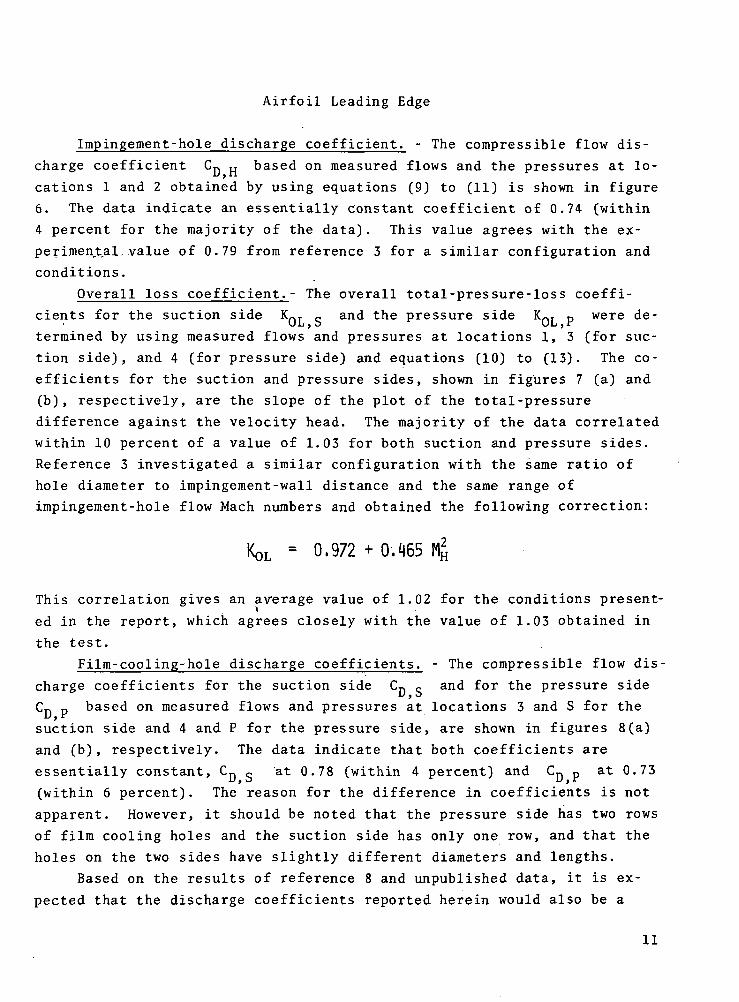
impingement-hole flow Mach numbers and obtained the following correction:
KOL = 0,972 + 0,465 MH
This correlation gives an average value of 1.02 for the conditions present-
ed in the report, which agrees closely with the value of 1.03 obtained in
the test.
Film-cooling-hole discharge coefficients. - The compressible flow dis-
charge coefficients for the suction side Cn - and for the pressure side
Cn p based on measured flows and pressures at locations 3 and S for theu, fsuction side and 4 and P for the pressure side, are shown in figures 8(a)
and (b), respectively. The data indicate that both coefficients are
essentially constant, CD g at 0.78 (within 4 percent) and C^ p at 0.73
(within 6 percent). The reason for the difference in coefficients is not
apparent. However, it should be noted that the pressure side has two rows
of film cooling holes and the suction side has only one row, and that the
holes on the two sides have slightly different diameters and lengths.
Based on the results of reference 8 and unpublished data, it is ex-
pected that the discharge coefficients reported herein would also be a
11
function of external gas flow over the vane.
Airfoil Midchord
At given pressure tap locations in the midchord fin cooling passages,
the spanwise pressures (hub, midspan, and tip) differed by a significant
amount when compared with the chordwise pressure drops through the fin
passages. The differences in the spanwise pressures indicated the possi-
bility of a spanwise flow variation, for which the exact measurement was
beyond the scope of these tests. However, two methods of calculating the
spanwise flows were tried. The first was based on a one-dimensional
momentum-flow analysis (ref.2) in which part of the vane inlet flow pass-
ed out through the impingement holes and fin cooling passages as it flow-
ed from the vane inlet toward the vane hub. The flow analysis utilized
the measured inlet flow and the three measured spanwise pressures at
location 1. The second method was based on the assumption that each of
the cooling-fin-passage entrance-loss coefficients was the same, which
then determined the necessary flow at the spanwise locations. Un-
fortunately, both of these methods gave inconsistent results. Therefore,
the three spanwise pressures at each of the chordwise pressure tap
locations were averaged for calculating the various coefficients. En-
trance-loss coefficients into the fin cooling passages, even when based
on average pressures and flows, were found to have values between 0.5 and
4.5. Since these values cannot be explained, they are omitted.i
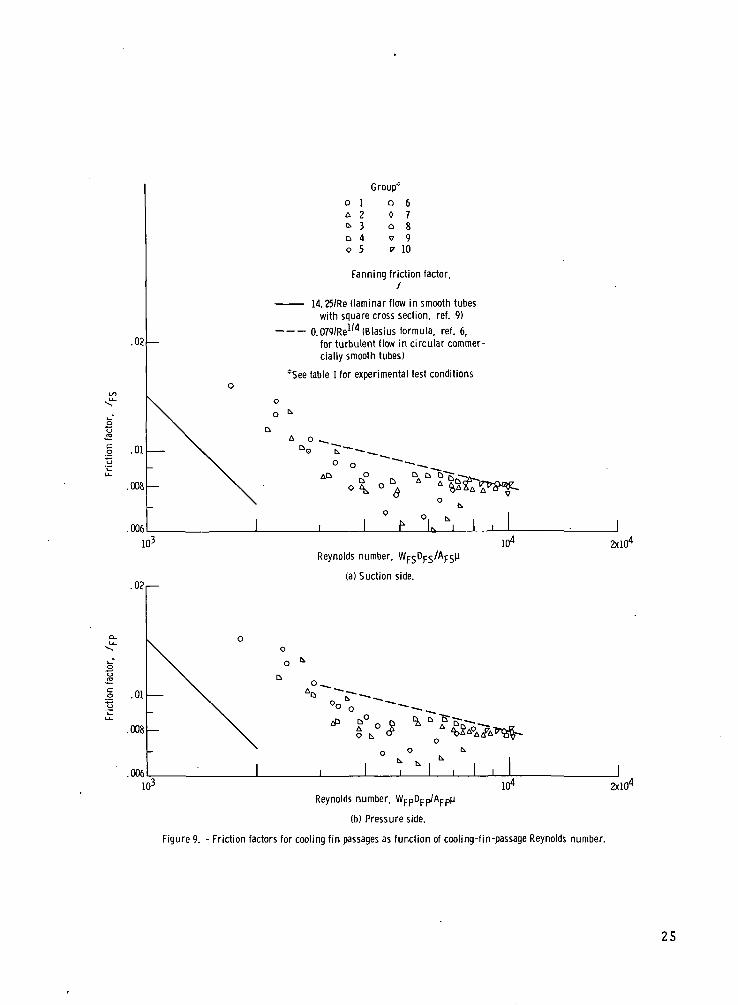
Fin-passage friction factors.- Fanning friction factors for the
suction- and pressure-side fin passages were calculated from equations
(14) and (15), respectively. The fin-passage flows were determined from
equations (16) and (17), where the lengths of the suction-side Lp<, and
pressure-side Lp'p passages were 1.60 and 1.12 centimeters (0.63 and
0.44 in.), respectively. The suction-side flow was determined to be 45.5
percent of the total trailing-edge flow, with the remainder being the
flow through the pressure side. The friction factor data are plotted
against passage Reynolds number, with hydraulic diameter taken as the
characteristic length dimension, in figures 9 (a) and (b) for the
suction- and pressure-side passages, respectively. The laminar-flow
friction factor line for square passages (ref. 9) is shown in the figure.
In the laminar-flow region, where the Reynolds numbers are between 1000
12
and 2000, the data fall above the laminar-flow line. In the region of
transition to turbulent flow, where the Reynolds numbers are between 3000
and-10 000, the data fall below the Blasius line for circular smooth tubes.
Experimental friction factors (ref. 9) fall on the laminar-flow line
(Re < 2000) and on or above the Blasius smooth-tube line (Re > 3000),
unlike the data presented herein. In reference 10, for a large isosceles
triangular passage with a small apex angle, the data exhibited the same
tendency as the data presented herein. This reference suggested that, for
noncircular passages not flowing full, the transition process is a gradual
one, with the turbulent flow appearing first in the passage center and
filling more and more of the passage as the Reynolds number increases.
Figure 9 shows that using the Blasius formula (ref. 6) provides a conserva-
tive estimate of the friction factors for most of the range of Reynolds
numbers investigated (3000 to 10 000).
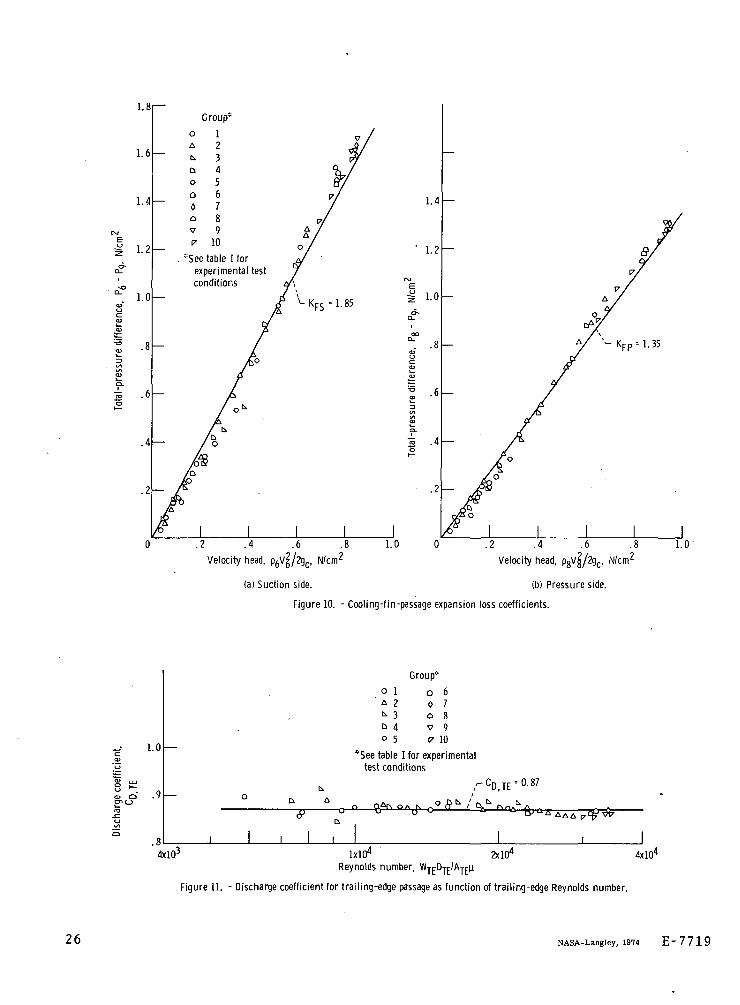
Fin-passage expansion loss coefficients. - The fin-passage expansion
total-pressure-loss coefficients were based on measured pressures at
locations 6 and 9 for the suction side and at locations 8 and 9 for the
pressure side. Flows were determined by using the flow split equation (16).
The expansion loss coefficients Kpg and K-p we.re determined from the
experimental data by using equations (18) and (19), respectively. They
are shown in figures 10 (a) and (b), respectively, as the slope of the
plot of the total-pressure difference against the velocity head. The
coefficient for the suction side was 1.85 and that for the pressure side
was 1.35. These experimental loss coefficients were considerably higher
than was expected from the data given in reference 7. This difference
most likely results from the differences between the geometries of the
vane airfoil used for these tests and the idealized tube flow used to ob-
tain the data of reference 7.
Airfoil Trailing-Edge Discharge Coefficient
The compressible trailing-edge flow discharge coefficient C^ ̂,g
based on measured flows and the pressures at locations 9 and T obtained by
using equations (9) to (11) is shown in figure 11. The data indicate an
essentially constant coefficient of 0.87 (within 2 percent for the
majority of the data). In the range of Reynolds numbers tested it is ex-
pected, based on unpublished experimental data, that the influence of ex-
ternal gas 'flow over the vane will have a small effect on the discharge co-
efficient.
13
SUMMARY OF RESULTS
A study was conducted to measure coolant flow loss coefficients and
friction factors at various locations in a turbine vane cooled by a com-
bination of convection, impingement, and film-cooling methods. Deter-
mined were entrance and exit total-pressure-loss coefficients, flow dis-
charge coefficients, and friction factors.
The results of this study are summarized as follows:
1. The expansion and overall total-pressure-loss coefficients
which range between 1.03 to 1.85 can be analytically predicted with
available information within about 20 percent. The exception was for the
expansion coefficient at the outlet of the fin cooling passages, in which
case the experimental losses were considerably higher than expected be-
cause of mixing losses.
2. The flow discharge coefficients for impingement, film cooling,
and trailing-edge passages, which ranged between 0.73 and 0.87, agreed
with the experimental results of others. It is expected that the flow
discharge coefficients measured would be influenced by external gas flow
over the vane.
3. The friction factors in the region of transition to turbulent
flow for the range of coolant flow Reynolds numbers investigated fell be-
low the Blasius formula for circular smooth tubes £.s do the data of
Eckert and Irvine). Thus, the transition to turbulent flow in the fin
passages may be gradual. The data indicate that the Blasius formula
would provide a conservative estimate of the friction factor.
Lewis Research Center,
National Aeronautics and Space Administration,
Cleveland, Ohio, November 21, 1973,
501-24.
14
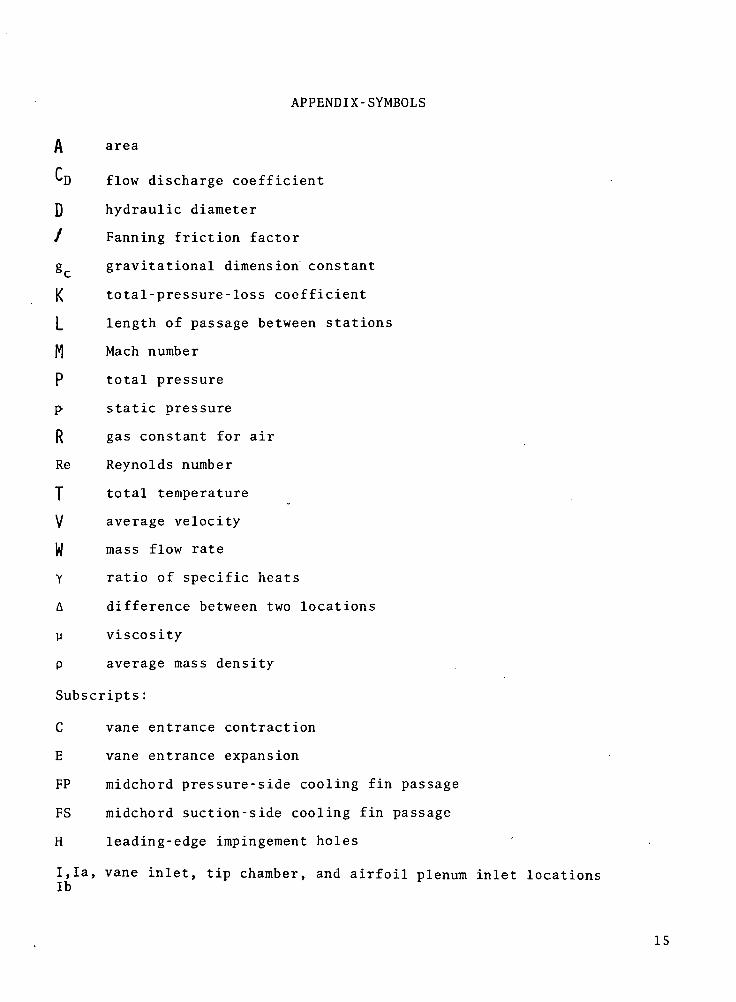
APPENDIX-SYMBOLS
A area
*"D flow discharge coefficient
D hydraulic diameter
/ Fanning friction factor
g gravitational dimension constant
K total-pressure-loss coefficient
|_ length of passage between stations
M Mach number
P total pressure
p static pressure
R gas constant for air
Re Reynolds number
T total temperature
V average velocity
W mass flow rate
Y ratio of specific heats
A difference between two locations
p viscosity
p average mass density
Subscripts:
C vane entrance contraction
E vane entrance expansion
FP midchord pressure-side cooling fin passage
FS midchord suction-side cooling fin passage
H leading-edge impingement holes
I,la, vane inlet, tip chamber, and airfoil plenum inlet locationsIb
15
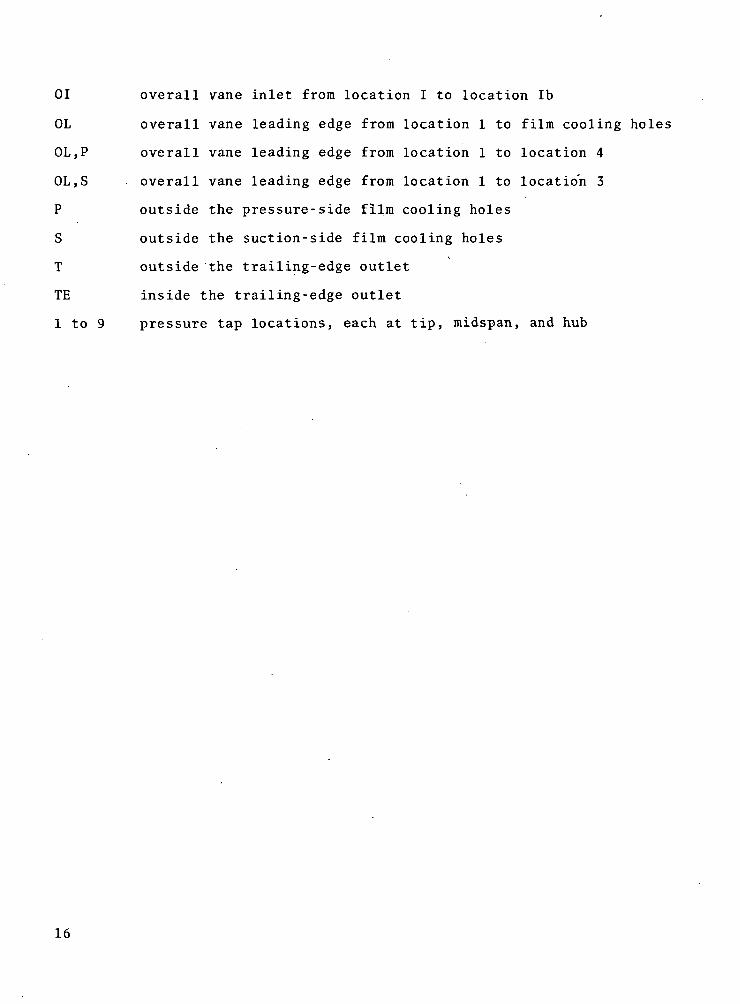
01 overall vane inlet from location I to location Ib
OL overall vane leading edge from location 1 to film cooling holes
OL,P overall vane leading edge from location 1 to location 4
OL,S overall vane leading edge from location 1 to location 3
P outside the pressure-side film cooling holes
S outside the suction-side film cooling holes
T outside the trailing-edge outlet
TE inside the trailing-edge outlet
1 to 9 pressure tap locations, each at tip, midspan, and hub
16
REFERENCES
1. Rohde, John E. ; Richards, Hadley T.; and Metger, George W.: Discharge
Coefficients for Thick Plate Orifices with Approach Flow
Perpendicular and inclined to the Orifice Axis. NASA TN D-5467,
1969.
2. Clark, John S.; Richards, Hadley T.; Poferl, David J.; and Livingood,
John N.B.: Coolant Pressure and Flow Distribution Through an Air-
Cooled Vane for a High-Temperature Gas Turbine. NASA TM X-2028,
1970.
3. Damerow, W.P.; Murtaugh, J.P.; Burggraf, F.: Experimental and
Analytical Investigation of the Coolant Flow Characteristics in
Cooled Turbine Airfoils. Rep. R72AEG165, General Electric Co.
(NASA CR-120883), June 1972.
4. Kaufman, Albert; Poferl, David J.; and Richards, Hadley T.: Coolant
Pressure and Airflow Distribution in a Strut-Supported
Transpiration-Cooled Vane for a Gas Turbine Engine. NASA TN D-6916,
1972.
5. Staff of Engineering Division: Flow of Fluids Through Valves,
Fittings, and Pipe. Tech. Paper 410, Crane Co., 1965.
6. Shapiro, Ascher H.: The Dynamics and Thermodynamics of Compressible
Fluid Flow. Vol. I. Ronald Press Co., 1953.
7. Kunkle, John S.; Wilson, Samuel D.; and Cota, Richard A.; eds.:
Compressed Gas Handbook. NASA SP-3045, 1969.
8. Dewey, Paul E.: A Preliminary Investigation of Aerodynamic
Characteristics of Small Inclined Air Outlets at Transonic Mach
Numbers. NACA TN 3442, 1955.
9. Schlichting, Hermann; (J. Kestin, trans.): Boundary Layer Theory.
Fourth ed., McGraw-Hill Book Co., Inc., 1960.
10. Eckert, E.R.G.; and Irvine, T.F., Jr.: Pressure Drop and Heat
Transfer in a Duct with Triangular Cross Section. J. Heat Transfer,
vol. 82, no. 2, May 1960, pp. 125-138.
17
G4-1
re
^
ou.
D.
•H
5
Co
P.
J-U*
GQ
a.3O
U
•a
i- O
> 'H
4-> UC3 O •
«
G
OCC E-
rH *J C
. - . G OC3 rH --Ht- +-» *J
O OG O
-O rH
*->
O
V *
•rH flj
Ul rH
' OC .C tO0
"H BO C*-i C OO -H -H
« *0 reo o
G O O
• rH £
o
(X
« DO Cot-ino
^
o
_
GrH C
C 0
G rt
CO
G.
c-j
g
^-
CO
C,
^eo
2
C3
'w
a.
^Eu
^
-H
a.
(NJ
e
2
r~ E- H (- t- W t O O . C. «
0 00 Crt
o o o o o oo o o o • •
rH O •— 1 t--
O r^ rH to
Kl \0 - - l -5
co eyi N to
o o o o • •
CO ui ui CO
S £ rH rH
O i— 1
... • o o •
r-l to
CT, 00 ' '
r̂ . oo
• 0 0 •
vO t~-
co • r-j
f~J O
o r-J
0 _ rH CM " t *J -1 • " ^ 0 "6^
O O C 3 r H r H O 0 4 J * J O
f "t *~!\ O ' 0 0
Kl Kl
1- 0
£j s*^i ^ ^ ^ . • • o oO F - I ^ rH r H f - C - - * J 4 - ) r -
^ - s
^ 0 0 0 0 0 0 0 0
° ' LO r-J «r rg •& %^ ™ ? K r o - ^ n - ^ T ^
- rH
™
O K 1 C O rHO K 1 C 3 K l
2 o ^ o r - j - s -o i O d o * - >
o "*
£ "
r « - O O ' W O G 1^- !
u c ra 4 -1 -—. c to u) 4-> -— > ti G O - H p. - a o - H
O G - H D P . G - H D P . G l / ) i r H C 3 % G U l G i — I r HO * O u i O - O W G O W C O - t f l r - O -
C tO LO DO ' — ' r t L O U I D O ^ — '_ O . W D O ' — ' P - m G O ^ - ^co ^» -a P . K I O I - O — " P - oc C X P . GC P .
S D * " U . H ^ ^ ^ G O C - H ^ G 1 3 0 2 G T 3 U 2 3V J Q J , -^ ,_( 01 OO C "~ .̂ DO •— i u l i / l T j - H i/) in *^ -r-t ui t/i
r H G - < H D O C O - ' H D O U l r t - t i * J r H > ^ , + J r H - f t )
[S* Jj t / i ^ j u i to c o c n w
^ _ , ( ^ j K in - L O \ O r - o o d o
18
Atmosphere
Temperature
Flowmeter
—86.2-N/cnr (125-psig) supply
Pressure
o-
Pressureregulators
Filter
-F-Xit air collectors
,—Test vane
Pressure differencesmeasured
Air dryer
Figure 1. - Flow measuring and distribution equipment.
19
To rotameter
-Suction-side collector
5
WP
To rotameter
• T
To rotameter
Figure 2. - Air collector and pressure tap locations.
20
—Cooling-air inlet tube
-Tip platform cover
Tip platform—
• Airfoil plenum
Partition spacer-
Film-cooling holes-
Impingement holes—— Fin cover plate
•-Chordwise fins
-Split trailing edge
-Trailing-edge spacer
CD-11000-33
Figure 3. - Test vane (sectioned view).
21
Airfoil plenum inlet(location Ib)-x
Tip platform-
Impingement holes-
Leading edge-
Hub platform-
,_ — Cooling -air inlet tube
— Inlet pressure tap tube(location I)
- Tip chamber(location la)
Midspan
-Split trailing edge
Fin cover plate
x-Cooling fins
Figure 4. - Test vane instrumentation locations. (Dimensions are in cm (in.).)
22
See table I forexperimental testconditions
.2 .4 .6 .8Velocity head, PiVj/2gc, N/cm2
Figure 5. - Vane overall inlet loss coefficient.
1.0
x
Ilk
Group-o 60 7o 8v 917 10
"See table I for experimentaltest conditions
f\ r\ i
CD,H = 0.74
103 104
Reynolds number,
Figure 6. - Discharge coefficient for leading-edge impingement holes as function of Reynolds number.
105
23
2.8
2.4
2.0
1.6
1.2
.4
KOL, S = 1.03
910
'See table I forexperimentaltest conditions
1.2
.4
1.2 1.6
(a) Suction side.
OL, P " 1.03
2.0 2.4 0 .4
Velocity head, PHV^/2gc, N/cm2
Figure 7. - Leading-edge overall loss coefficients.
1.2 1.6
(b) Pressure side.
2.0 2.4
Group*
<U ^
£T £ <s,j= -^ Q"" ̂ 0S 8
1
.8
A
0 1 0 6^ 2 « 7& • 3 0 8Q 4 ? 9o5 P 10
°See table I for experimentaltest conditions
-o QA nr»A /i ^CD^SltE^
. 1 1 , 1 , 1 fCD 'S=°'78 |
103 104 2xl04
_-
rt3 "G.C T— Oo «^ o
3 8
Reynolds number, WjDj/Agij
(a) Suction side.1
.8
.6
~~ V f$*V\n j JT /
— QT" ̂ ^ Ur?' tt) '"'O (S1^̂ CJD*̂ 1^̂
1 ° i 1 , 1 . 1 i
) > p =0.73
1
10 10Reynolds number, WpDp/Apii
(b) Pressure side.
2xl04
Figure 8. - Discharge coefficients for film-cooling holes as function ofReynolds number.
24
.02
.01
.008
.006
103
• 02,—
o lA 2^ 3D 4o 5
Group*
0 60 70 8? 9v 10
Fanning friction factor,
14.25/Re (laminar flow in smooth tubeswith square cross section, ref. 9)
0.079/Re1'"(Blasius formula, ref. 6,for turbulent flow in circular commer-cially smooth tubes)
*See table I for experimental test conditions
o
io i
_L
104
Reynolds number,
(a) Suction side.
t>1 o
I , I
2xl04
103 104 ZxlO4
Reynolds number, WppDpp/AppM
(b) Pressure side.
Figure 9. - Friction factors for cooling fin passages as function of cooling-fin-passage Reynolds number.
25
1.8
1.6
1.4
I 1.2
1.0
.4
.2
.2 .4 .6 .8
Velocity head, p6V^/2gc, N/cm2
(a) Suction side.
1.4
' 1.2
I 1.0
.6
15 .4
.2
1.0 .2 .4
Velocity head,
.6 .8
L, N/cm2
1.0
(b) Pressure side.
Figure 10. - Cooling-fin-passage expansion loss coefficients.
1.0
.9
* 2^ 3& 4° 5
Group*
0 60 70 8v 917 10
'See table I for experimentaltest conditions
rCD,TE =
^ QQ,1^ /^ rx^|
0.87
4x10 2x10"'3 IxlO4
Reynolds number,
Figure 11. - Discharge coefficient for trailing-edge passage as function of trailing-edge Reynolds number.
4x10"
26 \-Langley, 1974 E - 7 7 1 9

NATIONAL AERONAUTICS AND SPACE ADMINISTRATION
WASHINGTON. D.C. 2O546
OFFICIAL BUSINESS
PENALTY FOR PRIVATE USE S3OO SPECIAL FOURTH-CLASS RATEBOOK
POSTAGE AND FEES PAIDNATIONAL AERONAUTICS AND
SPACE ADMINISTRATION451
POSTMASTER : If Undeliverable (Section 158Postal Manual) Do Not Return
"The aeronautical and space activities of the United States shall beconducted so as to contribute . . . to the expansion of httman knowl-edge of phenomena in the atmosphere and space. The Administrationshall provide for the widest practicable and appropriate disseminationof information concerning its activities and the results thereof."
—NATIONAL AERONAUTICS AND SPACE ACT OF 1958
NASA SCIENTIFIC AND TECHNICAL PUBLICATIONSTECHNICAL REPORTS: Scientific andtechnical information considered important,complete, and a lasting contribution to existingknowledge.
TECHNICAL NOTES: Information less broadin scope but nevertheless of importance as acontribution to existing knowledge.
TECHNICAL MEMORANDUMS:Information receiving limited distributionbecause of preliminary data, security classifica-tion, or other reasons. Also includes conferenceproceedings with either limited or unlimiteddistribution.
CONTRACTOR REPORTS: Scientific andtechnical information generated under a NASAcontract or grant and considered an importantcontribution to existing knowledge.
TECHNICAL TRANSLATIONS: Informationpublished in a foreign language consideredto merit NASA distribution in English.
SPECIAL PUBLICATIONS: Informationderived from or of value to NASA activities.Publications include final reports of majorprojects, monographs, data compilations,handbooks, sourcebooks, and specialbibliographies.
TECHNOLOGY UTILIZATIONPUBLICATIONS: Information on technologyused by NASA that may be of particularinterest in commercial and other non-aerospaceapplications. Publications include Tech Briefs,Technology Utilization Reports andTechnology Surveys.
Details on the availability of these publications may be obtained from:
SCIENTIFIC AND TECHNICAL INFORMATION OFFICE
N A T I O N A L A E R O N A U T I C S A N D S P A C E A D M I N I S T R A T I O NWashington, D.C. 20546