preso q3 2017 financial results presentation final.compressed-2
TRANSCRIPT
Q32017OPERATING&FINANCIALRESULTSConferenceCall&WebcastPresentation- 3rd November2017

This presentation has been prepared by Asanko Gold Inc. (the “Company”) solelyfor informational purposes. This presentation is the sole responsibility of theCompany. Information contained herein does not purport to be complete and issubject to certain qualifications and assumptions and should not be relied uponfor the purposes of making an investment in the securities or entering into anytransaction. The information and opinions contained in this presentation areprovided as at the date of this presentation and are subject to change withoutnotice and, in furnishing the presentation, the Company does not undertake oragree to any obligation to provide recipients with access to any additionalinformation or to update or correct the presentation.No securities commission or similar regulatory authority has passed on the meritsof any securities referred to in the presentation, nor has it passed on or reviewedthe presentation.Cautionary note to United States investors - the information contained in thepresentation uses terms that comply with reporting standards in Canada andcertain estimates are made in accordance with National Instrument 43-101–Standards for Disclosure for Mineral Projects (“NI 43-101”). The presentation usesthe terms “other resources”, “measured”, “indicated” and “inferred” resources.United States investors are advised that, while such terms are recognized andrequired by Canadian securities laws, the SEC does not recognize them. UnderUnited States standards, mineralization may not be classified as “ore” or a“reserve” unless the determination has been made that the mineralization couldbe economically and legally produced or extracted at the time the reservedetermination is made. United States investors are cautioned not to assume thatall or any part of measured or indicated resources will ever be converted intoreserves. Further, “inferred resources” have a great amount of uncertainty as totheir existence and as to whether they can be mined legally or economically. Itcannot be assumed that all or any part of the “inferred resources” will ever beupgraded to a higher category. Therefore, United States investors are alsocautioned not to assume that all or any part of the inferred resources exist, orthat they can be mined legally or economically.Under Canadian rules, estimates of “inferred resources” may not form the basis offeasibility or pre-feasibility studies except in limited cases. Disclosure of“contained ounces” is permitted disclosure under Canadian regulations; however,the United States Securities Exchange Commission (“SEC”) normally only permitsissuers to report mineralization that does not constitute “reserves” as in placetonnage and grade without reference to unit measures.
Accordingly, information concerning descriptions of mineralization, mineralresources and mineral reserves contained in the presentation, may not becomparable to information made public by United States companies subject to thereporting and disclosure requirements of the SEC.Some of the statements contained in this presentation may contain “forward-lookingstatements”. All statements in this presentation, other than statements of historicalfacts, that address estimated mineral resource and reserve quantities, grades andcontained metal, and the timing of further exploration and development of theCompany’s projects, are forward-looking statements. There can be no assurance thatthe plans, intentions or expectations upon which these forward-looking statementsand information are based will occur. “Forward-looking statements” and “forward-looking information” are subject to a variety of risks, uncertainties and assumptions,including those that are discussed in the Company’s Annual Information Form. Someof the factors which could affect future results and could cause results to differmaterially from those expressed in the forward looking statements and informationcontained herein include: market prices, exploitation and exploration successes,continued availability of capital and financing and general economic, market,business or governmental conditions. Forward looking statements and informationare based on the beliefs, estimates and opinions of management at the date thestatements are made and are subject to change without notice. The Companydisclaims any intention to update or revise any forward-looking statements whetheras a result of new information, future events, or otherwise except as required byapplicable law. The Company also cautions potential investors that mineral resourcesthat are not material reserves do not have demonstrated economic viability.For a more comprehensive discussion of the risks faced by the Company, and whichmay cause the actual financial results, performance or achievements of theCompany to be materially different from the Company’s estimated future results,performance or achievements expressed or implied by forward-looking informationor forward-looking statements, please refer to the Company’s latest AnnualInformation Form, filed with Canadian securities regulatory authorities atwww.sedar.com, and filed under Form 40-F with the SEC at www.sec.gov/edgar. Therisks described in the Annual Information Form (filed and viewable onwww.sedar.com and www.sec.gov/edgar, and available upon request from theCompany) are hereby incorporated by reference into this presentation.
2
FORWARDLOOKINGINFORMATION

30,000
35,000
40,000
45,000
50,000
55,000
60,000
Q12017 Q2'17 Q3'17
GoldProduced GoldSold
• Quarterlyproductionof49,293oz@AISCofUS$975/oz
• Resource&reservereconciliationsdeliveringpositiveresults
• Mininginterventionsyieldingencouragingresults
• Executive&Sitemanagementteamsrestructuredtoalignbusinessfocusonoperational&costdelivery
• Goldsalesof50,241ozataveragerealizedpriceUS$1,265/ozforUS$63.7minrevenue
• MinegeneratedUS$40.7mincashfromoperatingactivities,up20%fromQ22017
• EBITDAofUS$31.3million,up24%fromQ2 2017
• NetIncomeattributabletocommonshareholdersofUS$4.7morUS$0.02/share,anincreaseofUS$4.0mfromQ22017
• US$64.3mincashandimmediatelyconvertibleworkingcapital
• Refiningagreementenhancementsimprovedmetaltomoneycycleto5daysreleasingworkingcapitalpreviouslytiedupinbullion
• AcquisitionofhighlyprospectiveMiradaniMiningLease,adjacenttotheAsankoGoldMineconcession
3
Q32017HIGHLIGHTS
Industry-leadingsafetyrecordmaintained:
Ø Nolosttimeinjuries(“LTI”)reportedforthequarter
Ø Rolling12monthLTIFRof0.19
HEALTH &SAFETY
QuarterlyGoldProductionandSalesOunces
439
468
418
400
410
420
430
440
450
460
470
480
Q1'17 Q2'17 Q3'17
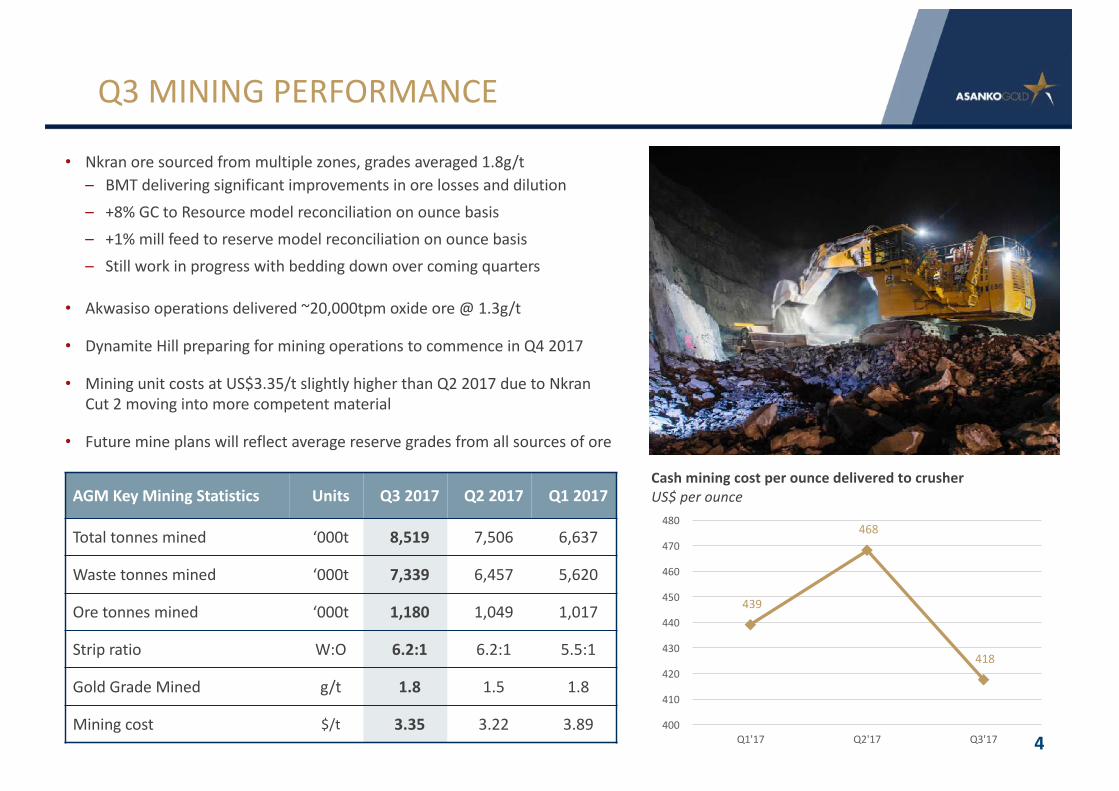
• Nkran oresourcedfrommultiplezones,gradesaveraged1.8g/t– BMTdeliveringsignificantimprovementsinorelossesanddilution– +8%GCtoResourcemodelreconciliationonouncebasis– +1%millfeedtoreservemodelreconciliationonouncebasis– Stillworkinprogresswithbeddingdownovercomingquarters
• Akwasiso operationsdelivered~20,[email protected]/t
• DynamiteHillpreparingforminingoperationstocommenceinQ42017
• MiningunitcostsatUS$3.35/tslightlyhigherthanQ22017duetoNkranCut2movingintomorecompetentmaterial
• Futuremineplanswillreflectaveragereservegradesfromallsourcesofore
4
Q3MININGPERFORMANCE
AGMKeyMiningStatistics Units Q32017 Q22017 Q12017
Totaltonnes mined ‘000t 8,519 7,506 6,637
Wastetonnes mined ‘000t 7,339 6,457 5,620
Oretonnes mined ‘000t 1,180 1,049 1,017
Stripratio W:O 6.2:1 6.2:1 5.5:1
Gold GradeMined g/t 1.8 1.5 1.8
Mining cost $/t 3.35 3.22 3.89
CashminingcostperouncedeliveredtocrusherUS$perounce

208
236
212
180
190
200
210
220
230
240
Q1'17 Q2'17 Q3'17
• 862,000tprocessedatgradeof1.9g/ttoproduce49,293oz(153,596oz YTD)
• Processingimpactedby3millmotoroutages,resultingin11daysoflostmillingtime,equatingto+5,000ozlostgoldproduction
• Goldrecoverycontinuestoexceeddesignlevelat94%
• ProcessunitcostsatUS$12.94/tslightlyhigherthanQ22017duetocostsofmillmotorrepairsandlowermilledvolumes
• CommissioningoftheP5Mvolumetricupgradescompleted– Designof9,000tpdfresh(3Mtpa)and6,000tpdoxide(2Mtpa)ores
– Currentlyfeedinghigherquantityoffreshoretonneswithtemporarymobilecrushers
– Secondarycrushertobeinstalled&commissionedinQ22018
5
Q3PROCESSINGPERFORMANCE
KeyProductionStatistics Units Q32017 Q22017 Q12017
Ore milled ‘000t 862 887 908
Gold feed grade g/t 1.9 1.7 2.0
Gold recovery % 94 94 95
Gold produced oz 49,293 46,017 58,187
Processing cost $/t 12.94 12.80 13.36
CashprocessingcostperouncedeliveredtocrusherUS$perounce
MillPerformanceTonnesthousands,%denoterecoveries g/t
95% 94% 94%
-
0.5
1.0
1.5
2.0
2.5
-100200300400500600700800900
1,000
Q1'17 Q2'17 Q3'17
Oremilled Goldfeedgrade

6
Q3COSTPERFORMANCE
• Totalcashcosts- US$549/oz
• AlSC increasedslightly5%toUS$975/oz comparedtoQ22017– HighercapitalizedstrippingcostatNkran Cut2progressed
intomorecompetentrock
• AISCmargindecreasedslightlytoUS$290/oz
• YTDAISCUS$955/oz inlinewithfullyearguidance
• Costperformancenowakeyoperationalfocus
US$perounce Q32017 Q22017 Q12017
Operatingcashcosts 485 572 578
Royalties 64 62 60
Totalcashcosts 549 634 638
Corporatecosts 59 61 39
Sustainingcapex 31 21 65
Deferredstripping 333 211 211
Reclamationcostaccretion 3 3 3
AISC 975 930 956
GoldProduction&AISCOunces US$perounce
AISCbuild-upUS$perounce
956 930 975
-
200
400
600
800
1,000
1,200
-
10,000
20,000
30,000
40,000
50,000
60,000
70,000
Q1'17 Q2'17 Q3'17
-
200
400
600
800
1,000
1,200
Q1'17 Q2'17 Q3'17TotalCashCosts CorporateSustainingcapex DeferredstrippingReclamationcostaccretion

7
INCOMESTATEMENT
(US$,thousandsexcept fordollarpershare
amountsand%)
Q32017
Q22017
Q12017
Revenue, netofroyalties 60,528 57,182 66,054
Totalcostofsales (42,628) (42,726) (50,929)
Grossprofit 17,900 14,456 15,125
Grossprofit% 30% 25% 25%
Incomefrommineoperations 17,900 14,456 15,125
Exploration andevaluationexpenditures (197) (80) (186)
Generalandadministrative expenses (3,259) (3,388) (2,800)
Incomefromoperations 14,444 10,988 12,139
Otherexpenses (5,172) (4,300) (4,430)
Incometax(expense)recovery (3,671) (5,479) 103
Netincomefortheperiod 5,601 1,209 7,812
AttributabletoNCI (912) (522) -
Attributabletocommonshareholders 4,689 687 7,812
Basicanddilutedincomeper share $0.02 $0.00 $0.04
EBITDA1 31,293 25,276 28,479
PositiveEarningsforthreeconsecutivequarters
• Goldsalesof50,241oz(Q22017:48,461oz)
• GoldpricerealizedincreasedslightlytoUS$1,265oz(Q22017:$1,238/oz)
• EBITDAofUS$31.3m(Q22017:US$25.3m)
• OtherexpensescompriseinterestexpenseandFXmovements
• Cashtaxesarezero
• EPSbeforenon-cashincometaxesisUS$0.04/share
1EBITDAiscalculatedasIncome(Loss)fromoperationsadjustedforgains/lossesinforeign
exchange,gains/lossesinderivativesandfordepreciationanddepletion.
QuarterlyEBITDAUS$,thousands
28,479 25,276 31,293
Q1'17 Q2'17 Q3'17
Trailing5quarteraverage~US$28m
8
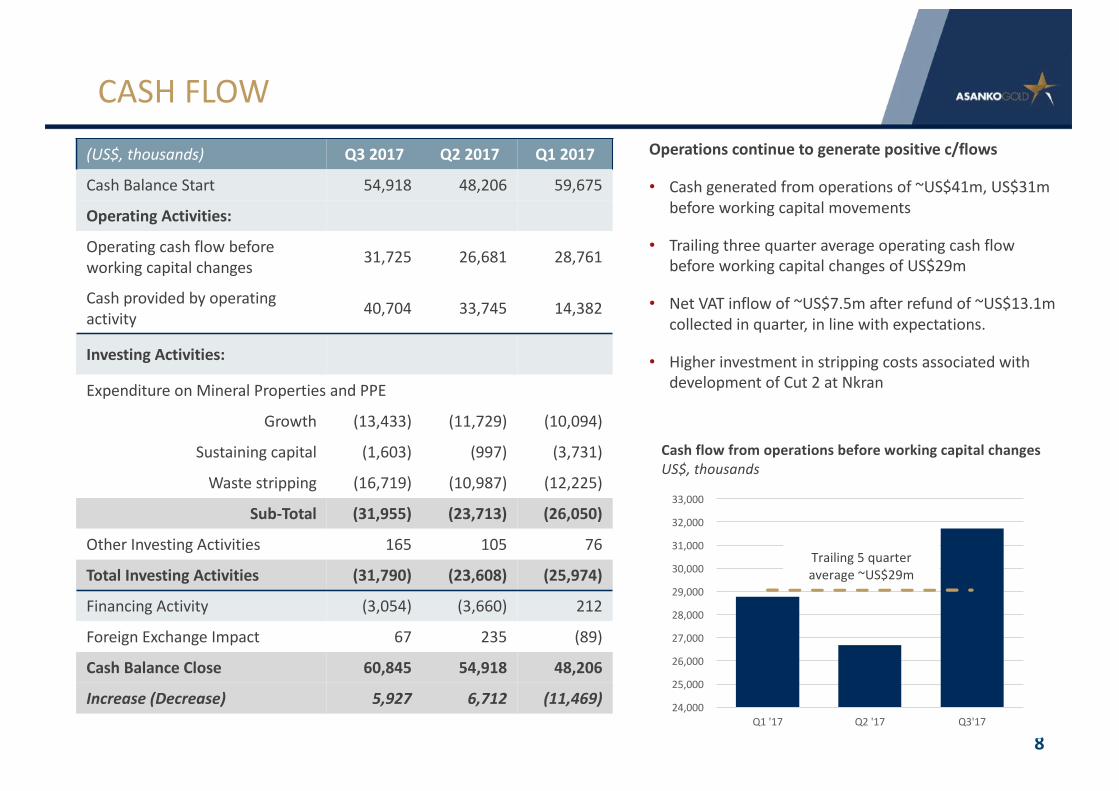
CASHFLOW(US$,thousands) Q3 2017 Q22017 Q12017
Cash BalanceStart 54,918 48,206 59,675
OperatingActivities:
Operatingcashflowbeforeworkingcapitalchanges 31,725 26,681 28,761
Cashprovidedbyoperatingactivity 40,704 33,745 14,382
InvestingActivities:
Expenditure onMineralPropertiesandPPE
Growth (13,433) (11,729) (10,094)
Sustainingcapital (1,603) (997) (3,731)
Wastestripping (16,719) (10,987) (12,225)
Sub-Total (31,955) (23,713) (26,050)
OtherInvestingActivities 165 105 76
Total InvestingActivities (31,790) (23,608) (25,974)
Financing Activity (3,054) (3,660) 212
ForeignExchangeImpact 67 235 (89)
CashBalance Close 60,845 54,918 48,206
Increase(Decrease) 5,927 6,712 (11,469)
Operationscontinuetogeneratepositivec/flows
• Cashgeneratedfromoperationsof~US$41m,US$31mbeforeworkingcapitalmovements
• TrailingthreequarteraverageoperatingcashflowbeforeworkingcapitalchangesofUS$29m
• NetVATinflowof~US$7.5mafterrefundof~US$13.1mcollectedinquarter,inlinewithexpectations.
• HigherinvestmentinstrippingcostsassociatedwithdevelopmentofCut2atNkran
CashflowfromoperationsbeforeworkingcapitalchangesUS$,thousands
24,000
25,000
26,000
27,000
28,000
29,000
30,000
31,000
32,000
33,000
Q1'17 Q2'17 Q3'17
Trailing5 quarteraverage~US$29m

ScaleofArtisanalMiningattheMiradani Site
HistoricalPitExcavation
9
ACQUISITIONOFMIRADANI EXPLORATIONTARGET• Situatedonanexistingmininglease
• 44historictrenchescovering3.2kmstrikelength
– Trenchsamplesassayedupto47,3g/tover1.5m
• 3drilltargetsidentified:Miradani,CentralZone&Tontokrom
– Multiplemineralizedlenses,individuallyupto37minwidth
• PhasedRC&DDdrillingcampaigntocommenceinQ42017
• TargetingmaidenresourceinH22018

• Operations
– Operationalfocusareas:
• Finetuningresource&reserveconversion&miningsystems
• Continuedefficiencyimprovements
• Unitcostsofproduction
– MiningatDynamiteHilltodeliveroxideoresinQ12018
– FromQ42017,millfeedgradesexpectedtoreflectaveragereserve&stockpilegrades
• Exploration
– Midras SouthMaidenResourceinQ12018
– CommencedrillingatMiradani - maidenresourceinH22018
• P5MOptimizationPlan
• GuidanceOnTrack
– Production:205,000to225,000oz=>YTD153,596oz
– AISC:US$920/oz toUS$960/oz =>YTDUS$955/oz
10
OUTLOOK
APPENDIX
Non-GAAPPerformanceMeasures
• TheCompanyhasincludedcertainnon-GAAPperformancemeasuresinthispressrelease,includingadjustednetincome(loss),adjustednetincome(loss)pershare,operatingcashcosts,totalcashcostsandall-insustainingcostsperounceofgoldsold.Thesenon-GAAPperformancemeasuresdonothaveanystandardizedmeaning.Accordingly,theseperformancemeasuresareintendedtoprovideadditionalinformationandshouldnotbeconsideredinisolationorasasubstituteformeasuresofperformancepreparedinaccordancewithGAAP.
• OperatingCashCostsperounceandTotalCashCostsperounce
Operatingcashcostsarereflectiveofthecostofproduction,adjustedforshare-basedpayments,by-productrevenueandnon-cashinventorymovementsforeachounceofgoldsold.Totalcashcostsincludeproductionroyaltiesof5%.
• All-inSustainingCostsPerGoldOunce
TheCompanyhasadoptedthereportingof“all-insustainingcostspergoldounce”(“AISC”)aspertheWorldGoldCouncil’sguidance.AISCincludetotalcashcosts,corporateoverheadexpenses,sustainingcapitalexpenditure,capitalizedstrippingcostsandreclamationcostaccretionforeachounceofgoldsold.
• EarningsbeforeTaxes,Interest,Depreciation,DepletionandAmortization(“EBITDA”)
TheCompanyhasprovidedthereportingof“earningsbeforetaxes,interest,depreciation,depletionandamortization”(“EBITDA”)foradditionalinformation.EBTIDAwascalculatedastheincomeorlossfromoperationsadjustedforgainsorlossesassociatedwithforeignexchange,gainsorlossesassociatedwithderivativesanddepreciationanddepletion.
12
NOTES

AlexBuckInvestorRelations
N.AmericanToll-Free:18552467341Telephone:+44-7932-740-452Email:[email protected]
RobSlaterCorporateDevelopment&Strategy
N.AmericanToll-Free:18552467341Telephone:+27-11-467-2758Email:[email protected]
CONTACT US
13