presidential debate clouds voters’ choice · health care system. in addition, gore is seen as the...
TRANSCRIPT

FOR RELEASE: TUESDAY, OCTOBER 10, 2000, 12:00 P.M.
PRESIDENTIAL DEBATE CLOUDS VOTERS’ CHOICE
FOR FURTHER INFORMATION CONTACT:
Andrew Kohut, DirectorCarroll Doherty, EditorKimberly Parker, Research DirectorGregory Flemming, Survey DirectorMichael Dimock, Survey AnalystNilanthi Samaranayake, Project DirectorPew Research Center for The People & The Press202/293-3126http://www.people-press.org

Presidential Trial Heat*
Aug 24- Sept 2- EarlySept 1 Sept 10 Oct
Registered Voters % % %Gore 48 45 44Bush 41 41 43Nader 3 2 5Buchanan 1 1 *Undecided 7 11 8
100 100 100N= (1,237) (762) (1,009)
Likely Voters+Gore 48 47 44Bush 43 43 45Nader 2 2 5Buchanan 1 1 *Undecided 6 7 6
100 100 100N= (940) (555) (722)
* Includes leaners+ Based on a seven question turnout scale whichassumes that 50% of the voting age population willgo to the polls.
PRESIDENTIAL DEBATE CLOUDS VOTERS’ CHOICE
Al Gore’s personality may be costing him votes. Although a plurality of voters believe hewon the first presidential debate, he has lost his small September lead over George W. Bush. As therace has narrowed, an increasing number of voters who oppose the vice president say they dislikehis personality. On the other hand, Bush has a slight edge over Gore on likabilty and honesty, buta larger percentage now think he is less qualified for the presidency than his rival.
Little wonder that voting intentions are more closely divided than they were in earlySeptember, when Al Gore led in a Pew Research Center survey and most other large national polls.Registered voters favor Gore 44%-43% in the current poll, which was conducted Oct. 4-8 among1,009 respondents. When Pew’s sample is narrowed to those most likely to vote, Bush holds a 45%-44% edge. Neither lead is statistically significant.
Enthusiasm for the vice president has ebbedamong his core supporters. Just 48% of Democrats nowsay they are strong backers of his candidacy, while 63%of Republicans back Bush strongly. Gore has lost groundamong men, who have consistently been more critical ofhim in personal terms than women. Bush made gainsamong affluent voters, and among mothers of childrenunder 18 years of age.
Swing groups — including independents, middle-income voters, suburbanites, white Catholics, andmainline Protestants — continue to be closely divided ontheir choice. However, the overall size of the swing votehas declined. In the current poll, 20% said they mightswitch their preferences by Election Day, compared to25% in September.
While personal judgments about the candidatesare mixed, Gore continues to have the confidence of theelectorate on leading issues. He has double-digit leadsover his rival on health care, making prescription drugsaffordable for seniors and handling the economy. Bushhas made some progress in gaining voters’ confidence onabortion and gun control. But he is only able to musterties with Gore on the two issues that he has emphasized most on the campaign trail: taxes andeducation.

-2-
A Basis for Judging Candidates
Person- Leader- Exper- Don’tality ship ience Issues Know
Like most % % % % %about Gore 6 16 23 49 6=100
September 9 15 22 48 6=100Like least about Gore 26 14 4 44 12=100
September 17 17 7 48 11=100
Like most about Bush 8 20 7 58 7=100
September 9 19 9 55 8=100Like least about Bush 25 11 15 37 12=100
September 20 12 11 43 14=100
Issues That Matter To:*
Gore Voters Bush VotersEducation (18%) Taxes (22%)Social Security (17%) Abortion (22%)Abortion (15%) Education (21%)Health care (15%) Social Security (12%)Medicare (13%) Guns (8%)Taxes (12%) Morality (7%)Environment (11%) Defense (6%)
* Based on those who said candidates’ issue positions arewhat they like most.
Issues Boost, Personalities DragCandidate support continues to be
driven in large part by perceptions of thecandidates’ issue positions. Fully half ofthose supporting Gore say his position onthe issues is what they like most about him.Even more Bush supporters (58%) say thegovernor’s issue stands are what they likemost. Nonetheless, many Gore voters(23%) also point to the vice president’sexperience as the main reason they supporthim, while almost as many Bush backers(20%) are attracted to his leadership ability.
Personality is more a liability thana plus for both candidates in this campaign.Fully 26% of Bush voters say what theylike least about Gore is his personality.This is up sharply from 17% last month. A similar proportion of Gore supporters (25%) say whatthey like least about Bush is his personality, up modestly from 20% last month. Still, issuesdominate here as well. A plurality of Bush voters (44%) point to Gore’s issue positions when askedwhat they like least about him. Similarly, 37% of Gore voters say Bush’s issue positions really turnthem off.
When these issue-driven voters were askedwhat specific issue positions they liked, twodistinct sets of issues emerged. Gore’s issue votersnamed education, Social Security, abortion, healthcare and Medicare most often. Bush’s supporterscited taxes, abortion, education, Social Securityand guns.
A Smaller Swing VoteThere is somewhat less indecision among
voters now compared to last month. Only 20%now say they might change their mind and vote fora candidate they’re not currently supporting, downfrom 25% in September.
Bush now enjoys slightly stronger support than does Gore. Twenty-six percent of votersstrongly back Bush, up from 21% in September. Gore enjoys strong support from 22% of voters,down marginally from 25% in September. Among partisans, the enthusiasm gap is much morestriking. Fully 63% of GOP voters express strong support for Bush. This compares with only 48%of Democratic voters who characterize their support for Gore as strong.

-3-
Voter Conviction Increases
Early EarlySept Oct
Gore Supporters % %Strongly 25 22Not Strongly 22 22
Non-supporters of GoreChance might vote for 13 11Definitely won't vote for 35 38Don’t Know 5 7
100 100Bush Supporters
Strongly 21 26Not Strongly/Lean 20 17
Non-supporters of BushChance might vote for 15 11Definitely won't vote for 38 39Don’t Know 6 7
100 100
Presidential Preference:Strength of Support
Total Rep Dem Ind% % % %
Support Gore 44 9 85 37 Strongly 22 2 48 13 Moderately 22 6 37 24 Don’t know * 1 * *
Support Bush 43 88 8 36 Strongly 26 63 2 13 Moderately 17 24 6 23 Don’t know * 1 * 0
Among Bush’s strongest supporters are white men,affluent voters, southerners, and white evangelicalChristians. Gore’s strongest support comes from blacks,young women, low income voters and labor unionmembers.
Gaps GaloreThe gender gap continues to be a key campaign
prism. Gore now leads Bush among women by a marginof 49%-40%, and Bush has opened up his lead among men(46%-39%). Men under 50 support Bush over Gore by acomfortable margin (49%-36%), while older men continueto narrowly favor Gore. Women under age 50 remainmore closely divided than their older counterparts. Theyprefer Gore over Bush 49%-41%, while older women favorthe vice president by a 51%-38% margin.
Since last month, affluent voters have also movedsharply toward Bush. Those with family incomes in excessof $75,000 gave Bush only a slight edge over Gore lastmonth (47% vs. 44%). Now this group prefers Bush over Gore by a solid 54%-33% margin. Inaddition, Bush has made some progress in recent weeks in the crucial Midwest region.Midwesterners, who narrowly preferred the vice president a month ago (47%-42%), now choose theTexas governor 48%-39%.
The gap between parents and non-parents had widened over the past month. Parents nowfavor Bush over Gore by a margin of 49%-39%. Bush has increased his lead among fathers (whonow prefer him over Gore 51%-35%), and he holds a narrow lead among mothers — a key swinggroup — who favored Gore last month.
Independents continue to divide evenly betweenGore and Bush (37%-36%), and they don’t express astrong preference for either candidate. Much of RalphNader’s increased support observed in the past month hascome from independents, 12% of whom now say if theelection were held today, they’d vote for the Green Partycandidate.
The VeepsThe vice presidential candidates are as evenly
matched as their principals. When asked to choose betweenLieberman and Cheney, voters divide evenly — 42% forthe Democrat, 41% for the Republican. The gender gap inthe presidential horse race is mirrored in this question

-4-
Candidate Clarification
Gore and Bush Issue Positions ...
Different Similar DK% % %
October, 2000 61 30 9=100September, 2000 56 32 12=100June, 2000 51 33 16=100July, 1999 47 24 29=100
Where They Differ
(VOL.)Major Minor Same DK
Issues ... % % % %Tax cuts 73 14 4 9=100Social Security 63 21 4 12=100Prescription drugs 59 24 5 12=100
The economy 55 29 5 11=100Role of government 52 26 6 16=100Education 49 32 9 10=100
Foreign policy 43 31 5 21=100Gas prices 43 31 6 20=100
about the bottom of the ticket. Men prefer Cheney by a 10-point margin, while women chooseLieberman by a similar margin. Independents, who are evenly split on their presidential preference,give Lieberman a slight edge over Cheney, 41%-35%.
More See a Clear ChoiceVoters increasingly see differences in the issue
positions taken by Gore and Bush. By a two-to-onemargin (61%-30%) voters say the candidates takedifferent positions on the issues, up from 56% inSeptember and 51% in June. Republicans, in particular,regard the campaign as a clear choice — seven-in-tensay there are differences on the issues, compared to62% of Democrats and just half of independents.
Fully 73% of voters find major differencesbetween Gore and Bush on tax policy, and majoritiessay the candidates have significantly divergent positions on Social Security, prescription drugs,economic policies and proposals regarding the proper role of government in solving nationalproblems.
Yet while education is a dominantcampaign issue, only 49% regard the differencesbetween Gore and Bush in this area as major.Similarly, fewer voters see big differences in theirapproaches toward foreign policy and gas prices.
Big Issues to GoreAs in earlier polls, Gore continues to
maintain a significant edge over Bush in voterassessments of who would do a better job inhandling many key issues. The vice president holdsa 50%-31% edge on being able to makeprescription drugs more affordable for seniors. Healso is seen as better able to keep Social Securityand Medicare financially sound and to improve thehealth care system. In addition, Gore is seen as the candidate best able keep the economy strong, anissue that was closely contested earlier this fall. He now leads on that issue, 47%-35%.

-5-
The Issue DividesDon’t
Bush Gore Neither KnowGore issues ... % % % %Prescription drugs 31 50 6 13=100Health care 36 49 5 10=100Economy 35 47 6 12=100Social Security/ Medicare 38 46 5 11=100World affairs 36 44 5 15=100
Up for grabs ...Taxes 39 42 6 13=100Education 41 43 6 10=100Selecting justices 37 39 4 20=100Campaign finance 33 34 13 20=100Role of government 41 40 6 13=100Defense 43 40 6 11=100Abortion 41 38 6 15=100
Gun control 41 35 6 18=100
While more voters say Bush represents theirviews on gun control and abortion, his advantageon these issues is fairly small. Throughout thecampaign, Bush has also held a slight edge invoters’ judgments about who would make the wiserdecisions about the country's defense policies,though his lead here is not statistically significant.
The electorate is more evenly divided overwhich candidate is better able to handle taxes,education, selecting justices to serve on theSupreme Court, campaign finance reform, andwhich man better reflects voters’ views about therole of government. The parity between Gore andBush on tax and education policy is particularlysignificant, in part because they have emerged asmajor campaign themes, and because it representsa change from the summer. In June, Gore held a44%-34% lead on education, while Bush was seenby more (41% to 34%) as better able to deal withtaxes.
Gore Less Likable, More Qualified?As in previous surveys, Bush holds the edge over Gore in personal qualities relating to
leadership. More voters say Bush is the candidate willing to take a stand even if unpopular, andslightly more rate him as a strong leader, although his three-point lead over Gore (41%-38%) hasbeen cut in half since September.
But Gore has his own personal strengths as well. He is widely seen as more qualified thanBush (by 49%-31%), and more voters view Gore as the candidate who cares about people likethemselves. Gore also leads in being seen as the candidate who would use good judgment in a crisis.In June, equal numbers of voters saw Gore and Bush as qualified, and the Texas governor held a44%-37% lead as the candidate with better judgment.

-6-
Changing Candidate Perceptions
Don’tBush Gore Neither Both Know
Bush's strengths ... % % % % %Willing to take a stand 43 35 8 6 8=100 September 45 37 8 5 5=100Strong leader 41 38 7 10 4=100 September 44 38 7 6 5=100
Gore's strengths ...Personally qualified 31 49 5 11 4=100 June 37 37 10 10 6=100Cares about people 35 44 11 5 5=100 September 31 47 9 7 6=100Good judgment 36 43 4 10 7=100 September 38 44 3 8 7=100
Up for grabs ...Honest 36 32 17 8 7=100 September 35 37 13 9 6=100Gets things done 37 38 5 11 9=100 September 40 40 4 8 8=100Personably likable 41 38 4 12 5=100 September 37 44 3 12 4=100
Despite Gore’s edge inqualifications, recent events — includingthe first debate — appear to have taken atoll on voter perceptions of his honesty andhis general likability. In September, 44% ofvoters said Gore was the more likablecandidate, with 37% choosing Bush; todayBush holds a slight 41%-38% edge.Similarly, the number of voters who regardGore as the more honest and truthfulcandidate has dropped somewhat from 37%in September to 32%, although Bush'shonesty ratings have not increasedcommensurately. Perhaps most worrisomefor the vice president, his recent declines inlikability and honesty have been sharperamong some of his strongest supporters,particularly women.
Social Security: Status Quo FavoredVoters are of two minds about
restructuring Social Security. Previous PewResearch Center surveys have shown strongsupport, in principle, for letting youngerworkers invest some payroll taxes in private accounts. But the current poll shows that supportdeclines when the risks and rewards of market-based accounts are mentioned.
Overall, 54% of the electorate supports maintaining the current program; 31% would allowyounger workers to decide for themselves how some of their contributions are invested, which couldcause benefits to be higher or lower depending on how the investments perform. In the Pew surveyin September, seven-in ten supported the general concept of private retirement accounts, but therewas no mention that returns from those accounts could affect future benefits.
Not surprisingly, political partisans disagree over this issue. Half of Republicans (51%)support letting younger workers decide how some contributions are invested -- even if that affectsfuture benefits -- while 32% want to maintain the status quo. Solid majorities of Democrats andindependents favor keeping guaranteed benefits (72% and 59% respectively). Fully 61% who wantto keep the system as is believe Gore would do a better job on Social Security; 63% of those whosupport permitting younger workers to make some investment decisions say the same about Bush.
There is a significant gender gap on this issue, but almost exclusively among younger people.Men under age 50 are evenly split — 45% would let younger workers decide for themselves howto invest some Social Security contributions, and 45% opt for guaranteed benefits. Women underage 50 favor guaranteed benefits by better than a two-to-one margin (60%-24%).

-7-
Gender Gap on Social Security
All Under 50 Over 50RV's Men Women Men Women
% % % % %Maintain guaranteedmonthly benefit 54 45 60 58 56
Let younger workersinvest some contributions 31 45 24 30 24 Both/Neither/Don't know 15 10 16 12 20
100 100 100 100 100
A Kiss to Remember
All RV's Men WomenHeard a lot about ... % % %The Gores’ convention kiss 46 47 45Gore’s oil reserve proposal 42 52 34Bush’s tax cut proposal 35 40 31Bush’s insult of newspaper reporter 32 33 32Gore’s criticism of Hollywood 32 37 27Mystery over Bush debate tape 22 26 19“Oprah” appearances 20 20 20Gore’s misstatements about drug prices 19 22 16
Gender differences also emerge,with a more surprising result, in voterattitudes toward the FDA’s recentapproval of the abortion pill RU-486.Overall, the electorate is split, with 43%approving of the FDA action, against46% who disapprove. Men back thedecision (49%-40%), while women, whotraditionally are more supportive ofabortion rights, oppose it (37%-52%).
Female college graduates tend tobe much more supportive of the FDAruling than other women. A majority ofwomen college graduates (54%) support the RU-486 decision, compared to 39% who oppose theaction. Women who have not graduated from college — a much larger group — come down solidlyagainst the abortion pill (56%-31%).
A plurality of voters (47%) believe the United States should develop a missile defensesystem — a program that Bush has strongly supported. GOP voters back missile defense by nearlya three-to-one margin (62%-21%); Democrats are split (38% in favor, 40% opposed), as areindependents (41%-45%).
Fully six-in-ten voters (61%) say the United States and its allies have a moral obligation touse military force to prevent genocide. More Democrats (67%) than Republicans (53%) hold thisview.
The Kiss — Men Watched TooThe passionate kiss by Al and Tipper
Gore at the Democratic convention hasresonated with voters more than other highly-publicized campaign events, including theappearances by both candidates on the OprahWinfrey show.
Fully 46% of voters say they heard “alot” about the Gores’ kiss. Although somepundits have said the kiss “humanized” thevice president for women voters, as many menas women say they heard a great deal about theevent.
In general, campaign events register more strongly with men than women. Indeed, more mensay they heard a great deal about Gore’s support for tapping the Strategic Petroleum Reserve (52%)than heard of the Gores’ convention kiss, but just 34% of women heard a lot about the oil reserveissue.

-8-
Overall, six-in-ten voters say they have given a lot of thought to the presidential election,which is largely unchanged from September. That is only slightly less than the 65% who werepaying a lot of attention to the campaign at this stage four years ago, but far less than the 77% whowere fully engaged in the 1992 campaign.
But significantly more voters are paying very close attention to news about the campaign,at least compared to 1996. More than four-in-ten voters (42%) say they are following campaignnews very closely; in November 1996, just 34% said they were following campaign news veryclosely. The number of people who report following campaign news very closely has jumped 15percentage points since September.
Interest in the presidential debates has also increased since the Oct. 3 encounter betweenGore and Bush. Nearly half of voters (49%) say it is now very likely they will watch the next twodebates; before the first debate, 43% said it was very likely they would watch the debates — thesame number as in 1996.
More than six-in-ten voters (63%) report watching at least a little of the first debate, while37% tuned out entirely. A plurality of those who watched (41%) say Gore won the debate, comparedto 32% who believe Bush prevailed. Democrats and Republicans overwhelmingly believe theirparty’s standard-bearer won, while independents say Gore won the debate 42%-25%.
Voters See Gore VictoryIn spite of the closeness of the race, a plurality of voters (46%) now believe Gore will
ultimately win the election. Roughly one-third think Bush will win, and 21% aren’t sure how it willturn out. At a comparable point in 1996, fully 79% of voters predicted Bill Clinton would win.Democrats are much more confident about Gore’s prospects than are Republicans about Bush’s.More than seven-in-ten Democrats think Gore will win the election, compared to 58% ofRepublicans who say Bush will prevail. On balance, independents say Gore will win — 47% vs.32% who pick Bush. In June of this year, voters had a different view. Roughly half thought Bushwould win in November, 33% chose Gore.
***********************About the Survey
Results for the survey are based on telephone interviews conducted under the direction of PrincetonSurvey Research Associates among a nationwide sample of 1,331 (1,009 registered voters) adults , 18 yearsof age or older, during the period October 4-8, 2000. For results based on the total sample, one can say with95% confidence that the error attributable to sampling and other random effects is plus or minus 3 percentagepoints. For results based on registered voters (N=1,009), the sampling error is plus or minus 3.5 percentagepoints. For results based on either Form 1 (N=494) or Form 2 (N=515) registered voters, the sampling erroris plus or minus 5 percentage points.

-9-
TREND IN PRESIDENTIAL TRIAL HEAT*(Based on Registered Voters)
---- September 2000 ---- ----October 2000----Buch- Buch- Change
Gore Bush anan Nader DK Gore Bush anan Nader DK in Gore (N)% % % % % % % % % %
Total 47 41 1 2 9=100 44 43 * 5 8=100 -3 (1009)
SexMale 43 45 1 3 8 39 46 1 7 7 -4 (462)Female 50 37 1 2 10 49 40 * 3 8 -1 (547)
RaceWhite 42 46 1 2 9 40 48 * 5 7 -2 (846)Non-white 72 16 1 2 9 73 14 0 3 10 +1 (149)Black 80 7 1 3 9 83 10 0 2 5 +3 (94)Hispanic^ 56 34 2 1 7 60 20 0 7 13 +4 (39)
Race and SexWhite Men 37 50 2 3 8 35 50 1 7 7 -2 (395)White Women 46 42 1 1 10 43 46 * 3 8 -3 (451)
AgeUnder 30 48 40 1 4 7 45 46 1 3 5 -3 (143)30-49 43 46 1 3 7 41 45 * 6 8 -2 (405)50-64 48 40 1 1 10 46 41 * 5 8 -2 (243)65+ 52 34 1 1 12 50 38 0 4 8 -2 (206)
Sex and AgeMen under 50 40 47 2 5 6 36 49 * 7 8 -4 (262)Women under 50 47 42 1 2 8 49 41 * 3 7 +2 (286)Men 50+ 45 43 1 1 10 44 41 1 8 6 -1 (195)Women 50+ 54 32 1 1 12 51 38 0 2 9 -3 (254)
EducationCollege Grad. 45 44 1 3 7 44 44 0 6 6 -1 (361)Some College 44 44 1 3 8 37 49 0 5 9 -7 (272)H.S. Grad & Less 49 38 2 1 10 50 38 1 3 8 +1 (372)
* Includes leaners
^ The designation Hispanic is unrelated to the white-black categorization. Note small sample size in October.
Question: If the presidential election were being held TODAY, would you vote for the Democratic ticket of Al Gore andJoe Lieberman, for the Republican ticket of George W. Bush and Dick Cheney, for the Green Party ticket headedby Ralph Nader, or for the Reform Party ticket headed by Pat Buchanan?As of TODAY, do you LEAN more to Gore the Democrat, more to Bush the Republican, more to Nader of theGreen Party or more to Buchanan the Reform party candidate?
Continued...

-10-
---- September 2000 ---- ----October 2000----Buch- Buch- Change
Gore Bush anan Nader DK Gore Bush anan Nader DK in Gore (N)% % % % % % % % % %
Total 47 41 1 2 9=100 44 43 * 5 8=100 -3 (1009)
Family Income$75,000+ 44 47 1 2 6 33 54 0 5 8 -11 (182)$50,000-$74,999 42 48 * 3 7 41 47 1 5 6 -1 (150)$30,000-$49,999 48 41 1 3 7 46 41 0 4 9 -2 (264)$20,000-$29,999 50 38 2 3 7 58 31 1 7 3 +8 (114)<$20,000 57 29 2 2 10 56 35 0 4 5 -1 (154)
RegionEast 51 34 3 2 10 53 32 0 4 11 +2 (197)Midwest 47 42 1 2 8 39 48 1 5 7 -8 (273)South 44 45 1 1 9 45 46 0 2 7 +1 (366)West 48 39 1 4 8 43 41 1 8 7 -5 (173)
Religious AffiliationTotal White Protestant 37 52 1 1 9 36 55 * 3 6 -1 (456)White Protestant Evangelical 29 59 1 * 11 31 61 1 2 5 +2 (233)White Prot. Non-Evangelical 44 45 2 2 7 42 48 0 4 6 -2 (223)White Catholic 47 43 1 2 7 44 42 1 4 9 -3 (206)Secular 56 21 0 8 15 47 22 0 19 12 -9 (83)
Community SizeLarge City 59 30 1 2 8 54 35 0 6 5 -5 (192)Suburb 44 44 1 3 8 43 45 0 5 7 -1 (259)Small City/Town 47 40 1 2 10 44 43 1 4 8 -2 (345)Rural Area 36 51 1 2 10 39 47 * 5 9 +3 (205)
Party IDRepublican 7 87 1 * 5 8 87 0 1 4 +1 (334)Democrat 89 7 * 1 3 85 8 * 2 5 -4 (348)Independent 39 38 2 6 15 37 37 1 12 13 -2 (272)
Party and IdeologyConservative Republican 5 91 1 * 3 5 92 0 0 3 0 (233)Moderate/Liberal Republican 11 78 1 * 10 17 77 0 2 4 +6 (94)Conservative/Moderate Dem. 88 8 0 * 4 84 11 * 1 4 -4 (243)Liberal Democrat 90 5 1 3 1 89 1 0 5 5 -1 (92)
Marital StatusMarried 42 47 1 2 8 40 48 * 4 8 -2 (590)Unmarried 53 32 2 3 10 51 35 * 6 8 -2 (408)
Parental StatusParent 45 46 1 2 6 39 49 * 4 8 -5 (350)Non-Parent 48 38 1 3 10 47 40 * 5 8 -1 (653)
Labor UnionUnion Household 56 32 1 3 8 58 32 1 4 5 +2 (131)Non-Union Household 45 43 1 2 9 42 45 * 5 8 -3 (864)

-11-
OPINION ON KEY ISSUES BY DEMOGRAPHIC AND POLITICAL GROUPS(Based on Registered Voters)
Social Security Approach Moral Obligation to UseGuaranteed Workers Both/ FDA Decision on RU-486 Military Force Abroad
Benefit Decide Neither/DK Approve Disapprove DK Yes No DK% % % % % % % % %
Total 54 31 15=100 43 46 11=100 61 26 13=100
SexMale 50 39 11 49 40 11 61 30 9Female 58 24 18 37 52 11 61 24 15
RaceWhite 52 33 15 43 46 11 61 27 12Non-white 69 18 13 40 50 10 57 27 16Black 73 14 13 44 47 9 59 26 15Hispanic^ 68 20 12 43 52 5 70 21 9
Race and SexWhite Men 48 40 12 49 39 12 61 30 9White Women 55 27 18 38 51 11 62 23 15
AgeUnder 30 48 40 12 38 56 6 68 28 430-49 54 33 13 45 44 11 64 25 1150-64 56 28 16 45 43 12 57 27 1665+ 58 24 18 38 47 15 54 26 20
Sex and AgeMen under 50 45 45 10 49 41 10 62 30 8Women under 50 60 24 16 37 54 9 68 22 10Men 50+ 58 30 12 49 39 12 60 29 11Women 50+ 56 24 20 36 50 14 52 25 23
EducationCollege Grad. 50 36 14 54 37 9 70 23 7Some College 44 39 17 39 49 12 58 30 12H.S. Grad & Less 63 23 14 37 51 12 57 26 17
^ The designation Hispanic is unrelated to the white-black categorization. Note small sample size (N=39).
Question: People have different opinions about how the Social Security system might be changed for the future. Whendecisions about Social Security’s future are being made, which do you think is MORE important... KeepingSocial Security as a program with a GUARANTEED monthly benefit based on a person’s earnings during theirworking life, OR Letting younger workers DECIDE for THEMSELVES how some of their own contributionsto Social Security are invested, which would cause their future benefits to be higher or lower depending on howwell their investments perform?
The Food and Drug Administration recently approved the abortion pill RU-486. This means that women willnow be able to terminate a pregnancy with drugs instead of surgery. Do you approve or disapprove of thisdecision?
In the future, do you think the U.S. and other Western powers have a moral obligation to use military force inother countries, if necessary, to prevent one group of people from committing genocide against another, or don’tyou think so?
Continued...

-12-
Social Security Approach Moral Obligation to UseGuaranteed Workers Both/ FDA Decision on RU-486 Military Force Abroad
Benefit Decide Neither/DK Approve Disapprove DK Yes No DK% % % % % % % % %
Total 54 31 15=100 43 46 11=100 61 26 13=100
Family Income$75,000+ 39 47 14 52 36 12 67 26 7$50,000-$74,999 49 38 13 44 48 8 63 29 8$30,000-$49,999 54 30 16 48 46 6 59 31 10$20,000-$29,999 59 24 17 41 49 10 64 23 13<$20,000 67 19 14 32 57 11 56 24 20
RegionEast 58 25 17 48 41 11 57 28 15Midwest 50 36 14 41 47 12 62 27 11South 56 30 14 37 52 11 61 26 13West 51 33 16 48 40 12 63 25 12
Religious AffiliationTotal White Protestant 49 35 16 40 51 9 58 30 12White Protestant Evangelical 48 36 16 24 69 7 59 29 12White Prot. Non-Evangelical 50 34 16 58 31 11 57 31 12White Catholic 51 34 15 38 52 10 60 27 13Secular 57 31 12 74 21 5 61 28 11
Community SizeLarge City 59 27 14 48 41 11 64 22 14Suburb 51 35 14 46 42 12 62 27 11Small City/Town 56 29 15 42 49 9 64 25 11Rural Area 51 32 17 35 52 13 52 32 16
Party IDRepublican 32 51 17 27 64 9 53 33 14Democrat 72 14 14 56 36 8 67 21 12Independent 59 32 9 50 41 9 60 27 13
Party and IdeologyConservative Republican 28 56 16 17 73 10 55 33 12Moderate/Liberal Republican 37 43 20 51 43 6 48 33 19Conservative/Moderate Dem. 73 13 14 49 43 8 66 23 11Liberal Democrat 66 18 16 77 15 8 74 15 11
Marital StatusMarried 52 34 14 39 52 9 61 27 12Unmarried 57 28 15 53 38 9 61 26 13
Parental StatusParent 50 36 14 40 52 8 64 27 9Non-Parent 57 28 15 47 43 10 59 26 15
Labor UnionUnion Household 58 28 14 39 46 15 57 29 14Non-Union Household 53 32 15 45 47 8 62 26 12

1 In March through July 2000 the question was worded "News about candidates for the 2000 presidential election."
-13-
PEW RESEARCH CENTER FOR THE PEOPLE & THE PRESSEARLY OCTOBER 2000 POLITICAL SURVEY
FINAL TOPLINEOctober 4-8, 2000
N = 1,331 General PublicN = 1,009 Registered Voters
NOTE: ALL NUMBERS IN SURVEY, INCLUDING TREND FIGURES, ARE BASED ON REGISTERED VOTERSEXCEPT WHERE NOTED
Q.1 How much thought have you given to the coming Presidential election... quite a lot or only a little?
Quite (VOL.) Only a (VOL.) DK/A lot Some Little None Ref.
October, 2000 60 8 27 4 1=100September, 2000 59 8 29 3 1=100July, 2000 46 6 45 3 *=100June, 2000 46 6 43 5 *=100May, 2000 48 4 42 5 1=100November, 1996 67 8 22 3 *=100October, 1996 65 7 26 1 1=100Late September, 1996 61 7 29 2 1=100Early September, 1996 56 3 36 4 1=100July, 1996 55 3 41 1 *=100June, 1996 50 5 41 3 1=100October, 1992 77 5 16 1 1=100September, 1992 69 3 26 1 1=100August, 1992 72 4 23 1 *=100June, 1992 63 6 29 1 1=100Gallup: November, 1988 73 8 17 2 0=100Gallup: October, 1988 69 9 20 2 0=100Gallup: August, 1988 61 10 27 2 0=100Gallup: September, 1988 57 18 23 2 0=100
Q.2 Now I will read a list of some stories covered by news organizations this past month. As I read each item, tell me if youhappened to follow this story very closely, fairly closely, not too closely, or not at all closely? [INSERT ITEM; ROTATEITEMS]
Very Fairly Not too Not at all (VOL.)closely closely closely closely DK/Ref.
a. News about the presidential election campaign 42 36 15 6 1=100September, 2000 27 46 18 8 1=100July, 20001 25 40 19 15 1=100June, 2000 27 34 22 16 1=100April, 2000 21 36 25 18 *=100Early April, 2000 22 43 20 15 *=100March, 2000 30 43 16 10 1=100November, 1996 34 45 15 6 *=100Early September, 1996 29 39 19 13 *=100
July, 1996 25 42 21 11 1=100October, 1992 55 36 7 2 0=100September, 1992 47 36 11 6 *=100August, 1992 36 51 11 2 0=100July, 1992 23 48 24 5 *=100October, 1988 43 44 11 2 *=100August, 1988 39 45 13 3 *=100

-14-
Q.3 These days, many people are so busy they can't find time to register to vote, or move around so often they don't get achance to re-register... Are you NOW registered to vote in your precinct or election district, or haven't you been able toregister so far?
IF RESPONDENT ANSWERED '1' YES IN Q.3 , ASK:Q.3a Are you absolutely certain you are registered to vote, or is there a chance your registration has lapsed because you moved
or for some other reason?
BASED ON TOTAL VOTING AGE POPULATION: [N=1,331]Yes, Absolutely Chance No, Not
Registered Certain Lapsed DK/Ref Registered DK/Ref.October, 2000 77 72 4 1 23 *=100September, 2000 75 69 5 1 25 *=100June, 2000 79 75 4 * 21 *=100Late September, 1999 74 69 5 * 24 2=100Early September, 1998 77 74 3 * 22 1=100Late August, 1998 78 75 3 * 22 *=100June, 1998 78 73 4 1 22 *=100November, 1997 80 75 4 1 20 *=100September, 1997 79 76 3 * 20 1=100November, 1996 76 69 2 * 24 *=100June, 1996 79 75 4 0 21 *=100October, 1995 76 73 3 * 23 1=100April, 1995 76 74 2 0 23 1=100December, 1994 74 70 3 1 24 2=100November, 1994 73 70 2 1 26 1=100Late October, 1994 77 74 3 0 22 1=100Early October, 1994 76 72 4 * 23 1=100July, 1994 79 75 4 0 20 1=100May, 1993 82 - - - 17 1=100June, 1992 76 73 3 0 23 1=100November, 1990 80 - - - 20 0=100
Q.4 Have you ever voted in your precinct or election district?
Late Oct Early Oct Nov Late Sept Nov1998 1998 1996 1996 1994
84 Yes 86 87 85 85 9116 No 14 13 15 15 9 * Don’t know/Refused * * * * *100 100 100 100 100 100
Q.5 Generally speaking, how much interest would you say you have in politics: a great deal, a fair amount, only a little, or nointerest at all?
Oct Late Sept --- Gallup ---1996 1996 Nov 1988 Oct 1988
30 Great deal 25 25 29 2749 Fair amount 50 50 51 5316 Only a little 22 22 17 17 5 None 3 3 3 3 * Don't know/Refused * * * *100 100 100 100 100

-15-
Q.6 How often would you say you vote... (READ)(VOL.)
Nearly Part of (VOL.) NeverAlways Always The time Seldom Other Vote DK/Ref.
October, 2000 51 29 10 6 3 1 *=100September, 2000 61 21 9 7 * 2 *=100June, 2000 58 26 10 4 1 1 *=100Late September, 1999 40 47 9 3 * 1 *=100Early September, 1998 53 33 9 4 1 0 *=100June, 1998 49 33 12 5 1 0 0=100September, 1997 62 26 8 3 * 1 *=100November, 1996 55 28 8 6 1 2 *=100October, 1996 52 30 9 5 2 2 *=100Late September, 1996 52 31 10 4 1 2 *=100June, 1996 52 33 9 4 1 1 *=100February, 1996 42 41 11 4 1 1 *=100October, 1995 53 35 7 4 * 1 *=100April, 1995 53 34 9 4 * * *=100November, 1994 58 28 8 5 1 * 0=100October, 1994 55 32 10 3 * * *=100July, 1994 52 34 10 4 * * *=100June, 1992 60 29 7 3 1 * *=100May, 1992 50 35 10 4 * 1 *=100November, 1991 46 41 9 4 0 * *=100May, 1990 42 42 11 4 * 1 *=100Gallup: November, 1988 57 26 10 4 2 1 *=100Gallup: October, 1988 56 26 12 4 1 1 *=100May, 1988 43 41 11 3 1 2 *=100January, 1988 49 39 9 2 * 1 *=100May, 1987 43 43 9 3 1 1 *=100
Q.7F1/8F2 If the presidential election were being held TODAY, would you vote for the Democratic ticket of Al Gore andJoe Lieberman, for the Republican ticket of George W. Bush and Dick Cheney, for the Green Party ticket headedby Ralph Nader, or for the Reform Party ticket headed by Pat Buchanan?
Q.10F1/11F2 As of TODAY, do you LEAN more to Gore the Democrat, more to Bush the Republican, more to Nader of theGreen Party or more to Buchanan the Reform party candidate?
Q.9 Do you support (INSERT PRESIDENTIAL CHOICE FROM Q.7/8, DO NOT READ VP CHOICE)strongly or only moderately?
Sept July Late June Mid-June Gore-Bush Trial Heat2000 2000 2000 2000 Mid-June 2000
44 Gore/Lean Gore 47 41 35 42 46 Gore/Lean Gore22 Strongly 25 n/a n/a n/a 18 Strongly22 Only moderately 21 n/a n/a n/a 27 Only moderately * Don't know 1 n/a n/a n/a 1 Don't know
43 Bush/Lean Bush 41 42 42 41 45 Bush/Lean Bush26 Strongly 21 n/a n/a n/a 20 Strongly17 Only moderately 19 n/a n/a n/a 25 Only moderately * Don't know 1 n/a n/a n/a * Don't know
5 Nader/Lean Nader 2 6 2 4 9 Undec/Other/DK 2 Strongly 1 n/a n/a n/a 100 3 Only moderately 1 n/a n/a n/a 0 Don't know 0 n/a n/a n/a
* Buchanan/Lean Buchanan 1 2 2 3 0 Strongly * n/a n/a n/a * Only moderately 1 n/a n/a n/a 0 Don't know * n/a n/a n/a
8 Undecided/Other/DK 9 9 19 10100 100 100 100 100
-16-
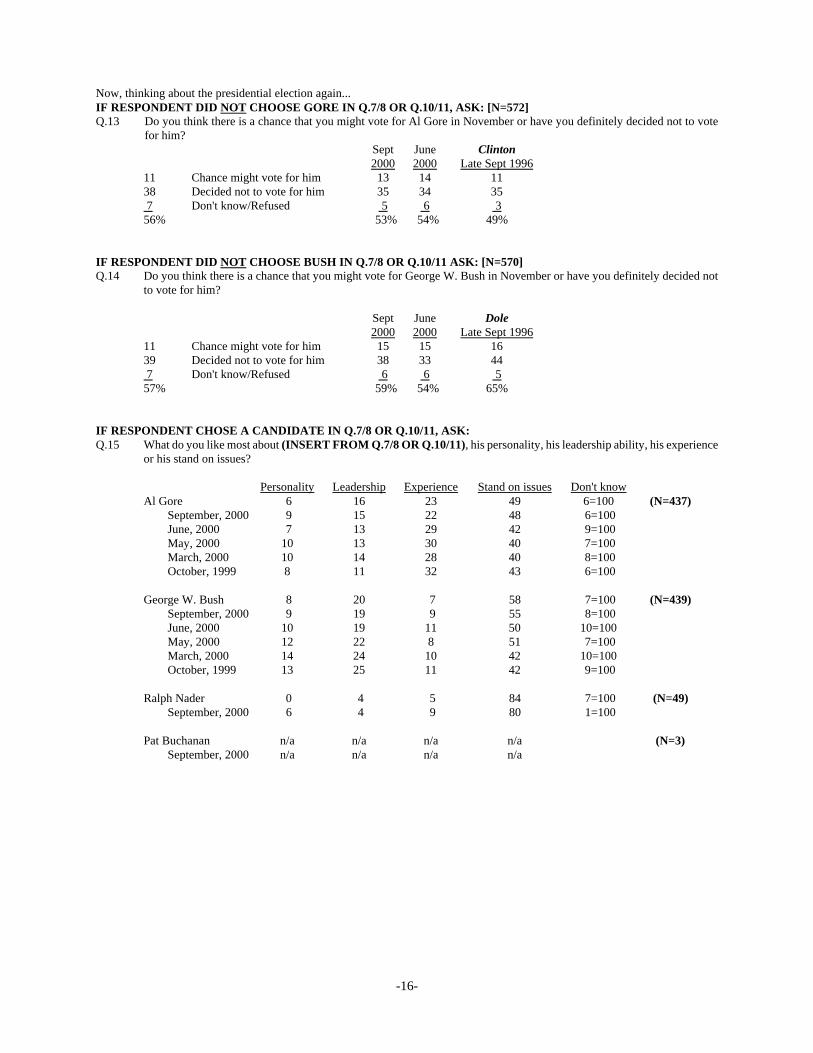
Now, thinking about the presidential election again...IF RESPONDENT DID NOT CHOOSE GORE IN Q.7/8 OR Q.10/11, ASK: [N=572]Q.13 Do you think there is a chance that you might vote for Al Gore in November or have you definitely decided not to vote
for him?Sept June Clinton2000 2000 Late Sept 1996
11 Chance might vote for him 13 14 1138 Decided not to vote for him 35 34 35 7 Don't know/Refused 5 6 356% 53% 54% 49%
IF RESPONDENT DID NOT CHOOSE BUSH IN Q.7/8 OR Q.10/11 ASK: [N=570]Q.14 Do you think there is a chance that you might vote for George W. Bush in November or have you definitely decided not
to vote for him?
Sept June Dole2000 2000 Late Sept 1996
11 Chance might vote for him 15 15 1639 Decided not to vote for him 38 33 44 7 Don't know/Refused 6 6 557% 59% 54% 65%
IF RESPONDENT CHOSE A CANDIDATE IN Q.7/8 OR Q.10/11, ASK:Q.15 What do you like most about (INSERT FROM Q.7/8 OR Q.10/11), his personality, his leadership ability, his experience
or his stand on issues?
Personality Leadership Experience Stand on issues Don't knowAl Gore 6 16 23 49 6=100 (N=437)
September, 2000 9 15 22 48 6=100June, 2000 7 13 29 42 9=100May, 2000 10 13 30 40 7=100March, 2000 10 14 28 40 8=100October, 1999 8 11 32 43 6=100
George W. Bush 8 20 7 58 7=100 (N=439)September, 2000 9 19 9 55 8=100June, 2000 10 19 11 50 10=100May, 2000 12 22 8 51 7=100March, 2000 14 24 10 42 10=100October, 1999 13 25 11 42 9=100
Ralph Nader 0 4 5 84 7=100 (N=49)September, 2000 6 4 9 80 1=100
Pat Buchanan n/a n/a n/a n/a (N=3)September, 2000 n/a n/a n/a n/a
-17-
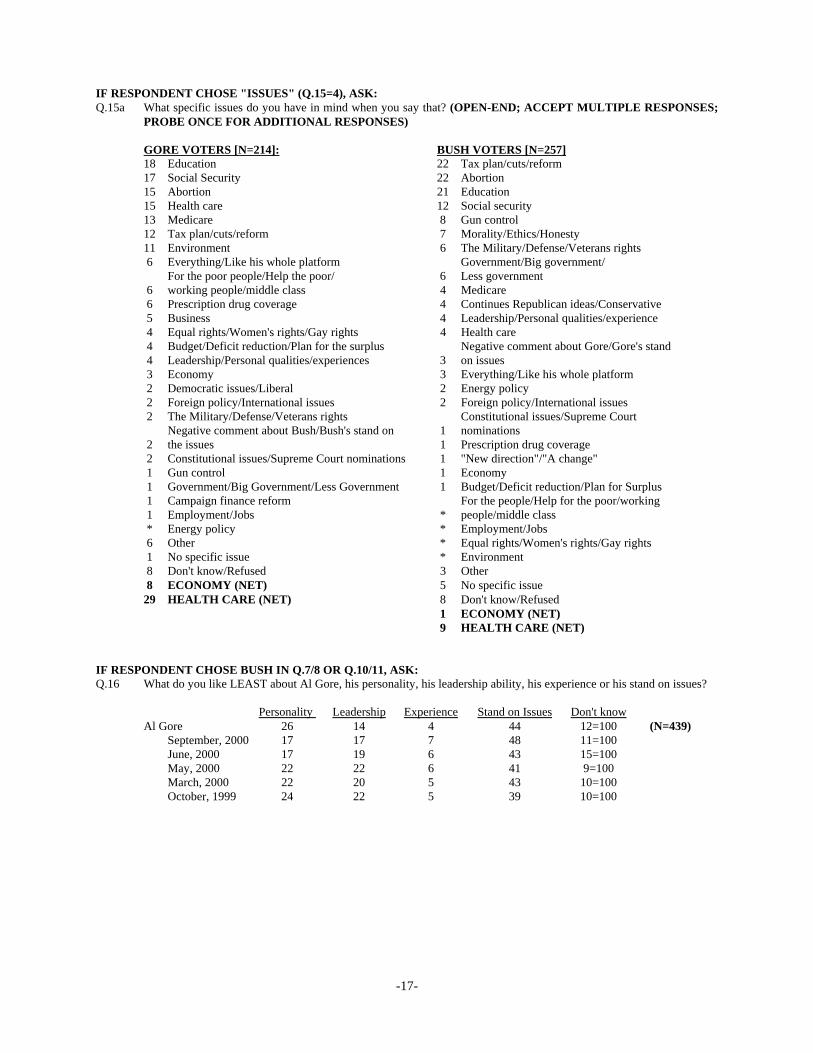
IF RESPONDENT CHOSE "ISSUES" (Q.15=4), ASK:Q.15a What specific issues do you have in mind when you say that? (OPEN-END; ACCEPT MULTIPLE RESPONSES;
PROBE ONCE FOR ADDITIONAL RESPONSES)
GORE VOTERS [N=214]: BUSH VOTERS [N=257]18 Education 22 Tax plan/cuts/reform17 Social Security 22 Abortion15 Abortion 21 Education15 Health care 12 Social security13 Medicare 8 Gun control12 Tax plan/cuts/reform 7 Morality/Ethics/Honesty11 Environment 6 The Military/Defense/Veterans rights 6 Everything/Like his whole platform Government/Big government/
For the poor people/Help the poor/ 6 Less government 6 working people/middle class 4 Medicare 6 Prescription drug coverage 4 Continues Republican ideas/Conservative 5 Business 4 Leadership/Personal qualities/experience 4 Equal rights/Women's rights/Gay rights 4 Health care 4 Budget/Deficit reduction/Plan for the surplus Negative comment about Gore/Gore's stand 4 Leadership/Personal qualities/experiences 3 on issues 3 Economy 3 Everything/Like his whole platform 2 Democratic issues/Liberal 2 Energy policy 2 Foreign policy/International issues 2 Foreign policy/International issues 2 The Military/Defense/Veterans rights Constitutional issues/Supreme Court Negative comment about Bush/Bush's stand on 1 nominations 2 the issues 1 Prescription drug coverage 2 Constitutional issues/Supreme Court nominations 1 "New direction"/"A change" 1 Gun control 1 Economy 1 Government/Big Government/Less Government 1 Budget/Deficit reduction/Plan for Surplus 1 Campaign finance reform For the people/Help for the poor/working 1 Employment/Jobs * people/middle class * Energy policy * Employment/Jobs 6 Other * Equal rights/Women's rights/Gay rights 1 No specific issue * Environment 8 Don't know/Refused 3 Other 8 ECONOMY (NET) 5 No specific issue29 HEALTH CARE (NET) 8 Don't know/Refused
1 ECONOMY (NET) 9 HEALTH CARE (NET)
IF RESPONDENT CHOSE BUSH IN Q.7/8 OR Q.10/11, ASK:Q.16 What do you like LEAST about Al Gore, his personality, his leadership ability, his experience or his stand on issues?
Personality Leadership Experience Stand on Issues Don't knowAl Gore 26 14 4 44 12=100 (N=439)
September, 2000 17 17 7 48 11=100June, 2000 17 19 6 43 15=100May, 2000 22 22 6 41 9=100March, 2000 22 20 5 43 10=100October, 1999 24 22 5 39 10=100

2 In late October 1998, November 1996 and November 1994 the question was worded: “Do you yourself plan to vote in theelection this Tuesday, or not?”
-18-
IF RESPONDENT CHOSE GORE IN Q.7/8 OR Q.10/11 ASK:Q.17 What do you like LEAST about George W. Bush, his personality, his leadership ability, his experience or his stand on
issues?
Personality Leadership Experience Stand on Issues Don't knowGeorge W. Bush 25 11 15 37 12=100 (N=437)
September, 2000 20 12 11 43 14=100June, 2000 26 13 10 34 17=100May, 2000 25 13 13 35 14=100March, 2000 33 8 13 35 11=100October, 1999 19 11 13 41 16=100
ASK ALL:Q.18 Do you yourself plan to vote in the election this November?IF YES, ASK:Q.18a How certain are you that you will vote? Are you absolutely certain, fairly certain, or not certain?
Yes, Plan Absolutely Fairly Not No, Don’t Can’t Say/To Vote Certain Certain Certain Plan To Don't know
October, 2000 97 87 9 1 2 1=100September, 2000 95 84 10 1 3 2=100June, 2000 95 84 10 1 2 3=100Late October, 19982^ 91 -- -- -- 6 3=100Early October, 1998^ 92 -- -- -- 4 4=100Early September, 1998^ 95 -- -- -- 2 3=100Late August, 1998^ 93 75 17 1 3 4=100June, 1998^ 95 74 19 2 3 2=100November, 1996 96 -- -- -- 2 2=100October, 1996 98 87 10 1 1 1=100Late September, 1996 98 89 8 1 1 1=100Early September, 1996 96 83 11 2 2 2=100July, 1996 95 82 12 1 3 2=100June, 1996 96 84 11 1 2 2=100November, 1994^ 93 -- -- -- 5 2=100October, 1994^ 95 -- -- -- 3 2=100October, 1992 98 91 6 1 1 1=100September, 1992 98 85 11 2 1 1=100August, 1992 97 89 8 * 1 2=100June, 1992 97 88 8 1 1 2=100Gallup: November, 1988 97 87 9 1 2 1=100Gallup: October, 1988 98 -- -- -- 1 1=100
^ Non-Presidential elections
-19-
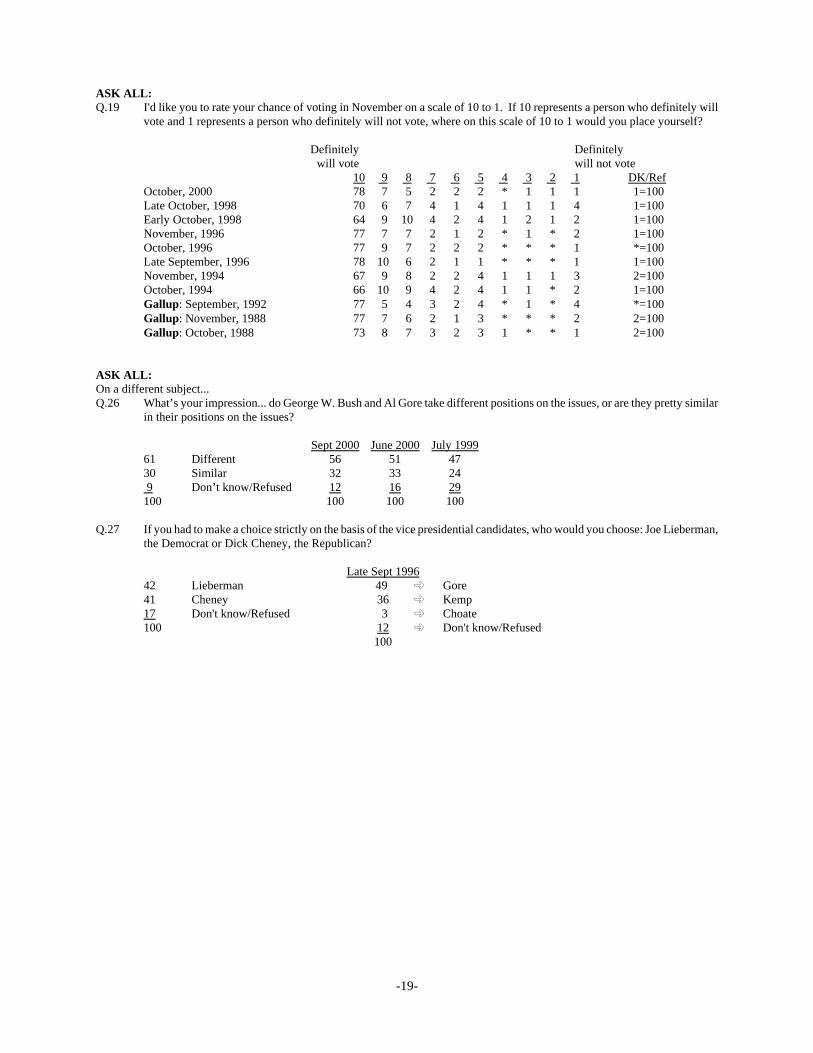
ASK ALL:Q.19 I'd like you to rate your chance of voting in November on a scale of 10 to 1. If 10 represents a person who definitely will
vote and 1 represents a person who definitely will not vote, where on this scale of 10 to 1 would you place yourself?
Definitely Definitelywill vote will not vote
10 9 8 7 6 5 4 3 2 1 DK/RefOctober, 2000 78 7 5 2 2 2 * 1 1 1 1=100Late October, 1998 70 6 7 4 1 4 1 1 1 4 1=100Early October, 1998 64 9 10 4 2 4 1 2 1 2 1=100November, 1996 77 7 7 2 1 2 * 1 * 2 1=100October, 1996 77 9 7 2 2 2 * * * 1 *=100Late September, 1996 78 10 6 2 1 1 * * * 1 1=100November, 1994 67 9 8 2 2 4 1 1 1 3 2=100October, 1994 66 10 9 4 2 4 1 1 * 2 1=100Gallup: September, 1992 77 5 4 3 2 4 * 1 * 4 *=100Gallup: November, 1988 77 7 6 2 1 3 * * * 2 2=100Gallup: October, 1988 73 8 7 3 2 3 1 * * 1 2=100
ASK ALL:On a different subject... Q.26 What’s your impression... do George W. Bush and Al Gore take different positions on the issues, or are they pretty similar
in their positions on the issues?
Sept 2000 June 2000 July 199961 Different 56 51 4730 Similar 32 33 24 9 Don’t know/Refused 12 16 29100 100 100 100
Q.27 If you had to make a choice strictly on the basis of the vice presidential candidates, who would you choose: Joe Lieberman,the Democrat or Dick Cheney, the Republican?
Late Sept 199642 Lieberman 49 ± Gore41 Cheney 36 ± Kemp17 Don't know/Refused 3 ± Choate100 12 ± Don't know/Refused
100

3 In 1996 the question compared differences between Clinton and Dole.
-20-
On another subject...ASK FORM 1 ONLY: [N=494]Q.35F1 As I read a list of phrases, tell me if you think each phrase better describes George W. Bush or Al Gore. (READ AND
ROTATE)(VOL.)
George (VOL.) BothW. Bush Al Gore Neither Equally DK/Ref.
a. Would use good judgment in a crisis 36 43 4 10 7=100September, 2000 38 44 3 8 7=100June, 2000 44 37 5 6 8=100
b. Personally likable 41 38 4 12 5=100September, 2000 37 44 3 12 4=100June, 2000 42 36 7 9 6=100
c. Honest and truthful 36 32 17 8 7=100September, 2000 35 37 13 9 6=100June, 2000 35 31 19 7 8=100
d. Cares about people like me 35 44 11 5 5=100September, 2000 31 47 9 7 6=100
e. A strong leader 41 38 7 10 4=100September, 2000 44 38 7 6 5=100
f. Can get things done 37 38 5 11 9=100September, 2000 40 40 4 8 8=100June, 2000 43 33 8 6 10=100
g. Willing to take a stand, even if it’s unpopular 43 35 8 6 8=100September, 2000 45 37 8 5 5=100June, 2000 46 32 9 5 8=100
h. Personally qualified to be president 31 49 5 11 4=100June, 2000 37 37 10 10 6=100
ASK FORM 1 ONLY: [N=494]Q.36F1 Do you think there are major differences or only minor differences between Gore and Bush when it comes to their policies
regarding... (READ AND ROTATE)
(VOL.)Major Minor Same DK/Ref.
a. The economy 55 29 5 11=100Late September, 1996 3 59 31 3 7=100
b. Foreign policy 43 31 5 21=100Late September, 1996 40 36 4 20=100
c. The role of government in solving national problems 52 26 6 16=100
d. Social Security 63 21 4 12=100
e. Education 49 32 9 10=100
f. Prescription drugs for seniors 59 24 5 12=100

-21-
Q.36F1 CONTINUED ...(VOL.)
Major Minor Same DK/Ref.g. The price of gasoline 43 31 6 20=100
h. Tax cuts 73 14 4 9=100Late September, 1996 63 25 2 10=100
ASK FORM 2 ONLY: [N=515]Q.37F2 Regardless of who you support, which one of the presidential candidates — Al Gore or George W. Bush — do you think
would do the best job of (INSERT ITEM; ROTATE. NOTE: ITEM a SHOULD ALWAYS COMES FIRST, ITEMm SHOULD ALWAYS COME LAST. IF RESPONDENT MENTIONS ANYONE OTHER THAN GORE ORBUSH PROBE ONCE: "IF YOU HAD TO CHOOSE BETWEEN GORE AND BUSH. . . " )?
George (VOL.)W. Bush Al Gore Neither DK/Ref.
a. Improving the health care system 36 49 5 10=100September, 2000 32 51 6 11=100June, 2000 31 44 6 19=100March, 2000 31 51 6 12=100
b. Making wise decisions about the country’sdefense policy 43 40 6 11=100
September, 2000 46 40 4 10=100June, 2000 42 36 6 16=100
c. Keeping Social Security and Medicare financially sound 38 46 5 11=100
September, 2000 36 49 4 11=100June, 2000 36 43 5 16=100March, 2000 35 49 5 11=100
d. Representing your views on gun control 41 35 6 18=100September, 2000 39 37 5 19=100June, 2000 37 34 5 24=100March, 2000 36 45 5 14=100
e. Representing your views about abortion 41 38 6 15=100September, 2000 34 38 7 21=100March, 2000 33 42 7 18=100
f. Keeping the economy strong 35 47 6 12=100September, 2000 38 46 5 11=100June, 2000 38 41 5 16=100March, 2000 42 46 4 8=100
g. Dealing with taxes 39 42 6 13=100September, 2000 41 41 5 13=100June, 2000 41 34 7 18=100March, 2000 40 44 5 11=100
h. Improving education 41 43 6 10=100September, 2000 39 45 4 12=100June, 2000 34 44 5 17=100March, 2000 42 44 3 11=100
i. Representing your views on America’s role in world affairs 36 44 5 15=100
September, 2000 39 44 3 14=100

4 In August 1985, question was worded: "Some people feel the U.S. should try to develop a space-based "Star Wars" systemto protect the U.S. from nuclear attack. Others oppose such an effort because they say it would be too costly and furtherescalate the arms race. Which position comes closer to your view?"
-22-
Q.37F2 CONTINUED ...George (VOL.)
W. Bush Al Gore Neither DK/Ref.j. Selecting justices to serve on the Supreme Court 37 39 4 20=100
k. Dealing with campaign finance reform 33 34 13 20=100
l. Representing your views on the role of the federal government in solving problems 41 40 6 13=100
m. Making prescription drugs more affordable for seniors 31 50 6 13=100
ASK ALL:On a another subject...Q.42 The Food and Drug Administration recently approved the abortion pill RU-486. This means that women will now be able
to terminate a pregnancy with drugs instead of surgery. Do you approve or disapprove of this decision?
43 Approve46 Disapprove11 Don’t know/Refused
100
Q.43 People have different opinions about how the Social Security system might be changed for the future. When decisionsabout Social Security’s future are being made, which do you think is MORE important... (READ; ROTATE ITEMS 1AND 2)
Keeping Social Security as a program with a GUARANTEED monthly benefit based on a54 person’s earnings during their working life?
ORLetting younger workers DECIDE for THEMSELVES how some of their own contributions to Social Securityare invested, which would cause their future benefits to be higher or lower
31 depending on how well their investments perform? 9 Both equally important (VOL.) 1 Neither is important (VOL.) 5 Don’t know/Refused100
Q.44 Some people feel the U.S. should try to develop a ground- and space-based missile defense system to protect the U.S. frommissile attack. Others oppose such an effort because they say it would be too costly and might interfere with existing armstreaties with the Russians. Which position comes closer to your view?
May Aug2000 19854
47 Should develop a ground- and space-based missile defense system 53 5735 Oppose developing such a system 37 3518 Don’t know/Refused 10 8100 100 100

5 In October 1999 the wording was: "Regardless of who you might support, who do you think is most likely to win thecoming presidential election if the candidates are Al Gore and George W. Bush?"
6 Field dates of the trend surveys are comparable to the current survey. The 1988 survey is based on the probable electorate. CBS/NYT surveys asked, "How likely is it that you will watch next/this Sunday's debate between ...?"
-23-
Q.45 In the future, do you think the U.S. and other Western powers have a moral obligation to use military force in othercountries, if necessary, to prevent one group of people from committing genocide against another, or don’t you think so?
61 Yes26 No13 Don’t know/Refused100
Now just a few more questions about the presidential election...Q.46 Regardless of who you support, who do you think WILL be elected president in November, Al Gore or George W. Bush?
June 2000 Oct 19995 Late Sept 199646 Al Gore 33 23 79 ± Clinton33 George W. Bush 51 70 12 ± Dolen/a Other (VOL.) n/a 1 1 ± Perot21 Don’t know/Refused 16 6 8100 100 100 100
Q.47 How likely is it that you will watch the upcoming presidential debates between Al Gore and George W. Bush? (READ)
Late Sept Sept ------ CBS/NYT6 ------2000 1996 1992 1988 1984
49 Very likely 43 43 67 55 5531 Somewhat likely, OR 31 34 24 27 2719 Not likely 22 22 8 17 16 1 (DON'T READ) Don't know/Refused 4 1 2 1 2100 100 100 100 100 100
Q.48 Did you happen to watch the presidential debate between Al Gore and George W. Bush (last night/this past Tuesday night),or didn’t you get a chance to see it? IF YES, ASK: How much of the debate did you watch, all of it, some of it, or onlya little?
63 Yes (NET)32 Yes, all24 Yes, some 7 Yes, a little
37 No, didn’t watch * Don’t know/Refused100

-24-
IF RESPONDENT WATCHED DEBATE (Q.48=1-3) ASK: [N=657]Q.49 Regardless of which presidential candidate you support, who do you think did the better job in the presidential debate —
George W. Bush or Al Gore?
32 Bush41 Gore22 Neither/Both (VOL.) 5 Don’t know/Refused100
Q.50 Now I want to ask you a few questions about some things that have been in the news about politics and the presidentialcampaign. Not everyone will have heard of them. As I read each item, tell me if you have heard A LOT about it,SOMETHING about it, or NEVER HEARD about it. First, how much have you heard about (READ; ROTATE)
A Some- Never DK/Lot thing Heard Ref.
a. Al Gore and George W. Bush’s separate appearances on the Oprah Winfrey show 20 39 40 1=100
b. Al Gore kissing his wife Tipper at the Democratic national convention 46 28 25 1=100
c. George W. Bush using vulgar language todescribe a New York Times reporter 32 31 36 1=100
d. Al Gore’s misstatement about the cost of prescription drugs for his mother-in-law and his pet dog 19 27 53 1=100
e. Al Gore’s criticism of the entertainment industryfor marketing violent films, music and videogames to children 32 44 23 1=100
f. Bush’s proposal to cut taxes across allincome brackets 35 44 20 1=100
g. Al Gore’s proposal to release some of theUnited States’ strategic oil reserves to makegasoline and home heating oil more affordable 42 40 17 1=100
h. Questions about how a videotape of George W.Bush rehearsing for the debates ended up withthe Gore campaign 22 29 47 2=100