presented at aapor 2008 new orleans, la may 16, 2008
DESCRIPTION
Who Needs RDD? Combining Directory Listings with Cell Phone Exchanges for an Alternative Sampling Frame. Presented at AAPOR 2008 New Orleans, LA May 16, 2008. Thomas M. Guterbock [email protected] James M. Ellis [email protected] Abdoulaye Diop [email protected] Kien Le - PowerPoint PPT PresentationTRANSCRIPT

Who Needs RDD? Combining Directory Listings with
Cell Phone Exchanges for an Alternative Sampling Frame
Who Needs RDD? Combining Directory Listings with
Cell Phone Exchanges for an Alternative Sampling Frame
Presented at
AAPOR 2008
New Orleans, LA
May 16, 2008

Center for Survey ResearchUniversity of VirginiaCenter for Survey ResearchUniversity of Virginia
2
. . . A unit of the Weldon Cooper Center for Public Service
Thomas M. Guterbock
James M. Ellis
Abdoulaye Diop
Kien [email protected]
John Lee [email protected]
CSR—University of Virginia
www.virginia.edu/surveys

Center for Survey ResearchUniversity of VirginiaCenter for Survey ResearchUniversity of Virginia
3
The Research Problem:
RDD under threat Are there good alternatives?
The Research Problem:
RDD under threat Are there good alternatives?

Center for Survey ResearchUniversity of VirginiaCenter for Survey ResearchUniversity of Virginia
4
RDD under threatRDD under threat
• Random Digit Dialing involves a certain degree of inefficiency
• Costs of this extra effort justified by completeness of coverage (at least until recently)
• Recent trends raising these costs:
– decreasing density of working numbers,
– increasing rates of non-contact,
– and rising rates of refusal
• Advent of cellular phone only households diminishes completeness of its coverage

Center for Survey ResearchUniversity of VirginiaCenter for Survey ResearchUniversity of Virginia
5
A “New Norm?” A “New Norm?”
• Dual-frame “RDD+Cell” has arisen in response to these challenges– traditional list-assisted RDD sample with RDD of
working cellphone exchanges.
• To screen or not to screen? – And, if not, how to weight?
• But other dual frames may also be worth exploring . . .

Center for Survey ResearchUniversity of VirginiaCenter for Survey ResearchUniversity of Virginia
6
Proposed Alternative: EWP+CellProposed Alternative: EWP+Cell
• EWP+Cell = – “Electronic White Pages” + Cell Phone RDD
• Promises considerably greater efficiency and cost savings over RDD+Cell – especially for specific, small geographic regions
– or areas not co-extensive with any set of telephone Area Codes.
• EWP+Cell fails to cover: unlisted landline households that have no cell phone– We will examine: How big a problem is that?

Center for Survey ResearchUniversity of VirginiaCenter for Survey ResearchUniversity of Virginia
7
Data Source:2006 National Health Interview Survey
Data Source:2006 National Health Interview Survey
permits estimations of the size of . . .the non-covered segment demographic characteristicshealth characteristicsdegree of coverage bias
Center for Survey ResearchUniversity of VirginiaCenter for Survey ResearchUniversity of Virginia
8
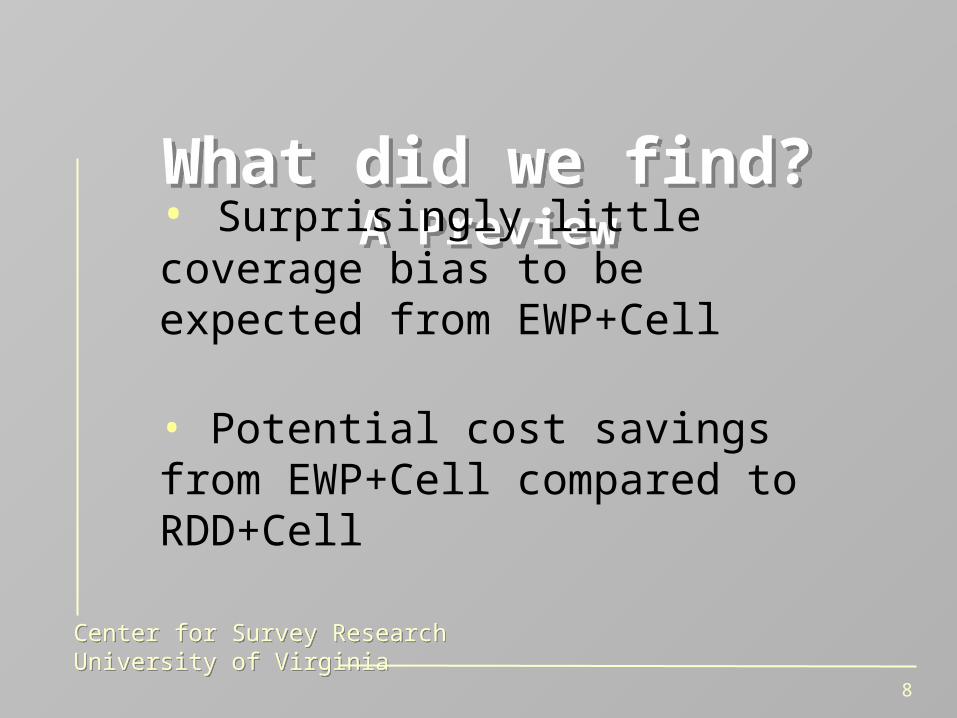
What did we find?A Preview
What did we find?A Preview
• Surprisingly little coverage bias to be expected from EWP+Cell
• Potential cost savings from EWP+Cell compared to RDD+Cell

Center for Survey ResearchUniversity of VirginiaCenter for Survey ResearchUniversity of Virginia
9
A brief review of the research A brief review of the research
• Not much literature or research compares directory-listed samples with list-assisted, landline RDD samples
• Consequently, the degree and nature of the differences between listed and unlisted households is not established.

Center for Survey ResearchUniversity of VirginiaCenter for Survey ResearchUniversity of Virginia
10
Older studies (before 2002) Older studies (before 2002)
• Most found only slight differences in substantive results between EWP and RDD frame samples
• Some efficiency gains in smaller geographic areas• Some differences in demographics noticed• And in 2007, Zogby announced plans to rely on
EWP over RDD phone samples, citing lack of substantive differences in results.

Center for Survey ResearchUniversity of VirginiaCenter for Survey ResearchUniversity of Virginia
11
Recent studies on EWP vs RDD: Substantial differences shown
Recent studies on EWP vs RDD: Substantial differences shown
Unlisted rates are higher for:•Blacks, Hispanics•Lower income•Renters•Single people
See: Guterbock, Diop and Holian (2007)

Center for Survey ResearchUniversity of VirginiaCenter for Survey ResearchUniversity of Virginia
12
From 3 segments to 5From 3 segments to 5

The universe of U.S. telephone households, 2006
The universe of U.S. telephone households, 2006

RDD samples cover all landline households, listed or not
RDD samples cover all landline households, listed or not
RDD
Cell-phone-only households
are excluded

Cell phone samples include some that are also in the RDD frame
Cell phone samples include some that are also in the RDD frame
Cell phones
Landline-only
householdsare excluded
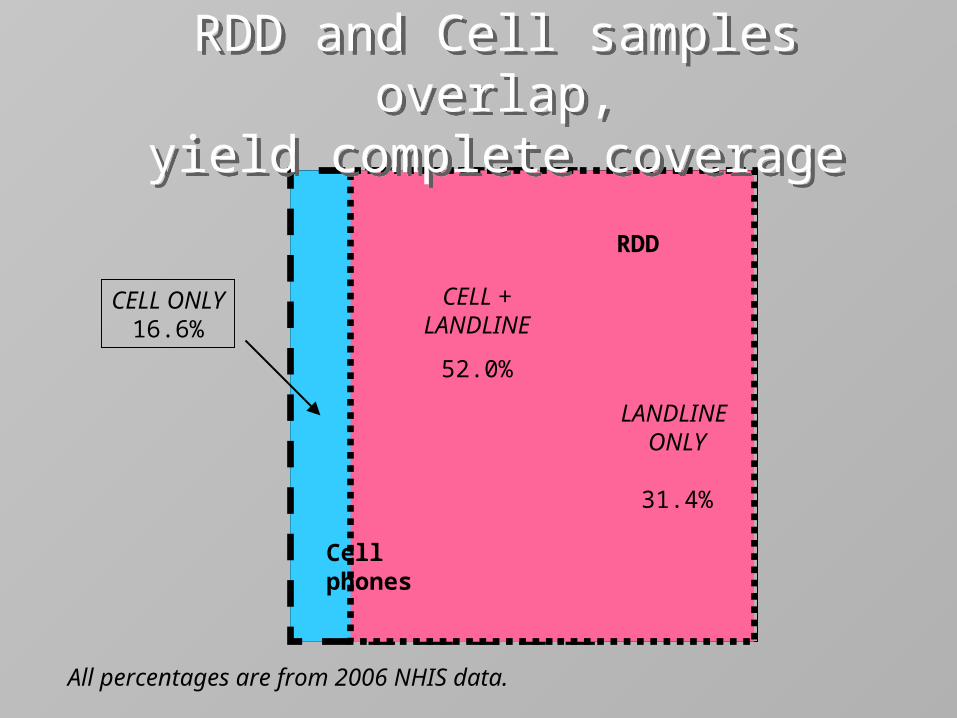
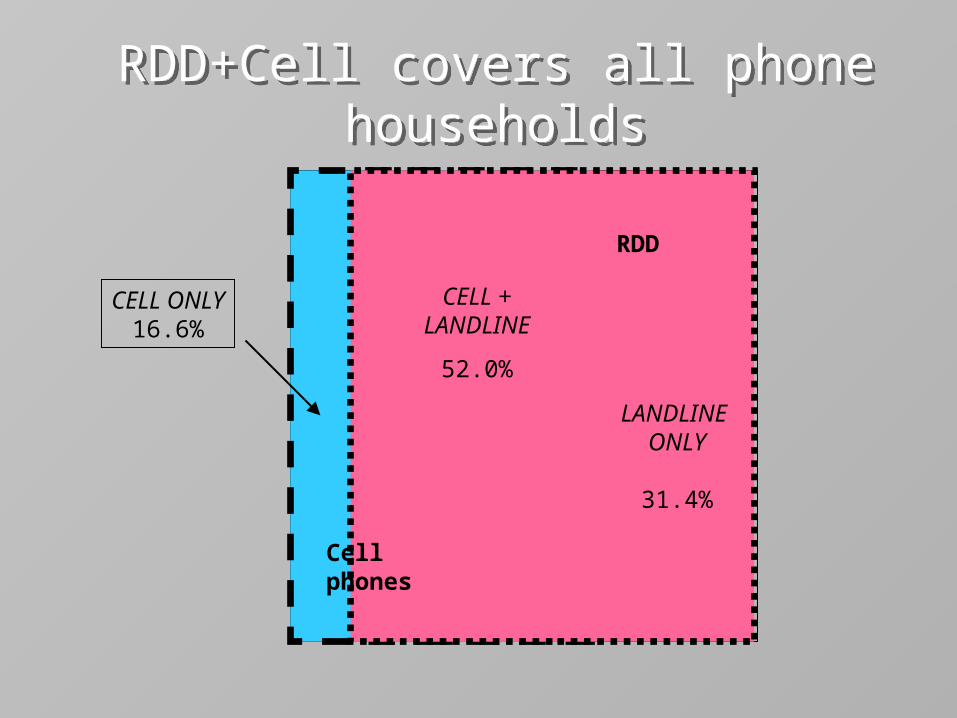
RDD and Cell samples overlap,yield complete coverage
RDD and Cell samples overlap,yield complete coverage
Cell phones
RDD
CELL ONLY16.6%
CELL + LANDLINE
52.0%
LANDLINE ONLY
31.4%
All percentages are from 2006 NHIS data.

Center for Survey ResearchUniversity of VirginiaCenter for Survey ResearchUniversity of Virginia
17
We need also to consider: listednessWe need also to consider: listedness• Some landlines are listed in the residential directory
or Electronic White Pages [EWP]– LLL = Listed Landline
• Some landline households are unlisted– ULL = unlisted landline
• LLL and ULL may or may not also have a cell phone in the household
• Cell phones are unlisted by definition• Result: five segments of the telephone universe . . .

Five telephone segmentsFive telephone segments
1CELL ONLY
16.6%
2CELL + ULL
17.7%
4CELL + LLL
34.3%
3ULL ONLY
14.2%
5LLL ONLY
17.2%
All percentages are from 2006 NHIS data. See table I
Center for Survey ResearchUniversity of VirginiaCenter for Survey ResearchUniversity of Virginia
19
Five segments differ, sometimes sharply
Five segments differ, sometimes sharply

Segments differ on key demographicsSegments differ on key demographics
1
Cell
Only
2
Cell +
ULL
3
ULL
Only
4
Cell +
LLL
5
LLL
only All
Percent African/
American13.4 14.2 15.7 8.3 10.6 11.6
Percent
18 – 25 31.1 15.7 13.6 11.0 8.0 15.0
All percentages are from 2006 NHIS data. See table II

Segments differ on key health questionsSegments differ on key health questions
1
Cell
Only
2
Cell +
ULL
3
ULL
Only
4
Cell +
LLL
5
LLL
only All
Smokers(yes) 27.1 18.9 22.1 17.6 20.6 20.5
Diabetes(yes) 4.5 6.7 9.4 7.8 11.5 7.9
All percentages are from 2006 NHIS data. See table II

Our analysis deals withthree sampling frames:Our analysis deals withthree sampling frames:
1) EWP
2) List-assisted (landline) RDD
3) Cell phone RDD

We examine 4 sampling designs:We examine 4 sampling designs:
• 2 Single frame designs:– EWP only– Landline RDD

Center for Survey ResearchUniversity of VirginiaCenter for Survey ResearchUniversity of Virginia
We examine 4 sampling designsWe examine 4 sampling designs
• 2 Dual Frame designs:– EWP+Cell– RDD+Cell

Center for Survey ResearchUniversity of VirginiaCenter for Survey ResearchUniversity of Virginia
25
Three design contrastsThree design contrasts
RDD+Cell is the base for all comparisons– It includes the full universe of phone HH
We will compute coverage bias for each contrast:
• EWP vs. RDD+Cell
• RDD vs. RDD+Cell
• EWP+Cell vs. RDD+Cell

Center for Survey ResearchUniversity of VirginiaCenter for Survey ResearchUniversity of Virginia
26
Formula for coverage biasFormula for coverage bias
Ῡ = mean for full population
ῩC = mean for covered cases
ῩU = mean for cases not coveredU = cases not coveredN = all cases
)( UCC YYNUYY

Center for Survey ResearchUniversity of VirginiaCenter for Survey ResearchUniversity of Virginia
27
Contrast I: EWP vs. RDD+Cell
telephone samples
Contrast I: EWP vs. RDD+Cell
telephone samples

The universe of U.S. telephone householdsThe universe of U.S. telephone households
Ῡ

EWP sample excludes unlisted landline and cell-only
EWP sample excludes unlisted landline and cell-only
2EXCLUDEDCELL + ULL
17.7%
4CELL + LLL
34.3%
3EXCLUDEDULL ONLY
14.2%
5LLL ONLY
17.2%
EWP
All listed landline phones
ῩC
ῩU
U/N = .485
1EXCLUDEDCELL ONLY
16.6%

Coverage bias table:EWP vs. RDD+CellCoverage bias table:EWP vs. RDD+Cell
U/N ῩC ῩU ῩC -ῩU Ῡ ῩC -Ῡ
Percent African/
American48.5 9.1 14.4 -5.3 11.7 -2.6
Percent
18 - 25 48.5 10.0 20.4 -10.4 15.0 -5.0
All percentages are from 2006 NHIS data. See table IV
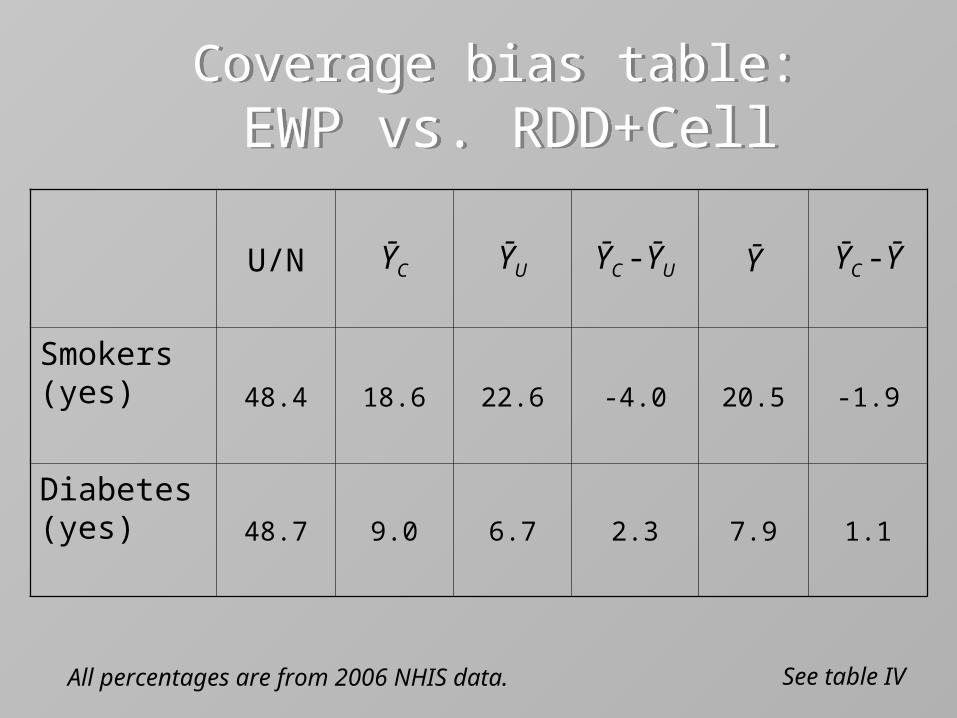
Coverage bias table: EWP vs. RDD+CellCoverage bias table:
EWP vs. RDD+Cell
U/N ῩC ῩU ῩC -ῩU Ῡ ῩC -Ῡ
Smokers(yes) 48.4 18.6 22.6 -4.0 20.5 -1.9
Diabetes (yes) 48.7 9.0 6.7 2.3 7.9 1.1
All percentages are from 2006 NHIS data. See table IV

Center for Survey ResearchUniversity of VirginiaCenter for Survey ResearchUniversity of Virginia
32
Contrast II: RDD
vs. RDD+Cell only telephone samples
Contrast II: RDD
vs. RDD+Cell only telephone samples

RDD samples cover all landline households, listed or not
RDD samples cover all landline households, listed or not
RDD
ῩC
ῩU

RDD fails to cover 16.6%RDD fails to cover 16.6%
Cell phones
RDD
CELL ONLY16.6%
CELL + LANDLINE
52.0%
LANDLINE ONLY
31.4%
All percentages are from 2006 NHIS data.
U/N = .166

Coverage bias table:RDD vs. RDD+CellCoverage bias table:RDD vs. RDD+Cell
U/N ῩC ῩU ῩC -ῩU Ῡ ῩC -Ῡ
Percent African/
American16.6 11.3 13.4 -2.1 11.7 -0.4
Percent
18 - 25 16.6 11.8 31.1 -19.3 15.0 -3.2
All percentages are from 2006 NHIS data. See table V

Coverage bias table:RDD vs. RDD+CellCoverage bias table:RDD vs. RDD+Cell
U/N ῩC ῩU ῩC -ῩU Ῡ ῩC -Ῡ
Smokers(yes) 16.5 19.3 27.1 -7.8 20.6 -1.3
Diabetes (yes) 16.7 8.6 4.5 4.1 7.9 0.7
All percentages are from 2006 NHIS data. See table V

Center for Survey ResearchUniversity of VirginiaCenter for Survey ResearchUniversity of Virginia
37
Contrast III: EWP+Cell
vs. RDD+Cell
telephone samples
Contrast III: EWP+Cell
vs. RDD+Cell
telephone samples
RDD+Cell covers all phone householdsRDD+Cell covers all phone households
Cell phones
RDD
CELL ONLY16.6%
CELL + LANDLINE
52.0%
LANDLINE ONLY
31.4%
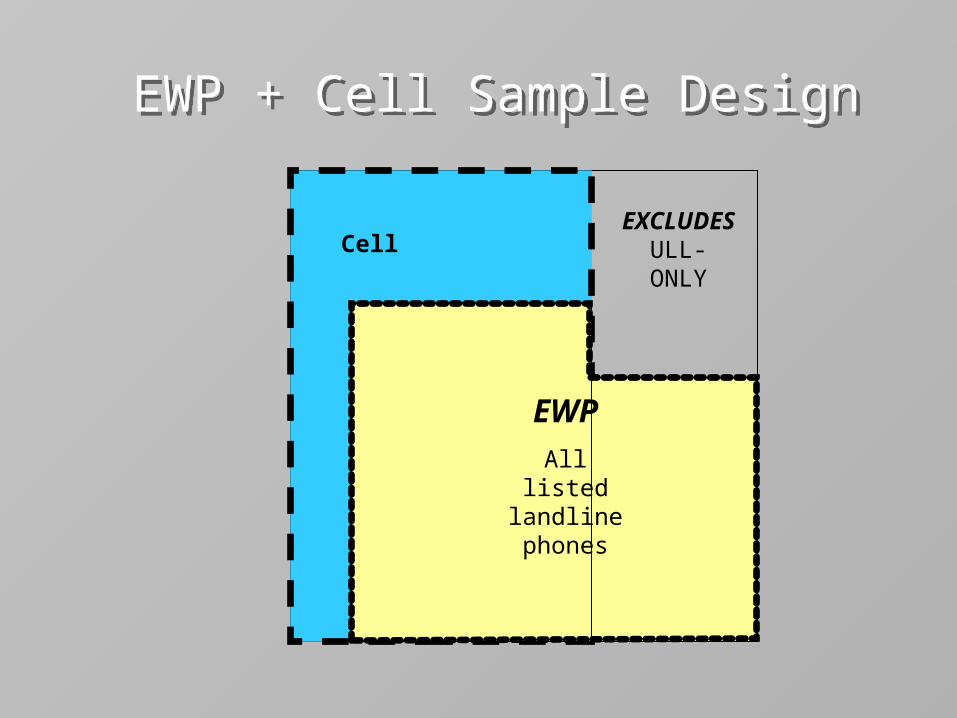
EWP + Cell Sample DesignEWP + Cell Sample Design
EXCLUDESULL-
ONLY
Cell
EWP
All listed landline phones

EWP + Cell excludes ULL-only households
EWP + Cell excludes ULL-only households
1CELL ONLY
16.6%
2CELL + ULL
17.7%
4CELL + LLL
34.3%
EXCLUDED:3
ULL ONLY14.2%
5LLL ONLY
17.2%
ῩU
Ῡ
C
U/N = .142
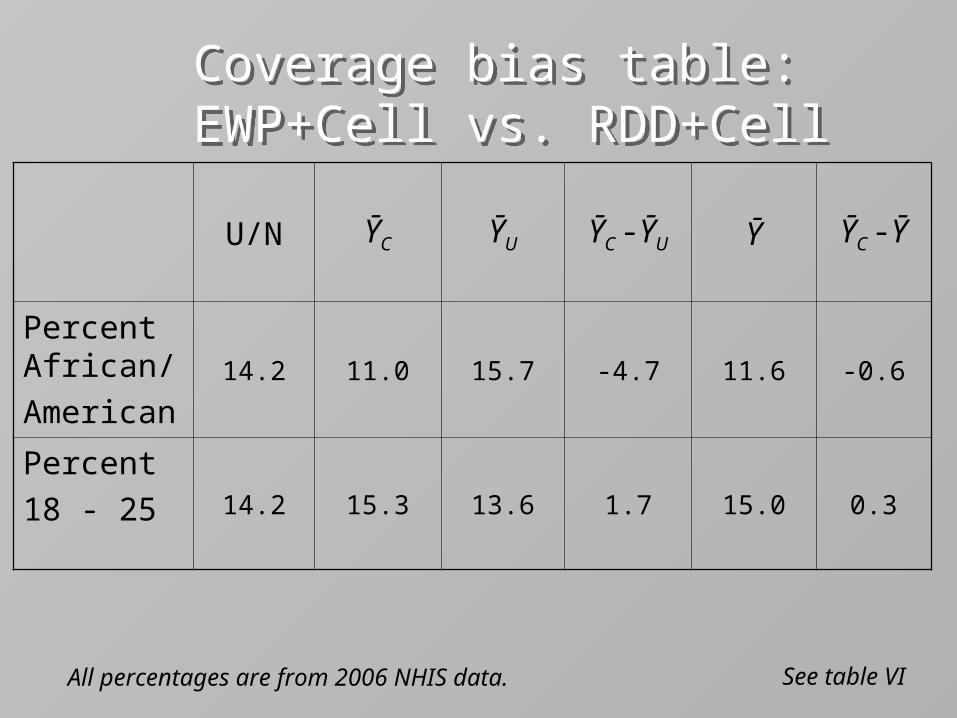
Coverage bias table: EWP+Cell vs. RDD+Cell
Coverage bias table: EWP+Cell vs. RDD+Cell
U/N ῩC ῩU ῩC -ῩU Ῡ ῩC -Ῡ
Percent African/
American14.2 11.0 15.7 -4.7 11.6 -0.6
Percent
18 - 25 14.2 15.3 13.6 1.7 15.0 0.3
All percentages are from 2006 NHIS data. See table VI

Coverage bias table: EWP+Cell vs. RDD+Cell
Coverage bias table: EWP+Cell vs. RDD+Cell
U/N ῩC ῩU ῩC -ῩU Ῡ ῩC -Ῡ
Smokers(yes)
14.2 20.3 22.1 -1.8 20.5 -0.2
Diabetes(yes) 14.2 7.7 9.4 -1.7 7.9 -0.2
All percentages are from 2006 NHIS data. See table VI

Center for Survey ResearchUniversity of VirginiaCenter for Survey ResearchUniversity of Virginia
43
Summary of 3 contrastsSummary of 3 contrasts

3 contrasts: 2006 estimates (ῩC )3 contrasts: 2006 estimates (ῩC )
Variables RDD+Cell EWP RDD EWP+Cell
Demographics
African American 11.6% 9.1% 11.3% 11.0%
18-25 15.0% 10.0% 11.8% 15.3%
Health Related Questions
Smokers (yes) 20.5% 18.6% 19.3% 20.3%
Diabetes (yes) 7.9% 9.0% 8.6% 7.7%
See table VII

3 contrasts: 2006 raw bias (ῩC -Ῡ )3 contrasts: 2006 raw bias (ῩC -Ῡ )
Variables RDD+Cell EWP RDD EWP+Cell
Demographics
African American -- -2.5% -0.3% -0.6%
18-25 -- -5.0% -3.2% 0.3%
Health Related Questions
Smokers (yes) -- -1.9% -1.2% -0.2%
Diabetes (yes) -- 1.1% 0.7% -0.2%
See table VIII
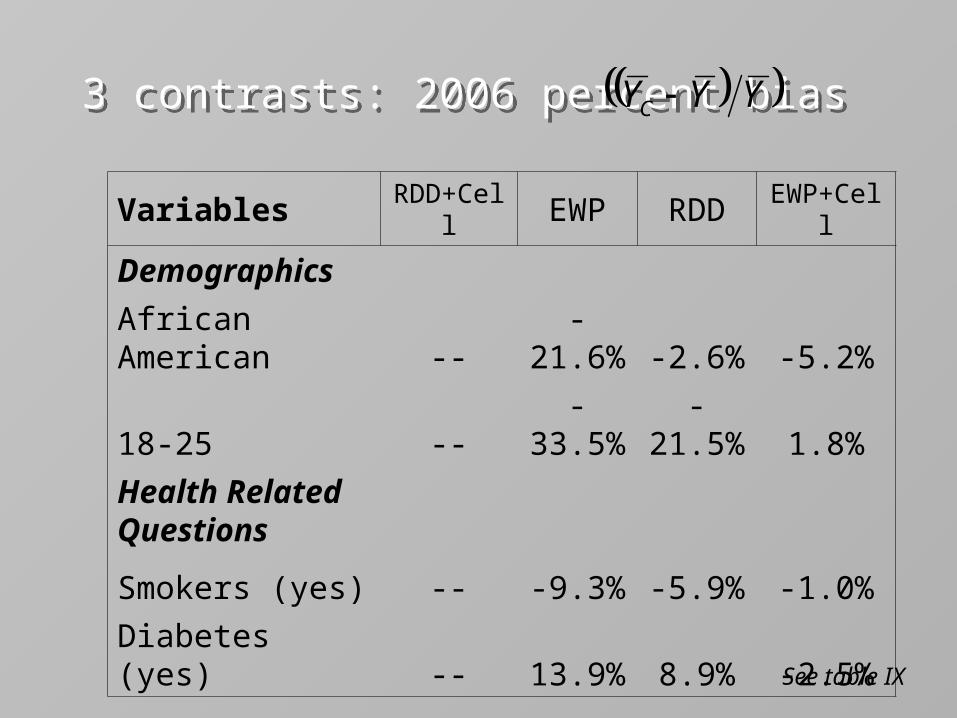
3 contrasts: 2006 percent bias 3 contrasts: 2006 percent bias
Variables RDD+Cell EWP RDD EWP+Cell
Demographics
African American -- -21.6% -2.6% -5.2%
18-25 -- -33.5% -21.5% 1.8%
Health Related Questions
Smokers (yes) -- -9.3% -5.9% -1.0%
Diabetes (yes) -- 13.9% 8.9% -2.5%
See table IX
YYYC

Center for Survey ResearchUniversity of VirginiaCenter for Survey ResearchUniversity of Virginia
Changes in CoverageNHIS 2003 - 2006
Changes in CoverageNHIS 2003 - 2006

Center for Survey ResearchUniversity of VirginiaCenter for Survey ResearchUniversity of Virginia
48
Changes in telephone status over time
Changes in telephone status over time
NHIS data 2003-2006
16.6
12.6
9.1
7.1
14.215.1
16.516.7
0.0
2.0
4.0
6.0
8.0
10.0
12.0
14.0
16.0
18.0
2003 2004 2005 2006
year
per
cen
tunlisted landline only
cell phone only

49
Changes in percent bias over time: RDD vs. RDD+Cell (NHIS data)
Changes in percent bias over time: RDD vs. RDD+Cell (NHIS data)
GRAPH 2: RDD vs RDD+Cell: 2003-2006
-3.4%
-0.9%0.0%
-21.3%
-17.7%
0.6%0.3%-0.3%
-19.7%
-16.5%
-11.2%-9.7%
-8.1%
-5.1%
-3.3%
-7.6%-7.4%
-25.0%
-20.0%
-15.0%
-10.0%
-5.0%
0.0%
5.0%
2003 2004 2005 2006
Year
African American
18-25
HS or Less
Renter
Less than $20,000

Changes in percent bias over time: EWP+Cell vs. RDD+Cell (NHIS data)
Changes in percent bias over time: EWP+Cell vs. RDD+Cell (NHIS data)
GRAPH 3: EWP+Cell vs RDD+Cell: 2003-2005
-9.1%
2.0%0.7%
-4.8%
-7.3%
-9.5%
-5.8%
-11.2%-11.7%-10.3%
-12.7%-14.1%-13.7%
-5.2%
-9.2%
-9.4%
-25.0%
-20.0%
-15.0%
-10.0%
-5.0%
0.0%
5.0%
2003 2004 2005 2006
Year
African American
18-25
HS or Less
Renter
Less than $20,000

Changes in percent bias over time: RDD vs. RDD+Cell (NHIS data)
Changes in percent bias over time: RDD vs. RDD+Cell (NHIS data)
RDD vs RDD+Cell: 2003-2006
-6.3%-5.8%
-3.9%
-2.8%
8.9%
6.6%
5.6%
1.5%
7.4%
5.8%
3.5%3.2%
-1.8%-1.9%
0.0%
-1.0%
-8.0%
-6.0%
-4.0%
-2.0%
0.0%
2.0%
4.0%
6.0%
8.0%
10.0%
2003 2004 2005 2006
Year
Smokers (yes)
Diabetes (yes)
Hypertension (yes)
Asthma (yes)

52
Changes in percent bias over time: EWP+Cell vs. RDD+Cell (NHIS data)
Changes in percent bias over time: EWP+Cell vs. RDD+Cell (NHIS data)
EWP+Cell vs RDD+Cell: 2003-2005
-1.0%
-1.9%-2.4%
-1.9%-2.5%-2.6%
-4.2%
0.0%
-1.1%-1.2%
0.8%1.6% 1.8%
0.0%
1.0%1.0%
-8.0%
-6.0%
-4.0%
-2.0%
0.0%
2.0%
4.0%
6.0%
8.0%
10.0%
2003 2004 2005 2006
Year
Smokers (yes)
Diabetes (yes)
Hypertension (yes)
Asthma (yes)

Center for Survey ResearchUniversity of VirginiaCenter for Survey ResearchUniversity of Virginia
Cost comparisonsCost comparisons

Cost comparisonsCost comparisonsA B C
Traditional Design "New Norm" Proposed
RDD only RDD + Cell EWP + Cell
RDD RDD Cell EWP Cell
target N 1000 800 200 800 200
per hour cost $32 $32 $32 $32 $32
CPH* 1.1 1.1 0.55 1.4 0.55
*CPH= completions per hour

Cost comparisons(data collection only)
Cost comparisons(data collection only)
A B C
Traditional Design "New Norm" Proposed
RDD only RDD + Cell EWP + Cell
RDD RDD Cell EWP Cell
target N 1000 800 200 800 200
cost $29,091 $23,273 $11,636 $18,286 $11,636
Total $29,091 $34,909 $29,922
Center for Survey ResearchUniversity of VirginiaCenter for Survey ResearchUniversity of Virginia
56
ConclusionsConclusions
• EWP+Cell omits ULL–onlies, but: – These aren’t particularly untypical– They are not numerous– Their numbers are declining
• EWP+Cell includes unlisteds (who have cell phones) thus avoiding some bias from EWP
• EWP+Cell includes cell–onlies, offsetting bias from omitting unlisted HH
– Unlisted are somewhat similar to the cell–onlies.

Center for Survey ResearchUniversity of VirginiaCenter for Survey ResearchUniversity of Virginia
57
ConclusionsConclusions
• We propose EWP+Cell as a cost effective sampling solution that appears to offer good coverage across age, race, most demographics, and key health indicators
• It offers a significant cost advantage over the ‘new norm’ (RDD+Cell), especially if:– geographic area to be studied is small
– target population is hard to find (requiring screener calls)

Center for Survey ResearchUniversity of VirginiaCenter for Survey ResearchUniversity of Virginia
58
Cautions & caveatsCautions & caveats
• We have not offered a direct, experimental field test of EWP+Cell sampling in contrast with RDD+Cell– But we have several such experiments planned in our
2008 local surveys• Nobody knows the proper weights for combining
the two sample frames– but these are also unknown for local studies that use
“the new norm” –RDD+Cell• 2008 phone segments could differ from 2006 more
than we think

Center for Survey ResearchUniversity of VirginiaCenter for Survey ResearchUniversity of Virginia
59
More cautions . . .More cautions . . .
• Our analysis assumes that non-response and measurement errors are the same in realized samples from each telephone segment– That is, we have considered coverage error only
• Even if the proportion of excluded cases (ULL-onlies) is declining, coverage error may not decrease, because:
as changes, so can .N
U UC YY

Center for Survey ResearchUniversity of VirginiaCenter for Survey ResearchUniversity of Virginia
60
Planned testsPlanned tests• We are currently conducting a county-wide citizen
survey in Prince William County, VA, that features– A 10% cell phone component (unscreened)
– The balance of completions split:
• 45% RDD sample
• 45% EWP sample
• We will be able to compare directly:– EWP+Cell vs. RDD+Cell
– Coverage bias, productivity, and costs

Who Needs RDD? Combining Directory Listings with
Cell Phone Exchanges for an Alternative Sampling Frame
Who Needs RDD? Combining Directory Listings with
Cell Phone Exchanges for an Alternative Sampling Frame
Presented at
AAPOR 2008
New Orleans, LA
May 16, 2008
e-mail: [email protected]