presentation to standard & poors - guam power...
TRANSCRIPT

1
Presentation to Standard & Poors
Guam Power AuthorityJune 6, 2007

2
AgendaBoard GovernanceManagement UpdateFinancial ConditionOperations UpdateCapital Improvement ProjectsOutlookConclusion

3
Board Governance

4
Consolidated Commission on Utilities
From Left to Right:
Eloy P. Hara, Treasurer and CCU Chairman for the Committee on Customer Relations
Tom C. Ada, Resigned
Gloria B. Nelson, Secretary and Chairwoman for the CCU Committee for Employee Development and Relations
Simon A. Sanchez, II, Chairman
Benigno M. Palomo, Vice Chairman – Guam Power Authority and CCU Chairman for the Committee on Social Welfare

5
Governance Goals
Prudent Fuel Use Reduction of Unaccounted for EnergyCompensation StudyRight-SourcingRight-SizingRight-HiringQuality Processes
6
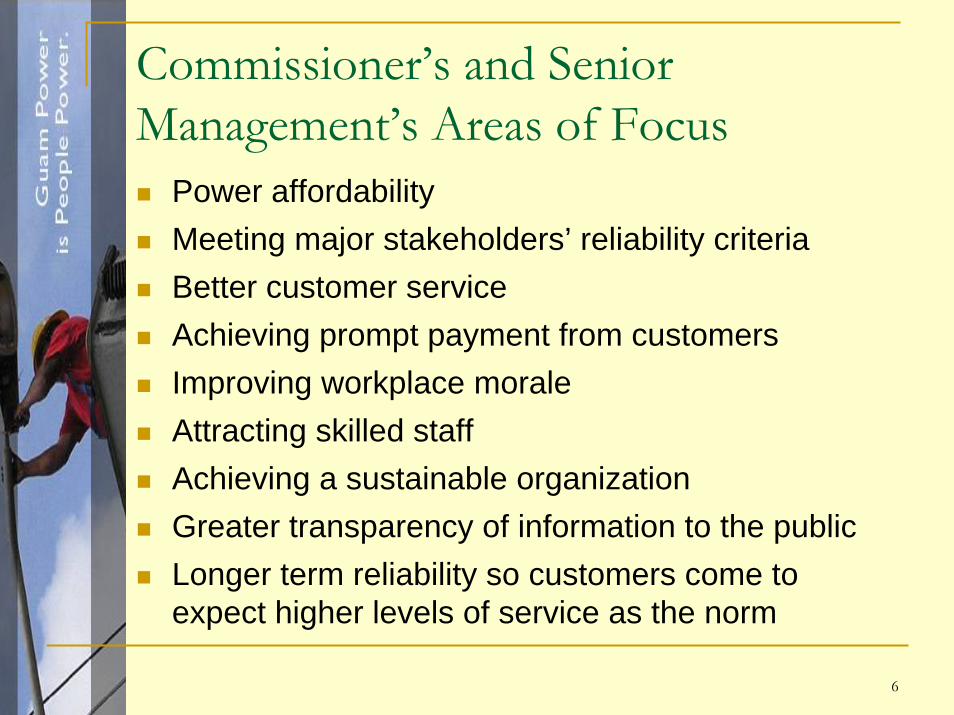
Commissioner’s and Senior Management’s Areas of Focus
Power affordabilityMeeting major stakeholders’ reliability criteriaBetter customer serviceAchieving prompt payment from customersImproving workplace moraleAttracting skilled staffAchieving a sustainable organizationGreater transparency of information to the publicLonger term reliability so customers come to expect higher levels of service as the norm

7
Management

8
Professional Executive Management

9
Management Priorities
Institutionalized planning processes;Sound financial and operating policies;A deep and experienced executive team;A solid grasp of industry issues that extends beyond the local utility;Extensive knowledge of customers and their needs;A proactive and farsighted management approach that has the support of an informed board.

10
Financial Condition

11
GPA Revenue BaseGPA Customer Accounts Number by Class
As of Fiscal Year 2006
Residential, 37,709
Department of Defense, 1
Others, 1,087
Large Commercial ,
223
Small Commercial ,
5,709

12
GPA Revenue BaseGPA Revenues ($000) by Customer Class
As of Fiscal Year 2006
Large Commercial, 79,365 , 27%
Small Commercial, 74,489 , 26%
Residential, 79,563 , 28%
Department of Defense, 50,422 , 17%
Others, 4,986 , 2%

13
Flat Base Rate Revenues
26,061 21,040 21,820 23,782 24,548 24,669
18,08816,454 17,942 16,840 17,172 18,197
33,09731,508
34,302 35,063 33,235 35,096
54,077
49,473
55,979 56,965 56,44857,435
$0
$20,000
$40,000
$60,000
$80,000
$100,000
$120,000
$140,000
$160,000
2002 2003 2004 2005 2006 2007Fiscal Year
Base
Rat
e R
even
ues
($00
0)
Govt Navy Res CommAM
OU
NT $

14
O&M Expenses
$ (000)
24,599 24,906 26,690 28,427 28,198 31,926
26,752 23,934 28,775 27,098 27,918 26,900
74,820 79,14088,045
111,178
162,721175,752
$0
$50,000
$100,000
$150,000
$200,000
$250,000
2002 2003 2004 2005 2006 2007Fiscal Year
Ope
ratio
ns &
Mai
nten
ance
Spe
ndin
g ($
000) LABOR NON-LABOR FUEL
Revised Budget

15
Debt Service Coverage FY07 FY08
Debt Service Coverage CalculationEarnings From Operations 37,544,539 25,956,601 Add: Depreciation 26,036,273 26,463,307 Balance Available for Debt Service 63,580,812 52,419,908 Debt ServiceBond Interest Expense 20,711,453 20,400,763 Bond Principal 6,770,000 7,080,000 Total Debt Service 27,481,453 27,480,763
Debt Service Coverage (According to Bond Covenant) 2.31 1.91 Debt Service Coverage w/o IPP Acctg change 1.82 1.07

16
Debt service coverage ratio(S&P and Bond Covenant Methods)
1.271.42
1.08
1.431.27
2.27
2.11
2.26
2.11
1.92
0.00
0.25
0.50
0.75
1.00
1.25
1.50
1.75
2.00
2.25
2.50
FY2002 FY2003 FY2004 FY2005 FY2006
Fiscal Year
Deb
t-Ser
vice
Rat
io
S&P Method Bond Covenant Method
Bond Target - 1.3
PUC Target - 1.75

17
Accounts Payable Aging
-
5,000,000
10,000,000
15,000,000
20,000,000
25,000,000
30,000,000
FY 2002 FY 2003 FY 2004 FY 2005 FY 2006
0-30 Days 31-60 Days 61-90 Days 91-120 Days Over 120 Days
$11.2m
$17.3m
$14.7m
$10.8m
$27.0m

18
Accounts Receivable Aging
-2,000,0004,000,0006,000,0008,000,000
10,000,00012,000,00014,000,00016,000,000
FY 2001 FY 2002 FY 2003 FY 2004 FY 2005 FY 2006
0-30 Days 31-60 Days 61-90 Days 91-120 Days Over 120 Days
$8.0m$9.0m $10.2m
$10.7m$13.9m $14.0m

19
Government ReceivablesGovGuam Receivable Buildup
$-
$10,000,000
$20,000,000
$30,000,000
$40,000,000
$50,000,000
$60,000,000
Sep-96
Sep-97
Sep-98
Sep-99
Sep-00
Sep-01
Sep-02
Jan-03

20
Government ReceivablesGov't Rec'bles Trending Downward
-5,000,000
10,000,00015,000,00020,000,00025,000,00030,000,00035,000,00040,000,00045,000,00050,000,000
2003 2004 2005 2006 2007
GWAGPSSGMHDPW

21
Other Financial RatiosFINANCIAL RATIOS Targets 2002 2003 2004 2005 2006
Current Ratios > 2.6 2.9 2.37 2.55 2.61 2.1
Internal Funds to Debt Service > 2.25 1.24 0.82 1.11 1.27 1.18
Debt to Equity < 1.6 2.3 2.46 2.58 2.54 2.53
Gross Margin > 18.00% 19.69% 15.65% 15.46% 15.99% 12.91%
Operating Margin > 10.00% -1.74% -12.41% -4.20% -0.32% -1.30%
Return on Assets > 4.3% / 2.5% 0.44% -2.99% -1.18% -0.10% -0.49%
Operating Return on Net Fixed Assets > 8.00% 11.19% 9.63% 10.78% 11.79% 11.30%
Return on Net Fixed Assets > 6.50% 0.63% -4.26% -1.66% -0.15% -0.69%
Internal Funds to Capital Expenditure > 1.7 3.1 -0.01 2.72 1.21 0.99
Depreciation Expense to Gross Fixed Assets > 2.90% 3.24% 3.14% 3.16% 3.15% 3.00%
Percent Depreciated Plants < 32.50% 25.64% 28.11% 30.68% 32.53% 34.00%
Inventory Turnover > 10 4.21 3.61 4.72 4.5 4.99
Tier > 2.2 0.83 0.43 0.78 0.98 0.91

22
FINANCIAL RATIOS Targets 2002 2003 2004 2005 2006
Equity Capitalization > 50.00% 30.31% 28.86% 0.28% 28.25% 28.29%
Debt to Net Fixed Assets < 60.00% 68.33% 69.61% 70.12% 69.73% 68.96%
Internal Funds to Interest > 3.00% 1.92% 1.00% 1.37% 1.60% 1.51%
LTD Capitalization < 50.00% 69.69% 71.14% 72.09% 71.75% 71.71%
Fixed Asset Turnover > 55.00% 36.00% 34.00% 41.00% 45.00% 53.00%
Gross Margin Excluding Depreciation > 27.50% 31.14% 28.02% 26.18% 26.02% 21.15%
Operating Margin Excluding Interest & Depreciation > 30.00% 29.71% 21.18% 24.47% 25.71% 20.22%
Return on Equity > 8.00% -2.11% -15.10% -6.10% -0.53% -2.55%
Depreciation Expense to Total Assets > 3.00% 2.91% 2.98% 3.15% 3.27% 3.11%
Depreciation Expense to Capital Expenditures > 0.85 3.66 4.08 4.36 1.25 1.18
Internal Funds to Debt Service (With Interest Income) > 1.3 2.38 1.99 2.18 2.36 2.27
Debt Service Ratio (Excluding Interest Income) > 1.3 2.19 1.89 2.08 2.23 2.11
Other Financial Ratios (continued)

23
Working Capital Fund ($000)$17,984
$11,669
$2,291
$-
$2,000
$4,000
$6,000
$8,000
$10,000
$12,000
$14,000
$16,000
$18,000
$20,000
Oct-05
Nov-05
Dec-05
Jan-06
Feb-06
Mar-06
Apr-06
May-06
Jun-06
Jul-06
Aug-06
Sep-06
Oct-06
Nov-06
Dec-06
Jan-07
Feb-07
Mar-07
Apr-07
Month-Year
Wor
king
Cap
ital F
und
Bal
ance
($00
0)

24
GPA’s Proposed Petition
19.72% base rate revenue increase (average impact of 6.22% for residential power bill based on 1000 kwh consumption)Base rate increase of $26.9 millionDouble the insurance surcharge and increase the cap to $25 millionImplement a $5 per transaction credit card surcharge for residential customers

25
Operations

26
Energy Production from Baseloads

27
SafetyAPPA / NSC
Incident Rates
4.42
3.41
1.5
2.19
3.173.733.67
00.5
11.5
22.5
3
3.54
4.55
2000 2001 2002 2003 2004 2005 2006
APPA Incident Rates

28
Demand Forecast
250
275
300
325
350
375
400
1999 2000 2001 2002 2003 2004 2005 2006 2007 2008 2009 2010 2011 2012 2013 2014 2015 2016 2017 2018 2019 2020 2021 2022 2023 2024 2025 2026
Fiscal Year
MW
2007 - 275 MW
2016 - 348 MW
2011 - 331 MW
2008 - 298 MW

29
Demand Forecast (continued)
250
300
350
400
450
500
550
600
1998
2000
2002
2004
2006
2008
2010
2012
2014
2016
2018
2020
2022
2024
2026
2028
2030
2032
2034
MW
Actual High Tourism/High InfrastructureHigh Tourism /Low Infrastructure Low Tourism/High InfrastructureBaseline
Installed Capacity by
1 Day in 4.5 Year Reserve
H/H Grow th Rate: 2.28% (2006-2016)3.13% (2006-2012)5.65% (2010-2011)
Tw o Largest Units Capacity Resrve Curve

30
Capital Improvement Projects

31
Northern Underground Projects Linking The Macheche CT And Tanguisson Power Plants

32
Capital Improvement Projects5-Year Plan
SUMMARY BY PROJECT TYPE
Generation Projects $13 million
FEMA UG Projects $27 million
Studies/Other Improvements $403 million
Grand Total $477 million
Substation Projects $11 million
Transmission & Distribution Projects $23 million
• Projects will straddle multiple fiscal years • Projects will commence within the next 5 years but may extend beyond
this time frame• Projects are reviewed each fiscal year and priorities are adjusted as
necessary

33
GENERATIONCapital Improvement Projects
FY ’08 – FY ’12 (x $1,000)Fire Protection - Insurance Mitigation 4,198Cabras 1 & 2 Projects 3,875Cabras 3 & 4 Projects 2,550
Agana Power Plant Asbestos Removal/New WSD Facility 200TOTAL ESTIMATE 12,823
USN 8" Above Ground Pipeline Upgrade 600Underground Fuel Pipeline 1,400

34
FEMACapital Improvement Projects
FEMA Funding: $17,000,000
GPA Cost: $ 10,000,000
FEMA PROJECTSHarmon to Tumon 34. 5 kV Underground Conversion
Tamuning Tumon 34.5 Underground Conversion
San Vitores to Macheche 34.5 kV Underground Conversion
Harmon to Tanguisson 34.5 kV Underground Conversion
Macheche to GAA 34.5 kV Underground Conversion
Agana to Tamuning and P202 Underground Conversion
P401 Underground Conversion to Memorial Hospital - Completed
P003 Underground Conversion to Cabras-Completed
Umatac Substation Drainage Modification -Completed

35
SUBSTATIONSCapital Improvement Projects
FY ’08 – FY ’12 (x $1,000)System Stability/Relay Coordination 1,190
Pulantat Substation Grounding Transformer 200
Hagatna 34.5 kV Protection Refurbishment and Upgrade 1,124
Hagatna 115 kV Protection Refurbishment and Upgrade 710Hagatna 115 kV and 34.5 kV Breaker Replacement 872
Andersen Substation Control System Reconstruction 1,340
Hagatna-Tamuning Protection System Upgrade 629
Orote Substation Control System Reconstruction 1,410
Piti-Anigua-Hagatna Protection System Upgrade 750
Tumon Substation Fence 280
Harmon Substation Switchyard Reconstruction 1,000Talofofo Substation 30 MVA Upgrade 933Tamuning-Tumon Protection System Upgrade 359
TOTAL ESTIMATE 10,797

36
TRANSMISSION & DISTRIBUTIONCapital Improvement Projects
FY ’08 – FY ’12 (x $1,000)
34.5 kV Transmission Line Along Rt. 2A 860
Marbo to Pagat 34.5 KV Line 3,534
Harmon to GIAT 34.5 kV Line Reconductoring 403
Harmon to Yigo 34.5 KV Line Reconductoring 1,840Agana to Radio Barrigada Reconductoring 700
San Vitores to Agana 34.5 KV Line 841Substation and Distribution Capacitor Program 450
Village Distribution Upgrades 6,125
Distribution System Improvements 300P-27 U/G Reconstruction 540P-330 Hardening and Reconductoring 160
Tumon Bay Lateral Conversion 925P003 Underground Extension to Port Authority 2,894U/G Reconstruction - Sinajana, Latte Heights, Yona 3,775
TOTAL ESTIMATE 23,347

37
STUDIES/OTHER IMPROVEMENTSSTUDIES/OTHER IMPROVEMENTS
FY ’08 – FY ’12 (x $1,000)Long Range Transmission Planning (Study) 135Integrated Resource Plan (Study) 450Guam Sea Water Air Conditioning (GSWAC) –
(Design & Construction) 100,000T&D Asset Assessment & Mapping 100System Stability/Relay Coordination 1200Distribution System Medium Range Planning &
Performance Analysis 600Load Research and Cost of Service Studies 55060MW Baseload Design & Construction (Pending
Completion of IRP and Military Buildup Input) 300,000TOTAL ESTIMATE 403,035

38
Outlook
39
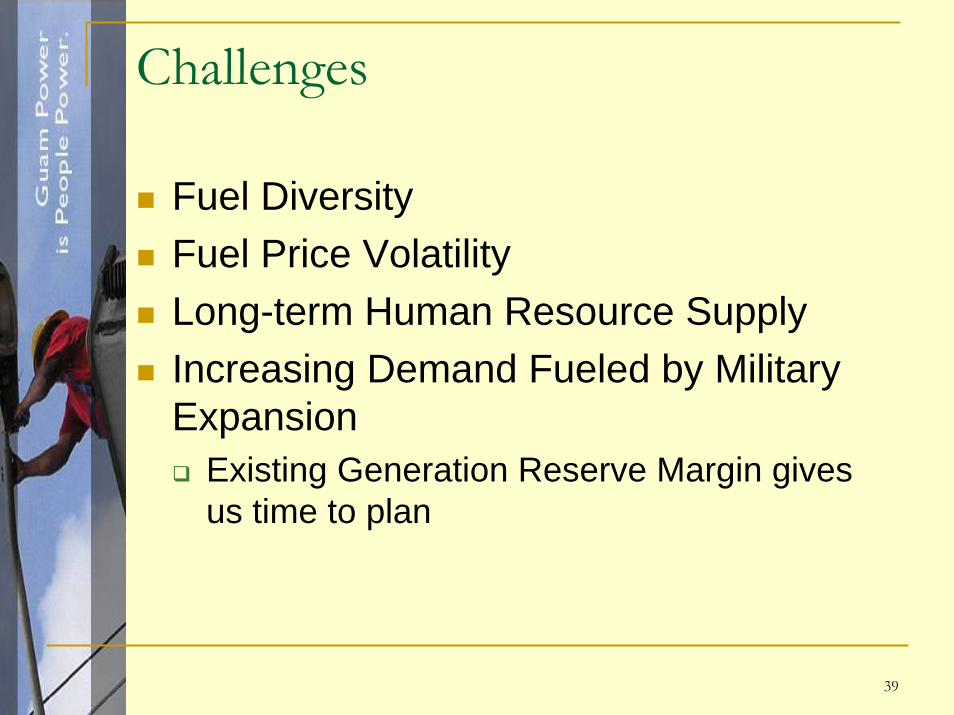
Challenges
Fuel DiversityFuel Price VolatilityLong-term Human Resource SupplyIncreasing Demand Fueled by Military Expansion
Existing Generation Reserve Margin gives us time to plan

40
Opportunities
GPA anticipates increased revenues with the Military buildupGrowth in Japan and Korea tourism markets will improve Guam economy and increase or maintain demand for electricityIncreased revenues will allow GPA to focus on system reliability, power quality, fuel diversity, new generation, and possible rate reduction
41
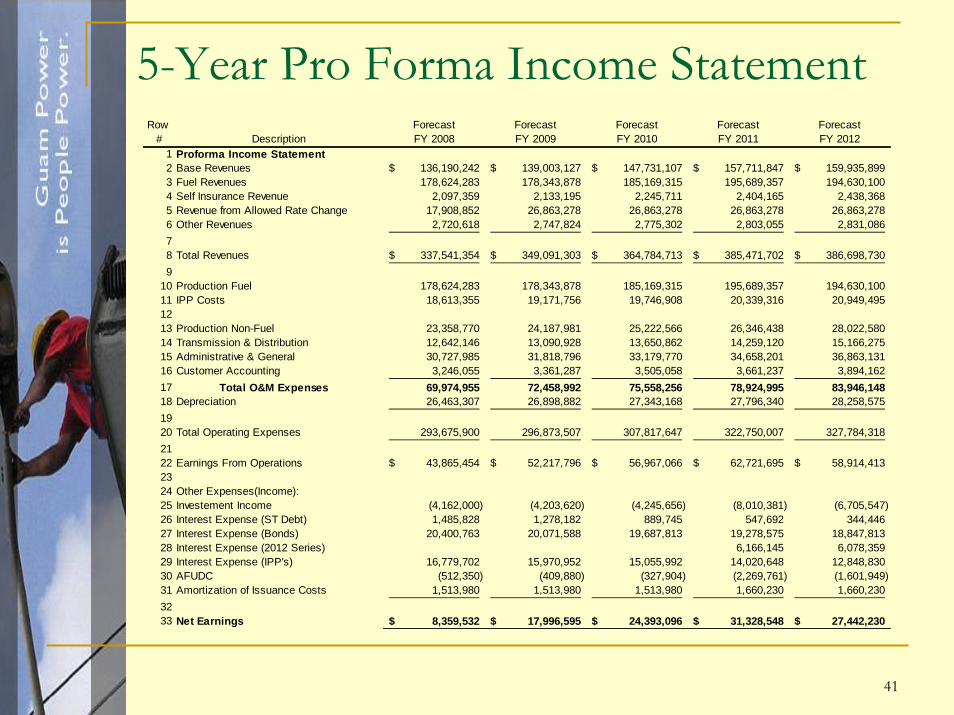
5-Year Pro Forma Income StatementRow Forecast Forecast Forecast Forecast Forecast
# Description FY 2008 FY 2009 FY 2010 FY 2011 FY 20121 Proforma Income Statement 2 Base Revenues 136,190,242$ 139,003,127$ 147,731,107$ 157,711,847$ 159,935,899$ 3 Fuel Revenues 178,624,283 178,343,878 185,169,315 195,689,357 194,630,100 4 Self Insurance Revenue 2,097,359 2,133,195 2,245,711 2,404,165 2,438,368 5 Revenue from Allowed Rate Change 17,908,852 26,863,278 26,863,278 26,863,278 26,863,278 6 Other Revenues 2,720,618 2,747,824 2,775,302 2,803,055 2,831,086 78 Total Revenues 337,541,354$ 349,091,303$ 364,784,713$ 385,471,702$ 386,698,730$ 9
10 Production Fuel 178,624,283 178,343,878 185,169,315 195,689,357 194,630,100 11 IPP Costs 18,613,355 19,171,756 19,746,908 20,339,316 20,949,495 1213 Production Non-Fuel 23,358,770 24,187,981 25,222,566 26,346,438 28,022,580 14 Transmission & Distribution 12,642,146 13,090,928 13,650,862 14,259,120 15,166,275 15 Administrative & General 30,727,985 31,818,796 33,179,770 34,658,201 36,863,131 16 Customer Accounting 3,246,055 3,361,287 3,505,058 3,661,237 3,894,162 17 Total O&M Expenses 69,974,955 72,458,992 75,558,256 78,924,995 83,946,148 18 Depreciation 26,463,307 26,898,882 27,343,168 27,796,340 28,258,575 1920 Total Operating Expenses 293,675,900 296,873,507 307,817,647 322,750,007 327,784,318 2122 Earnings From Operations 43,865,454$ 52,217,796$ 56,967,066$ 62,721,695$ 58,914,413$ 2324 Other Expenses(Income):25 Investement Income (4,162,000) (4,203,620) (4,245,656) (8,010,381) (6,705,547) 26 Interest Expense (ST Debt) 1,485,828 1,278,182 889,745 547,692 344,446 27 Interest Expense (Bonds) 20,400,763 20,071,588 19,687,813 19,278,575 18,847,813 28 Interest Expense (2012 Series) 6,166,145 6,078,359 29 Interest Expense (IPP's) 16,779,702 15,970,952 15,055,992 14,020,648 12,848,830 30 AFUDC (512,350) (409,880) (327,904) (2,269,761) (1,601,949) 31 Amortization of Issuance Costs 1,513,980 1,513,980 1,513,980 1,660,230 1,660,230 3233 Net Earnings 8,359,532$ 17,996,595$ 24,393,096$ 31,328,548$ 27,442,230$
42
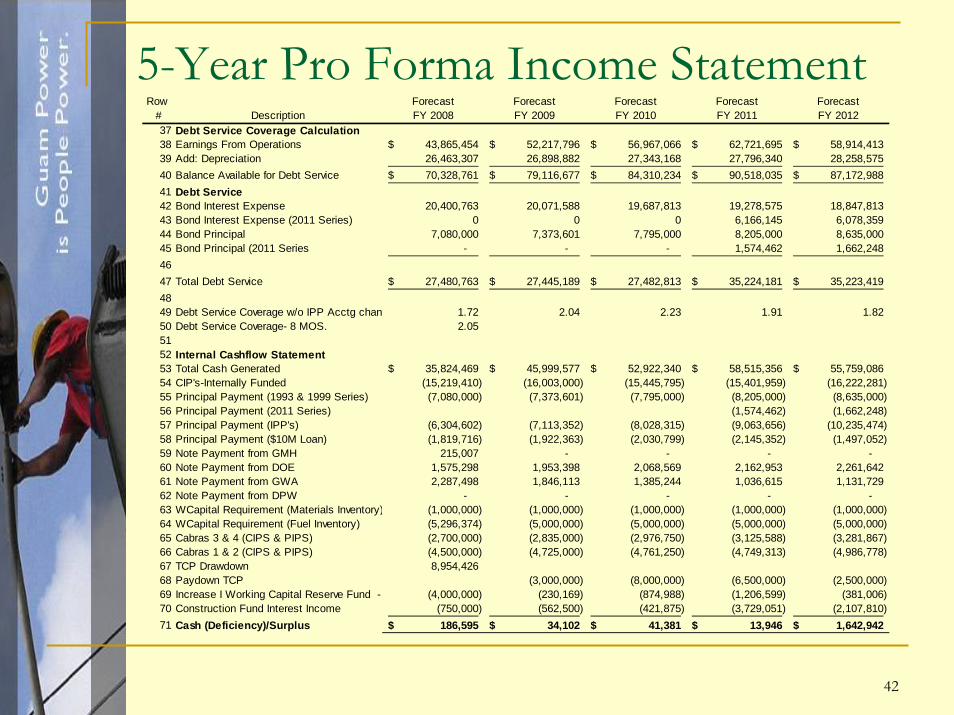
5-Year Pro Forma Income StatementRow Forecast Forecast Forecast Forecast Forecast
# Description FY 2008 FY 2009 FY 2010 FY 2011 FY 201237 Debt Service Coverage Calculation38 Earnings From Operations 43,865,454$ 52,217,796$ 56,967,066$ 62,721,695$ 58,914,413$ 39 Add: Depreciation 26,463,307 26,898,882 27,343,168 27,796,340 28,258,575 40 Balance Available for Debt Service 70,328,761$ 79,116,677$ 84,310,234$ 90,518,035$ 87,172,988$ 41 Debt Service42 Bond Interest Expense 20,400,763 20,071,588 19,687,813 19,278,575 18,847,81343 Bond Interest Expense (2011 Series) 0 0 0 6,166,145 6,078,35944 Bond Principal 7,080,000 7,373,601 7,795,000 8,205,000 8,635,000 45 Bond Principal (2011 Series - - - 1,574,462 1,662,248 4647 Total Debt Service 27,480,763$ 27,445,189$ 27,482,813$ 35,224,181$ 35,223,419$ 4849 Debt Service Coverage w/o IPP Acctg chan 1.72 2.04 2.23 1.91 1.82 50 Debt Service Coverage- 8 MOS. 2.05 5152 Internal Cashflow Statement53 Total Cash Generated 35,824,469$ 45,999,577$ 52,922,340$ 58,515,356$ 55,759,086$ 54 CIP's-Internally Funded (15,219,410) (16,003,000) (15,445,795) (15,401,959) (16,222,281) 55 Principal Payment (1993 & 1999 Series) (7,080,000) (7,373,601) (7,795,000) (8,205,000) (8,635,000) 56 Principal Payment (2011 Series) (1,574,462) (1,662,248) 57 Principal Payment (IPP's) (6,304,602) (7,113,352) (8,028,315) (9,063,656) (10,235,474) 58 Principal Payment ($10M Loan) (1,819,716) (1,922,363) (2,030,799) (2,145,352) (1,497,052) 59 Note Payment from GMH 215,007 - - - - 60 Note Payment from DOE 1,575,298 1,953,398 2,068,569 2,162,953 2,261,642 61 Note Payment from GWA 2,287,498 1,846,113 1,385,244 1,036,615 1,131,729 62 Note Payment from DPW - - - - - 63 WCapital Requirement (Materials Inventory) (1,000,000) (1,000,000) (1,000,000) (1,000,000) (1,000,000) 64 WCapital Requirement (Fuel Inventory) (5,296,374) (5,000,000) (5,000,000) (5,000,000) (5,000,000) 65 Cabras 3 & 4 (CIPS & PIPS) (2,700,000) (2,835,000) (2,976,750) (3,125,588) (3,281,867) 66 Cabras 1 & 2 (CIPS & PIPS) (4,500,000) (4,725,000) (4,761,250) (4,749,313) (4,986,778) 67 TCP Drawdown 8,954,426 68 Paydown TCP (3,000,000) (8,000,000) (6,500,000) (2,500,000) 69 Increase I Working Capital Reserve Fund - (4,000,000) (230,169) (874,988) (1,206,599) (381,006) 70 Construction Fund Interest Income (750,000) (562,500) (421,875) (3,729,051) (2,107,810) 71 Cash (Deficiency)/Surplus 186,595$ 34,102$ 41,381$ 13,946$ 1,642,942$

43
Conclusion
GPA believes that there will be accelerated economic and business growth in the near term by 2014 resulting in a significant potential increase in revenues.