presentation title (arial bold 22pt) - tata communications · of dth in the country ... key...
TRANSCRIPT

1
© 2015 Tata Communications Ltd. All rights reserved. TATA COMMUNICATIONS and TATA are trademarks of Tata Sons Limited in certain countries.
www.tatacommunications.com | @tata_comm
http://tatacommunications-newworld.com | www.youtube.com/user/tatacomms
Investor Presentation
May 2016

© 2015 Tata Communications Ltd. All rights reserved. TATA COMMUNICATIONS and
TATA are trademarks of Tata Sons Limited in certain countries.
www.tatacommunications.com | @tata_comm
http://tatacommunications-newworld.com | www.youtube.com/user/tatacomms
2
Safe Harbor Statement
Some of the statements herein constitute “forward-looking statements” that do not directly or
exclusively relate to historical facts. These forward-looking statements reflect our intentions, plans,
expectations, assumptions and beliefs about future events and are subject to risks, uncertainties and
other factors, many of which are outside our control. Important factors that could cause actual
results to differ materially from the expectations expressed or implied in the forward-looking
statements include known and unknown risks. Because actual results could differ materially from our
intentions, plans, expectations, assumptions and beliefs about the future, you are urged to view all
forward-looking statements contained herein with caution. Tata Communications does not undertake
any obligation to update or revise forward looking statements, whether as a result of new
information, future events or otherwise.

3
© 2015 Tata Communications Ltd. All rights reserved. TATA COMMUNICATIONS and TATA are trademarks of Tata Sons Limited in certain countries.
www.tatacommunications.com | @tata_comm
http://tatacommunications-newworld.com | www.youtube.com/user/tatacomms
Introduction and Overview of Tata
Communications

© 2015 Tata Communications Ltd. All rights reserved. TATA COMMUNICATIONS and
TATA are trademarks of Tata Sons Limited in certain countries.
www.tatacommunications.com | @tata_comm
http://tatacommunications-newworld.com | www.youtube.com/user/tatacomms
4
Tata Group OverviewOne of the world’s most reputed conglomerates
BroadbandEnterprise WholesaleWireless Fixed Line IT ITES DTH
• 353,843
employees
globally as
in March’
2016
• 60.9 mn wireless
subscribers as of
November 30, 2015
• A global player and ‘Leader’
in Gartner’s magic quadrant
for network service provider,
Global
• Ranked No.1 in India Data &
Enterprise Segment Services
• 1.70 mn wireline
subscribers as
on November 30,
2015
• Largest India-based IT
services company by
2015 revenues
• Software vendor to
worlds leading telcos
and telecom equipment
manufacturers
• One of the
largest provider
of DTH in the
country
• Ranked No. 1 in
the world in
Wholesale
International
Voice services
Interests in Telecom Media and Technology
US$ 108.8 bn in annual revenue for the YE March 2015
Over 100 operating companies in 7 sectors in more than 100 countries across 6 continents
US$ 116.41 bn in market capitalization for its 29 listed companies (2016)
Over 600,000 employees worldwide
Brand Finance, a UK-based consultancy firm, has valued Tata’s multi-brand portfolio at over $23
billion in 2015.
Highly reputed and respected leadership with a strong track record of delivering results
Sound corporate governance with over 140 years of adherence to strong values and business ethics

© 2015 Tata Communications Ltd. All rights reserved. TATA COMMUNICATIONS and
TATA are trademarks of Tata Sons Limited in certain countries.
www.tatacommunications.com | @tata_comm
http://tatacommunications-newworld.com | www.youtube.com/user/tatacomms
5
Company overview
Business Model
(48%
)
(12%
)
Voice
Solutions
Data
ServicesStart-ups (primarily
Neotel)
CORE START-UPS1
1 Start-ups also includes United Telecom Limited (UTL) Nepal (26.66% shareholding)
besides Neotel (67.32% shareholding)2 for the year ended Mar’16 (FY16)
Mature; Growth Solutions & Brand –
India Leader and Global Challenger
Mature; Stable Scale Business – Market Leader
• Offerings: Connectivity (focusing on leased
circuit networking and IP transit services),
data centers, managed services, outsourcing
• Market: Global
• Customers: Global carriers and enterprises,
and mid-market segment in India
• Ranking: #1 in India in enterprise data
services by revenue
• Offerings: All telecom
services except mobile, first
CDMA network in South Africa
• Market: South Africa
• Customers: Carriers,
entreprises, SMB and
consumers
• Ranking: #2 in enterprise and
wholesale data in South Africa
• Tata Communications Limited (‘TCL’) is a leading provider of enterprise & wholesale Data Services and wholesale long distance Voice
Solutions
• 48.9% owned by the Tata Group, which is one of India’s largest and most reputed multinational conglomerates
• Business consists of 3 segments: Voice Solutions, Data Services and Start-ups (primarily South Africa Operations – Neotel)
• Leader in enterprise data services & wholesale long distance voice services in India; and international voice services, wholesale connectivity
and mobile signaling globally
• Total 10,710 employees as of Mar’16. 1,004 employees in the South African operations and 9,706 in core business (Data+Voice)
• Offerings: Wholesale international voice carriage and
termination, India national long distance voice,
outsourcing/white label
• Market: Global
• Customers: Global carriers and service providers
• Ranking: #1 in international wholesale voice by minutes39% 16%
% of gross
Revenue²
% of
EBITDA²
South Africa Investment (Neotel)
52% 73% 9% 11%

© 2015 Tata Communications Ltd. All rights reserved. TATA COMMUNICATIONS and
TATA are trademarks of Tata Sons Limited in certain countries.
www.tatacommunications.com | @tata_comm
http://tatacommunications-newworld.com | www.youtube.com/user/tatacomms
6
Tata Group48.87%
Government of India26.12%
Institutions18.01%
Non-institutions
6.99%
Key
Performance
Indicators
• #1 international wholesale voice carrier by
minutes
• #1 submarine cable owner by length
• #1 in enterprise data in India by revenue
• #2 network operator in South Africa
• Over 3,600 large corporates including 500+
Forbes 2,000 companies
• Over 1,600 carriers including over 700 mobile
operators
Key Highlights
Industry
leadership
Global
Infrastructure
• World’s largest and wholly owned submarine fibre
network
• 400+ Points of Presence
• Nearly 20% of the world’s lit international capacity
• 44 data centres with more than 1 mn square feet of
space
Customers
Factsheet
• #4 tier-1 IP back bone. Only global tier 1 player
with a top five position in 5 key continents
• World’s only round-the-world sub-sea cable
network. Tata Communications’ network carries
nearly 8% of global internet traffic
• 24% of the world’s internet routes
• #1 mobile signaling provider
Shareholding Pattern
1. Tata group includes Panatone Finvest Ltd (30.10%), Tata Sons (14.07%), and
Tata Power Ltd. (4.71%)
2. Institutions include Mutual funds (6.24%), Foreign portfolio investors (3.32%),
Financial institutions / Banks (4.57%), Insurance companies (0.56%), and
others including bodies corporate (3.33%)
3. Non-institutions include individuals (4.23%), NBFC registered with RBI (0.1%)
and others (2.75%)
As on March 31, 2016
Ranked no. 1 in Transparency in Corporate Reporting
• Transparency International, a global civil society
organization, conducted research into the public
reporting practices of 100 emerging market
companies based in 16 countries in October, 2013
• Tata Communications also ranked no. 1 in
Transparency on Corporate reporting
1
2
3

© 2015 Tata Communications Ltd. All rights reserved. TATA COMMUNICATIONS and
TATA are trademarks of Tata Sons Limited in certain countries.
www.tatacommunications.com | @tata_comm
http://tatacommunications-newworld.com | www.youtube.com/user/tatacomms
7
Tata Communications' transformation and growth
2002
20052005-10 2010-13 2014-16
Global challenger
• Managed services portfolio
• Tata Communications brand launch
• MPLS, Ethernet, IDC expansion
• Emerging Market (EM) expansion
• New verticals: media, banking
• Global MNCs customers: leverage India and EM
• Global partnership with F1™
Competitive private sector
• Operations restructuring
• Enterprise services domain
NW expansion
• Customer service focus
Monopoly public
sector India centric
• Purchase of VSNL
International expansion
• Singapore cable
• TGN and Teleglobe acquisitions
• South Africa entry integration of global organisation
• Wholesale leadership
Gaining market position
• #1 International wholesale
• #1 India large enterprise
• Leader in global network services
(Gartner)
• Making in-roads in global enterprises
• Aon Best Employer India 2016
InnovationGrowthTransformation
Gartner, Inc “Magic Quadrant for Network Services, Global” Neil Rickard, Bjarne Munch, 14 January 2016. Gartner does not endorse any vendor, product or service depicted in its research publications, and does not advise technology
users to select only those vendors with the highest ratings or other designation. Gartner research publications consist of the opinions of Gartner's research organisation and should not be construed as statements of fact. Gartner
disclaims all warranties, expressed or implied, with respect to this research, including any warranties of merchantability or fitness for a particular purpose.

© 2015 Tata Communications Ltd. All rights reserved. TATA COMMUNICATIONS and
TATA are trademarks of Tata Sons Limited in certain countries.
www.tatacommunications.com | @tata_comm
http://tatacommunications-newworld.com | www.youtube.com/user/tatacomms
8
Sustained profitable growth over the years
Summary Financials
Consolidated Revenue from
Operations (INR mn)
Consolidated EBITDA (INR mn) Consolidated Cash Profit1 (INR mn)
1Cash Profit computed as
(Net Profit/Loss + Depreciation and Amortisation & Impairment)
12,253 17,915
20,597
30,416 29,897 30,335
10.6%
12.6%12.0%
15.5% 15.0%
14.8%
0.0%
2.0%
4.0%
6.0%
8.0%
10.0%
12.0%
14.0%
16.0%
18.0%
-
5,000
10,000
15,000
20,000
25,000
30,000
35,000
FY 11 FY 12 FY 13 FY 14 FY 15 FY 16EBITDA EBITDA %
• Sustained revenue growth momentum - Data segment continues to grow in double digits outpacing industry and
peers growth rates
• FY15 and FY16 performance adversely impacted by weak Neotel performance and challenging operating
environment in wholesale voice business
• Operating leverage and strong cost discipline driving significant cost efficiencies across all elements of the cost
structure
• Data and core business EBITDA margin improvement over last 4-years, while continuing to step up investments in
transforming the business and expanding it to attractive value chain adjacencies
• Continue to generate significant cash profits
1,19,3201,41,961
1,72,1301,96,196 199,090 2,05,548
FY11 FY12 FY13 FY14 FY15 FY16
7,714
10,254
14,037
23,984 23,524
22,184
FY 11 FY 12 FY 13 FY 14 FY 15 FY 16

9
© 2015 Tata Communications Ltd. All rights reserved. TATA COMMUNICATIONS and TATA are trademarks of Tata Sons Limited in certain countries.
www.tatacommunications.com | @tata_comm
http://tatacommunications-newworld.com | www.youtube.com/user/tatacomms
Business Overview and Strategy

© 2015 Tata Communications Ltd. All rights reserved. TATA COMMUNICATIONS and
TATA are trademarks of Tata Sons Limited in certain countries.
www.tatacommunications.com | @tata_comm
http://tatacommunications-newworld.com | www.youtube.com/user/tatacomms
10
Service Portfolio Traditional Services: IPL, NPL, IP-T, IRUs, ILL, DIA Managed
Services: Data Center Services, Unified Communications and Collaboration Services
(UCC), Transformation Services (TCTSL), Payment Services (TCPSL), Mobility :
Signalling services, VPN Services : MPLS,VNO, Ethernet
Data Services | Highlights
Key Highlights Data Segment is a Growth Driver
• Industry leader in India and an emerging global challenger
• Significant capital expenditure made to create global
infrastructure and a suite of growth products
• Ongoing focus and investment in brand, sales and marketing
to scale up global enterprise business - increased recognition
in the marketplace; Higher global RFP participation
• Heathrow express campaign and F1 deal creating visibility
amongst global enterprise customers
• Shift towards non-traditional and high-margin; new, managed
and VPN services to drive performance
• Industry specific platforms for banking, media & entertainment
creating new revenue streams
• Positive on cash generation (EBITDA less capex)
41,89047,946
56,46267,534
81,48589,914
1,05,971
FY10 FY11 FY12 FY13 FY14 FY15 FY16
Gro
ss R
eve
nu
es (
Rs m
illio
n)
Moving Beyond Traditional Services Data Services – Positive FCF in spite of capex step-up
Data EBITDA less capex for Data and strategic projects (USD million)
Note: FY13 and periods prior to that are not restated for subsequent sub-segment re-classifications
67% 60%52% 48% 41% 39% 37%
1%1%
3% 2%2% 2% 2%
8%8%
8%6%
6% 5% 4%
13%17%
19%23%
24% 25% 25%
11% 14% 18% 21% 28% 29% 31%
FY10 FY11 FY12 FY13 FY14 FY15 FY16
Traditional Media Services Mobility VPN Services Managed Services
-75-98
-42
45 3586
FY11 FY12 FY13 FY14 FY15 FY16
18% Y-o-Y

© 2015 Tata Communications Ltd. All rights reserved. TATA COMMUNICATIONS and
TATA are trademarks of Tata Sons Limited in certain countries.
www.tatacommunications.com | @tata_comm
http://tatacommunications-newworld.com | www.youtube.com/user/tatacomms
11
Key Highlights
• Overall market environment continues to be challenging and growth is decelerating
Structural industry level headwinds such as growing adoption of VoIP based OTTs is causing addressable
market to shrink
Competitive pressure on volume and pricing
• Tata Communications has well diversified traffic mix across customer segments and geographic regions
• Extremely sharp focus on profitability coupled with minimal incremental capex requirements drives healthy free cash
generation
• Remain focused on driving cost and operating efficiencies coupled with fine tuning Go-to-Market approach
Traffic growth far exceeding industry and peers
9.5 10.4 8.6 8.3 5.9 4.5 3.1
32.641.2 46.7
53.750.6
44.740.0
FY10 FY11 FY12 FY13 FY14 FY15 FY16
NLD ILD
42.1
51.655.3
62.0
Tra
ffic
in B
illio
n M
inute
s
Voice Solutions | Highlights
Voice Business – Strong Cash Generation Profile
Voice EBITDA less Voice Capex ($ million)
56.5
Note: FY13 and periods prior to that are not restated for subsequent sub-segment re-classifications.
49.2
67
101
122129
98
70
FY11 FY12 FY13 FY14 FY15 FY16
43.2

12
1,700
3,4254,737 5,157 5,665
FY12 FY13 FY14 FY15 FY16
PROGRESS ON TCPSL (PAYMENT SERVICES) INR Million
TCPSL – Hitting operationally right milestones and making good progress on profitability roadmap
TCPSL Revenues
2,668 2,762 2,903
H2 FY15 H1 FY16 H2 FY16
9% Y-o-Y • Efforts towards ATM portfolio rebalancing and
rationalization is yielding consistent
improvement across all operational parameters
• Witnessing consistent improvement in average
daily transaction per indcash ATM (WLA) month
after month
• Primary objective continues to be improvement
in operating profitability
Opportunistically rationalizing BLA/MOF ATM portfolio
with an eye on profitability
Minimal further net additions on BLA/MOF deployments
Sustained focus on cost, per unit cost economics and
scale efficiencies
Leverage non-transaction based revenue streams
• Expect improvement trend in TCPSL EBITDA to
sustain in FY17
10% Y-o-Y
(572)(1,226) (907)
(406)
84
-34% -36%
-19%
-8%
1%
-40.00%
-20.00%
0.00%
20.00%
(1,500)
(1,000)
(500)
-
500
FY12 FY13 FY14 FY15 FY16
EBITDA EBITDA %
TCPSL EBITDA¹
(79)(138)
228
-3% -5%
8%
-10.00%
-5.00%
0.00%
5.00%
10.00%
(200)
(100)
-
100
200
300
H2FY15
H1FY16
H2FY16
Management estimates excluding allocations

13
USD Million
TCTS Revenues¹
2851
7093
126
FY12 FY13 FY14 FY15 FY16
4
15 2013
22
13%
30% 28%
14%17%
0%
20%
40%
-
10.00
20.00
30.00
FY12 FY13 FY14 FY15 FY16
EBITDA EBITDA %
TCTS EBITDA¹
• FY16 was a transformational year for TCTS business
Landmark deal wins in newer areas (mobility, field support, India
geography)
Expands our addressable opportunity and capabilities
There is ‘cost of growth’ of associated with these ramp-ups
• Strong near term growth visibility
Newer capabilities and sales coverage driving pipeline build-up
Building delivery capability to keep pace with funnel
• Investments to support growth will continue
Building bench, stepping up global sales and marketing, and investing
towards newer capabilities
• Expect sustained growth momentum and further improvement
in profitability in FY17
Maturity of operations on newer capabilities and operating & SG&A
leverage to drive profitability
• Capex light nature of TCTSL growth augurs well for us
A very high ROCE scalable business
Strong revenue growth and improvement in operating margin profile
¹ Management estimates including group company and Tata Communications captive business on arms-length basis
PROGRESS ON TCTS (TRANSFORMATION SERVICES)
36% Y-o-Y
67% Y-o-Y
FY12-16 CAGR: 46%

© 2015 Tata Communications Ltd. All rights reserved. TATA COMMUNICATIONS and
TATA are trademarks of Tata Sons Limited in certain countries.
www.tatacommunications.com | @tata_comm
http://tatacommunications-newworld.com | www.youtube.com/user/tatacomms
14
Positioned in the Leaders' Quadrant in Gartner Magic
Quadrant for Network Services, Global
Source: Gartner, Inc “Magic Quadrant for Network Services, Global” Neil Rickard, Bjarne Munch, 14 January 2016. This Magic Quadrant graphic was published by Gartner, Inc. as part of a larger research note and should be evaluated in the context of the entire report. The Gartner report is available upon request from Tata
Communications. Gartner does not endorse any vendor, product or service depicted in its research publications, and does not advise technology users to select only those vendors with the highest ratings. Gartner
research publications consist of the opinions of Gartner's research organization and should not be construed as statements of fact. Gartner disclaims all warranties, expressed or implied, with respect to this
research, including any warranties of merchantability or fitness for a particular purpose.

© 2015 Tata Communications Ltd. All rights reserved. TATA COMMUNICATIONS and
TATA are trademarks of Tata Sons Limited in certain countries.
www.tatacommunications.com | @tata_comm
http://tatacommunications-newworld.com | www.youtube.com/user/tatacomms
15
Network Services Managed Services
GDMS | YoY Gross Revenue Product Mix
14%
16%
14%27%
5%
24%
1%
11%
14%
16%
28%
6%
23%
2% Mobility
Banking Services
Transformation Services
Data Center Services
Media Services
Unified CommunicationsandCollaboration (UCC)
Others
31%
41%
27%
1%30%
42%
27%
1%
Traditional NetworkServices
VPN Services
Internet Transit
Others
FY16
FY15
FY16
FY15
Network Service Portfolio
Traditional Network Services: IPL, NPL, IRUs
VPN Services : DGE and VPN
Internet Transit – IP-T, ILL
Other: Inmarsat, GNS others
Managed Services Portfolio:
Banking Services: TCPSL
Transformation Services: TCTSL
Data Center Services: Colocation, Hosting, Cloud (IaaS)
Media Services: Vconnect, Broadcast, CDN, Mosaic
Unified Communications and Collaboration (UCC): SIP trunking, Unified Conferencing, Telepresence, Jamvee, Hosted Contact Centre
Other: MSS, SaaS
62% of FY16
Data Revenues38% of FY16
Data Revenues
Transformation services, media and entertainment services, data centre services, VPN connectivity and
internet transit have been the key drivers for growth.

© 2015 Tata Communications Ltd. All rights reserved. TATA COMMUNICATIONS and
TATA are trademarks of Tata Sons Limited in certain countries.
www.tatacommunications.com | @tata_comm
http://tatacommunications-newworld.com | www.youtube.com/user/tatacomms
16
We are creating new, strategic pivots
Develop ‘Sharing Economies’ ecosystem in ICT space
Create public - private / hybrid model

© 2015 Tata Communications Ltd. All rights reserved. TATA COMMUNICATIONS and
TATA are trademarks of Tata Sons Limited in certain countries.
www.tatacommunications.com | @tata_comm
http://tatacommunications-newworld.com | www.youtube.com/user/tatacomms
17
Current Portfolio – Market Share vs Industry Growth
Indicative Revenue View
Growth Business
Mature Business
Source: Company Estimates
(1) Traditional Network comprises
leased lines and IP/internet
transit
(2) Cloud/DC market share for
Indian and Singapore
(3) Industry growth represents total
addressable market growth

© 2015 Tata Communications Ltd. All rights reserved. TATA COMMUNICATIONS and
TATA are trademarks of Tata Sons Limited in certain countries.
www.tatacommunications.com | @tata_comm
http://tatacommunications-newworld.com | www.youtube.com/user/tatacomms
18
New Platforms will drive Target market
expansion from $41Bn to ~$57Bn by 2019
149
8
9
79
12
4 71 12
52
71
23
0
3
(5)1
2 03 1
3
5 13
3
FY15Intl. VoiceCarr. N/w O/sData - IntlData - IndCloudBanking SolnsUCC Mobility Media IZO H'care FY19
FY19 TCL Addressable Market (US $ B) US $57Bn
in 2019
Data -
India
Intl Voice
Data - Intl
US $41Bn
in 2015
Carrier N/w
O/s
CloudBanking Soln
MediaMobilityUC
C
CAGR
9%
33%
37%
22%
13%
14%
7%
5%
2%
-10%
Growth driven by Innovation in new services like Cloud,
IZO, Media, Mobility (Innovation Services), Healthcare and
UCC (GHCC, Jamvee, IPT)
N
A
109
%
HealthCar
e
Driving significant target market expansion in spite of faster decline in voice segment

© 2015 Tata Communications Ltd. All rights reserved. TATA COMMUNICATIONS and
TATA are trademarks of Tata Sons Limited in certain countries.
www.tatacommunications.com | @tata_comm
http://tatacommunications-newworld.com | www.youtube.com/user/tatacomms
19
3,600 ENTERPRISE CUSTOMERS GLOBALLYOver 600 new customers last year
55% of S&P 500 32% of FTSE 350 60% of PWC 100of the
Fortune 50070%
MANUFACTURING E-COMMERCEMEDIA /
ENTERTAINMENT
HEALTHCARE /
PHARMACEUTICAL
BANKING / FINANCIAL IT / ITES SERVICES AVIATION
Customer landscape

© 2015 Tata Communications Ltd. All rights reserved. TATA COMMUNICATIONS and
TATA are trademarks of Tata Sons Limited in certain countries.
www.tatacommunications.com | @tata_comm
http://tatacommunications-newworld.com | www.youtube.com/user/tatacomms
20
We will continue to accelerate our success
• We have global scale and reach
• We are building our brand and gaining
Industry recognition
• We are becoming embedded in the
Silicon Valley innovation ecosystem
• We are the only enterprise global leader
with a dedicated team engaging the
platform ecosystem
• We are fast, flexible and responsive
– our challenger mindset with partnering
DNA makes us an ideal partner
We are at a strategic inflection point

© 2015 Tata Communications Ltd. All rights reserved. TATA COMMUNICATIONS and
TATA are trademarks of Tata Sons Limited in certain countries.
www.tatacommunications.com | @tata_comm
http://tatacommunications-newworld.com | www.youtube.com/user/tatacomms
21
successes
Named an Aon Best Employer India
2016. Recognised for high employee
engagement, compelling employer
brand, effective leadership and a
culture that enables high
performance
Continued to make in-roads in global enterprise
space winning against global giants. We signed,
amongst others, a Landmark Deal with AF/KLM that
aims to “Unleash a Digital Transformation”. This
reflects our success in changing narrative with
enterprise CIO from supplier to true partners
“Leader” in Gartner Magic
Quadrant¹ for Network Services,
Global for the third consecutive
year
We continue to outgrow most of
our peers and our Capex continues
to be relatively lower than Industry
spend validating high quality
services led nature of our growth
Partnership program
continues to gain traction.
Several new partnerships
established.
Hitting operational milestones in
line with our strategic plan for
transforming business mix,
enhancing profitability, improving
FCF and ROCE, and reshaping our
business portfolio
¹ Gartner, Inc “Magic Quadrant for Network Services, Global” Neil Rickard, Bjarne Munch, 14 January 2016. Gartner does not endorse any vendor, product or service depicted in its research publications, and does not advise technology users to select only those
vendors with the highest ratings or other designation. Gartner research publications consist of the opinions of Gartner's research organisation and should not be construed as statements of fact. Gartner disclaims all warranties, expressed or implied, with respect to
this research, including any warranties of merchantability or fitness for a particular purpose.

© 2015 Tata Communications Ltd. All rights reserved. TATA COMMUNICATIONS and
TATA are trademarks of Tata Sons Limited in certain countries.
www.tatacommunications.com | @tata_comm
http://tatacommunications-newworld.com | www.youtube.com/user/tatacomms
22
ST Telemedia and Tata Communications enter into a strategic
partnership to expand data centre business in India and Singapore
• ST Telemedia will acquire 74% majority stake in Tata Communications’ data centre business in India (TCDC) and
Singapore (TCX) for an estimated 100% enterprise value of INR 31.3b and SGD 232.4m respectively.
• Both companies share a very similar ethos, set of values, impeccable commitment to customer service excellence,
and are long term investors, focusing on performance, value and growth.
• Tata Communications will remain as a significant shareholder, holding the remaining 26% stake in the businesses.
• This new joint venture partnership will now allow us to hone our strategic focus on advanced services within the
data centre that enable digital transformation for our customers, in addition to infrastructure services.
• Tata Communication will continue to focus on the development and introduction of its advanced managed services
portfolio (including IP, cloud enablement and unified communications services), and continuing to invest in its
strategic partnerships globally

23
© 2015 Tata Communications Ltd. All rights reserved. TATA COMMUNICATIONS and TATA are trademarks of Tata Sons Limited in certain countries.
www.tatacommunications.com | @tata_comm
http://tatacommunications-newworld.com | www.youtube.com/user/tatacomms
Financial Overview and
FY16 Earnings Update

© 2015 Tata Communications Ltd. All rights reserved. TATA COMMUNICATIONS and
TATA are trademarks of Tata Sons Limited in certain countries.
www.tatacommunications.com | @tata_comm
http://tatacommunications-newworld.com | www.youtube.com/user/tatacomms
Maximize long term intrinsic value for our shareholders by :
24
Governing Objectives and Way Forward
• Recalibrate investments
• Co-create with partners
• Strong discipline and governance
around capital allocation and
expenditure
• Improve operating efficiency and drive
operating leverage
• Accelerate growth in high margin data
segment and new services
Strategic Focus Areas
Driving
Capital
Efficiency
Investing for
Sustainable
Long-term
Growth
• Reshape portfolio
• Traditional services facing challenges
• Need to invest in new services /
innovation to differentiate and
accelerate growth.
Improving
Margin
Profile
• Free cash flow (FCF) generation and
balance sheet deleveraging is a key
priority
• Pursue opportunities for unlocking
intrinsic value
• Rationalize businesses with subpar return
profile
Creating
Financial
and
Strategic
Flexibility
Maximize shareholder returns by improving core business RoCE

© 2015 Tata Communications Ltd. All rights reserved. TATA COMMUNICATIONS and
TATA are trademarks of Tata Sons Limited in certain countries.
www.tatacommunications.com | @tata_comm
http://tatacommunications-newworld.com | www.youtube.com/user/tatacomms
26%18%
74%82%
FY15 FY16
Voice Data
Core Business Margin Profile
25
Composition of core business is steadily transforming in favor of data segment
• Quality of core business EBITDA is improving on the back of strong predictable performance from data segment
• Strong and predictable data performance provides us ample headroom to absorb any volatility emerging from voice
segment
• Data EBITDA margin expansion is achieved along side accelerating investments in new service and front-end (sales,
marketing and brand)
• Expect maturity of data growth service portfolio and TCPSL turnaround to contribute meaningfully towards further
bolstering Data segment margin profile
Core business EBITDA composition by segment
23% Y-o-Y
24% Y-o-Y
FY16 EBITDA
growth19.9%
20.8%
7.2%6.0%
FY15 FY16
EBITDA Margins
© 2015 Tata Communications Ltd. All rights reserved. TATA COMMUNICATIONS and
TATA are trademarks of Tata Sons Limited in certain countries.
www.tatacommunications.com | @tata_comm
http://tatacommunications-newworld.com | www.youtube.com/user/tatacomms
Data segment continues to perform well
26
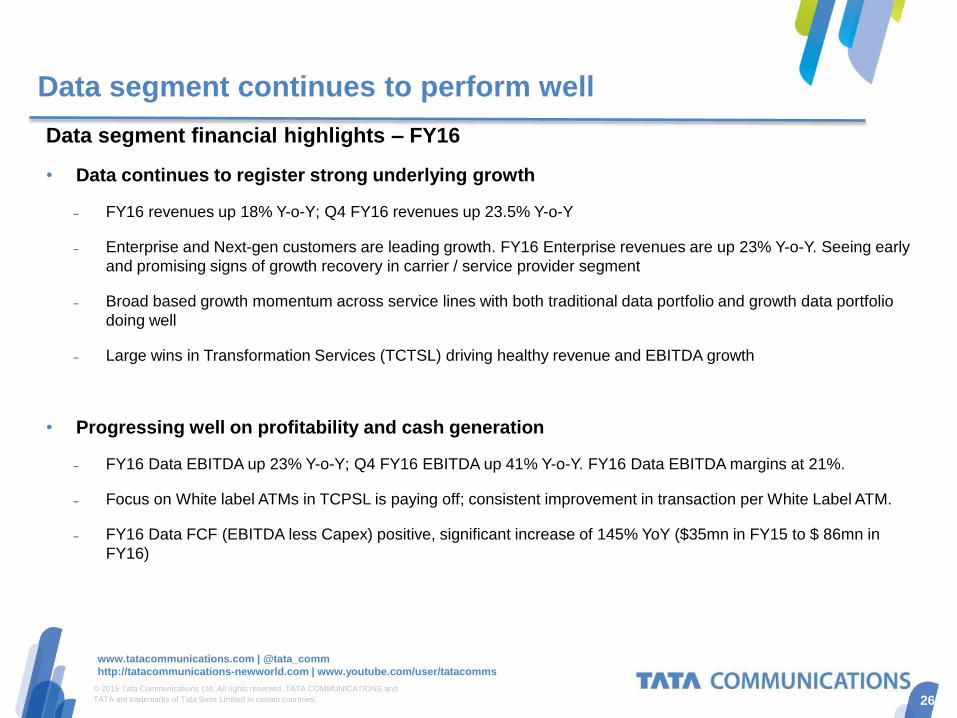
Data segment financial highlights – FY16
• Data continues to register strong underlying growth
FY16 revenues up 18% Y-o-Y; Q4 FY16 revenues up 23.5% Y-o-Y
Enterprise and Next-gen customers are leading growth. FY16 Enterprise revenues are up 23% Y-o-Y. Seeing early
and promising signs of growth recovery in carrier / service provider segment
Broad based growth momentum across service lines with both traditional data portfolio and growth data portfolio
doing well
Large wins in Transformation Services (TCTSL) driving healthy revenue and EBITDA growth
• Progressing well on profitability and cash generation
FY16 Data EBITDA up 23% Y-o-Y; Q4 FY16 EBITDA up 41% Y-o-Y. FY16 Data EBITDA margins at 21%.
Focus on White label ATMs in TCPSL is paying off; consistent improvement in transaction per White Label ATM.
FY16 Data FCF (EBITDA less Capex) positive, significant increase of 145% YoY ($35mn in FY15 to $ 86mn in
FY16)

© 2015 Tata Communications Ltd. All rights reserved. TATA COMMUNICATIONS and
TATA are trademarks of Tata Sons Limited in certain countries.
www.tatacommunications.com | @tata_comm
http://tatacommunications-newworld.com | www.youtube.com/user/tatacomms
368
335 335
336 33
1
Base DataPortfolio
New Services TCPSL Total DataEBITDA
Data Services Profitability¹ PerspectiveUSD Million
Bulk of Data Services EBITDA margins are stable and healthy at 25 - 27% range
26.1% 27.7%
FY15 FY16
Base Data Portfolio EBITDA
margins
Base Data Portfolio comprises of over 80% of Data services revenues
FY 2015 EBITDA FY2016 EBITDA
27
154
202
7898 104
FY 15 FY 16 H2 15 H1 16 H2 16
Gross Revenue from new and innovation Data
services
34% H2 15 to
H2 16
-22
-33
-10-19
-14
-14%-16%
-12%
-20%
-13%
-30%
-20%
-10%
0%
-40
-30
-20
-10
-
FY 15 FY 16 H2 15 H1 16 H2 16
EBITDA EBITDA %
New and Innovation services include: IZO , IDC (Hosting, MSS), Healthcare , Media and
media management, UCC (SIP-T, VS & IPT, GHCC), Mobile New Services and innovation
New Services are driving strong growth and being at nascent stage need investments
Significant investments in new services Enterprise segment leads
momentum
Enterprise and next-gen
customers are leading growth
Healthy Y-o-Y growth across
Forbes 2000 and ET 500
customer universe
¹ Data profitability splits outlined above (base data portfolio, new services and TCPSL is disclosed on half-yearly basis 27
321
299 292
293
22
7
Base DataPortfolio
New Services TCPSL Total DataEBITDA
31%

© 2015 Tata Communications Ltd. All rights reserved. TATA COMMUNICATIONS and
TATA are trademarks of Tata Sons Limited in certain countries.
www.tatacommunications.com | @tata_comm
http://tatacommunications-newworld.com | www.youtube.com/user/tatacomms
28
Core Business Capex - Key Highlights
Core Business Capex Intensity
Capital allocated in line with strategy
FY12 FY13 FY14 FY15 FY16
Strategic Projects Data Voice Others
91%
86%
397
292
Capex predominantly focused on strategic projects and Data
FY12 FY13 FY14 FY15 FY16
Strategic Projects Growth Capex Sustenance Capex Others
Largely investing for growth and strategic projects
292
397
359246
38
46
1. Strategic projects include new submarine cables and data centers.
2. Others include capex towards network engineering, IT, customer service operations etc.
USD millionUSD million
253
83% 205
48
253
Note: FY13 and periods prior to that are not restated for subsequent sub-segment re-classifications.
86%
55
244
Capex is closely aligned to market opportunity, strategic
direction and has accelerated payback
Current capex predominantly focused on strategic projects and
Data growth
Pursuing asset light, partnership driven growth strategy to
minimize / substitute capex
Recent uptick in capex is due to rapid growth in data center
business, complex enterprise client deployments, new service
creation and network investments
Strong discipline and governance around capital allocation and
expenditure
Expect FY17 Core business capex to be about $ 200 - 250 mn
299 299
Core Business Capex Intensity
87%
38
192
291291
18.3%
13.7% 15.3%
10.4% 8.8%10.3% 10.2%
171%
110% 105%
85%
65% 75% 71%
FY10 FY11 FY12 FY13 FY14 FY15 FY16
Core capex as % of
core revenue,
In prior years (FY08,
FY09) intensity was
even higher at 25+%
Core capex as %
of core EBITDA

© 2015 Tata Communications Ltd. All rights reserved. TATA COMMUNICATIONS and
TATA are trademarks of Tata Sons Limited in certain countries.
www.tatacommunications.com | @tata_comm
http://tatacommunications-newworld.com | www.youtube.com/user/tatacomms
29
Core Business – Net Debt
USD Millions
Core Business Debt Profile
As on
1,5501,479
1,3801,327
1,438
Mar-12 Mar-13 Mar-14 Mar-15 Mar-16
Consistent reduction in average cost of borrowing has driven lower interest expense
*SGD 100 Mn Debt maturing in December 2016 is fully swapped into
USD but appears at USD/SGD closing rates. As on 31st March 2016,
considering closing rate of 1.3459 against hedge rate of 1.2564, net debt
would be higher by $5 mn if considered at the hedge rate.
* Key Highlights
• Cost of borrowing at 3.4% for FY16 & lowest ever at
3.14% for Q4
• Increase in FY16 net debt is due to change in business
mix altering working capital cycle (driven by enterprise led
data growth) and higher capex spend
• Lower interest expense and moderate capex intensity with
improved operating performance have set stage for core
business deleveraging
• Increasing trend in US interest Rates expected to increase
the average cost of borrowings in the medium term
Core Business - Average Cost of Loans
• Replaced higher cost rupee debts with foreign currency borrowings, in-line with business currency mix
• Refinanced debt at competitive rates further driving reduction in average cost of loans
Data points in graphs pertains to respective quarter ending (i.e March-11, June-11 etc.).
7.36%6.00% 5.89% 5.81%
5.34% 5.07% 4.99% 4.85% 4.97%4.39% 4.13% 4.19% 4.28% 4.24% 3.96% 3.82%
3.80% 3.93%3.27%
3.30% 3.14%
Mar-11 Jun-11 Sep-11 Dec-11 Mar-12 Jun-12 Sep-12 Dec-12 Mar-13 Jun-13 Sep-13 Dec-13 Mar-14 Jun-14 Sep-14 Dec-14 Mar-15 Jun-15 Sep-15 Dec-15 Mar-16
Net Debt would be USD 1370 Mn considering
SGD Swap impact. FY15 also had benefit of
USD 94 Mn IT Refund.

© 2015 Tata Communications Ltd. All rights reserved. TATA COMMUNICATIONS and
TATA are trademarks of Tata Sons Limited in certain countries.
www.tatacommunications.com | @tata_comm
http://tatacommunications-newworld.com | www.youtube.com/user/tatacomms
Revenue From Operations
Operating EBITDA (% of Gross Revenue)
Profit Before Tax and Exceptional Items
1,99,090 2,05,548
FY15 FY16
15.0% 14.8%
0%
5%
10%
15%
20%
25%
30%
35%
-
4,500
9,000
13,500
18,000
22,500
FY15 FY16
3.2% Y-o-Y
3,734
460
FY15 FY16
Consolidated Financial Performance –FY 2016
30
INR Mn
Revenue from Operations
Revenue From OperationsOperating EBITDA and margins (% of Revenue from ops)
Profit Before Tax
1.5% Y-o-Y
87.7% Y-o-Y
Particulars FY2015 FY2016
Revenue from operations 1,99,090 2,05,548
Operating EBITDA 29,897 30,335
Operating EBITDA % 15.0% 14.8%
Operating EBIT 8,286 7,590
Operating EBIT % 4.2% 3.7%
Exceptional Items (gain) / loss 1,052 2,586
PBT 3,734 460
PBT (% of total income) 1.8% 0.2%
PAT 13 -2,118
PAT (% of total income) 0.0% -1.0%
FY16 and Q4 FY16 core and consolidated financials includes exceptional items (a) Employee cost optimization expenses amounting to Rs 1,028 mn (b) Loss of Rs 900 mn representing the impairment of Neotel goodwill and
(c) loss of Rs 658 mn representing impairment of equity investments in Tata Teleservices Ltd. (TTSL)

© 2015 Tata Communications Ltd. All rights reserved. TATA COMMUNICATIONS and
TATA are trademarks of Tata Sons Limited in certain countries.
www.tatacommunications.com | @tata_comm
http://tatacommunications-newworld.com | www.youtube.com/user/tatacomms
INR MnFinancial Performance by Segment –FY 2016
Average Rs/$ Exchange rate: FY15 at 61.13; FY16 at 65.44
Average Rs/ZAR Exchange rate: FY15 at 5.53; FY16 at 4.80
31
FY15 Startup financials include an other income from profit on sale of customer premise equipment amounting to ZAR 126 million.
Q3 FY16 Startup financials include an one time depreciation impact of ZAR 52 mn, Q4 EBITDA down on account of lower project revenues of Zar 30mn
and one time costs of Zar 60mn
FY15 FY16 FY15 FY16 FY15 FY16
Gross Revenues 1,77,675 1,86,530 21,415 19,018 1,99,090 2,05,548
Y-o-Y Growth 5.0% -11% 3.2%
EBITDA 24,245 26,823 5,652 3,512 29,897 30,335
Y-o-Y Growth 10.6% -38% 1.5%
EBIT 4,859 6,385 3,427 1,205 8,286 7,590
Y-o-Y Growth 31.4% -64.9% 91.6%
PBT 2,778 2,286 957 -1,826 3,734 460
PAT after Minority Interest -942 -296 955 -1,822 13 -2,118
PAT (without exceptional
Items) 110 2,290 955 -1,822 1,065 468
CORE STARTUP CONSOLIDATED
* PBT refers to PBT without exceptions

© 2015 Tata Communications Ltd. All rights reserved. TATA COMMUNICATIONS and
TATA are trademarks of Tata Sons Limited in certain countries.
www.tatacommunications.com | @tata_comm
http://tatacommunications-newworld.com | www.youtube.com/user/tatacomms
FY15 FY16 FY15 FY16
Gross Revenues 87,761 80,559 89,914 1,05,971
Y-o-Y Growth -8.2% 17.9%
Net Revenue 12,445 10,893 63,901 75,083
Y-o-Y Growth -12.5% 17.5%
EBITDA¹ 6,360 4,822 17,886 22,001
EBITDA Margin % 7.2% 6.0% 19.9% 20.8%
EBIT ¹ 4,333 3,096 526 3,289
EBIT Margin % 4.9% 3.8% 0.6% 3.1%
Global Voice
Services
(GVS)
Global Data Services
(GDS)
Core Business by Business Unit – FY 2016
-8.2% 17.9%
-12.5% 17.5%
INR Mn
¹ Management estimates based on internal MIS and cost allocation assumptions
32
Average Rs/$ Exchange rate: FY15 at 61.13; FY16 at 65.44

© 2015 Tata Communications Ltd. All rights reserved. TATA COMMUNICATIONS and
TATA are trademarks of Tata Sons Limited in certain countries.
www.tatacommunications.com | @tata_comm
http://tatacommunications-newworld.com | www.youtube.com/user/tatacomms
Revenue From Operations
Operating EBITDA (% of Gross Revenue)
0.9% Q-o-Q
48,11250,995 51,454
Q4 FY15 Q3 FY16 Q4 FY16
7,173 7,598 7,665
14.9% 14.9% 14.9%
-
2,000
4,000
6,000
8,000
10,000
Q4 FY15 Q3 FY16 Q4 FY16
6.9% Y-o-Y
Consolidated Financial Performance – Q4 FY 2016
33
INR Mn
Revenue from Operations
Revenue From OperationsOperating EBITDA and margins (% of gross revenue)
Q4 FY
2015Particulars
Q3 FY
2016
Q4 FY
2016
48,112 Revenue from operations 50,995 51,454
7,173 Operating EBITDA 7,598 7,665
14.9% Operating EBITDA % 14.9% 14.9%
1,556 Operating EBIT 1,691 2,113
3.2% Operating EBIT % 3.3% 4.1%
431 PBT 69 1,314
0.9% PBT (% of total income) 0.1% 2.6%
-1,783 PAT 219 -2,059
-3.7% PAT (% of total income) 0.4% -3.9%
0.9% Q-o-Q
6.9% Y-o-Y
* PBT refers to PBT without exceptions

© 2015 Tata Communications Ltd. All rights reserved. TATA COMMUNICATIONS and
TATA are trademarks of Tata Sons Limited in certain countries.
www.tatacommunications.com | @tata_comm
http://tatacommunications-newworld.com | www.youtube.com/user/tatacomms
INR MnFinancial Performance by Segment – Q4 FY 2016
34
Q4 FY
2015
Q3 FY
2016
Q4 FY
2016
Q4 FY
2015
Q3 FY
2016Q4 FY 2016
Q4 FY
2015
Q3 FY
2016
Q4 FY
2016
Gross Revenues 43,457 46,787 47,786 4,655 4,208 3,668 48,112 50,995 51,454
Y-o-Y Growth 10.0% -21.2% 6.9%
Q-o-Q Growth 2.1% -12.8% 0.9%
EBITDA 6,175 6,714 7,395 998 884 270 7,173 7,598 7,665
Y-o-Y Growth 19.7% -72.9% 6.9%
Q-o-Q Growth 10.1% -69.4% 0.9%
EBIT 1,120 1,525 2,381 436 165 -268 1,556 1,691 2,113
PBT 754 762 2,173 -323 -694 -859 431 69 1,314
PAT after Minority Interest -1,459 910 -1,202 -323 -692 -857 -1,783 219 -2,059
CORE STARTUP CONSOLIDATED
QoQ EBITDA ~ down 69.4%: One time revenue & cost adjustments
Average Rs/$ Exchange rate: Q4 FY15 at 62.26; Q3 FY16 at 65.9 ; Q4 FY16 at 67.52
Average Rs/ZAR Exchange rate:Q4 FY15 at 5.31; Q3 FY16 at 4.67 ; Q4 FY16 at 4.26* PBT refers to PBT without exceptions
Q3 FY16 Startup financials include an one time depreciation impact of ZAR 52 mn, Q4 EBITDA down on account of lower project revenues of Zar 30mn and one time costs of Zar 60mn
© 2015 Tata Communications Ltd. All rights reserved. TATA COMMUNICATIONS and
TATA are trademarks of Tata Sons Limited in certain countries.
www.tatacommunications.com | @tata_comm
http://tatacommunications-newworld.com | www.youtube.com/user/tatacomms
Q4 FY
2015
Q3 FY
2016Q4 FY 2016 Q4 FY 2015 Q3 FY 2016
Q4 FY
2016
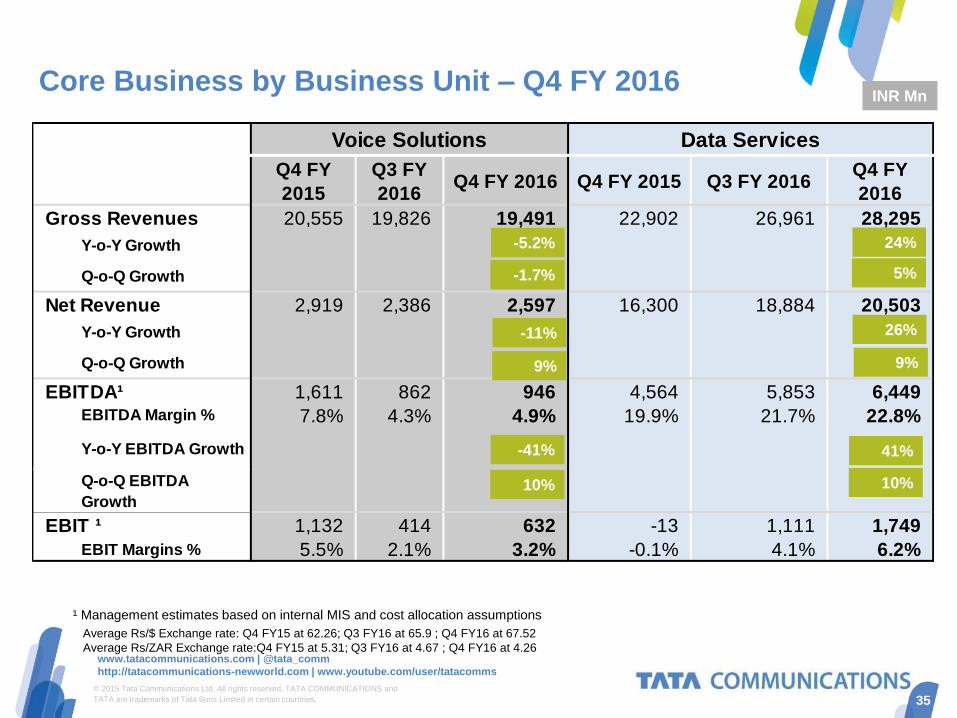
Gross Revenues 20,555 19,826 19,491 22,902 26,961 28,295
Y-o-Y Growth -5.2% 24%
Q-o-Q Growth -1.7% 5%
Net Revenue 2,919 2,386 2,597 16,300 18,884 20,503
Y-o-Y Growth -11% 26%
Q-o-Q Growth 9% 9%
EBITDA¹ 1,611 862 946 4,564 5,853 6,449EBITDA Margin % 7.8% 4.3% 4.9% 19.9% 21.7% 22.8%
Y-o-Y EBITDA Growth -41% 41%
Q-o-Q EBITDA
Growth10% 10%
EBIT ¹ 1,132 414 632 -13 1,111 1,749
EBIT Margins % 5.5% 2.1% 3.2% -0.1% 4.1% 6.2%
Voice Solutions Data Services
Core Business by Business Unit – Q4 FY 2016
-5.2%
-1.7%
-11%
9%
¹ Management estimates based on internal MIS and cost allocation assumptions
INR Mn
35
-41%
10%
24%
5%
26%
9%
41%
10%
Average Rs/$ Exchange rate: Q4 FY15 at 62.26; Q3 FY16 at 65.9 ; Q4 FY16 at 67.52
Average Rs/ZAR Exchange rate:Q4 FY15 at 5.31; Q3 FY16 at 4.67 ; Q4 FY16 at 4.26

© 2015 Tata Communications Ltd. All rights reserved. TATA COMMUNICATIONS and
TATA are trademarks of Tata Sons Limited in certain countries.
www.tatacommunications.com | @tata_comm
http://tatacommunications-newworld.com | www.youtube.com/user/tatacomms
Key Take Away
36
Data services business demonstrates strong growth trajectory
YoY growth in FY16 revenues 18%, EBITDA growth of 23% with margin at 20.8%
New & Innovation services growing at 31% YoY
Sequential margin expansion over four quarters ending the year with Q4 margins at 22.8%
FCF (EBITDA less Capex) generation of $86mn, significant YoY growth of 145%
Q4 margin for the core business, at an all time high of 15.5 %, benefit of operating leverage demonstrating
strong growth
Muted growth in voice due to industry head winds
Interest rates at an all time low of 3.14% for Q4 FY16, & 3.4% for FY16
Deleveraging initiated with announcement of strategic investor for data center business
Improvement in RoCE from 5.4 % in FY15 to 7.3% in FY16
Declared dividend of Rs 4.30 per share
Negative net worth driven by exception items as a result of uncontrollable factors
Movement of exchange rates from 62.55/USD to 66.25/USD between 31-Mar-15 & 31-Mar-16 hitting FCTR by
Rs 3,373mn, impacting our reserves & surplus adversely
Employee cost optimization Rs 1,028 mn
Impairment of Neotel Goodwill Rs 900 mn
Impairment of Tata Teleservices Ltd investments Rs 658mn

37
© 2015 Tata Communications Ltd. All rights reserved. TATA COMMUNICATIONS and TATA are trademarks of Tata Sons Limited in certain countries.
www.tatacommunications.com | @tata_comm
http://tatacommunications-newworld.com | www.youtube.com/user/tatacomms
Thank you
Visit tatacommunications.com
Follow us on Twitter, our New World Blog and YouTube:
@tata_comm
http://tatacommunications-newworld.com
www.youtube.com/user/tatacomms