presentation of q4 and fy 2020/21 results
TRANSCRIPT

Finnur Oddsson, CEOGuðrún Eva Gunnarsdóttir, CFO
11th May 2021
Presentation of Q4 and FY 2020/21 results
*This presentation is translated from the Icelandic version which was published on May 11th, 2021. Should there be discrepancies between the two versions, the Icelandic version will take priority over the translated version.

Overview
2
Highlights from operations
Financial statement
Status and prospects

Quarter in a nutshell: Key figuresQ4 2020/21 (changes from Q4 2019/20)
30.6 b.ISK.
sales
2.5 b. ISK.
EBITDA
846m.ISK.profit
gross margin
22.9% 40.9%15.1%equity rsatiosalaries- and costs ratio
0.4% points 1.7% points
7.0%
0.2% points
18% 20%
3

Financial year in a nutshell: Key figuresFY 2020/21 (changes from FY 2019/20)
119.6 b.ISK.
sales
8.8 b.ISK.
EBITDA
2.5 b.ISK.profit
gross margin
22.2% 40.9%15.2%equity ratiosalaries- and costs ratio
1,0% 17,5%
1,7%points
2.8%
0,2%points0,0% points
4

5
Strong operations in the quarter and good results for the operational year, after weak results in the first quarter.
The COVID period and increased disease control in all fields of operations. The constant adjustment of the operation went well thanks to vigorous employees standing their shift throughout the pandemic.
The COVID-19 has a significant impact on the Group's operations, results vary by divisions. Increased costs across the Group, estimated between 300-350 m.ISK in the year.
Gross margin measured in ISK grows a little between the years but the ratio is unchanged (22.2%).
Hagar‘s operations fully carbon offset in the year.
Strategy implementation in progress and on schedule, with clear objectives for the current operating year.
Strong operations in pandemic

6
Recent examples: Sale of Útilíf and Reykjavík Apótek

7
Recent examples: Optimisation and changes at Olís
In response to the COVID negative impact on Olís operations, variety of actions have been implemented in the last months, such as: Changes at service stations, regarding service levels and
opening hours Service stations at Hamraborg and at Klöpp changed to
self service stations Work commenced on restructuring of Olís branch network Office optimisation Quiznos in Iceland closed Stórkaup closed and part of the selection transferred to
Hagkaup These changes have led to the decrease of full-time equivalents
at Olís of about 17,5% between the years, from 412 to 340.

8
Recent examples: Hagar‘s innovation fund, Uppsprettan
Uppsprettan is a new innovation fund on behalf of Hagar which was introduced at Hagar‘s Innovation Day in April.
The assignment of the fund is to mobilise and support entrepreneurs in innovation and development in Icelandic food production.
The fund emphasises support for producers who respect sustainability and support domestic production.
It is estimated that ten million will be allocated by the this year, but the amount might increase next time.

Strong quarter Q4 where sales from groceries, specialty goods and warehouses increased by 17% between the years and amounted to 25.6 b.ISK.EBITDA was 2.1 b.ISK. (8.2%).
Sales in the financial year increased by 13% and amounted to 91,7 b.ISK. EBITDA amounted to 7.5 b.ISK. (8.2%)
Similar sales increase between years at Aðföng. Increased efficiency at Aðföng. Operating costs
increase, percentage wise, less than quantity. Strong operational year at Bananar. The percentage of
sales from 3rd parties is lower due to COVID, but is gaining momentum.
Good results from specialty store operations Útilífand ZARA, and considerable sales increase. Little impact on Hagar’s total sales.
Retail and warehouses : Sales and activity never higher
9
Financial statement 12M 2020/21 (b.ISK.)
12M '20/2112M '19/20 Δ %Δ
Sales 91,7 80,8 +10,8 +13%Growth -84,2 -73,9 -10,3 +14%EBITDA 7,5 6,9 +0,6 +8%EBITDA % 8,2% 8,6% -0,4% -4%EBIT 4,4 3,9 +0,4 +11%EBIT % 4,8% 4,8% -0,1% -2%

10
Sales in Q4 amounted to little less than 16 b.ISK. which is considerably more than planned and former years. Total sales in the operational year amounted to 61.5 b.ISK., also more than planned and former years.
Gross margin stronger in the quarter but still under long term objectives. Weak exchange rate and increased production and transportation costs.
Increased price competition in the market. As before emphasis on efficiency in operations and price. Extensive costs due to COVID-19 in visitor’s counting and
infection control. Outstanding results in environmental matters and
recycling, with environmentally friendly refrigerants, less plastic use, less food waste and increased sorting.
Excellent cooperation with Icelandic producers. 90% of meat in Bónus is Icelandic product from Icelandic meat producers.
Largest operational year in Bónus‘ history

Sales in Q4 amounted to just over 6 b.ISK. and was considerably higher than planned and in previous years. Sales for the operating year as a whole amounted to 21 b.ISK., also in excess of estimates and previous years.
Gross margin rate in line with plans, but results better. Visitors‘ number restrictions due to COVID-19 had a
major impact over the holidays, with queues forming outside stores.
Changed emphasis in stores well received, e.g. larger toy, cosmetics and household goods departments in all stores.
Theme days never more popular, e.g. Tax Free, American and Danish days.
Continued emphasis on the development of semi-finished and prepared dishes.
Strong year in Hagkaup's operations, number of new customers.
Citizens rediscover Hagkaup
11

12
Sales at Q4 amounted to 6,8 b.ISK. and decreases by 8% between years. EBITDA amounted to just over 400 m.ISK. (6,4%) and doubled between years.
Sales in the operational year amounted to 30,5 b.ISK. and decreased by 17%. EBITDA amounted to 1.3 b.ISK. (4,2%) and is 34% less.
Despite the decline in fuel sales then other product sales remained unchanged.
Changes in operational criteria for short and long term : COVID-19, changed consumption pattern, more fuel-efficient vehicles and new energy sources.
Optimisation measures, f.ex. simplified service levels and fewer employees, returned operational improvements by the end of the year.
Actions also prepare Olís for changed market conditions in the coming years.
Analysis how to utilise Olís excess properties and sites in the future. Negotiations with the City of Reykjavík for the reduction of petrol stations have progressed a long way.
Financial statement 12M 2020/21 (b. ISK.)Olíuverzlun Íslands: Operations strengthen at end of the year
12M '20/2112M '19/20 Δ %Δ
Sales 30,5 36,9 -6,4 -17%Growth -29,3 -35,0 +5,7 -16%EBITDA 1,3 2,0 -0,7 -34%EBITDA % 4,2% 5,3% -1,1% -20%EBIT 0,3 1,2 -0,9 -74%EBIT % 1,0% 3,2% -2,2% -68%

Overview
13
Highlights from operations
Financial statement
Status and prospects

14
Q4 sales growth and improved profitability
Sales increase about 7% between years or of about 2,0 b. ISK.
Gross margin increases about 9% and margin ratio increases from 22.5% to22.9%.
Gross margin ratio of Bónus and Hagkaup under expectations but Olísincreases between years.
Salaries increase due to contractual wage raise and increased labour costs due to COVID-19.
EBITDA results increases about 18% from previous year. EBITDA-ratio now 8.3% but was 7.5% last year.
Total profit increases of about 20% between years.
Consolidated Financial Statement Q4 2020/21 (b.ISK.)
Q4 '20/21 Q4 '19/20 Δ %Δ
Sales 30,6 28,6 2,0 +7%
Gross profit 7,0 6,4 +0,6 +9%
Other operating income 0,1 0,1 0,0 +31%
Salaries -3,3 -3,1 -0,2 +7%
Other operating expenses -1,3 -1,3 0,0 +2%
EBITDA 2,5 2,2 +0,4 +18%
Depriciation -1,1 -1,0 -0,1 +8%
Net finance expense -0,3 -0,3 -0,1 +18%
Profit for the period 0,8 0,7 +0,1 +20%
15
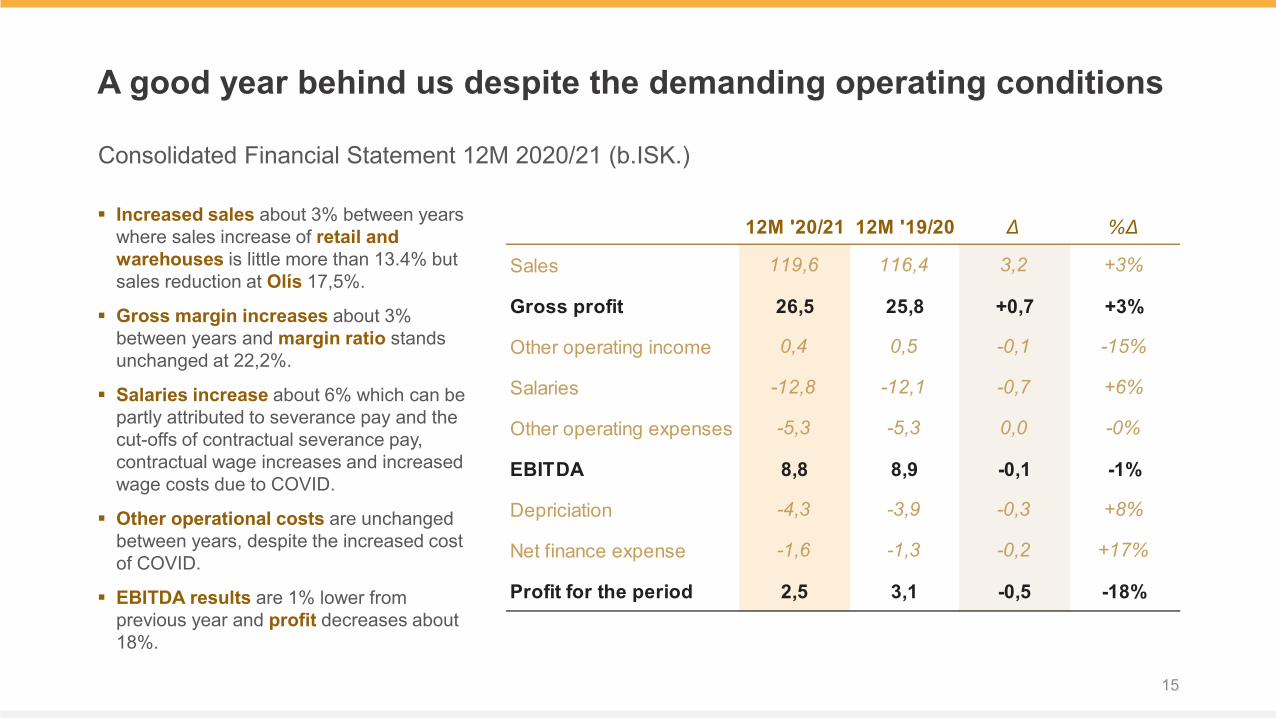
A good year behind us despite the demanding operating conditions
Increased sales about 3% between years where sales increase of retail and warehouses is little more than 13.4% but sales reduction at Olís 17,5%.
Gross margin increases about 3% between years and margin ratio stands unchanged at 22,2%.
Salaries increase about 6% which can be partly attributed to severance pay and the cut-offs of contractual severance pay, contractual wage increases and increased wage costs due to COVID.
Other operational costs are unchanged between years, despite the increased cost of COVID.
EBITDA results are 1% lower from previous year and profit decreases about 18%.
Consolidated Financial Statement 12M 2020/21 (b.ISK.)
12M '20/21 12M '19/20 Δ %Δ
Sales 119,6 116,4 3,2 +3%
Gross profit 26,5 25,8 +0,7 +3%
Other operating income 0,4 0,5 -0,1 -15%
Salaries -12,8 -12,1 -0,7 +6%
Other operating expenses -5,3 -5,3 0,0 -0%
EBITDA 8,8 8,9 -0,1 -1%
Depriciation -4,3 -3,9 -0,3 +8%
Net finance expense -1,6 -1,3 -0,2 +17%
Profit for the period 2,5 3,1 -0,5 -18%

16
Sales increase in recent years, but the margin ratio is declining
Sales & grossmargin
Operatingcost
Profit
9,7 11,0 10,9 10,4 10,7
Sales (billion ISK)
7,55,6 5,3
7,6 7,4
2019/202016/17 2017/18 2020/212018/19
7,9 8,6 7,94,6 4,4
5,03,2 2,8 2,6 2,1
2020/212019/202018/192016/17 2017/18
119,673,980,5 84,2
116,4 24,8 24,8 23,8 22,2 22,2
Gross margin (%)
Salaries (%) Other operating cost (%)
EBITDA (%) Profit (%)
Effects of Olís on the Group’s sales first appeared in Q4 2018/19.
Gross margin has decreased in recent years, partly due to the changed structure of the company.
Salaries and cost ratio in order despite extensive challenges associated with COVID-19.
EBITDA ratio was 7.4% compared to 7.6% in previous year.
Impact of IFRS16 Leases on operational costs and EBITDA about 2.2 to 2.3 b.ISKannually but the impact of IFRS 16 appear first in 2019/20.
Profit ratio was 2.1% compared to 2.6% in previous year.
Operational key factors (12M 2016/17 – 12M 2020/21)

Profit for the period
Adjustments
Working Capital
Change in current assets
Change in current liabilities
Interest and taxes paid
Cash provided by operating activities
Investing activities
Financing activities
Change in cash
17
-1,7
2,5
6,6
6,3
8,8
-3,6
-0,5
0,1
-4,9
-1,8
Change in operating assets in the previous year can be traced to changes in April 2019 due to the settlement method of credit cards.
Cash from operations decreases therefore in comparison with previous year of about 3,2 b.ISK.
Investment in properties 1,9 b.ISK. in the year and investment in fixtures and equipment 2,0 b.ISK.
Dividend not paid to shareholders in the year, for the last operational year, but last year dividend amounted to just about 1,2 b.ISK.
Own shares purchased for 1.9 b. ISK. in the operating year, whereof 1.5 b. ISK from the last Annual Meeting.
Net cash decreases about 1.8 b.ISK in the operating year.
-5,2
9,8
-2,1
1,9
3,1
5,8
8,8
1,2
-3,1
1,5
0,5
-2,4
-3,2
-1,1
0,4
-1,8
1,6
-3,3
Change12M 2020/21 12M 2019/20
-0,6
-
Net cash decreases slightly during the operating year
Cash flow overview 12M 2020/21 (b.ISK.)

18
The company's financial position is strong
Fixed assets increased by 1.4 b.ISK. due to investments in properties and renovation of stores.
Inventory at the end of the period was 8,8 b. ISK and inventory turnover rate 10.8. Inventory increase by 411 m.ISK. between years.
Trade receivables increase by 530 m.ISK. and the credit period for claims is now 10.3 days, compared to 13.6 days last year.
Interest-bearing current liabilities increase as the non-indexed bond series in the amount of 2.5 b.ISK is due next October.
Drawing on the credit line 601 m.ISK. at the end of the year, while the USD credit line in the amount of 1.3 b.ISK. was repaid during the year.
Balance sheet February 28, 2021 (b.ISK.)
28. 2. 2021
29. 2. 2020 %Δ
28. 2. 2021
29. 2. 2020 %Δ
Property, plant and equipment 23,4 22,0 +7% Borrowings 9,4 12,2 -23%
Intangible assets 10,5 10,5 +0% Lease liabilities 7,0 8,0 -12%
Other non-current assets 13,8 15,0 -8% Income tax 2,2 2,2 +1%
Non-current assets 47,8 47,6 +1% Non-current liabilities 18,6 22,4 -17%
Inventories 8,8 8,4 +5% Borrowings 3,6 1,7 +107%
Trade receivables 4,7 4,5 +2% Trade payables 11,8 11,1 +6%
Cash 0,4 2,2 -83% Other 2,5 2,9 -14%
Current assets 13,8 15,2 -9% Current liabilities 17,9 15,8 +13%
Total assets 61,6 62,7 -2% Total liabilities 36,5 38,1 -4%
Liabilities and equity 61,6 62,7 -2% Total equity 25,2 24,6 +2%

19
Profitability less than comparative periods but risk limited
Share-holder return
Risk inoperations
Efficiencyof assets
0,2 0,7
2,7 2,5 2,4
Return on equity (%)
17,0 16,623,1
17,6 14,0
2018/192016/17 2017/18 2020/212019/20
1,23 1,060,81 0,96 0,77
2,7 2,5 2,1 2,0 1,9
2019/202016/17 2017/18 2018/19 2020/21
24,713,7 12,9 12,6 10,2
57,8 61,147,7 39,2 40,9
Equity ratio (%)
Net debt/EBITDA1 Current ratio2
Cash conversion cycle (days)3 Assets turnover ratio4
1) Net interest bearing liabilities / EBITDA 2) Current assets / current liabilities 3) Turnover rate in operations = number of inventory days + number of days for accounts receivable - number of days for accounts payable 4) Sales / assets
Return on equity 10,2% last 12 months.
Equity ratio at year end was 40.9% compared to 39.2% the end of last year.
Net interest-bearing debt at year end, including leasing debts, was 21.6 b.ISK. or 2,4 x EBITDA.
Net interest-bearing debt at year end, excluding leasing debts, was 1.4 x EBITDA.
Current ratio at year end 0,77. The company has access to 6.2 b.ISK. credit lines in ISK and USD.
Cash conversion cycle during the year 14.0 days compared to 17.6 days for the previous year.
Assets turnover ratio 1.9 at year end compared to 2.0 at end of year 2019/20.
Economical key factors (12M 2016/17 – 9M 2020/21)

Overview
20
Highlights from operationsFinancial statement
Status and prospects

Market price and largest shareholders
21
30
40
50
60
70
1.1.20181.7.2016 1.1.2017 1.7.2017 1.7.2018 1.1.2019 1.7.2019 1.1.2020 1.7.2020 1.1.2021
Date
Market price
Gildi - Pension fund LV – Pension Fund of Commerce LSR – Pension Fund A for State Employees Birta Pension Fund Stapi Pension Fund
17.0%11.1%9.8%7.0%5.6%
Largest shareholders (1-5), shared at closing 28.2.2021
Samherji Ltd. Festa - Pension Fund Icelandic securities - accounts Brú Pension Fund SL Pension Fund
4.3%4.2%3.4%3.2%2.8%
Largest shareholders (6-10), shared at closing 28.2.2021
Source: NASDAQ OMX (4th May 2021)

22
The operational year 2021/22 commences with a good start. The Management’s guidance for the year is that EBITDA will be between 8.6 to 9.1 b.ISK.
Lines clearing up on the progress of COVID in the coming months. It is estimated that the operational impact of the pandemic will continue until the autumn and will be in that way similar to recent months.
Expectations of a strong tourist summer with countrymen in the focus, but uncertainty about the development of tourism trade to and from Iceland in the autumn.
Hagar’s and subsidiaries strong standing to cope with the challenges due to the pandemic and changed customers needs.
Continued follow-up to new strategic emphases, a.o. Hagar’s branding, operational efficiency and increased investment in technology solutions.
Status and prospects


Disclaimer
24
On behalf of Hagar, attention is drawn to that the statements and information in thispresentation are based on, as appropriate, the plans and estimates of the company'sdirectors, but not on facts that may be verified at the publication of the presentation or byany discussion by the company of the presentation. For these reasons the said statementsand information constitute a degree of uncertainty.
Further the attention of investors is directed to the fact that many factors may have sucheffect that the operational environment and the performance of the company will turn outdifferently to what is stated in the presentation. The presentation will not be reviewed,revised, updated or changed to that effect by the company after its publication.
Statements and information in this presentation apply only up to the point in time when itwas published and the importance of these are limited to what is stated in thesereservations.
