presentation of the q4/2020 and fy 2020 results
TRANSCRIPT

Presentation of the Q4/2020 and FY 2020 resultsMartin Lindqvist, President & CEOHåkan Folin, CFO
January 29, 2021
Agenda
2
►Q4 and FY 2020
►Financials
►Outlook and summary
►Q&A

Q4 and FY 2020 in brief
3

SSAB concludes IJmuiden discussions with Tata Steel
4
► After deeper analysis and discussions – limited possibilities to integrate IJmuiden into the framework of SSAB’s strategies
► Acquisition would be difficult for technical reasons. Synergies would not fully justify the costs for our desired transformation to fossil free – transaction would not meet our financial expectations
► Discussions have now ended
Photo connected to sustainability
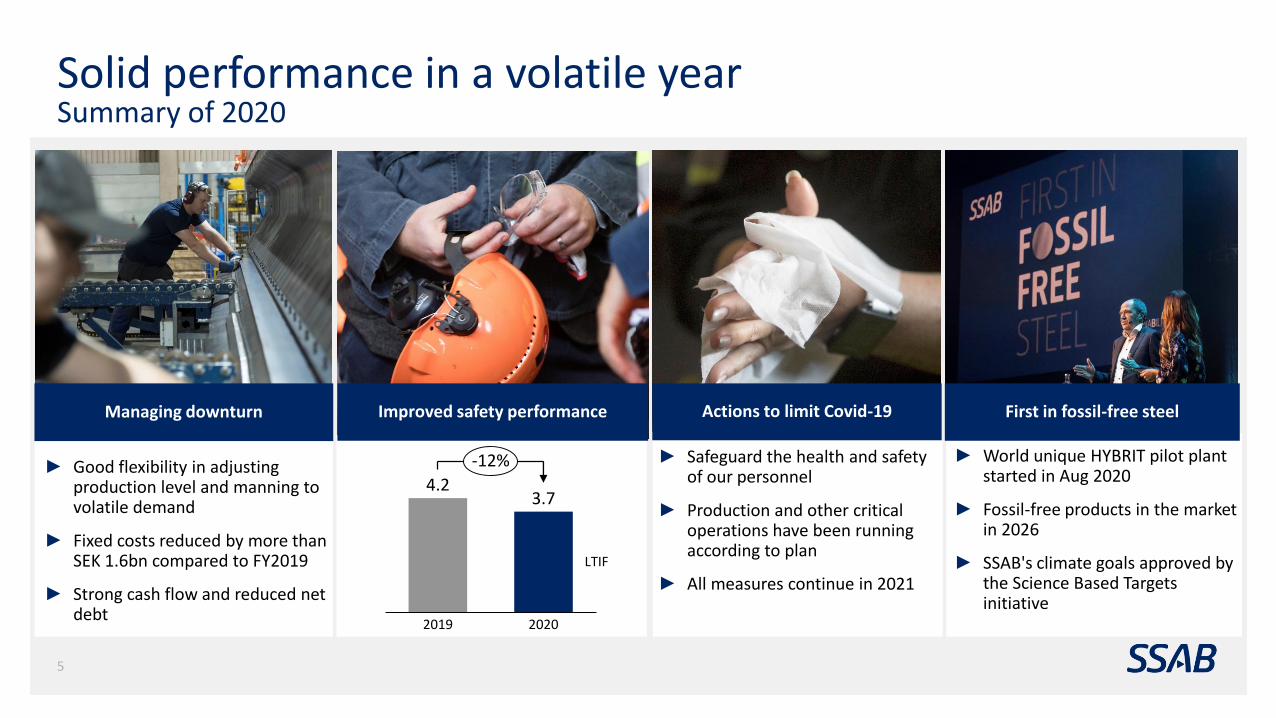
Solid performance in a volatile yearSummary of 2020
5
Managing downturn Actions to limit Covid-19 Improved safety performance First in fossil-free steel
4.2
2019 2020
LTIF
3.7
-12% ► Safeguard the health and safety of our personnel
► Production and other critical operations have been running according to plan
► All measures continue in 2021
► Good flexibility in adjusting production level and manning to volatile demand
► Fixed costs reduced by more than SEK 1.6bn compared to FY2019
► Strong cash flow and reduced net debt
► World unique HYBRIT pilot plant started in Aug 2020
► Fossil-free products in the market in 2026
► SSAB's climate goals approved by the Science Based Targets initiative

Q4/20 – Better capacity utilization and higher shipments
6
Crudeproduction
Shipments
EBIT
Ktonnes
SEK million
Net cash flow
► Market recovered during autumn
► Better capacity utilization− Idled BF in Raahe started end of Sep
− Stable production in Oxelösund
► EBIT SEK 557m (-1,131m) in Q4
► Strong net cash flow supported by release of working capital
1,976 1,9022,1002,0001,621
2,0811,779 1,519
2,156
+42%
1,744 1,6141,7221,634 1,4791,787
1,422 1,4721,779
+21%
300 343
-251
-973
5571,035
1,6741,316
-1,131
503 398 387
-751
48 27
19Q418Q4 19Q219Q1 20Q3
2,856
19Q3 20Q1
-1,577
20Q2 20Q4
1,585
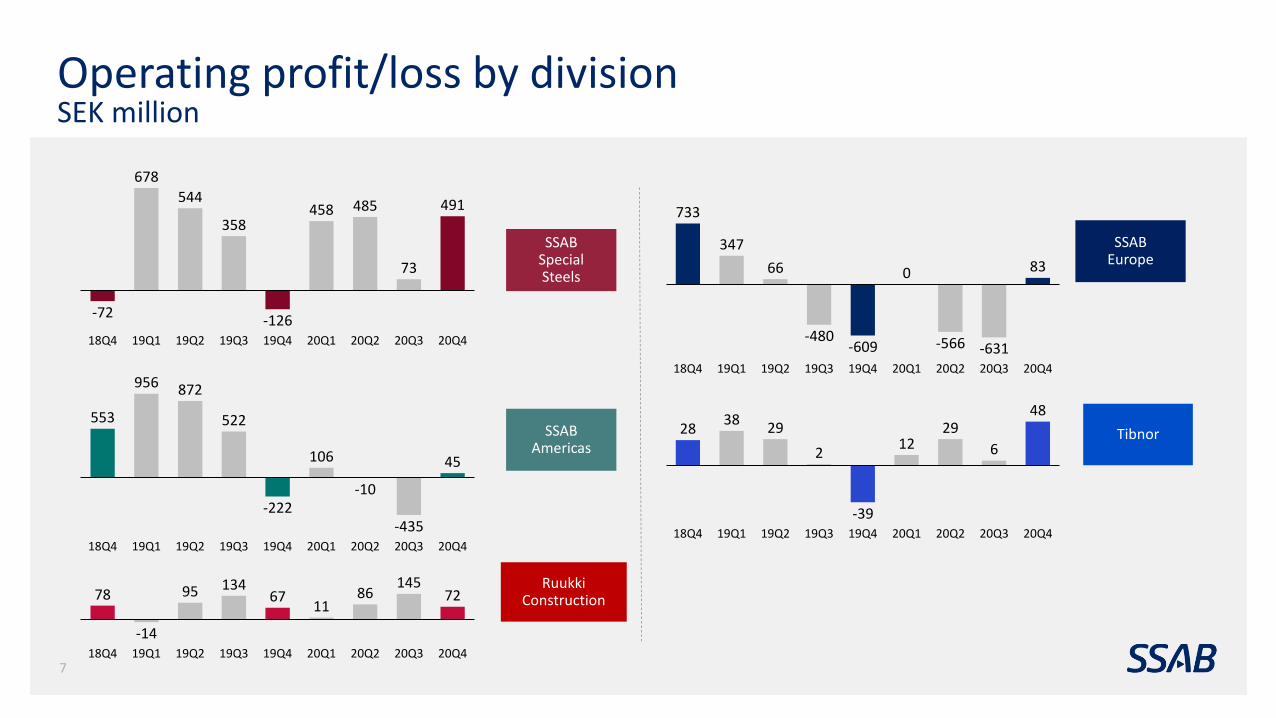
Operating profit/loss by divisionSEK million
7
-72
678
544
358
-126
458 485
73
491
18Q4 19Q419Q1 20Q219Q2 19Q3 20Q320Q1 20Q4
SSAB Special Steels
SSAB Europe
SSAB Americas
733
347
66
-480-609 -566 -631
83
18Q4 19Q219Q1 20Q119Q419Q3 20Q320Q2 20Q4
0
553
956 872
522
-222
106
-10
-435
45
20Q219Q118Q4 19Q2 19Q3 19Q4 20Q320Q1 20Q4
Tibnor2838
29
2
-39
1229
6
48
20Q119Q419Q3 20Q218Q4 19Q1 19Q2 20Q3 20Q4
Ruukki Construction78
-14
95 13467
1186
14572
18Q4 20Q219Q419Q1 19Q2 20Q119Q3 20Q3 20Q4

SSAB Special SteelsImproved margin for FY2020 despite Covid-19
8
► Shipments recovered in Q4
− Up 15% vs. Q3/20 and 19% vs. Q4/19
► Q4 EBIT increased to SEK 491m (-126m)
− Better capacity utilization and higher volumes
− No maintenance in Q4/20
► FY2020
− Shipments decreased to 1.1 (1.2) Mtonnes
− EBITDA margin improved to 13.2% (11.3%)
− Fixed costs reduced by around SEK 480m vs. 2019 and stable production performance
536
-72
678
544
358
-126
458 485
73
491
19Q118Q3 20Q219Q418Q4 20Q119Q2 19Q3 20Q3 20Q4
145
89
145130 134
83
151 156
60
117
Q3/18 Q3/20Q2/19Q4/18 Q1/19 Q3/19 Q4/19 Q1/20 Q2/20 Q4/20
Operating profit/loss, SEK million
Rolling production Oxelösund, ktonnes
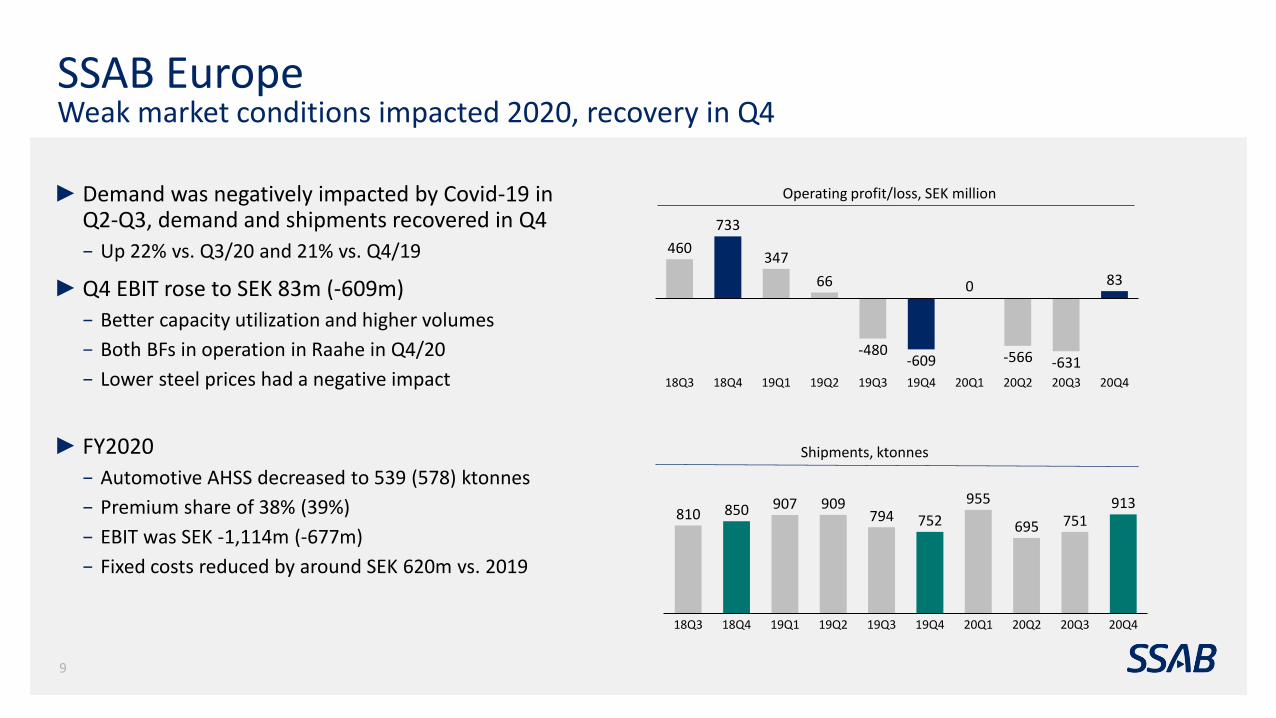
SSAB EuropeWeak market conditions impacted 2020, recovery in Q4
9
► Demand was negatively impacted by Covid-19 in Q2-Q3, demand and shipments recovered in Q4
− Up 22% vs. Q3/20 and 21% vs. Q4/19
► Q4 EBIT rose to SEK 83m (-609m)
− Better capacity utilization and higher volumes
− Both BFs in operation in Raahe in Q4/20
− Lower steel prices had a negative impact
► FY2020
− Automotive AHSS decreased to 539 (578) ktonnes
− Premium share of 38% (39%)
− EBIT was SEK -1,114m (-677m)
− Fixed costs reduced by around SEK 620m vs. 2019
810 850 907 909794 752
955
695 751913
19Q319Q218Q3 18Q4 19Q1 20Q219Q4 20Q1 20Q3 20Q4
Operating profit/loss, SEK million
Shipments, ktonnes
460
733
347
66
-480-609 -566 -631
83
19Q318Q3 19Q419Q218Q4 19Q1 20Q1 20Q2 20Q3 20Q4
0

SSAB AmericasWeak market conditions impacted FY2020, recovery in Q4
10
► Demand was negatively impacted by Covid-19 in Q2-Q3, demand and shipments recovered in Q4
− Up 23% vs. Q3/20 and 19% vs. Q4/19
► Q4 EBIT rose to SEK 45m (-222m)
− Better capacity utilization and higher volumes
− Maintenance in Q4/19
− Lower steel prices and higher scrap cost
► FY2020
− EBIT was SEK -293m (2,128m)
− Significantly lower margins
− Fixed costs reduced by around SEK 270m
− Premium share 30% (33%)
790553
956 872
522
-222
106
-10
-435
45
19Q118Q3 18Q4 19Q2 20Q119Q3 20Q219Q4 20Q3 20Q4
25
3931
10
-14
-26 -30 -27-22
-11
18Q3 20Q118Q4 19Q219Q1 19Q3 19Q4 20Q2 20Q3 20Q4
Change in realized prices y/y, %
Operating profit/loss, SEK million

TibnorRestructuring program improved margins
11
► The market recovered in Q4, especially in Sweden and Finland
► Revenue was up by 16% vs. Q3/20
► Q4 EBIT rose to SEK 48m (-39m)
− Higher volumes
− Cost savings from the restructuring program
► FY2020
− EBIT improved to SEK 96m (30m)
− Positive effects from the restructuring program
53
2838
29
2
-39
12
29
6
48
19Q118Q3 19Q418Q4 20Q119Q2 19Q3 20Q2 20Q3 20Q4
1,92,2 2,3
2,52,2 2,2
2,42,0
1,82,0
19Q4 20Q318Q3 18Q4 20Q419Q1 19Q2 20Q219Q3 20Q1
Operating profit/loss, SEK million
Revenue, SEK billion

Ruukki ConstructionStable construction market in 2020, positive margin trend
12
► Comparable revenue on stable level, seasonally lower vs. Q3/20
► Q4 EBIT improved to SEK 72m (67m)
− Better volumes in Roofing
► FY2020
− EBIT increased to SEK 314m (283m)
− Focus on product business improved margin, Building Systems was divested in Q2/20
10378
-14
95
134
67
11
86
145
72
19Q419Q118Q3 19Q218Q4 19Q3 20Q1 20Q2 20Q3 20Q4
1,8 1,7
1,3
1,7 1,8 1,81,5 1,4 1,4
1,2
20Q218Q3 18Q4 19Q1 19Q419Q2 19Q3 20Q1 20Q3 20Q4
Operating profit/loss, SEK million
Revenue, SEK billion
Financials
13

Better capacity utilization and higher shipments improved the result
14
Sales
EBITDA and EBITDA margin2
Shipments1
EBITDA per tonne delivered steel2
1) Including the steel operations: Special Steels, Europe and Americas
2) Excluding items affecting comparability
0
5 000
10 000
15 000
20 000
25 0001
6Q
1
16
Q2
16
Q3
16
Q4
17
Q1
17
Q2
17
Q3
17
Q4
18
Q1
18
Q2
18
Q3
18
Q4
19
Q1
19
Q2
19
Q3
19
Q4
20
Q1
20
Q2
20
Q3
20
Q4
2016 2017 2018 2019 2020
SEK
mill
ion
0200400600800
1 0001 2001 4001 6001 8002 000
16
Q1
16
Q2
16
Q3
16
Q4
17
Q1
17
Q2
17
Q3
17
Q4
18
Q1
18
Q2
18
Q3
18
Q4
19
Q1
19
Q2
19
Q3
19
Q4
20
Q1
20
Q2
20
Q3
20
Q4
2016 2017 2018 2019 2020
kto
ns
-2,0 %
0,0 %
2,0 %
4,0 %
6,0 %
8,0 %
10,0 %
12,0 %
14,0 %
-500
0
500
1 000
1 500
2 000
2 500
3 000
16
Q1
16
Q2
16
Q3
16
Q4
17
Q1
17
Q2
17
Q3
17
Q4
18
Q1
18
Q2
18
Q3
18
Q4
19
Q1
19
Q2
19
Q3
19
Q4
20
Q1
20
Q2
20
Q3
20
Q4
2016 2017 2018 2019 2020
SEK
mill
ion
EBITDA EBITDA %
-2000
200400600800
10001200140016001800
16
Q1
16
Q2
16
Q3
16
Q4
17
Q1
17
Q2
17
Q3
17
Q4
18
Q1
18
Q2
18
Q3
18
Q4
19
Q1
19
Q2
19
Q3
19
Q4
20
Q1
20
Q2
20
Q3
20
Q4
2016 2017 2018 2019 2020SE
K/t
on
ne

Change in operating profit/loss Q4/2020 vs. Q4/2019
SEKm
15Note: Excluding items affecting comparability
Lower raw material costs, better capacity utilization, less maintenance
Higher capacity utilization, less maintenance
-1 131
557
-1 110
2019 Q4 Var COGSVolumePrice
1 510
600
210
Fixed costs
-80
FX
820
Unabsorption
-262
Other 2020 Q4
Prices decreased y-on-y in all steel divisions
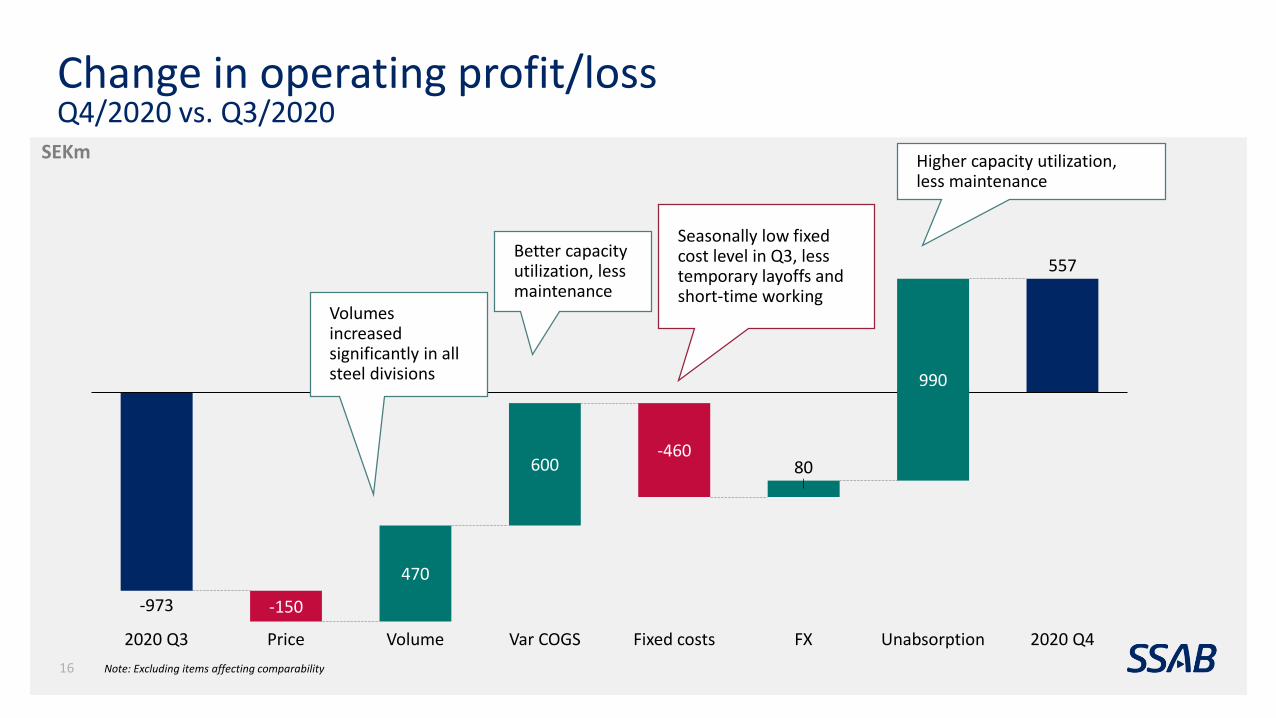
Change in operating profit/loss Q4/2020 vs. Q3/2020
SEKm
16 Note: Excluding items affecting comparability
Seasonally low fixed cost level in Q3, less temporary layoffs and short-time working
Better capacity utilization, less maintenance
-973
557
-150
-460
Fixed costsVolume2020 Q3 Price
470
Var COGS
600 80
FX
990
Unabsorption 2020 Q4
Volumes increased significantly in all steel divisions
Higher capacity utilization, less maintenance

SEKm Q4/2020 Q4/2019 Q3/2020 2020 2019
EBITDA 1,439 -174 -66 3,364 6,177
Change in working capital 2,036 2,187 699 1,570 896
Maintenance expenditure -606 -666 -332 -1,622 -1,875
Other 61 -25 11 147 -4
Operating cash flow 2,930 1,321 313 3,460 5,194
Financial items -84 -50 -164 -545 -432
Taxes 122 -97 3 -56 -1,315
Cash flow from current operations 2,967 1,175 151 2,859 3,447
Strategic capital expenditure -115 -456 -75 -582 -1,035
Acquisitions of shares and operations -35 -448 -43 -231 -1,221
Divestments of shares and operations 39 118 -1 143 118
Cash flow before dividend 2,856 389 32 2,189 1,309
Dividend paid to shareholders - - - - -1,545
Dividend, non-controlling interest -1 -1 -4 -9 -7
Acquisition, non-controlling interest - -1 - - -46
Net cash flow 2,856 387 27 2,180 -289
Strong cash flow in Q4

0
5000
10000
15000
20000
25000
Cash andback-upfacilities
2021 2022 2023 2024 2025 2026+
Well-balanced maturity profile
SEKm
SEK 9.5bn
Cash
Back-upfacilities
18
Maturity profile Q4/2020
►Duration of the loan portfolio was 4.7 (7.1) years
►Liquid assets and committed credit lines at comfortable level of SEK 21.5bn –corresponds to 33% of rolling 12 month revenue
►Most maturities in 2021 refer to commercial papers

Significant reduction of net debt since Ruukki-merger
19
►Net debt decreased to SEK 10,278m (11,696m) at the end of 2020
►Net gearing was 19% (19%)
►2014-2017 excluding IFRS 16 (impact of around SEK 2bn)
0
5 000
10 000
15 000
20 000
25 000
30 000
2014 2015 2016 2017 2018 2019 20200
10
20
30
40
50
60
Net interest bearing debt, SEKm Net gearing ratio, %

Cash needs of the business
20
2021F
2.2Capex (maintenance and strategic)
0.5
2020
0.1
3.0-3.5
Net interest
Taxes and other
2.8
4.8-5.3►Total cash needs* estimated at SEK 4.8-5.3
billion in 2021
►Higher strategic capex:− Capacity expansion of Q&T in Mobile
− Start of Oxelösund conversion
► Interest paid expected to be relatively stable
►Taxes paid will normalize**
*Cash needs defined as capex, interest paid and taxes paid. Excluding working capital
**2019-level used as starting point, will depend on earnings in 2021

Higher prices for iron ore, lower for coking coal
►Average coking coal purchase price in Q4/20 was 2% lower in terms of SEK (1% in USD) vs. Q3/20
►Coal spot prices decreased during the quarter
Coking coal
Iron ore
► Average pellet purchase price in Q4/20 was 6% higher in terms of SEK (+9% in USD) vs. Q3/20
► Iron ore spot prices increased sharply during Q4, will impact SSAB in Q1/21
SSAB’s purchase price, coking coal and iron ore
Indexed
21
0
20
40
60
80
100
120
140
160
180
Q1/18 Q2/18 Q3/18 Q4/18 Q1/19 Q2/19 Q3/19 Q4/19 Q1/20 Q2/20 Q3/20 Q4/20
Iron ore (SSAB purchase price, indexed) Coal (SSAB purchase price, indexed)
0
50
100
150
200
250
300
350
400
450
Jan
-18
Feb
-18
Mar
-18
Ap
r-1
8M
ay-1
8Ju
n-1
8Ju
l-1
8A
ug
18
Sep
18
Oct
18
No
v 1
8D
ec
18
Jan
19
Feb
19
Mar
19
Ap
r 1
9M
ay 1
9Ju
n 1
9Ju
l 19
Au
g 1
9Se
p 1
9 O
ct 1
9N
ov
19
De
c 1
9Ja
n 2
0Fe
b 2
0M
ar 2
0A
pr
20
May
20
Jun
e 2
0Ju
ly 2
0A
ug
20
Sep
20
Oct
20
No
v 2
0D
ec
20
Jan
21
Chicago #1HM Scrap (AMM) [USD/gross ton]
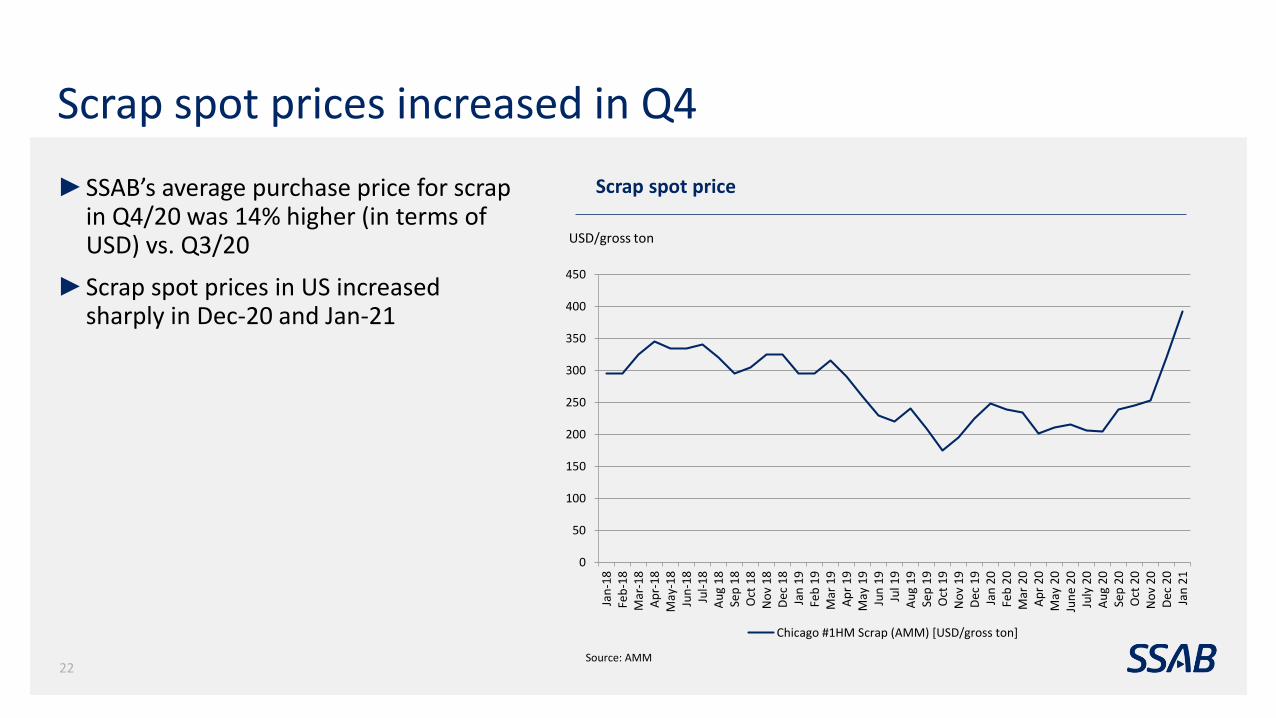
Scrap spot prices increased in Q4
Scrap spot price
USD/gross ton
Source: AMM22
►SSAB’s average purchase price for scrap in Q4/20 was 14% higher (in terms of USD) vs. Q3/20
►Scrap spot prices in US increased sharply in Dec-20 and Jan-21

Major planned maintenance outages in 2021
SEKm Q1/21 Q2/21 Q3/21 Q4/21 2021 2020 2019
SSAB Special Steels
- - 320 - 320 250 300
SSAB Europe - - 300 145 445 335 420
SSAB Americas
- - - 435 435 220 415
Total - - 620 580 1,200 805 1,135
Note: The estimates shown in table includes direct maintenance cost and cost of lower capacity utilization (under absorption), but excludes lost margins.
23
► Total maintenance costs for 2021 expected to be SEK 1,200m, compared to SEK 805m in 2020
► Costs in 2020 were lower than normal – more use of our own resources, due to a lower level of production
► SSAB Americas maintenance take place at SSAB’s mill in Mobile in 2021, including Q&T lines

Outlook and summary
24

SSAB Americas
Covid-19 impacted steel markets in 2020Strategic targets moved from 2022 to 2023
25
Premium share
SSAB Europe – supported by Tibnorand Ruukki ConstructionSSAB Europe
Automotive AHSS
PremiumShipments(ktonne)
SSAB Special Steels
Shipments(million tonnes)
1.6
2020 2023
1.1
SSAB Services
Sales(SEK billion)
2020
2.0Organic
2023
3.0
1.5 Acquistions
4.5
40-45%
Market share in the Nordics(over time)
30% (2020)
39%
SSAB Europe
Premium share
38% (2020)
46% 37% in 2020
539
800
2020 2023
719900
20232020
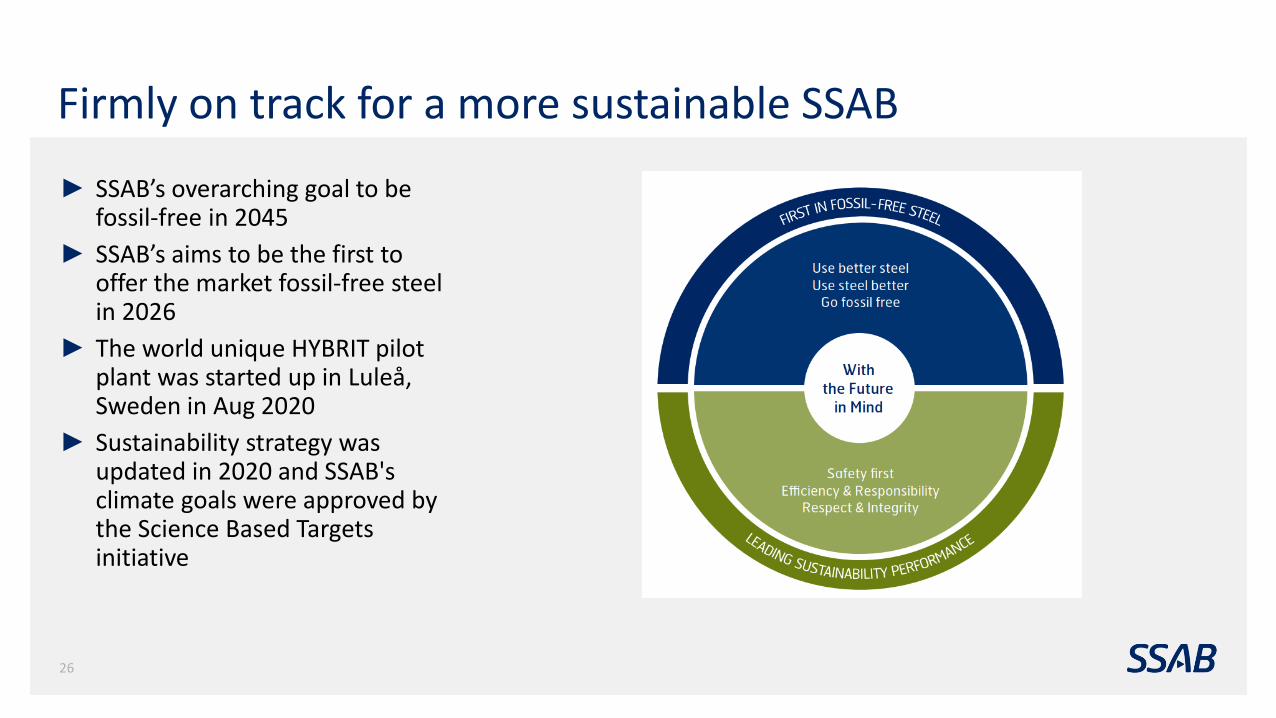
Firmly on track for a more sustainable SSAB
26
► SSAB’s overarching goal to be fossil-free in 2045
► SSAB’s aims to be the first to offer the market fossil-free steel in 2026
► The world unique HYBRIT pilot plant was started up in Luleå, Sweden in Aug 2020
► Sustainability strategy was updated in 2020 and SSAB's climate goals were approved by the Science Based Targets initiative

Outlook for Q1 for SSAB’s key customer segments
Segment Q4/2020 Comments
Heavy Transport Heavy truck production at high level
Rail cars in the US still low
Automotive Recovery in production
Underlying structural growth in AHSS
Construction Machinery Production levels recovering in main markets
Material Handling Mining operations continue at a good level
Energy Low activity in oil and gas
Good activity within wind power and transmission
Construction Stable underlying demand, seasonal slow down
Service Centers Restocking expected in Europe and the US27
WeakHealthyStrong
SSAB’s outlook for main customer segments Q1/2021
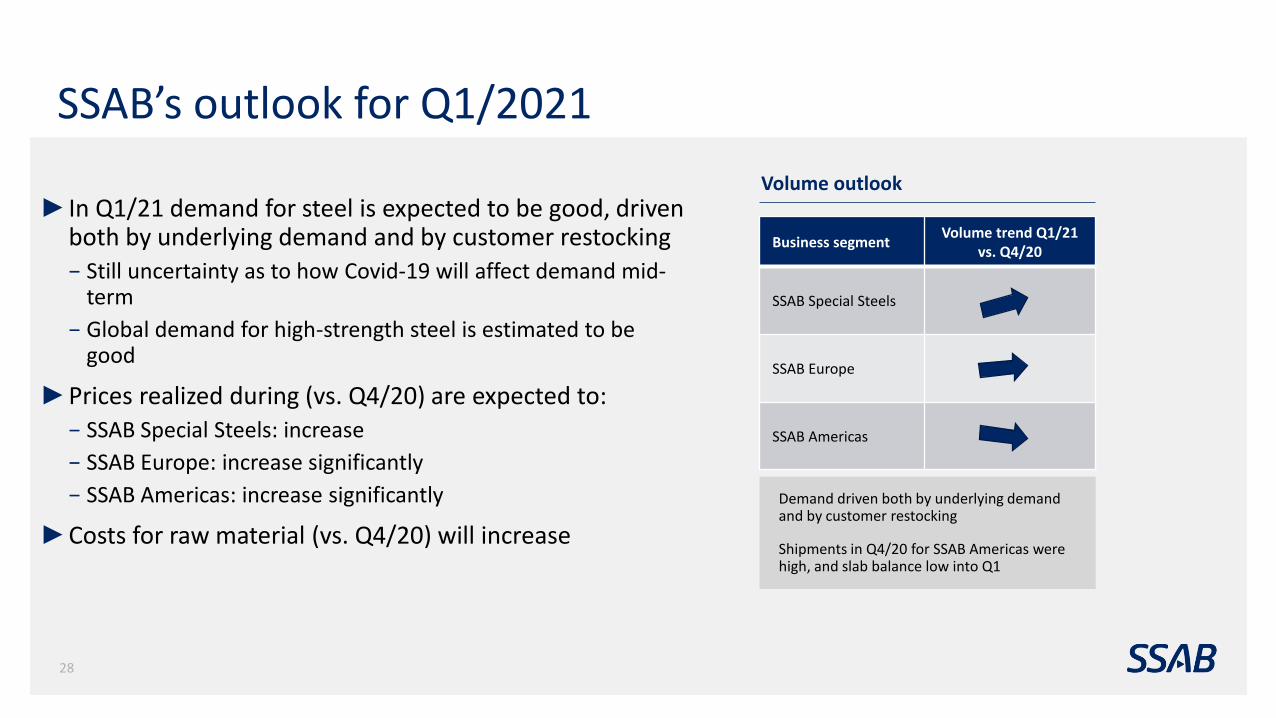
SSAB’s outlook for Q1/2021
Business segmentVolume trend Q1/21
vs. Q4/20
SSAB Special Steels
SSAB Europe
SSAB Americas
► In Q1/21 demand for steel is expected to be good, driven both by underlying demand and by customer restocking− Still uncertainty as to how Covid-19 will affect demand mid-
term
− Global demand for high-strength steel is estimated to be good
►Prices realized during (vs. Q4/20) are expected to:− SSAB Special Steels: increase
− SSAB Europe: increase significantly
− SSAB Americas: increase significantly
►Costs for raw material (vs. Q4/20) will increase
28
Volume outlook
Demand driven both by underlying demand and by customer restocking
Shipments in Q4/20 for SSAB Americas were high, and slab balance low into Q1

Summary
►Good flexibility in 2020 to manage downturn
►Strong cash flow and reduced net debt
►Fixed costs reduced by over SEK 1.6bn
►Market recovery in Q4, succesful ramp-upof production
►Good demand expected in Q1/21
►Discussions with Tata Steel have now ended
►Target to be first in fossil-free steel
29

Questions & Answers
30

Appendix
31

Debt cost and duration
%
Debt portfolio duration and interest rate
►Duration of the loan portfolio was 4.7 (7.1) years
►Averaged fixed interest term was 0.9 (1.1) years
►Average interest rate was 1.82% (3.08%)
Years
32
0,0
0,5
1,0
1,5
2,0
2,5
3,0
3,5
4,0
2017Q1
2017Q2
2017Q3
2017Q4
2018Q1
2018Q2
2018Q3
2018Q4
2019Q1
2019Q2
2019Q3
2019Q4
2020Q1
2020Q2
2020Q3
2020Q4
0,0
1,0
2,0
3,0
4,0
5,0
6,0
7,0
8,0
Avg. duration (rhs) Avg. interest rate

SSAB's climate goals approved by the Science Based Targets initiative
33
►SSAB is committed to reducing its greenhouse gas (CO2e) emissions by 35% by 2032 (based on 2018 figures). − The goal applies to both direct and indirect
emissions (Scope 1 and 2)
− In line with the objective of keeping global warming well below 2°C
►Objective is scientifically based and in line with the Paris Agreement
►SSAB's aims to be the first to offer the market fossil-free steel in 2026

►The world unique pilot plant for fossil-free steel, producing sponge iron (DRI/HBI), was started up in Luleå, Sweden
►First using natural gas and then hydrogen to be able to compare production results
►The Swedish Energy Agency granted the joint venture SEK 22m for a study to establish the prerequisites for the demonstration plant
34
Hybrit: Start up of world unique pilot plant
