presentation identifier (title or location), month 00, 2008 smart grid implications for gas turbine...
TRANSCRIPT

Presentation Identifier (Title or Location), Month 00, 2008
Smart Grid Implications for Gas Turbine TechnologySteve Bossart
2010 University Turbine Systems Research Workshop October 19, 2010
2
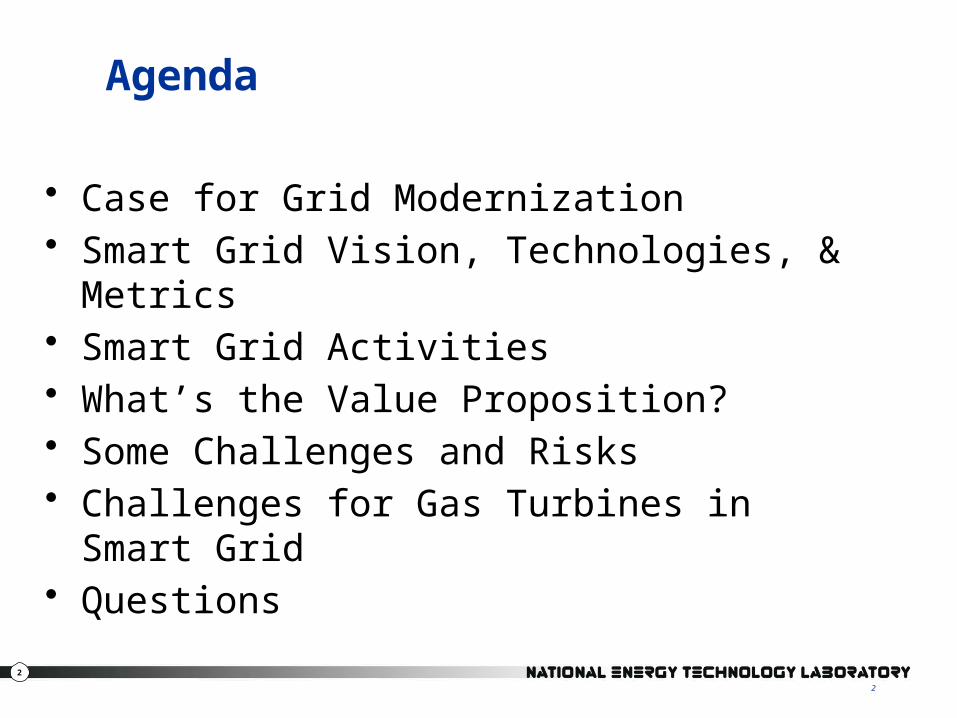
Agenda
• Case for Grid Modernization• Smart Grid Vision, Technologies, & Metrics • Smart Grid Activities• What’s the Value Proposition?• Some Challenges and Risks• Challenges for Gas Turbines in Smart Grid • Questions
2
3
Case for Grid Modernization

4
4 4
Why Modernize the Grid?• Today’s grid is aging and outmoded• Unreliability is costing consumers billions of dollars• Today’s grid is vulnerable to attack and natural disaster• An extended loss of today’s grid could be catastrophic to our
security, economy and quality of life• Today’s grid does not address the 21st century power supply
challenges• Adverse trends associated with the grid
- Costs, reliability, peak loads, asset underutilization, TLRs, grid divorce• The benefits of a modernized grid are substantial

5
5
Today’s grid - status quo is not an option
• Aging– 70% of transmission lines are 25 years or older– 70% of transformers are 25 years or older– 60% of circuit breakers are 30 years or older
• Outmoded – Designed in the 50s and installed in the 60s and 70s,
before the era of the microprocessor.
• Stressed– Never designed for bulk power shipments– Wholesale power transactions jumped 300% from
2000 to 2005. Insight Magazine, Oct. 2005

6
Role of the NETL Smart Grid Implementation Strategy
• Accelerate modernization of the national grid• Define the vision for the Smart Grid• Reach out to stakeholders to gain consensus• Assist in identification and resolution of barriers• Identify best practices and lessons learned• Communicate success stories to stimulate deployment• “Independent broker” consistent with Modern Grid concepts

7
Smart Grid Vision

8
What’s Different with Smart Grid
• Consumer engagement with resources to solve power issues locally
• Two-way power flow in Distribution• Two-way communications • As prices increase, local renewables will increase• Imperative to transform from passive to active
control in Distribution• New ways for Distribution to become a
Transmission resource• Potential to transform transportation sector

9
9
Smart Grid Principal Characteristics
The Smart Grid will:
• Enable active participation by consumers• Accommodate all generation and storage options• Enable new products, services and markets• Provide power quality for the digital economy• Optimize asset utilization and operate efficiently• Anticipate & respond to system disturbances
(self-heal)• Operate resiliently against attack and natural disaster

10
Smart Grid Key Success Factors
The Smart Grid is MORE:
• Reliable
• Secure
• Resilient
• Economic
• Efficient
• Environmentally friendly
• Safe

11
Smart Grid Technologies
Integrated Communications
Advanced Control Methods
Decision Support & Improved Interfaces
Advanced Components
Sensors and Measurement
Integrated Communications

12
Smart Grid Activities

13
American Recovery and Reinvestment Act • Smart Grid Investment Grants (100 projects)
– $3.4 billion Federal; $4.7 billion private sector– 877 PMUs covering almost 100% of transmission– 200,000 smart transformers– 700 automated substations– 40 million smart meters– 1 million in-home displays
• Smart Grid Demonstration Projects (32 projects)– $620 million Federal; $1 billion private sector– 16 storage projects– 16 regional demonstrations
Current Smart Grid Activities

14
• Additional ARRA Smart Grid Activities– Interoperability Framework by NIST ($10M)– Transmission Analysis and Planning ($80M)– State Electricity Regulator Assistance ($50M)– State Planning for Smart Grid Resiliency ($55M)– Workforce Development ($100M)
• DOE Renewable & Distributed Systems Integration • EPRI Smart Grid Demonstrations (6 projects) • Smart Grid System Report to Congress
– http://www.smartgrid.gov/resources
Current Smart Grid Activities (continued)

15
Metrics

16
16 16
Smart Grid Metrics
Reliability• Outage duration and frequency, momentary disruption, power qualitySecurity• Ratio of distributed generation to total generationEconomics• Electricity prices, transmission congestion costs, cost of outagesEfficient• T&D electrical losses, peak-to-average load ratioEnvironmentally Friendly• Ratio of renewable generation to total generation, emissions per kwhSafety• Injuries and deaths to workers and public

17
What’s the Value Proposition?

18
Value Proposition
Cost to Modernize• $165B over 20 years
– $127B for Distribution– $38B for Transmission
• ~$8.3B per year (incremental to business-as-usual)
• Current annual investment - $18B
Benefit of Modernization• $638B - $802B over 20
years • Overall benefit to cost ratio
is 4:1 to 5:1
18
EPRI, 2004
Benefit to Cost Ratio for West Virginia of 5:1Benefit to Cost Ratio for San Diego of 6:1

19
Who are the Beneficiaries?
• Utilities (What’s in it for my shareholders?)• Consumers (What’s in it for me?)• Society (What’s in it for us?)
19
We get what we reward!

20
Utility Value Proposition
Opportunities• Rate of return• Operational Benefits
– Outage restoration, billing, reduce T&D losses, optimize asset utilization, maintenance, planning
• Improved Customer Satisfaction
Cost• Risk of cost recovery
Utilities are the engine for investment in Smart Grid
21
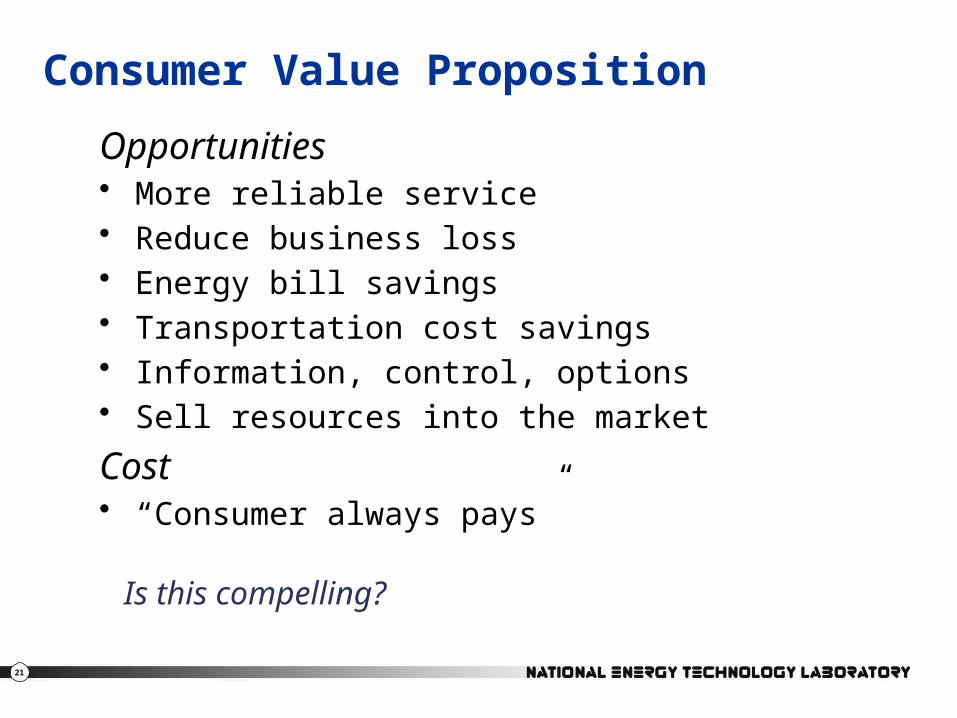
Consumer Value Proposition
Opportunities• More reliable service• Reduce business loss• Energy bill savings• Transportation cost savings• Information, control, options• Sell resources into the market
Cost• “Consumer always pays”
Is this compelling?

22
Is it compelling?
Potential bill savings• Average residential bill ~$100 / month• Expected reduction from EE/DR 10% – 15%• Potential savings $10 - $15 / month• Bill increase to pay for SG $5 - $10 / month
Potential fuel cost savings• Assumed miles driven 10,000 mi/year• Fuel cost (gas) 10 -15 cents/mile• Fuel cost (KWh) @ 3 - 5 cents/mile 3 – 5 cents/mile• Potential fuel cost savings $500 - $1,200/year• Premium to purchase EV over gas $10,000
Consumer benefits alone may not drive Smart Grid implementation

23
Societal Value Proposition
Opportunities• Downward pressure on electricity prices• Improved reliability reducing consumer losses• Increased grid robustness improving grid security• Reduced emissions• New jobs and growth in GDP • Revolutionize the transportation sector• Reduce import of foreign oil
Cost• No incremental cost?
Does the societal value proposition make it compelling?

24
Some Challenges and Risks
25
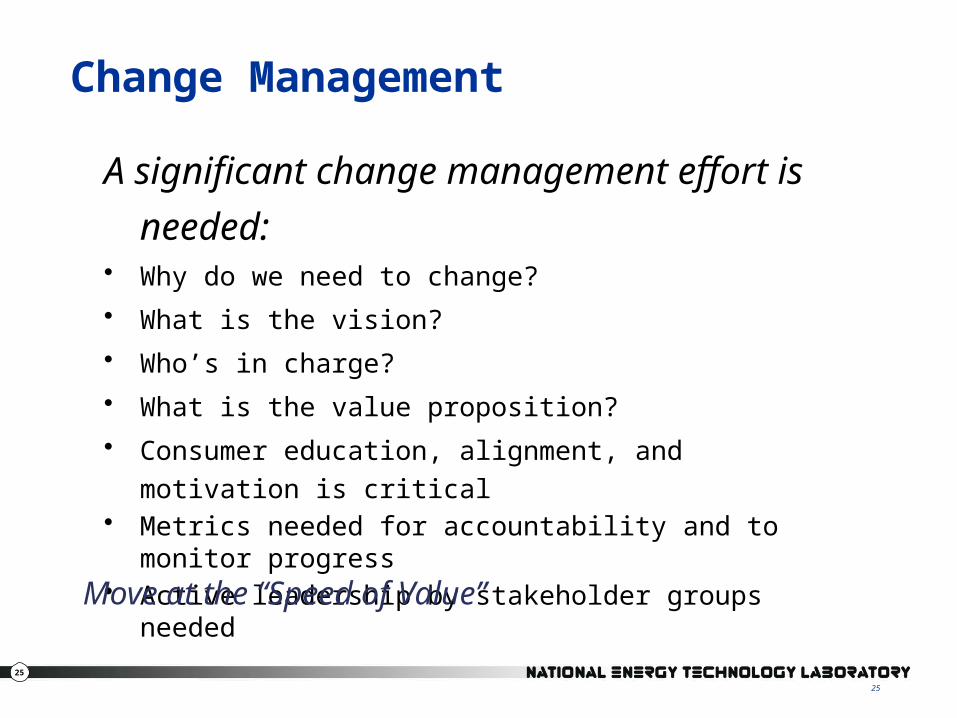
Change Management
A significant change management effort is needed:• Why do we need to change?
• What is the vision?
• Who’s in charge?
• What is the value proposition?
• Consumer education, alignment, and motivation is critical• Metrics needed for accountability and to monitor progress• Active leadership by stakeholder groups needed
25
Move at the “Speed of Value”

26
Technical Challenges
• Interoperability and scalability• Large number of consumers actively involved• Decentralized operations with 2-way power flow• Getting the communications right• “Future proofing” the technologies• Cyber Security• Conversion of data to information to action• Market driven
26
Where will we find the skilled resources to solve these?

27
Regulatory Challenges
• Time-based rates• Clear cost recovery policies• Policy changes that remove disincentives to utilities• Societal benefits included in business case• Increased utility commission workload• Consistency among state utility commissions• Potential cost of “carbon management”• Future proofing vs. stranded assets• Consumer privacy concerns• Least cost• Used and useful• New operating and market models
27

28
Smart Grid Impact on Gas Turbines
• Cyclical operation of gas turbine– Impact on component life– Impact on environmental emissions– Impact on efficiency
• Movement toward smaller and dispersed plants

29
Natural Gas Plants and Smart Grid Studies
• Fate of natural gas peaking plants
• Impact on mechanical and electrical inertia due to – Asynchronous generation (intermittent renewables)– Shift to smaller plants
• Evaluation of wind/CAES/natural gas plants
30
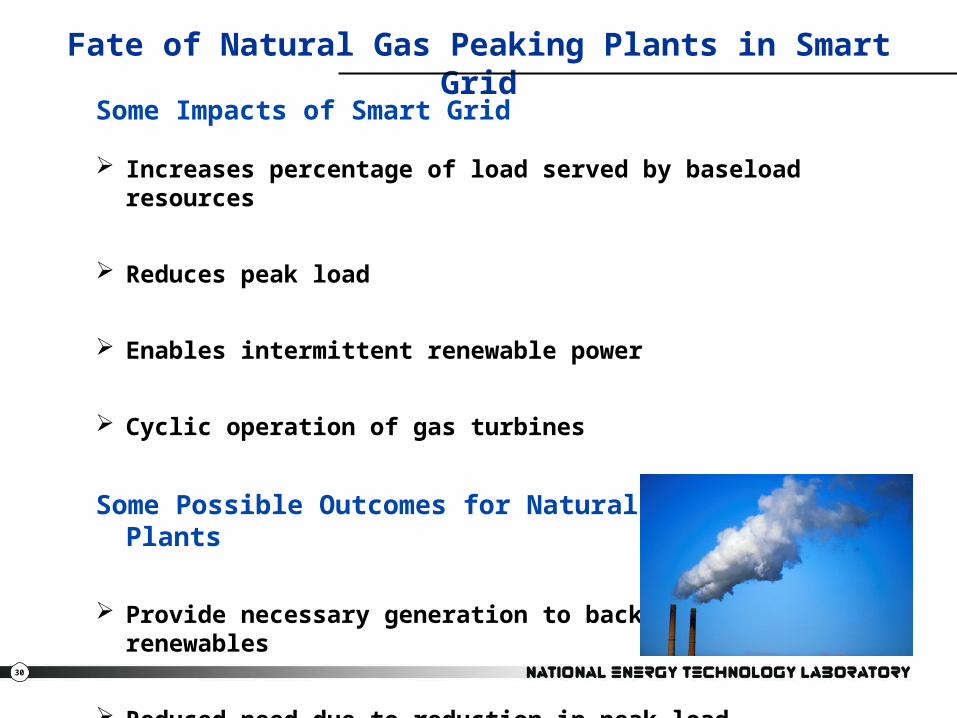
Fate of Natural Gas Peaking Plants in Smart Grid
Some Impacts of Smart Grid
Increases percentage of load served by baseload resources
Reduces peak load
Enables intermittent renewable power
Cyclic operation of gas turbines
Some Possible Outcomes for Natural Gas Peaking Plants
Provide necessary generation to backup intermittent renewables
Reduced need due to reduction in peak load
Conversion to baseload NGCC
Conversion to poly-generation plant

31
o Technical Approacho How many natural gas peaker plants are there currently connected to the system?o What are the capacities of those plants?o How are those plants currently being utilized?o How many natural gas peaker plants are currently planned or being constructed
today?o How will additional renewable energy resources placed into the grid affect the
demand for back-up generation?o What role will carbon legislation have on natural gas and coal fired plants?o What are the alternative uses for a natural gas peaker plant?o How will the price and supply of natural gas affect the fate of peaker plants?o How can better utilization of centralized power plants affect the need for
natural gas peaker plants in the future?o What does the daily electricity demand profile for a given area look like today?o What does the daily electricity demand profile for the same area look like in the
future given demand response, energy storage, and other Smart Grid initiatives?o Can demand response, energy storage, and other Smart Grid initiatives shave
the peak load demand (given the presence of substantial renewable penetration) enough to reduce the role of natural gas peaker plants in the future?
Fate of Natural Gas Peaking Plants

32
Loss of Inertia Due to Asynchronous Generation
• Assess impact of increasing penetration of generation sources with little or no inertial contribution
• Higher likelihood of grid instability due to a reduction of inertia from large, directly-coupled, rotating machines.
• Reduced size of power plants reduces inertia

33
Loss of Inertia Due to Asynchronous Generation• Inertia definition as related to this study:
– Tendency of a body to resist acceleration; tendency of a body at rest to remain at rest or of a body in straight line motion to stay in motion in a straight line unless acted on by an outside force.
• Impact of lower mass in the system (directly coupled synchronous rotating machines)
• Role of inverters– Electrical inertia?– System stability– Role in a fully deployed SG

34
CAES/Wind Generating Setup
Compressor
Ambient air
Motor
Wind farm
Porous sandstone
Generator Turbine
Air storage
Power system
• Value:– provide insight on the technical and
economic aspects of various modes of CAES,
– wind/CAES integrators should be able to use methods in this study,
– propose new, inexpensive concepts to equalizes wind power variation while alleviating transmission problems associated with power quality.
• CAES key features:– high power capacities and energy
delivery capabilities, – provide thousands of MWh of storage
at low cost,– can reach its maximum output within
a few seconds,– suitable for ramping, load following,
and regulation,– can be used as synchronous
condensers.

35
CAES Configurations Under Study
• Adiabatic: – ASPEN simulation of adiabatic compression stage.
Theoretically speaking, this method could yield 100 percent efficiency and therefore has been the subject of research lately.
• Economic Evaluation: – Economic dispatch with compression and
decompression cycles and spot market prices.

36
ReferencesSmart Grid Implementation Strategy
www.netl.doe.gov/smartgrid/index.html
Federal Smart Grid Website
www.smartgrid.gov
Smart Grid Clearinghouse
www.sgiclearinghouse.org/
Steve Bossart
(304) 285-4643