presence and movements of california … · presence and movements of california condors near...
TRANSCRIPT

PRESENCE AND MOVEMENTS OF CALIFORNIA CONDORS NEAR PROPOSED WIND TURBINES
FINAL REPORT PREPARED FOR HT HARVEY AND ASSOCIATES
15 November 2007
Prepared by Nellie Thorngate Ventana Wildlife Society
Principal Investigator: Karen Shihadeh1
Biologist/GIS Analyst: Nellie Thorngate
1 Ventana Wildlife Society, 19045 Portola Dr. Ste. F1, Salinas, CA 93908; 831-455-9514; [email protected]

TABLE OF CONTENTS TABLE OF CONTENTS.................................................................................................... 2
TABLE OF FIGURES........................................................................................................ 3
EXECUTIVE SUMMARY ................................................................................................ 4
BACKGROUND ................................................................................................................ 4
METHODS ......................................................................................................................... 6
Condor locations and movements................................................................................... 6
Mapping .......................................................................................................................... 6
Statistical Methods.......................................................................................................... 7
RESULTS ........................................................................................................................... 7
Proximity to Proposed Wind Turbines ........................................................................... 7
Movement Patterns ......................................................................................................... 7
Landscape Associations.................................................................................................. 8
Home Ranges.................................................................................................................. 8
IMPLICATIONS ................................................................................................................ 8
LITERATURE CITED ....................................................................................................... 9
PERSONAL COMMUNICATIONS................................................................................ 10
2
TABLE OF FIGURES
Figure 1. Proposed wind turbines near Gonzales in Monterey County, CA, and the project study area, defined by a 25 km radius around the proposed turbines. .......... 11
Figure 2. Proximity of Condor detections to the proposed wind turbines, Monterey County, CA, 2003-2007............................................................................................ 12
Figure 3. Proximity of in-flight Condor detections to the proposed wind turbines, Monterey County, CA, 2003-2007 ........................................................................... 13
Figure 4. Frequency distribution of flight speeds of Condors detected within 25 km of the proposed wind turbines, Monterey County, CA, 2003-2007.............................. 14
Figure 5. Detections of flying and perched Condors within 25 km of the proposed wind turbines, Monterey County, CA, 2003-2007 ............................................................ 15
Figure 6. Proximity of perched Condor detections to the proposed wind turbines, Monterey County, CA, 2003-2007 ........................................................................... 16
Figure 7. Landscape slopes associated with Condor detections within 25 km of the proposed wind turbines, Monterey County, CA, 2003-2007.................................... 17
Figure 8. Distribution of landscape slope categories associated with Condor detections within 25 km of the proposed wind turbines, Monterey County, CA, 2003-2007 ... 18
Figure 9. Landscape aspects associated with Condor detections within 25 km of the proposed wind turbines, Monterey County, CA, 2003-2007.................................... 19
Figure 10. Distribution of landscape aspects associated with Condor detections within 25 km of the proposed wind turbines, Monterey County, CA, 2003-2007 ................... 20
Figure 11. Condor Minimum Convex Polygon home ranges that encompass the proposed wind turbine locations, Monterey, CA...................................................................... 21
3

EXECUTIVE SUMMARY Wind energy poses particular hazards to birds with high wing loadings, large bodies and clumsy flight. California Condors, Gymnogyps californianus, a critically endangered species currently being reintroduced to central coastal California, may be at risk from wind turbines within their foraging range. In 2007, HT Harvey and Associates contracted the Ventana Wildlife Society to map the presence and movement patterns of California Condors near two proposed wind turbines at a winery near Gonzales CA, and to make recommendations regarding the potential risk posed to California Condors by the proposed turbines. Despite the proximity of Pinnacles National Monument, a rearing and release site for California Condors, only 417 detections occurred within a 25 km radius of the proposed wind turbines. No detections occurred closer than 3 km to the proposed wind turbine locations. Mean flight speed was 45.7 kph. Using flight speeds of 0 to 5 as our definition of perched birds, we determined that 151 detections were of perching events within 25 km of the proposed wind turbines. Condor flight headings were predominantly westerly within 25 km of the proposed wind area. Condor detections occurred most frequently over 31 to 40 degree slopes, and over northern and northwestern landscape aspects. The proximity of the Pinnacles rearing and release site indicates a potential risk situation for Condors in the vicinity of the proposed wind turbines, but given that the proposed project only calls for the installation of two turbines, and measures are taken to monitor and remove large carcasses in the area the proposed wind turbines pose only a minor risk to Condors in the area.
BACKGROUND Wind energy poses substantial risks to avian wildlife under certain circumstances (Drewitt and Langston 2006, Barrios and Rodriguez 2004, Erikson et al 2001). Birds with high wing loadings, clumsy flight patterns, and foraging habits that draw them into the vicinity of wind turbines are all at high risk for turbine-related injuries and mortalities (Barrios and Rodriguez 2004). Risk is also increased where wind energy projects intersect with migratory pathways, daily flight paths, and foraging and roosting grounds (Dewitt and Langston 2006). While many studies have found that overall turbine-related avian mortality is low compared to other anthropogenic sources of mortality, even low levels of mortality could significantly impact species with low productivity that take years to reach reproductive maturity (Dewitt and Langston 2006). Because many at-risk birds are endangered, threatened, or otherwise protected by federal laws, it is important that new wind energy projects of any scale assess the potential threats to wildlife, and minimize the risks posed by turbines and associated structures. Parts of central coastal California are ideal for the production of wind energy at many different scales, but the central coast is also home to a growing population of reintroduced California Condors (Gymnogyps californianus), a critically endangered species since 1967 (Kiff et al. 1996). Historically, California Condors ranged from British Columbia in the north to Baja California in the south and were found as far east as the western slope of the Sierra Nevada (Snyder and Schmitt 2002), but were nearly
4

extirpated by the mid-1980’s due to hunting, poisoning and habitat loss (Snyder and Schmitt 2002). In 1987 the remaining wild population was captured and housed in captive rearing facilities in southern California to act as a breeding population for the planned species recovery and reintroduction program. Condors were released back in to the wild in southern California starting in 1994 and in central coastal California starting in 1997. The first rearing and release facility on the central coast was located in the Ventana Wilderness on the western slope of the Santa Lucia Mountains near Big Sur, and has been active since the inception of the central California recovery effort in 1997. In 2003, a second central California rearing and release site was established at Pinnacles National Monument in the Gabilan Mountains. As of September 30, 2007, the total population of California Condors was 305, with 157 of those in captivity at Los Angeles Zoo, San Diego Wild Animal Park, Boise World Center for Birds of Prey, Oregon Zoo, Mexico Zoo, Mentor Birds in field pens, and pre-release birds in field pens. Of wild birds (148), there are currently 72 in California, 16 in Baja California, and 60 in Arizona. The free-flying population in the central California area currently totals 39 free-flying birds, with 27 birds in the Big Sur population and 12 birds in the Pinnacles population. The eldest birds in the Big Sur flock established two successful nests in 2007, and it is expected that the eldest birds in the Pinnacles flock will begin breeding in 2010-2012. Meanwhile, annual additions of captive-raised Condors continue to bolster both flocks, and the ultimate goal of the central coast reintroduction program is a flock of 75 free-flying birds. Little is known about the susceptibility of California Condors to wind turbine-induced mortality. Studies of Griffon Vultures (Gyps fulvus), a European species ecologically similar to California Condors (Snyder and Schmitt 2002), have shown that in high concentrations, the birds are quite vulnerable to turbine strikes (Barrios and Rodriguez 2004). Raptors such as Red-tailed Hawks (Buteo jamaicensis), who rely on topographic features to generate preferred flight conditions and who forage in the types of habitat that characterize many wind turbines, also experience high mortality rates due to wind turbines (Hoover and Morrison 2005). Flight characteristics of Turkey Vultures (Cathartes aura) in the Altamont Pass Wind Turbines indicate that scavenging birds frequently fly within the height range of wind turbines used for large-scale power production, although the location of the turbines with respect to wind direction and slope curvature are important factors in determining mortality risk (Smallwood and Neher 2004). The possible impact of smaller-scale wind resource projects, including isolated towers powering small facilities, is largely unknown. In conjunction with site-specific habitat features, behaviorally and physiologically, California Condors exhibit many features that may put them at a high risk for wind turbine-related mortality: (1) high wing loading; (2) social foraging; (3) curiosity for novel objects; (4) k-selected reproductive strategy; and (5) foraging preference for sloped grassland sites. Condors have extremely high wing loading, and their flapping flight is clumsy, making them less maneuverable around objects on the landscape. Condors routinely forage and roost in social groups, so that the presence of a single bird near wind turbines increases the risk of mortality not only for that individual, but for other individuals that may follow it. Because they are scavengers, Condors exhibit pronounced
5
curiosity for novel objects in their environment (J. Burnett, pers. comm.) such that the presence of new turbines might increase overall Condor activity at a site. Condors raise one chick every 2 years with significant parental investment, thus losses of even a few individuals have large impacts on the total population. In the case of Condors, a closely managed, primarily captive-bred species, losses are also costly. In 2007, HT Harvey and Associates contracted the Ventana Wildlife Society to map the presence and movement patterns of California Condors within 25 km of two proposed wind turbines on a winery near Gonzales CA (figure 1), and to assess the potential risk posed to California Condors by the proposed turbines. This report presents presence, associated landscape characteristics, flight characteristics, and home ranges of California Condors detected within 25 km of the proposed wind turbines, and presents recommendations for wind turbine installation based on those findings.
METHODS
Condor locations and movements Twenty-seven free-flying, captive-reared Condors were tracked in central coastal California using solar powered, GPS Patagial PTT-100 transmitters (Microwave Telemetry, Inc., Columbia, MD) between 2 December 2003 and 31 March 2007. Transceivers were affixed directly to each bird’s patagium in conjunction with an identification tag. The GPS receivers were programmed to collect a location fix (referred to as a “detection” in this report) every hour, 16 hours daily. In general, transceivers provide an average of 12 location fixes per day (16 possible) within 16 meters of the actual location, or, average location fixes 92% of the time. The built-in PTT transceivers transmitted stored GPS location data to Service ARGOS satellites each day. Location data were downloaded daily via the Automatic Distribution Service administered by Service ARGOS. Data were then imported into a Microsoft Access database. Condor location fixes totaling 103,395 data points were examined for movement patterns and proximity to the two proposed wind turbines near Gonzales, CA. Error rates for flight speed (used to determine if a bird was perched or in flight when detected) were ± 1 km/hr at speeds above 40 km/hr (Microwave Telemetry, Inc, Columbia, MD). For the purposes of analysis, detections exhibiting flight speeds of greater than 5 kph, while detections exhibiting flight speeds of 0 through 5 were considered perching events.
Mapping Condor location data including decimal-degree coordinates, speed, time and date were imported into an ArcGIS geodatabase. Each location fix, or data point, is referred to as a detection. The Condor data points, a Digital Elevation Model downloaded from the USGS Continuous Data Distribution Service, and an x,y data layer estimating the location of the two proposed wind turbines were plotted on a hillshade map of California.
6

ArcGIS Spatial Analyst tools were used to assess the proximity of Condor locations to the proposed wind turbines; landscape slope and aspect associated with Condor detections within the study area; and the flight behavior (“perched” or “flying”) of Condor detections within 25 km, 20 km, 10 km and 5 km of the proposed wind turbines. MCP home ranges of individual Condors were calculated using Hawth’s Tools, a free ArcGIS extension for assessing animal populations.
Statistical Methods Distribution of flight speed categories, flight headings, slope categories and landscape aspects associated with detections were assessed for divergence from expected values using Pearson χ2 analysis (Zar 1999).
RESULTS
Proximity to Proposed Wind Turbines 417 Condor detections representing 13 individual birds occurred within 25 km of the proposed wind turbines from 2 December 2003 to 31 March 2007. 130 detections were within 20 km of the proposed wind turbines, 33 were within 15 km, 11 were within 10 km, and 3 were within 5 km (see Figure 2). No Condor detections occurred closer than 3 km to the proposed wind turbine locations. The detections within 5 km of the proposed wind turbines were attributable to 3 different individual Condors.
Movement Patterns 266 flying bird detections occurred within 25 km of the proposed wind turbines; 88 flying birds were located within 20 km; 31 flying birds occurred within 15 km; 10 flying birds were located within 10 km; and 2 flying birds were located within 5 km (see Figure 3). The mean speed of flight within 25 km of the proposed wind turbines was 45.7 kph. The distribution of flight speeds within 25 km of the proposed wind area was significantly different from a random distribution (χ2 = 116.7, df = 61, P=0.000). The most frequently occurring flight speeds were between 31 and 40 kph (see Figure 4). We used flight speed to identify perched birds: birds with flight speeds of 0 through 5 kph were designated as perched birds, while birds moving at 6 kph or faster were considered to be flying (see Figure 5). 151 perching events were located within 25 km of the proposed wind turbines; 42 perching events were located within 20 km; 2 perching events occurred within 15 km; 2 perching events were located within 10 km; and 1 perching event was located within 5 km (see Figure 6). Within the 25 km study area, the distribution of flight headings was not significantly different from random, but detections that indicate a westerly orientation (44) were most frequent and detections with southerly orientation (20) were fewest.
7

Landscape Associations While visualization of the slope data indicated that slopes were fairly evenly distributed within 25 km of the proposed wind turbines (figure 7), the distribution of Condor detections over different landscape slope categories was significantly different than expected (χ2 = 279.8, df = 69, P=0.000). Within the 25 km study area, condor detections were most frequent over landscapes with 51 to 60 degree slopes, and detections were fewest over landscapes with slopes less than 20 degrees (see Figure 8). The landscape was evenly distributed across all aspect categories (see Figure 9), but the distribution of Condor detections over different landscape aspects within 25 km of the proposed wind turbines was significantly different than random (χ2 = 36.9, df = 7, P = 0.000). More detections (138) occurred over landscapes with northern and northwestern aspects than over any other aspect. The fewest detections (24) occurred over the eastern aspect (figure 10).
Home Ranges Four individual Condors were determined to have home ranges encompassing the proposed wind turbine locations using the Minimum Convex Polygon technique (see Figure 11).
IMPLICATIONS • The proximity of the Pinnacles National Monument Condor release facility to the
proposed wind turbines means that Condor activity is high throughout the Salinas Valley and across both slopes of the Coast Ranges and the Gabilan Mountains. This indicates a potential risk situation for Condors because the proposed wind turbines are within range of regular foraging flights for all members of the Pinnacles flock, as well as exploratory flights of some of the older Big Sur Condors who may be expanding their foraging range or looking for nesting locations. The proposed turbine locations also fall within the calculated home ranges of 4 Pinnacles Condors. However, the low overall detections indicate that the actual risk is low, since Condors do not appear to be using the area near the proposed wind turbines frequently.
• The low number of detections of perching events within 25 km of the proposed wind
turbines indicates that the area has not provided constant or frequent foraging or roosting opportunities. Thus, the risk posed to Condors perching or taking flight near the proposed turbines is low.
• Because the proposed wind turbines are located in suitable foraging habitat for
Condors, clearing carcasses within 5 km of the proposed wind turbines when detected could reduce the potential risk to Condors foraging in the area.
• The Condors represented in this report represent only a subset of the entire central
coast Condor population. This is because not all of the Condors have GPS transmitters. Most of the Pinnacles flock is GPS-tagged, but a much smaller
8

proportion of the Big Sur flock is tracked using GPS. The values enumerated in the report, therefore, are likely smaller than actuality.
• Given that the proposed project only calls for the installation of two turbines and
measures are taken to monitor and remove large carcasses in the area, the proposed wind turbines pose a minor risk to Condors in the area.
• Because this is a small, managed population of 35 individuals with a k-selected
reproductive strategy in addition to being listed as endangered, any risk associated with their population should be given careful consideration.
LITERATURE CITED Barrios, L. and A. Rodriguez. 2004. Behavioral and environmental correlates of soaring-
bird mortality at on-shore wind turbines. J. Appl. Ecol. 41:72-81 Drewitt, A.L. and R.H.W. Langston. 2006. Assessing the impacts of wind farms on
birds. Ibis 148: 29-42 Erikson, W. P., G. D. Johnson, M. D. Strickland, D. P. Young, JR., K. J. Sernka, and R.
E. Good. 2001. Avian collisions with wind turbines: a summary of existing studies and comparisons to other sources of avian collision mortality in the United States. National Wind Coordinating Committee, Washington, D.C., USA.
Hoover, S.L. and M.L. Morrison. 2005. Behavior of Red-tailed Hawks in a wind turbine
environment. J. Wildl. Manag. 69(1): 150-159 Kiff, L. F., R. I. Mesta, and M. P. Wallace. 1996. California Condor Recovery Plan. US
Fish and Wildlife Service, Portland, Oregon. Microwave Telemetry, Inc. 2006. Argos/GPS PTT-100 Field Manual. Columbia, MD. Smallwood, K. S., and L. Neher. 2004. Repowering the APWRA: Forecasting and
minimizing avian mortality without significant loss of power generation. California Energy Commission, PIER Energy Related Environmental Research. CEC-500-2005-005.
Smallwood, K.S. & Thelander, C.G. 2004. Developing methods to reduce bird mortality
in the Altamont Pass Wind Turbines. Final report by to the California Energy Commission. Public Interest Energy Research-Environmental Area, Contract no. 500–01–019. California: BioResource Consultants.
Snyder, N. F. R., and N. J. Schmitt. 2002. California Condor (Gymnogyps californianus).
In The Birds of North America, No. 610 (A. Poole and F. Gill, eds.). The Birds of North America, Inc., Philadelphia, PA.
9

Zar, J.H. 1999. Biostatistical Analysis. Fourth Edition. Prentice Hall, NJ: Upper Saddle
River. P. 488
PERSONAL COMMUNICATIONS Burnett, J. May 1, 2007. Senior Wildlife Biologist, Ventana Wildlife Society. 19045
Portola Dr., Ste F-1, Salinas, CA 93908, [email protected]
10

Figure 1. Proposed wind turbines near Gonzales in Monterey County, CA, and the project study area, defined by a 25 km radius around the proposed turbines.
11

Figure 2. Proximity of Condor detections to the proposed wind turbines, Monterey County, CA, 2003-2007
12

Figure 3. Proximity of in-flight Condor detections to the proposed wind turbines, Monterey County, CA, 2003-2007
13

Figure 4. Frequency distribution of flight speeds of Condors detected within 25 km of the proposed wind turbines, Monterey County, CA, 2003-2007
0
10
20
30
40
50
60
70
80
6 -10 11 -20 21-30 31-40 41-50 51-60 61-70 71-80 81-90
14
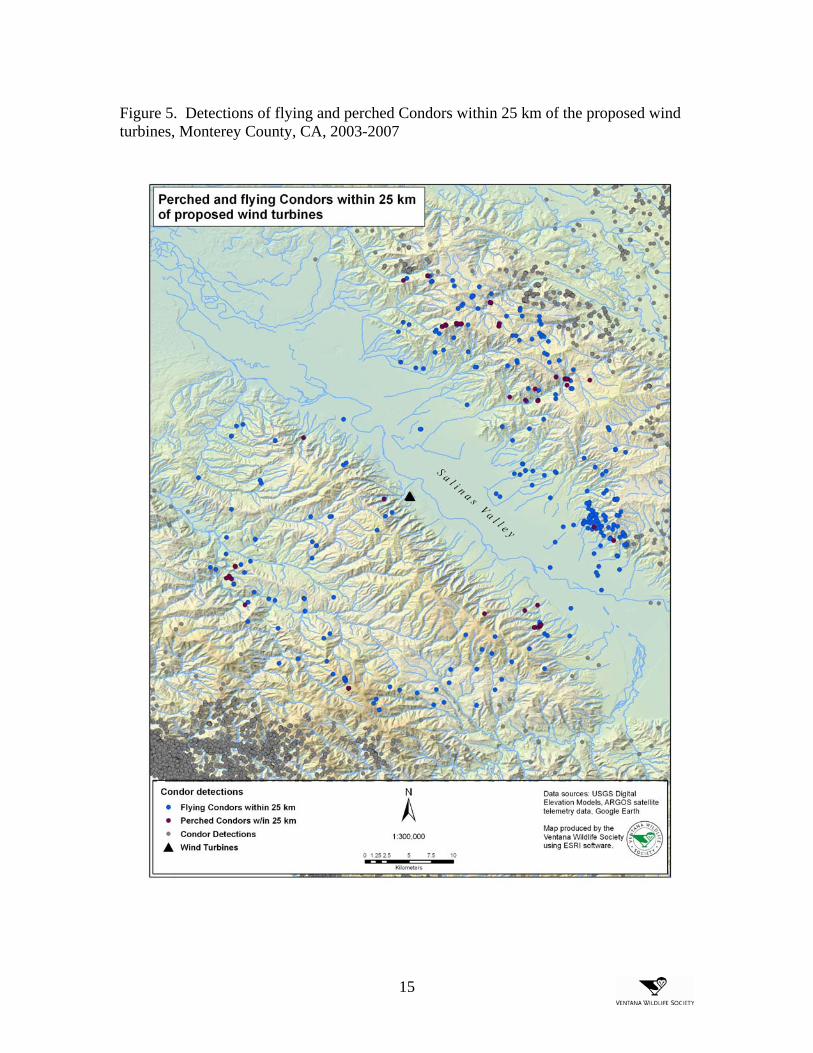
Figure 5. Detections of flying and perched Condors within 25 km of the proposed wind turbines, Monterey County, CA, 2003-2007
15

Figure 6. Proximity of perched Condor detections to the proposed wind turbines, Monterey County, CA, 2003-2007
16

Figure 7. Landscape slopes associated with Condor detections within 25 km of the proposed wind turbines, Monterey County, CA, 2003-2007
17

Figure 8. Distribution of landscape slope categories associated with Condor detections within 25 km of the proposed wind turbines, Monterey County, CA, 2003-2007
0
20
40
60
80
100
120
140
0-10 11-20 21-30 31-40 41-50 51-60 61-70
18

Figure 9. Landscape aspects associated with Condor detections within 25 km of the proposed wind turbines, Monterey County, CA, 2003-2007
19

Figure 10. Distribution of landscape aspects associated with Condor detections within 25 km of the proposed wind turbines, Monterey County, CA, 2003-2007
0
10
20
30
40
50
60
70
80
E N NE NW S SE SW W
20

Figure 11. Condor Minimum Convex Polygon home ranges that encompass the proposed wind turbine locations, Monterey, CA
21